Carbonaceous Materials Investigated by Small-Angle X-ray and Neutron Scattering


1
Department Electrochemical Energy Storage, Helmholtz-Zentrum für Materialien und Energie GmbH, Hahn-Meitner-Platz 1, 14109 Berlin, Germany
2
Department Chemistry and Biochemistry, Freie Universität Berlin, Takustrasse 3, 14195 Berlin, Germany
*
Author to whom correspondence should be addressed.
C 2020, 6(4), 82; https://0-doi-org.brum.beds.ac.uk/10.3390/c6040082
Submission received: 9 November 2020
/
Revised: 8 December 2020
/
Accepted: 16 December 2020
/
Published: 19 December 2020
(This article belongs to the Special Issue Carbide Derived Carbons)
Abstract
:Carbonaceous nanomaterials have become important materials with widespread applications in battery systems and supercapacitors. The application of these materials requires precise knowledge of their nanostructure. In particular, the porosity of the materials together with the shape of the pores and the total internal surface must be known accurately. Small-angle X-ray scattering (SAXS) and small-angle neutron scattering (SANS) present the methods of choice for this purpose. Here we review our recent investigations using SAXS and SANS. We first describe the theoretical basis of the analysis of carbonaceous material by small-angle scattering. The evaluation of the small-angle data relies on the powerful concept of the chord length distribution (CLD) which we explain in detail. As an example of such an evaluation, we use recent analysis by SAXS of carbide-derived carbons. Moreover, we present our SAXS analysis on commercially produced activated carbons (ACN, RP-20) and provide a comparison with small-angle neutron scattering data. This comparison demonstrates the wealth of additional information that would not be obtained by the application of either method alone. SANS allows us to change the contrast, and we summarize the main results using different contrast matching agents. The pores of the carbon nanomaterials can be filled gradually by deuterated p-xylene, which leads to a precise analysis of the pore size distribution. The X-ray scattering length density of carbon can be matched by the scattering length density of sulfur, which allows us to see the gradual filling of the nanopores by sulfur in a melt-impregnation procedure. This process is important for the application of carbonaceous materials as cathodes in lithium/sulfur batteries. All studies summarized in this review underscore the great power and precision with which carbon nanomaterials can be analyzed by SAXS and SANS.
1. Introduction
Electrodes of supercapacitors [1,2,3,4,5,6,7,8,9] and batteries [10,11,12,13,14,15,16,17] are often made of partially ordered carbon powders. For instance, carbide-derived carbons (CDC) are central for the design of supercapacitors [3,6,18,19,20,21,22] because the pore size and specific surface area can be adjusted by proper choice of the chlorination temperature [6,23,24,25,26]. The performance of the supercapacitors is predominantly determined by the properties of the carbon [27,28,29] and structural features, e.g., the specific surface area, pore size, or pore size distribution have been discussed as determining parameters [2,6,22,30,31,32,33]. Most studies of carbon materials used for energy applications have relied on differential pore size distributions obtained from gas sorption isotherms [6,23,24,32,34,35,36,37,38]. Sorption isotherms can give precise information on pores with a size larger than 1 nm, but lead to much too large specific surface areas for ultra-microporous systems [39,40,41,42].
Small angle X-ray scattering (SAXS) [43,44,45,46,47,48,49,50,51,52,53,54,55,56] and small-angle neutron scattering (SANS) [23,43,57,58] are the methods of choice for the characterization of nanostructured carbons. In particular, SAXS has been applied to carbon materials since the 1940s and 1950s [59,60,61]. Ruland and Smarsly and coworkers [62], and more recently Smarsly and coworkers [63,64,65,66], have worked intensively on the characterization of nanocarbons by wide- and small-angle X-ray scattering. These investigations have demonstrated that carbonaceous materials derived from various sources present overall disordered microporous systems consisting of amorphous regions and regions, in which graphene sheets of various size and mutual registry have been formed (cf., the review by Faber et al. [63]). The overall picture of the nanostructures [67] is in qualitative accord with recent studies employing high-resolution transmission electron microscopy (HR-TEM) [68,69,70,71]. However, reviewing the current literature, it becomes clear that the great power of the analysis by small-angle scattering has hardly been exploited so far.
Here we wish to review work done by SAXS [43,44,45,46,47,48,49,50,51,52,53,54,55,56,72,73,74,75] and SANS [23,57,58,74,76,77,78] on the nanostructure of carbon materials. To date, there has been no general consensus on the way to evaluate the scattering curves I(q), (q: magnitude of scattering vector) of partially ordered carbon materials as obtained by SAXS and SANS. A central problem here is the fact classical theory predicts that porous systems characterized by sharp interfaces should decay with q−4 (Porod’s law; see [79,80]). However, the scattering intensity measured for numerous carbonaceous materials [46,50,62,73,74,81] exhibits a much smaller exponent around −3 than q−4. This finding has led to the modeling of the structure of such materials in terms of a fractal [45,47,58]. Many years ago, however, Ruland [82] presented good arguments against this interpretation. This note [82] does not seem to have attracted much attention since.
The current ways of evaluating SAXS-data comprise the modeling of pores in these materials as polydisperse spheres [83,84] or slits [85,86]. For many materials, however, a smooth spherical shape of the pores can definitely be ruled out [73] and a model-free approach is clearly superior to an approach that assumes a given shape of the pores. Most investigations [4,23,48,55,87] of carbon materials using SAXS or SANS have followed Kalliat et al. [88] in interpreting the scattering intensity in terms of the correlation function of Debye, Anderson, and Brumberger [89]. This, however, is in clear contradiction to the established microstructure of most carbon nanomaterials that consist of graphene-like structures with a typical length scale of ca. 1 nm [63,64,67,69,70]. To the authors’ best knowledge, Schiller and Méring in 1967 seem to have been the first to show that the measured intensity I(q) has an additional term that scales with q−2 [90]. They demonstrated that this contribution to I(q) is caused by fluctuations in layer spacing and size of the imperfectly stacked graphene layers [67]. Perret and Ruland used this idea to develop a correct evaluation of the SAXS intensities obtained for non-graphitizable and glassy carbons by SAXS [46,50,82,91]. Later, Smarsly et al. improved this analysis of SAXS-data [52,92] by the evaluation of the data in terms of the chord length distribution (CLD) [93].
Previously, we have applied this approach to the analysis of microporous carbon material used for lithium-sulfur batteries [72,73]. SAXS data of such a material were shown to a give full characterization that goes far beyond porosity and internal surface. Later, we analyzed the impregnation of carbonaceous materials by sulfur [72]. Another aspect that can be tackled is the binder influence on carbonaceous surface features when going from carbon powder to electrode [74]. This aspect has been raised in conjunction with electrodes for energy conversion and storage applications [36,74]. Recently, we looked into the structure formation during the synthesis of CDC, where we could follow the structural parameters as a function of the chlorination temperature [75].
Here we review our recent investigations as follows. We first describe the theoretical basis of the analysis of carbonaceous material by small-angle scattering. As an example of such an evaluation, we use recent SAXS data obtained on CDC [75]. Further, we extend our SAXS analysis discussion to different case studies based on commercially produced activated carbons (CAN [73], RP-20 [74]) and provide the comparison with SANS data. We briefly summarize the main results regarding the changes in scattering intensities caused using the different contrast matching agents, e.g., by gradually filling of the pores by deuterated p-xylene [77], deuterated toluene [73], or impregnating the carbon with sulfur via melting procedure [72]. The purpose of the present review is to demonstrate the enormous power of the small-angle techniques for structural research if the analysis is based on the CLD approach. It should be noted that the present approach is set up to describe nonparticulate systems without long-range order.
2. Analysis of Carbons by Small-Angle Scattering: Evaluation of the Data
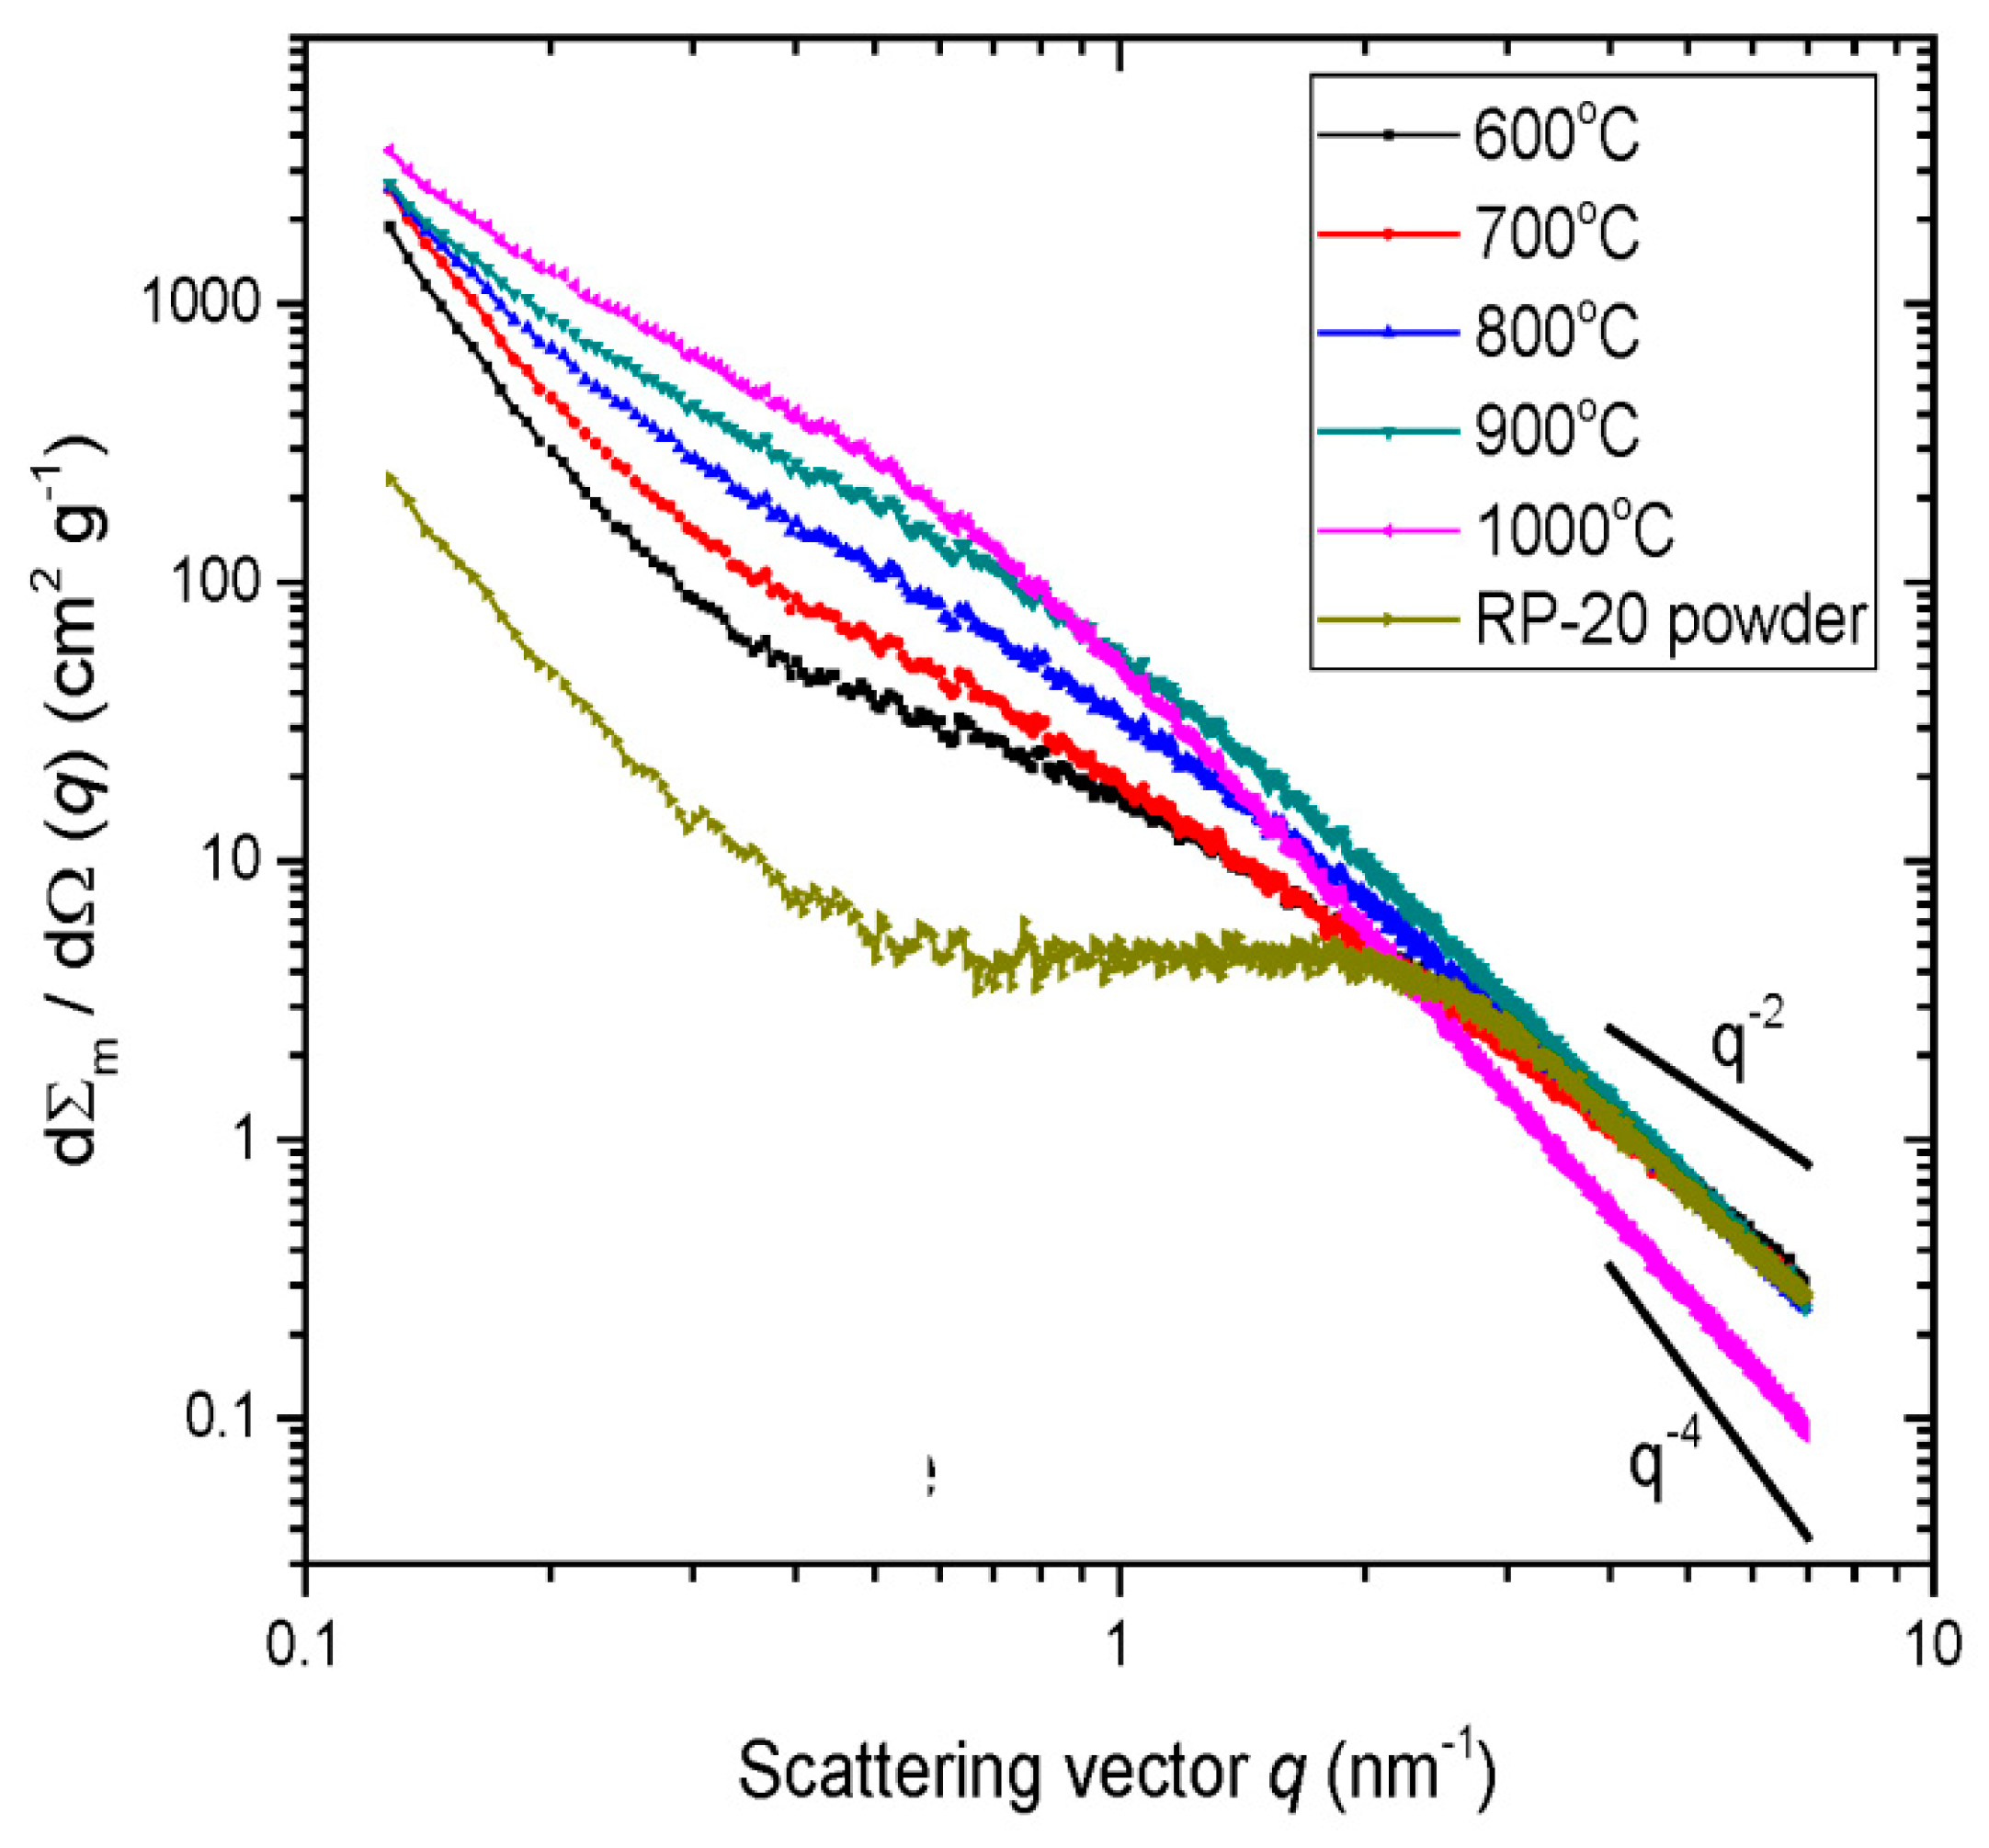
Figure 1 displays the SAXS intensities obtained from CDC synthesized at different chlorination temperatures. There are three regions on the scattering curves that are comparable to previous studies on CDC [4,48]: (i) At a low q (q < 0.4 nm−1) upturn due to macropores; (ii) an intermediate area with a shoulder (0.4 < q < 3 nm−1); (iii) and a final slope for q > 3 nm−1 that contains information on the microporous structure below 2 nm and the scattering intensity due to the fluctuation contributions discussed in the introduction [50,52,73,90].
In the following, we explain the analysis of the SAXS data introduced by Ruland and coworkers [46,50,82,91] and applied recently to microporous carbon materials [73,74,75,78]. In many cases, powders or fibers are analyzed that do not fill the entire scattering volume. Therefore, the macroscopic differential scattering cross-section is normalized to the mass via division by the apparent filling density of the powder, giving units of cm2·g−1
where is the magnitude of the scattering vector with the wavelength λ and the scattering angle 2ϴ. is the macroscopic cross-section in units of cm−1. Evidently, this normalization allows us to obtain scattering cross-sections that are necessary for all subsequent quantitative evaluations.
As explained in the introduction, the mass normalized macroscopic scattering cross-section of porous carbon is the superposition of two different scattering contributions [50,90]:
where is the scattering of a two-phase system with pores in a homogeneous carbon matrix, whereas is the fluctuation contribution from the lateral imperfection and finite size of the carbon layers as introduced by Schiller, Méring, and Ruland [82,91]. Both scattering contributions are statistically independent and their scattering intensities superimpose [50]. The three dimensional fluctuation contribution can be approximated by [73]:
where defines the scattering contribution of the carbon phase and provides a measure of the lateral dimensions of the graphene sheets embedded in the material. In order to determine the fluctuation term, a modified Porod’s law [46,50,52,73,90] is employed for the large q-values by combining Equations (2) and (3):
where is the Porod constant and L is the structural length scale. The inner surface area is associated via as follows:
where is the scattering contrast of carbon versus vacuum calculated from the skeletal density [73].
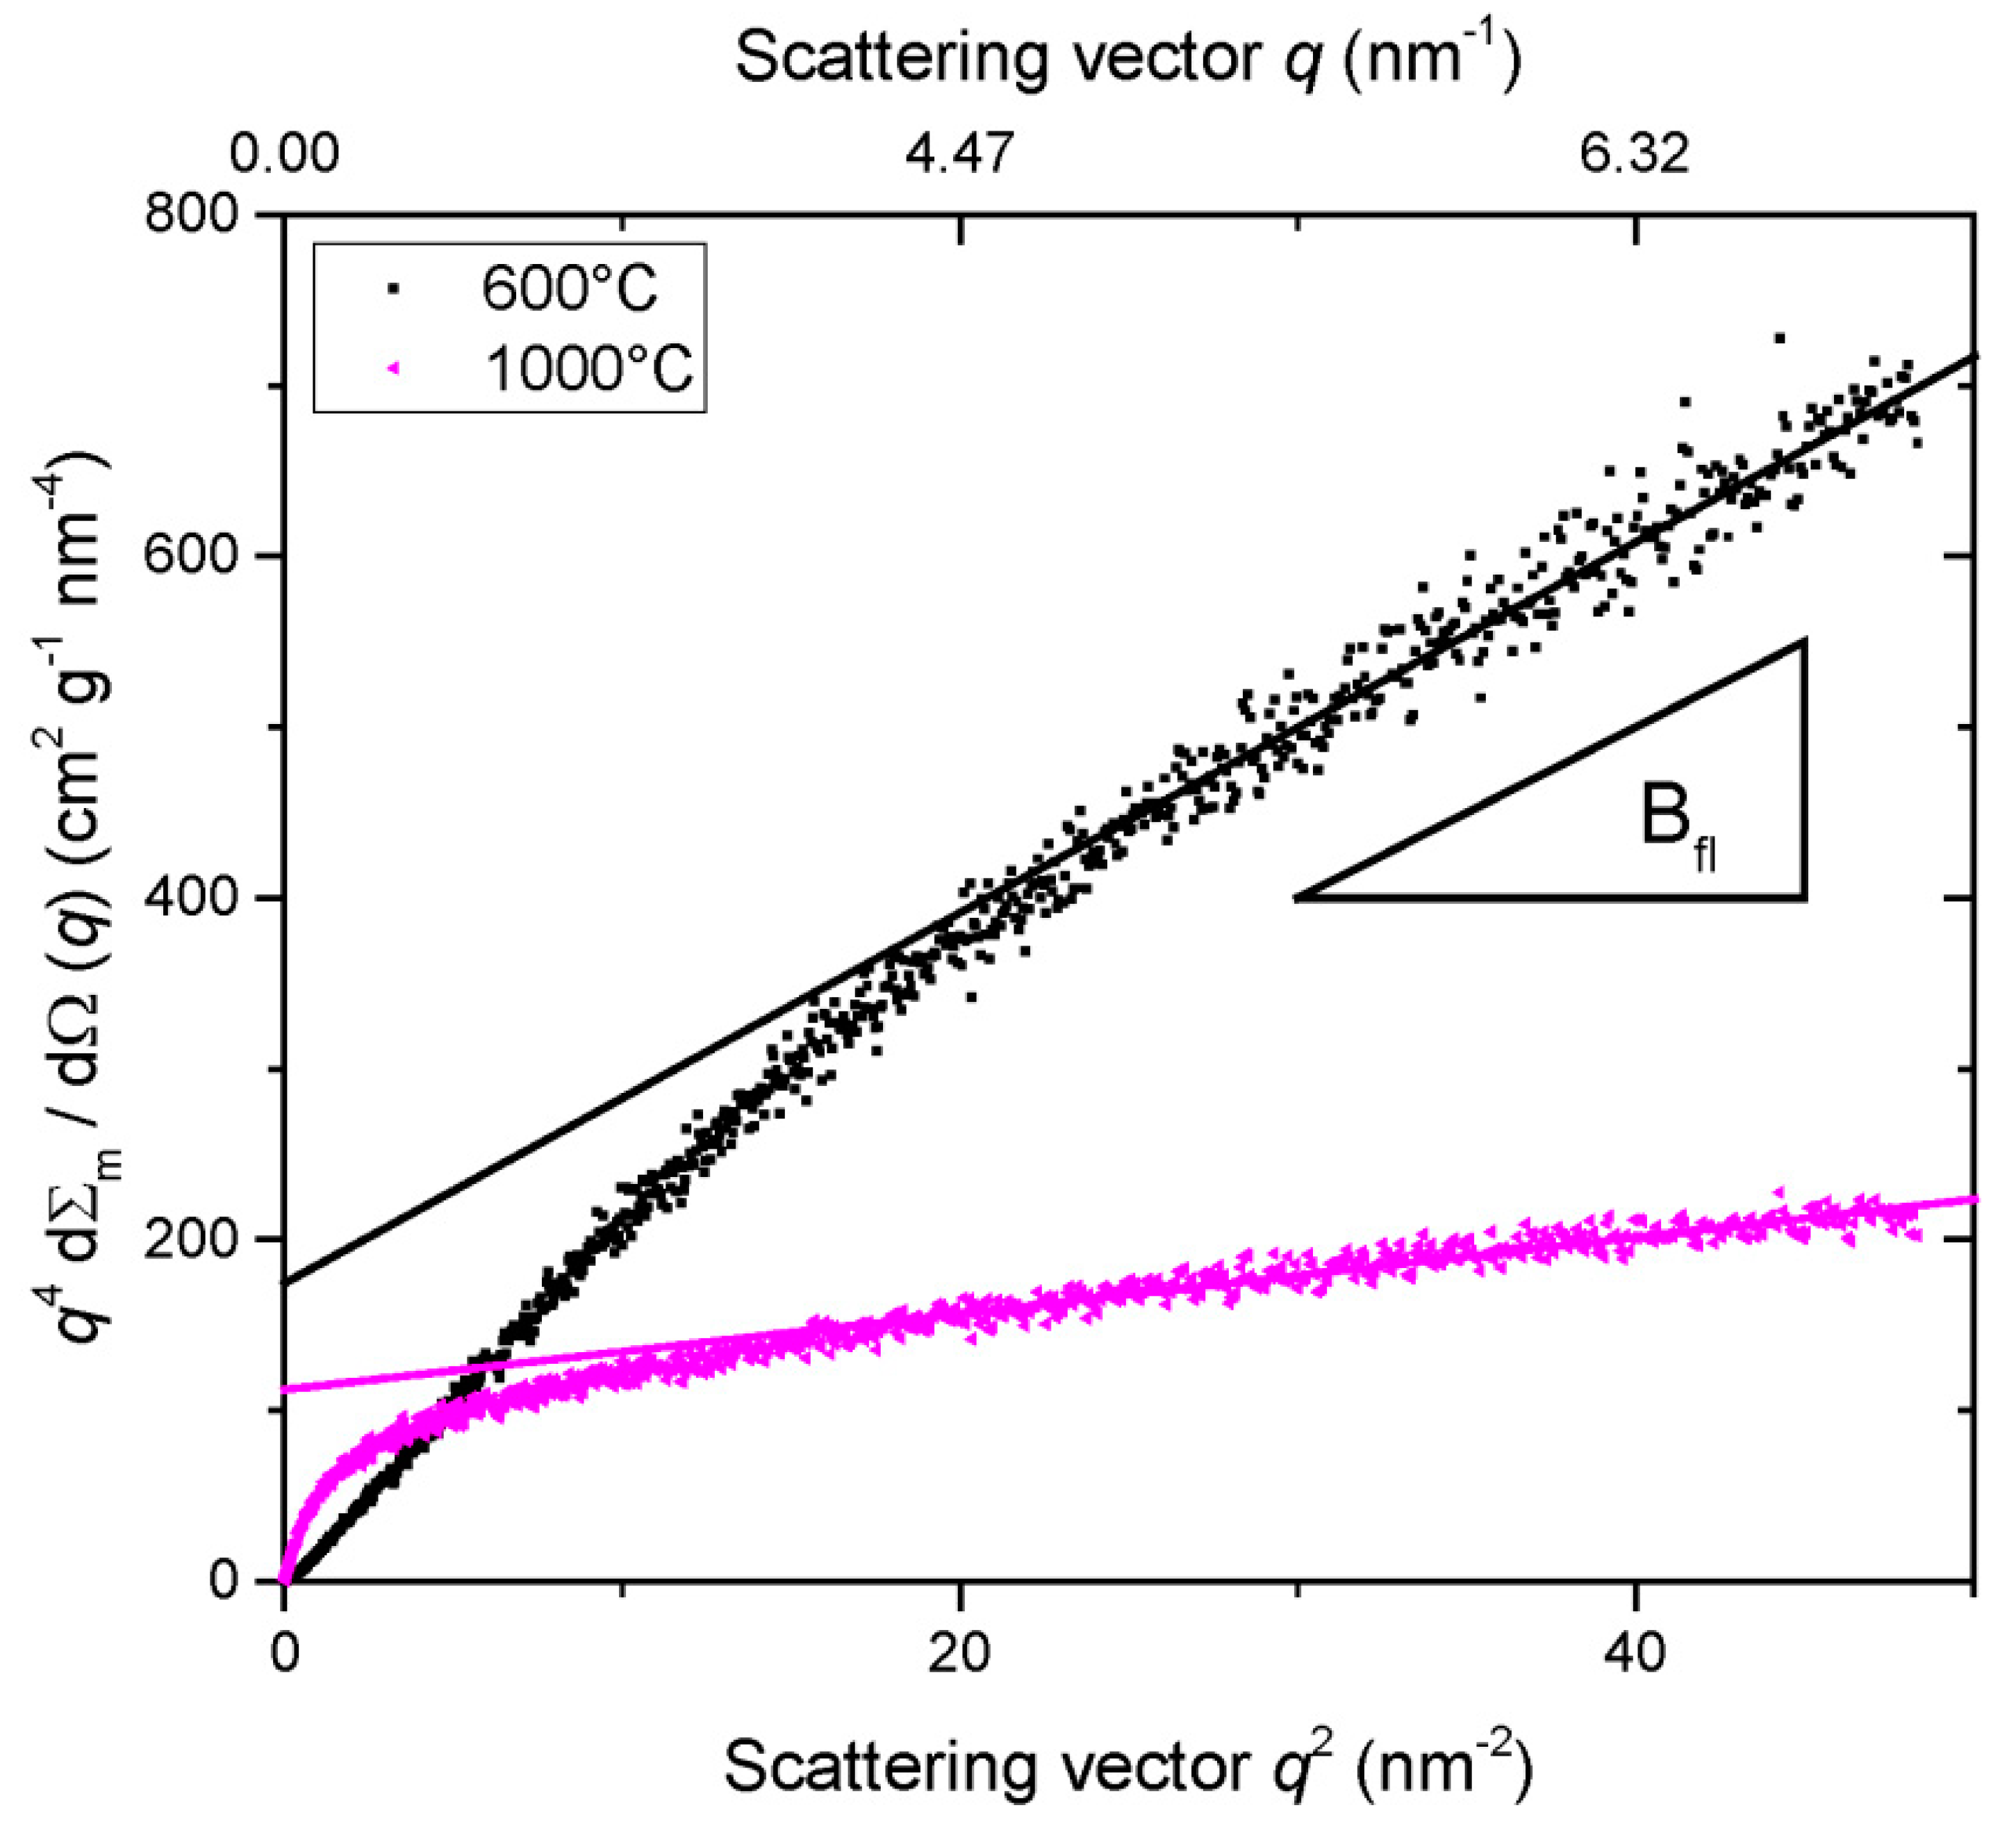
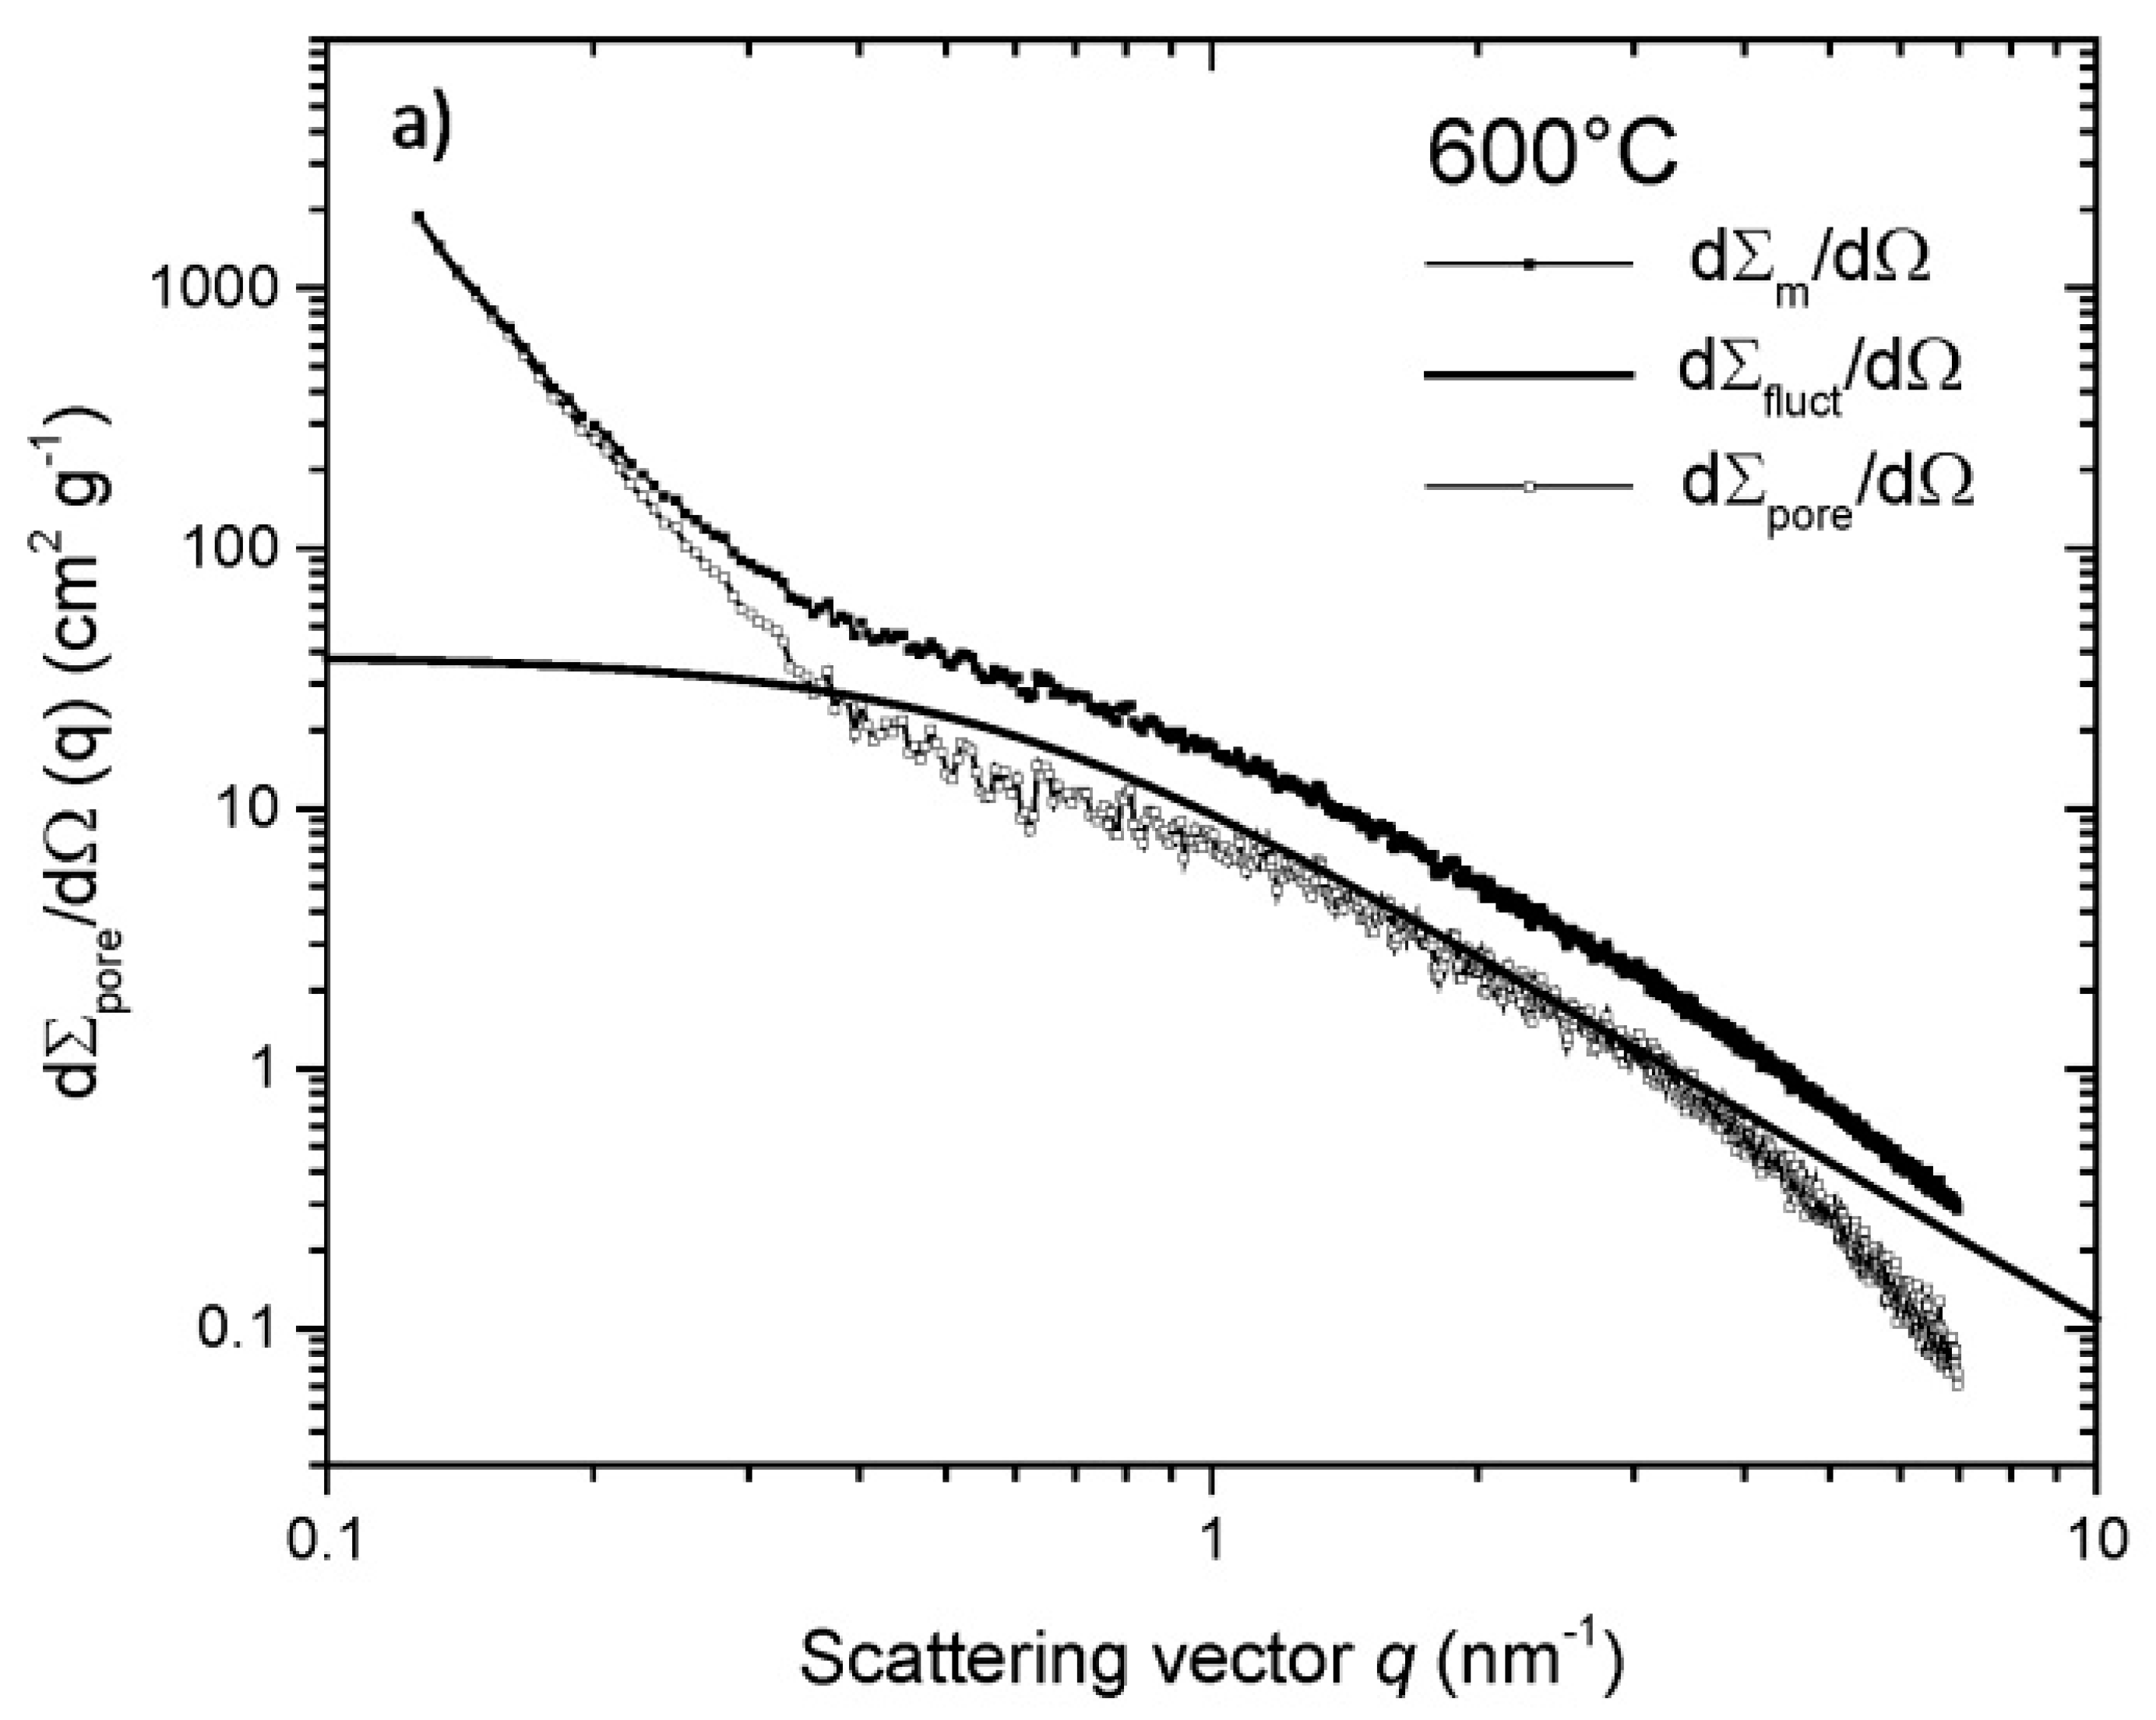
Figure 2 presents a modified Porod plots according to Equation (4) for CDC obtained at different chlorination temperature/s. The plots of are linear and allow us to determine the fluctuation contribution accurately [62,82,90,93]. Following Smarsly et al. [52], this term can be removed by subtracting from the scattering curves if the SAXS intensity is dominated by pore scattering. As demonstrated in Figure 2 for two CDC powders, the fluctuation-induced scattering presents a more significant term. In this case lateral correlation length must be estimated as discussed in detail by the authors of [73,74]. For a given , the length parameter is chosen so that the contribution of the fluctuations Equation (4) remains below the scattering curve (see solid lines in Figure 3). One must ensure, however, that, for sufficiently high scattering angles, the expression Equation (4) leads to the modified Porod fit.
After removing the scattering contribution of lateral disorder, as shown in Figure 2 and Figure 3, Figure 4 displays the SAXS scattering curves, which show that the asymptotic q−4 behavior and the classical theory of small-angle scattering may be applied again.
These corrected intensities may now serve for the calculation of the chord length distribution (CLD) by the approach of Smarsly et al. [52]. Figure 5 displays the basic principle of this analysis.
It should be emphasized that this analysis makes no assumptions on the shape and structure of the pores [72,73,74,76,78]. The CLD is the “well-behaved” part of the second derivative of the autocorrelation function :
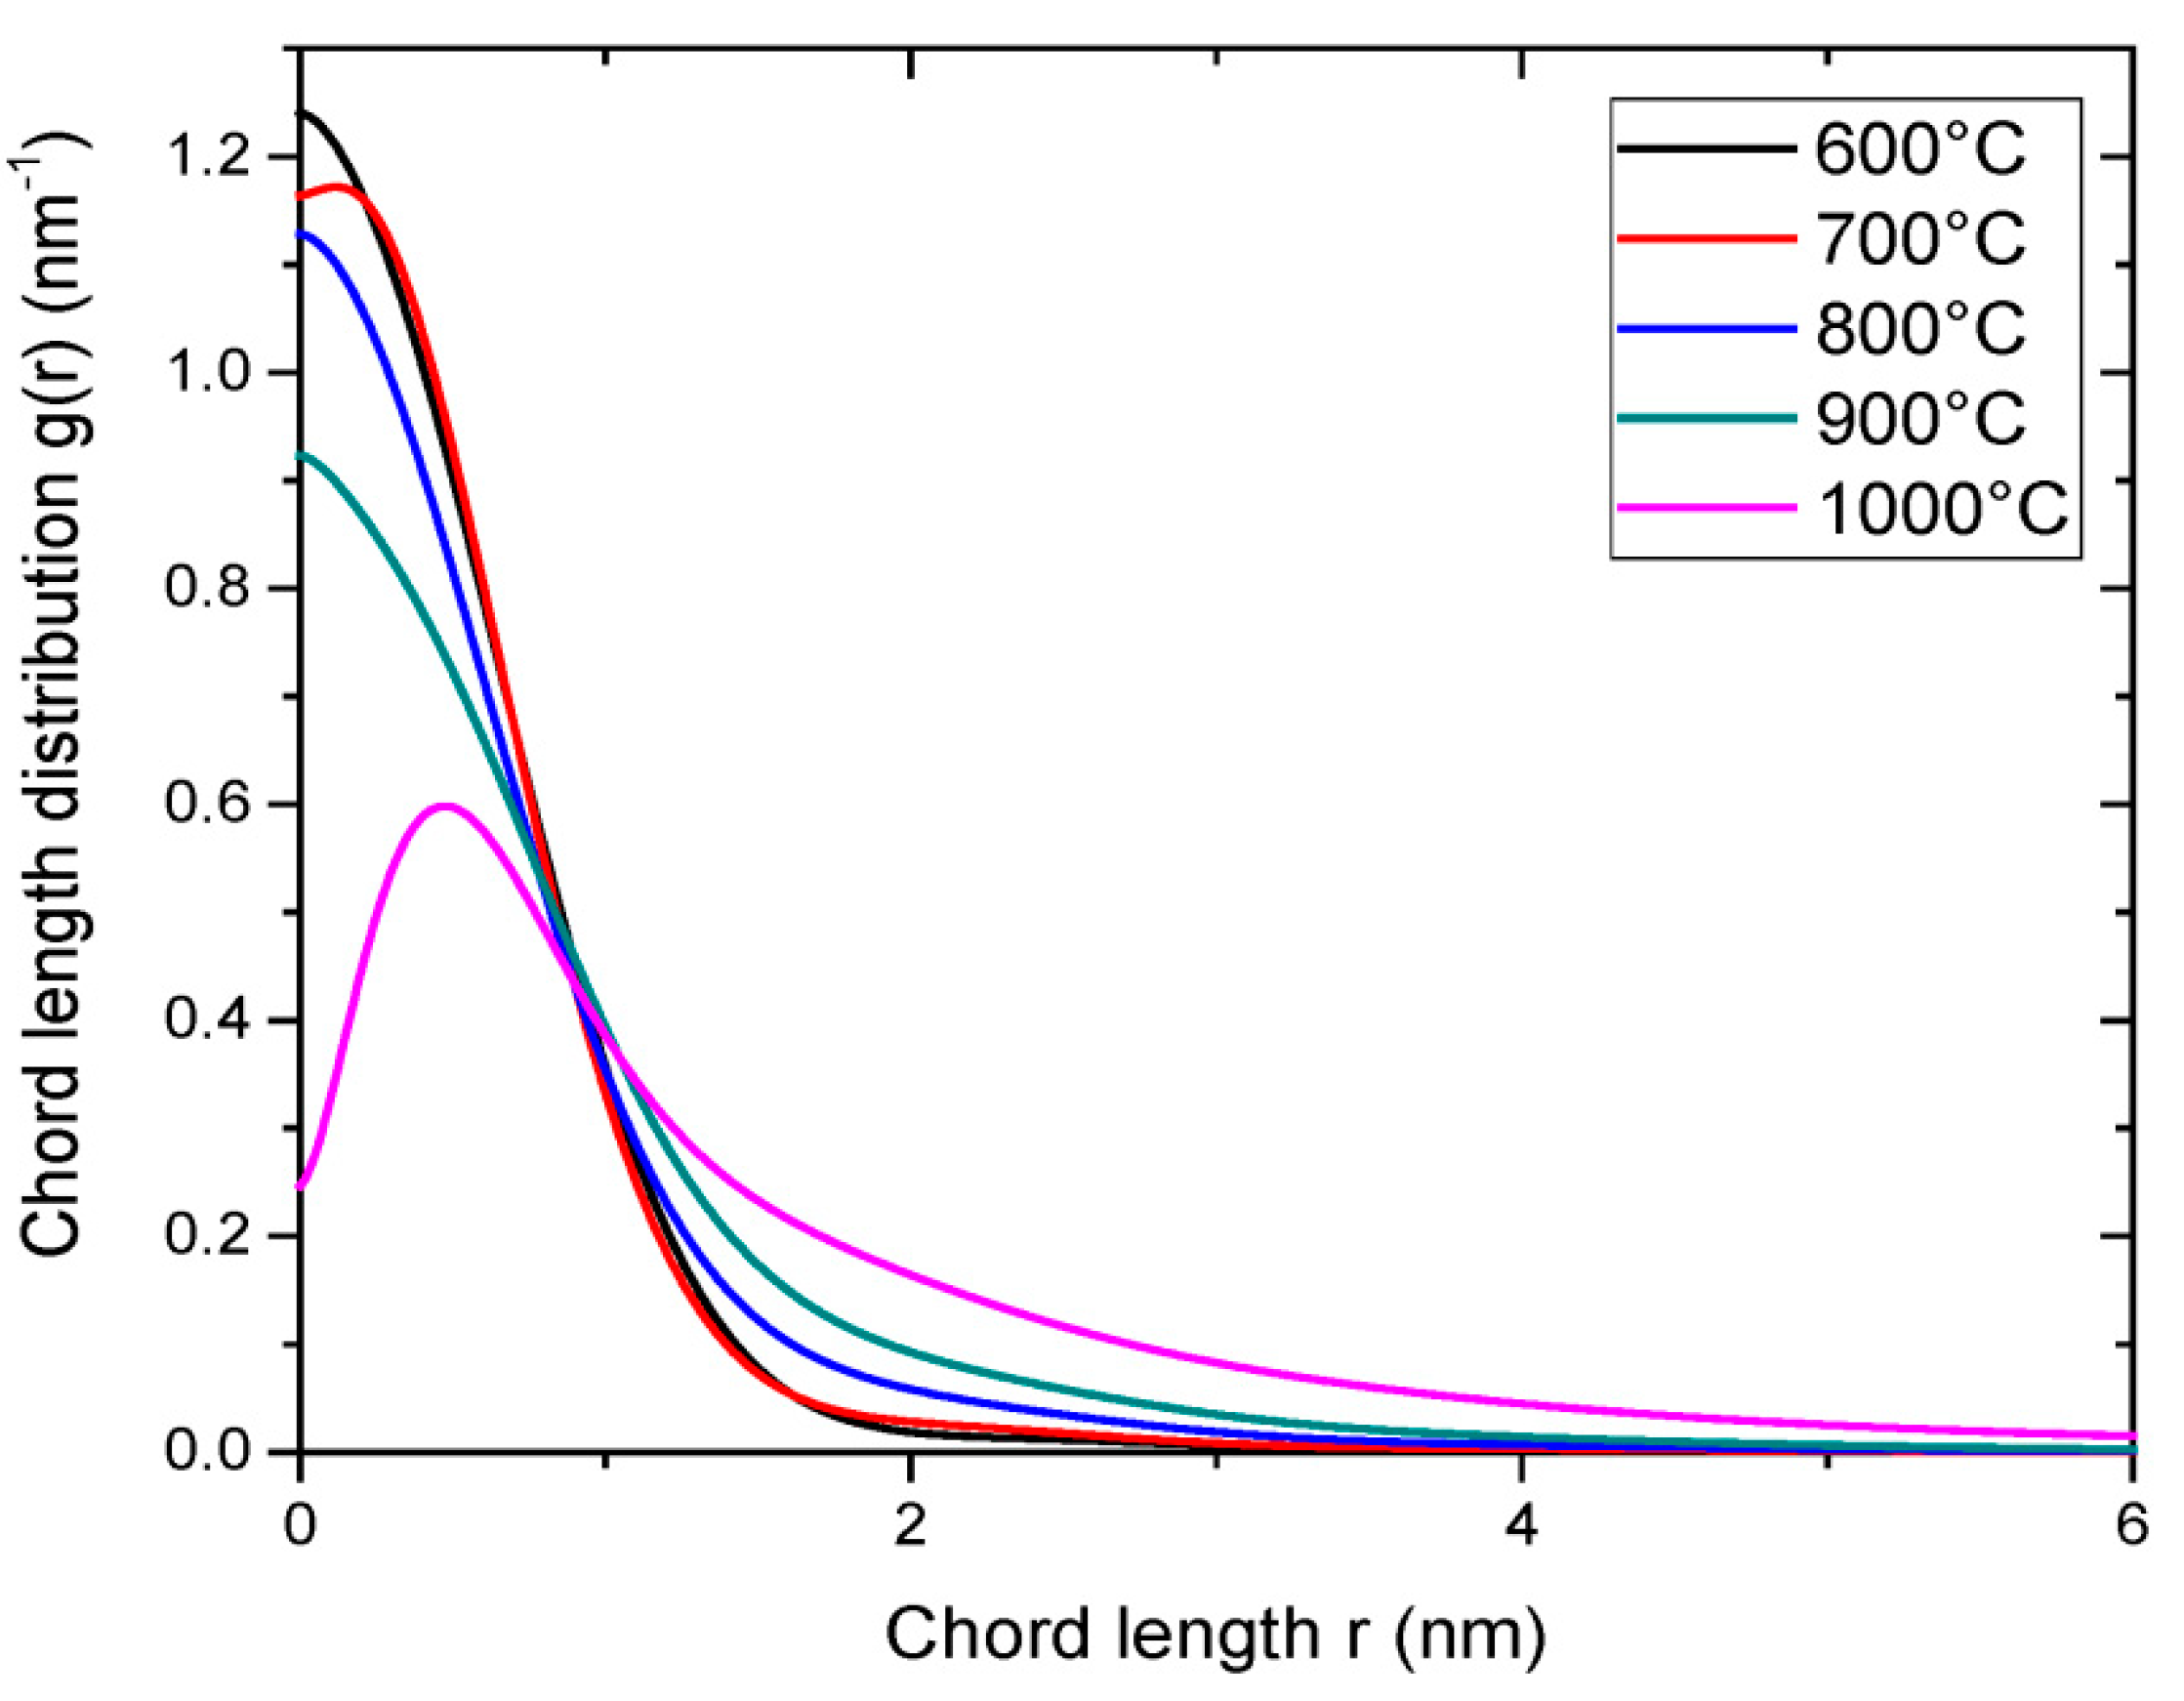
where is the number-average chord length of the system comprising both chords that go through pores and chords that go through solid material (Figure 5). The results of the calculation of the chord length distribution (CLD) by the approach of Smarsly et al. [52] are presented as solid lines in Figure 6.
In the case of higher-ordered porous materials, chords may go through the pores or the solid twice, which leads to side maxima and zeros in (Figure 7). The interpretation of measured for such materials is then a difficult task [92]. However, for the disordered carbon materials under consideration here, these higher order terms cancel out each other, and can be approximated by a sum of the chord distributions of the pores and the solid material [93]. In general, the CLD at r = 0 gives valuable information on the angularity, i.e., the presence of edges of the system (see Figure 5). A finite value of degree of angularity indicates the presence of a significant number of sharp edges at the phase boundary [92,93].
The number-average chord length is the first moment of the CLD [52]:
The number-average chord length can be calculated independently from the scattering data as follows:
where is the invariant of the system expressed per unit mass, is the porosity, and and are the mean chord length of the pore and solid, respectively. The comparison of the number-average chord length , calculated by Equation (7) with the value calculated by Equation (8), provides a validity check of the experimental data and CLD theory (see Table 1). The mean chord length of the pores and the solid are obtained from the and the porosity by:
The invariant is the integral of the area of the Kratky curve (see Figure 6):
and is linked to the porosity by
where stands for the overall density of the carbon particles/grains. Due to the empty pores, the particle density is linked to the skeletal density by . The skeletal density determines the difference in scattering length density between the carbon matrix and the pores as . Here NA is Avogadro’s number, re the classical electron radius, Z the number of electrons per carbon atom, and AC is the atomic weight of carbon. Thus, combining this with Equation (11), the porosity is given by [73]:
and represents information from the SAXS data without any model assumptions (see Table 1).
The weight-averaged chord length follows as:
Perret and Ruland demonstrated that a degree of the disorder of the carbon can be obtained by the relation [50]:
where is the distance of two carbon layers in the graphite crystal structure and corresponds to [60,90,94].
Figure 7 shows that all CLDs extracted from the scattering data of the CDC exhibited only a single peak. This is a clear indication that the chords leading to the shown in Figure 7 penetrated through the pores or walls only once, and that ordered structures characterized by chords that penetrate pores or walls twice did not contribute to significantly. This finding, in turn, demonstrates that all CDC present disordered materials with decorrelated pores. Hence, the analysis itself demonstrates its applicability to the present set of materials.
3. Discussion of the Structural Features and Calculated Characteristics of Different Carbonaceous Materials
Table 1 summarizes all data derived from the SAXS analysis of CDCs. Here we display the data derived from our previous work for the following systems: CAN [73], RP-20 [74], and CDC [75]. As discussed above, the scattering contribution caused by the fluctuations is embodied in the parameter [82,91] and must be removed first. Table 1 shows that the fluctuation contribution of the carbon layers in CDC [75] significantly decreased with the increasing chlorination temperature used for the synthesis of the CDCs. A similar trend has been observed when progressively filling of the carbon matrix with sulfur [72] or in situ sorption combined with SAS experiments [76,77,95].
Contrary to the classical sorption analysis, the CLD-based SAS techniques do not require any prior assumption or knowledge of the pore morphology. They are applicable for any distribution of pore sizes as well as pore shapes [77]. Moreover, as shown in the above discussion, the porosity followed directly from the SAXS analysis without any prerequisite. Moreover, the precise inner surface area (Equation (5)) from the intercept of modified Porod plot (Figure 2) was directly obtained. For the CDC materials studied by the authors of [75], a gradual increase in as well as in porosity () (Equation (12)) was seen with increasing the chlorination temperature (Table 1). Thus, the CDC synthesized at 1000 °C had a very low surface area, with 47% porosity, probably caused by the collapse of micropores located in the mesopore walls. Thereafter, a partial graphitization of the carbon took place [67].
Figure 5 serves for a visualization of all results obtained by the present analysis. The parameters and present direct measures for the average pore size and the average thickness of the walls between the pores, respectively. Table 1 demonstrates that was much smaller than for the two lowermost temperatures, as expected. Therefore, , displayed in Figure 6, will be dominated by the contributions of the pores. The finite angularity demonstrates that the pores were more likely a slit-like shape with sharp edges as sketched in the Figure 5 (see below). In both cases, the number-average chord length (Equations (7) and (8)) was approximately 0.6 nm, that is, an ultra-microporous system according to IUPAC classification [42]. The average pore size increased with higher chlorination temperature, which was obvious from the continuous increase of (see Table 1). At the same time, decreased such that the average size of the pores and pore walls assumed a comparable size. Contrary to continuous increase of the with the increasing temperature of the synthesis, the porosity did not exceed 63% at 900 °C and it diminished to 47% at the highest temperature studied (see Table 1). Carbonaceous powders synthesized at 900 °C and 1000 °C were therefore dominated by mesopores. There was a loss of microporosity because of the collapse of the micropores, which was concomitant to a growth of the size of carbon layers embodied in the parameter . This parameter assumed a maximum value of 3.2 nm at the highest chlorination temperature (Table 1).
Chords near = 0 always refer to features near the surface of the pores and can be interpreted directly. Up to chlorination temperature of 900 °C was of appreciable magnitude. This indicates the presence of sharp edges and rules out spherical pores or long cylindrical pores (see Figure 5) [77]. It is fully compatible with the prior conclusion that the pores assumed a slit-like shape [73,75]. At the highest chlorination temperature, however, decreased considerably [75]. For round surfaces, this parameter will be zero, but will assume a finite value for pores with edges [77]. Table 1 demonstrates that this structural transition is related to a marked increase of the thickness of the pore walls as indicated by the increase of and a loss of ultramicroporosity as seen from Figure 6. Hence, we see a transition from an ultra-to a super-microporous material.
The Ruland length and the degree of disorder give valuable and quantitative information on the increasing degree of graphitization with increasing chlorination temperature. The latter parameter decreased by approximately one order of magnitude when the chlorination temperature was raised from 600 °C to 1000 °C. The length parameter increased markedly for the two smallest temperatures and exceeded 20 nm for temperatures of 800 °C and more. This trend is the same as observed by Faber et al. for a series of silicon carbide derived carbons by wide-angle X-ray scattering [65]. The parameter La, giving the extent of the graphene sheets derived therefrom, is generally smaller [65] than the parameter derived here from SAXS, and La seems to attain the magnitude only for similar systems at much higher temperatures (cf., Table 4 of [64]). For both commercially produced carbon materials, ACN [73] and RP-20 [74], a low value was observed (Table 1). It should be kept in mind, however, that presents an estimate and upper bound of the graphene sheets only, whereas La is derived directly from wide-angle scattering [63,65]. The structural reorganization upon ongoing graphitization is also visible in recent TEM studies [69,71] showing structural units of the order of a few nanometers. It has been demonstrated that La in both graphitizing and non-graphitizing carbons have values around 1 nm, indicating highly disordered structures with relatively little graphitization [67].
The shape of the pores could also be derived from the ratio ratio, which points to highly curved and tortuous inner surfaces. The ratio of 8.8 was found to be highest for CDC synthesized at 700 °C, indicating a broad distribution of chord length due to an asymmetric shape of the pores.
The significant decrease of degree of disorder was observed upon further chlorination treatment. According to model proposed by Franklin [60], the carbon graphitization ordering results from the movement of whole layers or large fragments rather than individual atoms. Thus, at high temperatures, graphene sheets are highly packed and closely folded together in order to reduce surface energy [67].
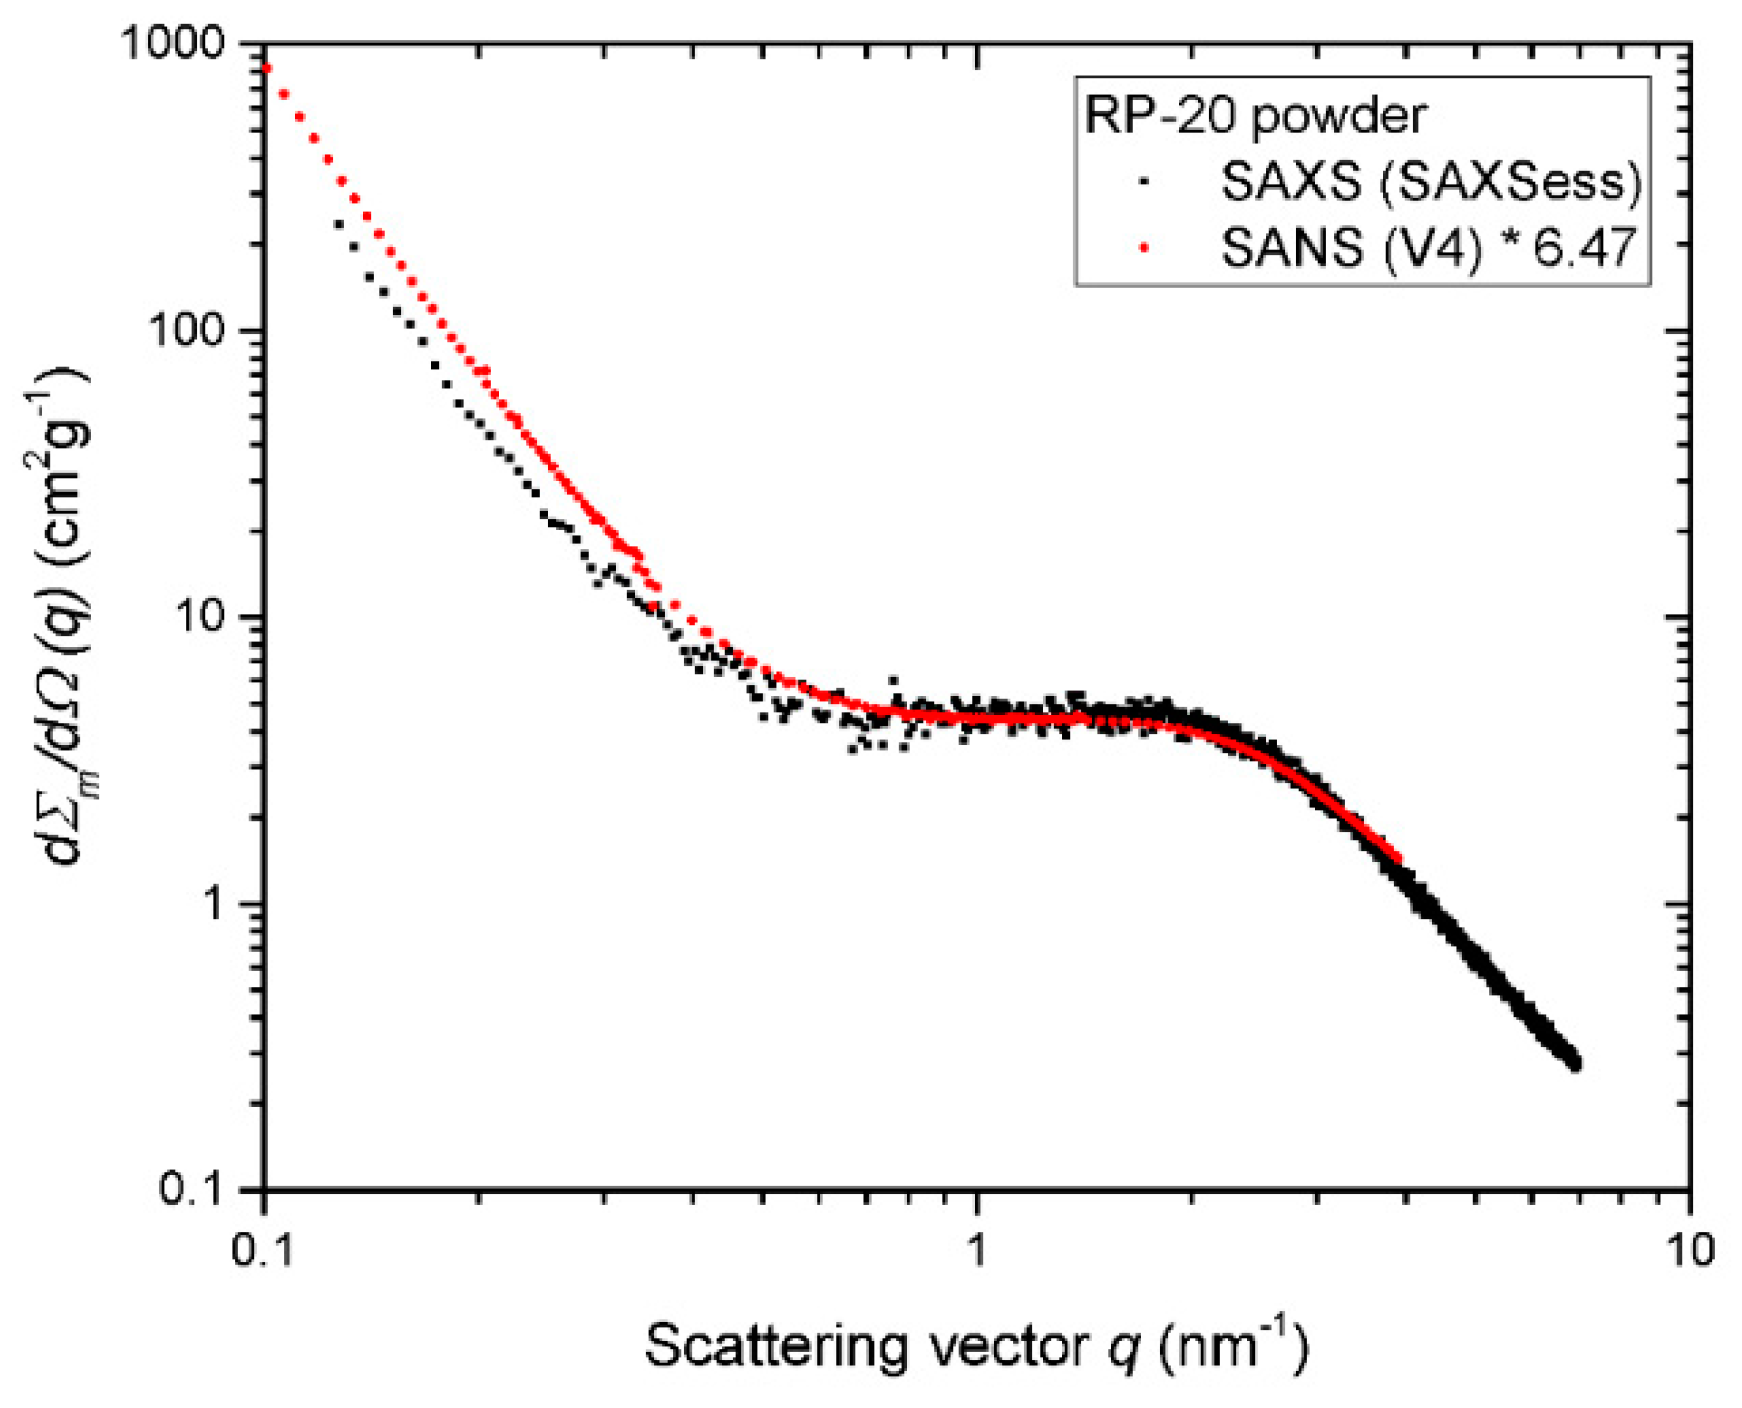
As shown here, the SAXS method is very powerful for a deeper understanding of surface and pore formation as a function of chlorination temperature. Interest in micropore structures and pore distribution within the carbon led to continuous practical applications over the decades. Not only is the formation of the porous network itself interesting, but also the accessibility of the pores in order to achieve higher energy densities. Recently, SANS and SAXS together with the contrast matching technique have contributed to reveal bottlenecks in this matter [57,58,72,74,77]. Figure 8 demonstrates the comparison of the SAS data of RP-20 measured with X-rays or neutrons [96,97]. Neutrons and X-rays have a different contrast due to different scattering lengths (cf., Table 2). Therefore, the SAXS data shown in Figure 8 had to be scaled down by the contrast factor of 6.47.
Various contrast matching agents can be very useful in order to investigate the accessibility of the pores in carbon matrix [72,73,74,76,77]. Hence, the total scattered intensity measured for the sample is proportional to the square of the difference in scattering length density (SLD) between the carbon matrix and the pores/matching agent as follows:
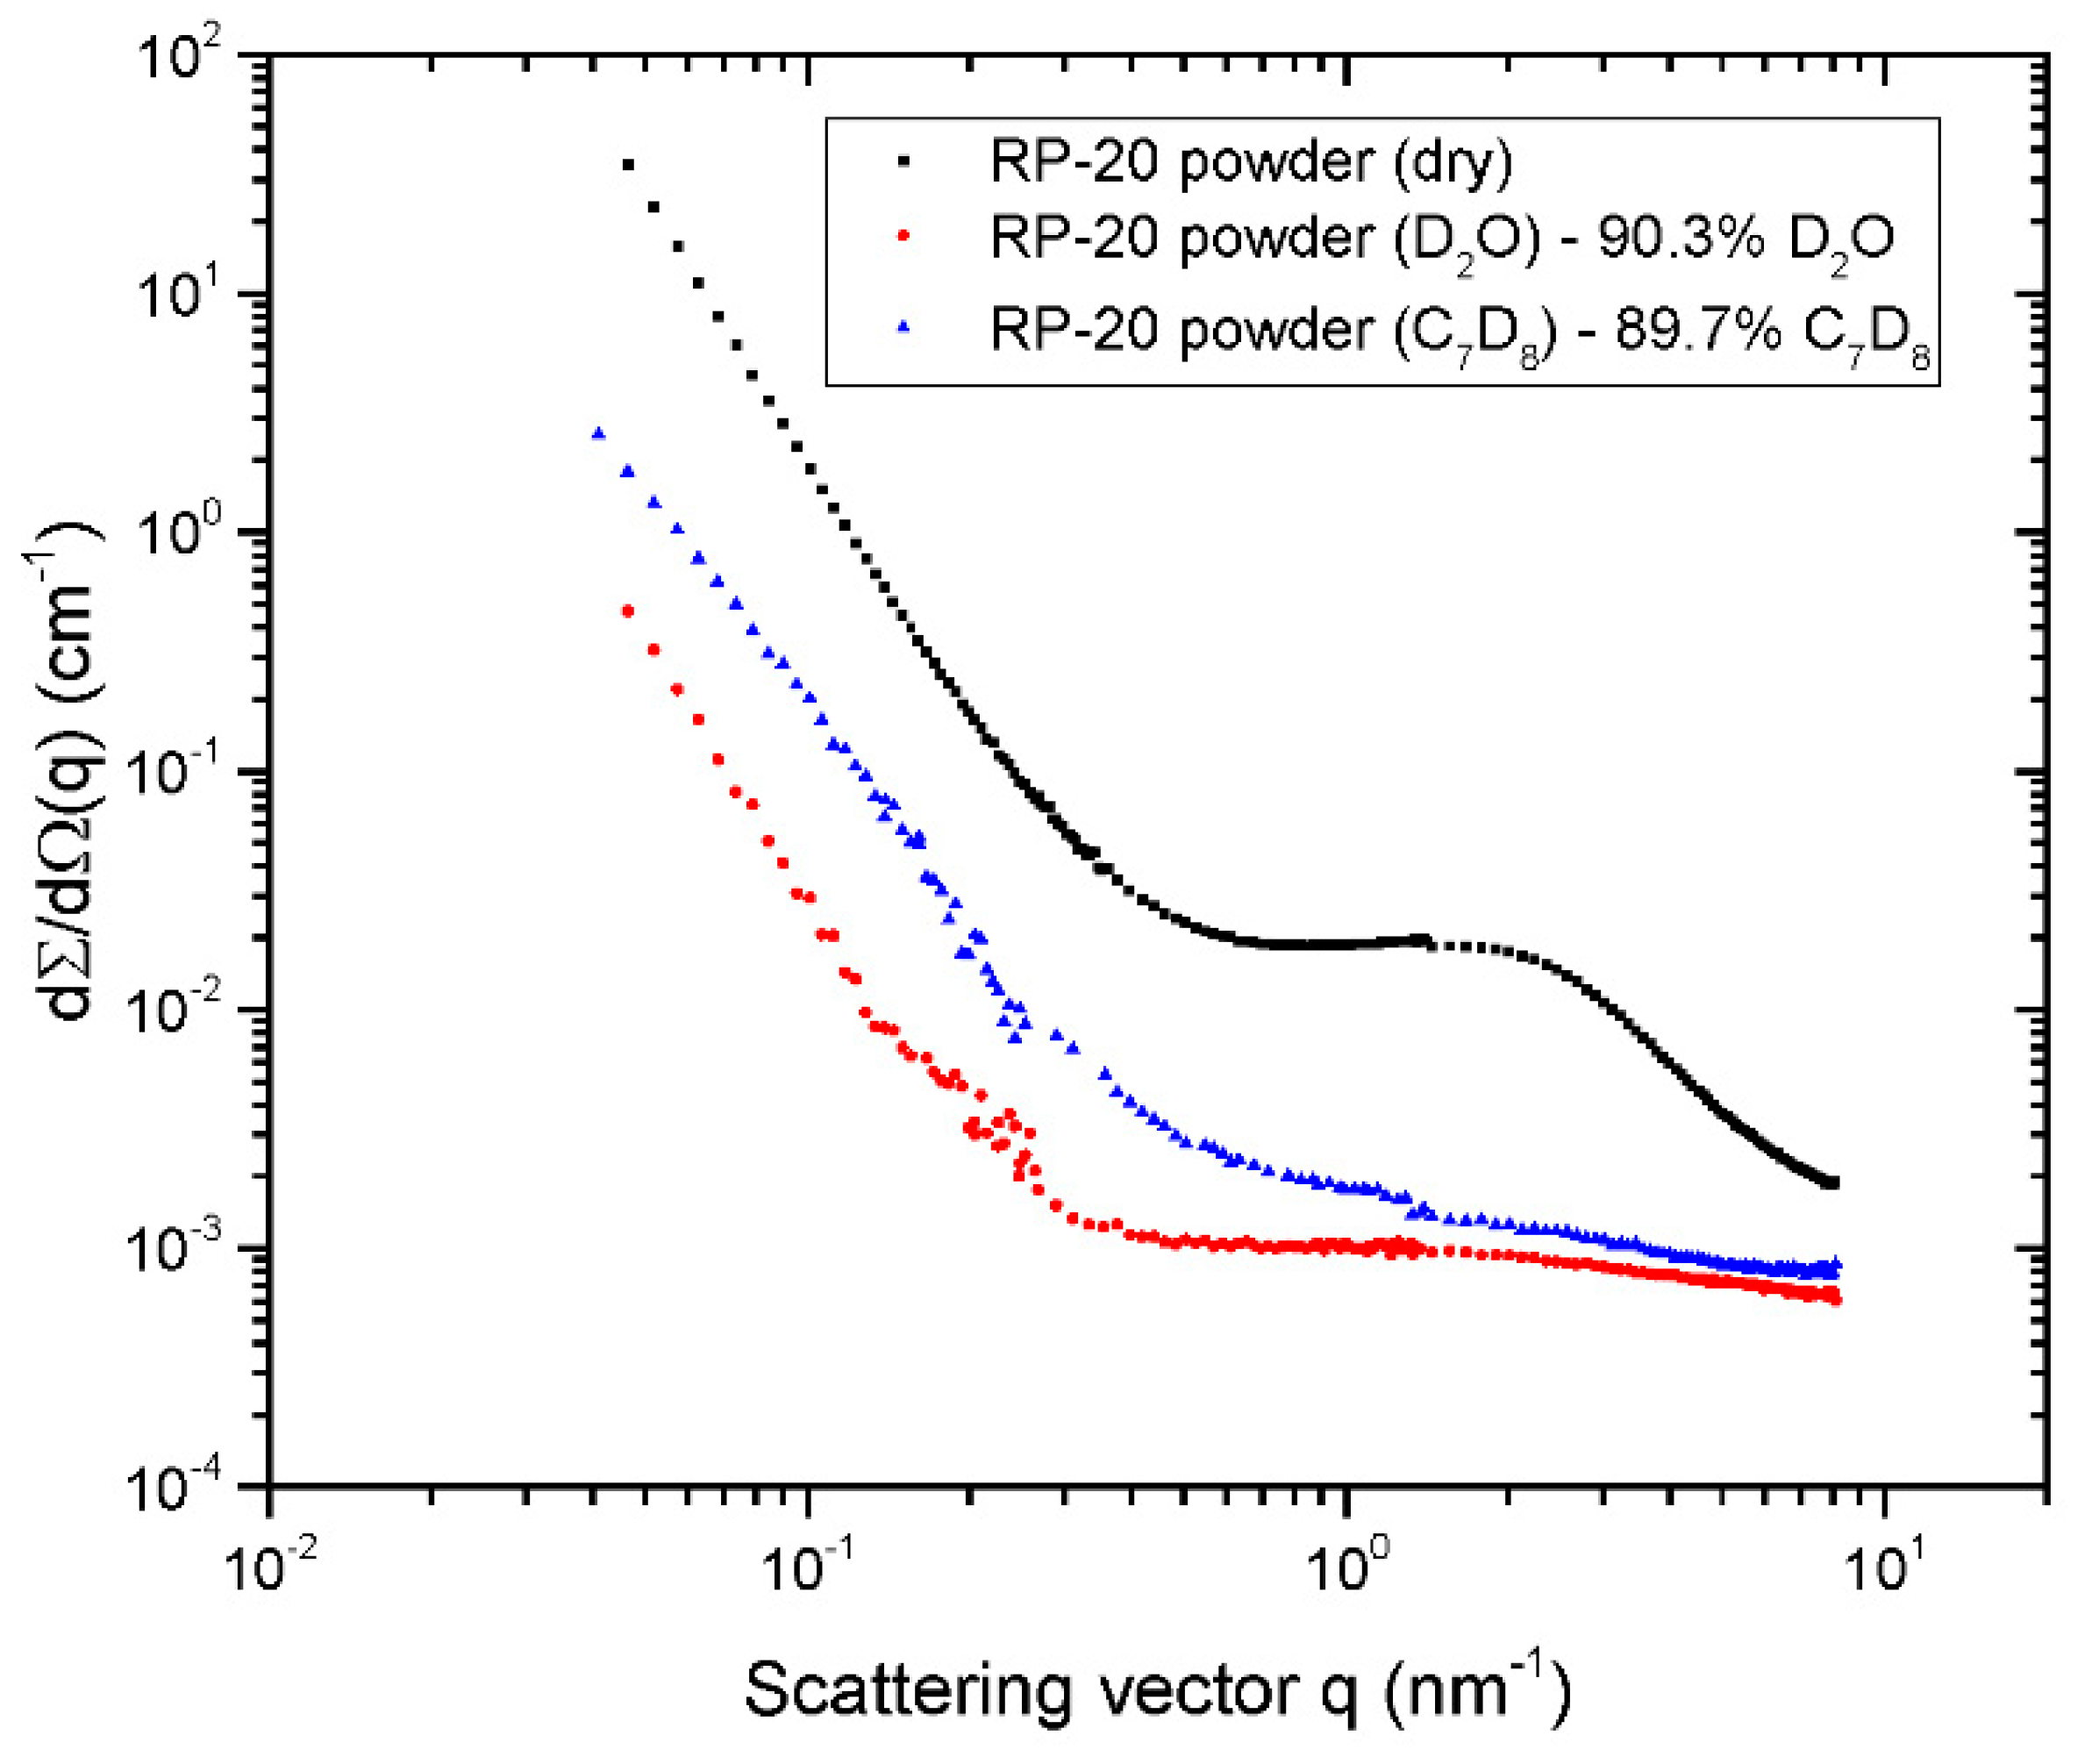
Subsequently, we observed that changes in scattering intensities changed using the deuterated toluene (C7D8) and deuterated water (D2O), which were chosen for the contrast matching due to their similar neutron scattering length density with respect to carbon (See Table 2). SANS together with contrast matching agent allows us to see whether a given gas/liquid accesses the pores. In Figure 9, the scattering patterns of the dry RP-20 carbon and different filling of the RP-20 carbon with the two matching agents, i.e., C7D8 and D2O, are presented [74]. Air traces from the pores were removed by the vacuum filling method [73,74]. Plain C7D8 or D2O scattering intensities as a flat background due to the incoherent scattering contribution have been determined and subtracted, taking into account the respective volume fractions (Figure 9).
The complete filling of the micropores can be seen from the reduction of the scattering intensities beyond q ≥ 0.8 nm−1 by one order of magnitude for C7D8 and by nearly two orders of magnitude for D2O (Figure 9). Clearly, different situations are to be discussed when filling the pores with the liquid C7D8 or with the polar liquid D2O [74]. Depending on the polarity of the carbon surface, the difference of the polarity of the filling agent may play an important role because the wetting of the pores will depend on polarity.
As outlined above, the classical analysis of the SAS data is based on the assumption of pores within a solid matrix of uniform scattering length density (Equation (2)) [46]. Mascotto and coworkers [72,76,77] used the principle of contrast matching, combining physisorption with in situ SAS (SAXS or SANS) to determine the fluctuation contribution directly. In this case, scattering patterns do not only provide information on accessibility (sorption mechanism) but also on the pore size distribution simultaneously within one run [57,58]. Choosing the appropriate contrast matching agent which has similar scattering length density with respect to carbon, e.g., sulfur for SAXS or deuterated p-xylene for the SANS experiment, is required (Table 2) [72,77]. Filling the pores gradually by changing the relative pressure of deuterated p-xylene [77] or impregnating the carbon with sulfur via a melting procedure [72] can be used to study a two-phase system. In either case, the was analyzed in terms of the chord length distribution for different relative pressure of deuterated p-xylene or loadings with sulfur. The results show that the constant increase of the number-average chord length obviously indicate the gradual filling of the carbon matrix, i.e., the distance between the pores becomes larger with an increased filling of the system by deuterated p-xylene or sulfur. In both cases, the CLD approach is the method of choice providing a comprehensive characterization of pores in the carbonaceous matrix and its subsequent filling by sulfur or by a solvent with a given polarity.
4. Conclusions
Quantitative small-angle scattering experiments provide a powerful tool for the determination of structural parameters and the nanoscopic morphology of carbon materials used in material engineering for energy conversion or for supercapacitors and batteries. The microstructures of different carbonaceous materials were investigated by small-angle scattering with neutrons and X-rays of two commercially available ACN, RP-20, and a series of carbide-derived carbons CDC synthesized at various chlorination temperatures. The total scattering intensity measured could be separated correctly into two statistically independent contributions: (i) Fluctuation contribution of the carbon layers and (ii) the pore scattering . After removing the contribution of lateral disorder, the SAS scattering patterns show the asymptotic q−4-behaviour. Thereafter, the remaining scattering curves can then be evaluated to yield in total nine structural parameters which define the spatial architecture of studied carbons, namely: The inner surface area , porosity (i.e., the volume fraction of the micropores) , number-average chord length , mean chord length of the pore and the carbon matrix , weight-averaged chord length , lateral correlation length , degree of angularity , and a degree of disorder . The analysis of the SAS data is model free, i.e., no predefined pore geometry is required and it is applicable within a wide distribution of pore sizes via analysis of the chord length distribution, i.e., . Here, we also demonstrated that with various contrast matching agents the accessibility of the pores in the carbon matrix have been successfully investigated.
Hence, SANS and SAXS are able to provide precise quantitative information on crucial structural parameters which can be directly correlated to macroscopic functional parameters like stored energy per volume or electrical power. The present discussion has also delineated the limits of data evaluation by showing what kind of parameter can be obtained from the analysis of SAXS and SANS data (see the discussion of Table 1). Any information beyond these parameters is not backed by theory. However, the parameters gathered in Table 1 provide a detailed picture of the microstructure of carbonaceous materials. This information can then be correlated to the electrochemical performance of the materials. Work along these lines is underway.
Author Contributions
Both authors contributed equally to conceptualization, methodology, validation, formal analysis, investigation and writing—original draft preparation; writing—review and editing as well as supervision, M.B. Both authors have read and agreed to the published version of the manuscript.
Funding
This research received no external funding.
Acknowledgments
The authors wish to express their gratitude for the beam time (beamline V4) and support offered by HZB. The authors are thankful to Günter Goerigk for numerous discussions and to Albrecht Petzold for the support offered for the measurements with the SAXSess (Anton Paar, Graz). We also acknowledge and express our gratitude for the support by Enn Lust and Indrek Tallo from Institute of Chemistry, University of Tartu providing materials used for experiments.
Conflicts of Interest
The authors declare no conflict of interest.
References
- Zhang, J.; Terrones, M.; Park, C.R.; Mukherjee, R.; Monthioux, M.; Koratkar, N.; Kim, Y.S.; Hurt, R.H.; Frackowiak, E.; Enoki, T.; et al. Carbon science in 2016: Status, challenges and perspectives. Carbon 2016, 98, 708–732. [Google Scholar] [CrossRef]
- Korenblit, Y.; Rose, M.; Kockrick, E.; Borchardt, L.; Kvit, A.; Kaskel, S.; Yushin, G. High-Rate Electrochemical Capacitors Based on Ordered Mesoporous Silicon Carbide-Derived Carbon. ACS Nano 2010, 4, 1337–1344. [Google Scholar] [CrossRef] [PubMed]
- Oschatz, M.; Kockrick, E.; Rose, M.; Borchardt, L.; Klein, N.; Senkovska, I.; Freudenberg, T.; Korenblit, Y.; Yushin, G.; Kaskel, S. A cubic ordered, mesoporous carbide-derived carbon for gas and energy storage applications. Carbon 2010, 48, 3987–3992. [Google Scholar] [CrossRef]
- Dash, R.; Chmiola, J.; Yushin, G.; Gogotsi, Y.; Laudisio, G.; Singer, J.; Fischer, J.; Kucheyev, S. Titanium carbide derived nanoporous carbon for energy-related applications. Carbon 2006, 44, 2489–2497. [Google Scholar] [CrossRef] [Green Version]
- Portet, C.; Yushin, G.; Gogotsi, Y. Electrochemical performance of carbon onions, nanodiamonds, carbon black and multiwalled nanotubes in electrical double layer capacitors. Carbon 2007, 45, 2511–2518. [Google Scholar] [CrossRef]
- Härmas, R.; Palm, R.; Härmas, M.; Pohl, M.; Kurig, H.; Tallo, I.; Tee, E.; Vaas, I.; Väli, R.; Romann, T.; et al. Influence of porosity parameters and electrolyte chemical composition on the power densities of non-aqueous and ionic liquid based supercapacitors. Electrochim. Acta 2018, 283, 931–948. [Google Scholar] [CrossRef]
- Wang, Q.; Yan, J.; Fan, Z. Carbon materials for high volumetric performance supercapacitors: Design, progress, challenges and opportunities. Energy Environ. Sci. 2016, 9, 729–762. [Google Scholar] [CrossRef]
- Vatamanu, J.; Bedrov, D. Capacitive Energy Storage: Current and Future Challenges. J. Phys. Chem. Lett. 2015, 6, 3594–3609. [Google Scholar] [CrossRef]
- Ciszewski, M.; Koszorek, A.; Radko, T.; Szatkowski, P.; Janas, D. Review of the Selected Carbon-Based Materials for Symmetric Supercapacitor Application. J. Electron. Mater. 2018, 48, 717–744. [Google Scholar] [CrossRef] [Green Version]
- Fang, R.; Zhao, S.; Sun, Z.; Wang, D.-W.; Cheng, H.-M.; Li, F. More Reliable Lithium-Sulfur Batteries: Status, Solutions and Prospects. Adv. Mater. 2017, 29, 1606823–1606847. [Google Scholar] [CrossRef]
- Komaba, S.; Murata, W.; Ishikawa, T.; Yabuuchi, N.; Ozeki, T.; Nakayama, T.; Ogata, A.; Gotoh, K.; Fujiwara, K. Electrochemical Na Insertion and Solid Electrolyte Interphase for Hard-Carbon Electrodes and Application to Na-Ion Batteries. Adv. Funct. Mater. 2011, 21, 3859–3867. [Google Scholar] [CrossRef]
- Renault, S.; Mihali, V.A.; Edström, K.; Brandell, D. Stability of organic Na-ion battery electrode materials: The case of disodium pyromellitic diimidate. Electrochem. Commun. 2014, 45, 52–55. [Google Scholar] [CrossRef]
- Wu, L.; Hu, X.; Qian, J.; Pei, F.; Wu, F.; Mao, R.; Ai, X.; Yang, H.; Cao, Y. Sb–C nanofibers with long cycle life as an anode material for high-performance sodium-ion batteries. Energy Environ. Sci. 2014, 7, 323–328. [Google Scholar] [CrossRef]
- Seidlmayer, S.; Hattendorff, J.; Buchberger, I.; Karge, L.; Gasteiger, H.A.; Gilles, R. In Operando Small-Angle Neutron Scattering (SANS) on Li-Ion Batteries. J. Electrochem. Soc. 2015, 162, A3116–A3125. [Google Scholar] [CrossRef]
- Bresser, D.; Passerini, S.; Scrosati, B. Recent progress and remaining challenges in sulfur-based lithium secondary batteries—A review. Chem. Commun. 2013, 49, 10545–10562. [Google Scholar] [CrossRef]
- Dhawa, T.; Chattopadhyay, S.; Sreemany, M.; De, G.; Mahanty, S. Influence of C–S interactions on the electrochemical performance of –COOH functionalized MWCNT/S composites as lithium-sulfur battery cathode. J. Chem. Sci. 2018, 130, 109. [Google Scholar] [CrossRef] [Green Version]
- Schuster, J.; He, G.; Mandlmeier, B.; Yim, T.; Lee, K.T.; Bein, T.; Nazar, L.F. Spherical Ordered Mesoporous Carbon Nanoparticles with High Porosity for Lithium-Sulfur Batteries. Angew. Chem. Int. Ed. 2012, 51, 3591–3595. [Google Scholar] [CrossRef]
- Kondrat, S.; Pérez, C.R.; Presser, V.; Gogotsi, Y.; Kornyshev, A.A. Effect of pore size and its dispersity on the energy storage in nanoporous supercapacitors. Energy Environ. Sci. 2012, 5, 6474–6479. [Google Scholar] [CrossRef]
- Merlet, C.; Péan, C.; Rotenberg, B.; Madden, P.A.; Simon, P.; Salanne, M. Simulating Supercapacitors: Can We Model Electrodes As Constant Charge Surfaces? J. Phys. Chem. Lett. 2013, 4, 264–268. [Google Scholar] [CrossRef]
- Pean, C.; Daffos, B.; Rotenberg, B.; Levitz, P.; Haefele, M.; Taberna, P.-L.; Simon, P.; Salanne, M. Confinement, Desolvation, And Electrosorption Effects on the Diffusion of Ions in Nanoporous Carbon Electrodes. J. Am. Chem. Soc. 2015, 137, 12627–12632. [Google Scholar] [CrossRef]
- Simon, P.; Gogotsi, Y. Capacitive Energy Storage in Nanostructured Carbon–Electrolyte Systems. Accounts Chem. Res. 2013, 46, 1094–1103. [Google Scholar] [CrossRef] [PubMed]
- Chmiola, A.J.; Yushin, G.; Gogotsi, Y.; Portet, C.; Simon, P.; Taberna, P.L. Anomalous Capacitance Less Than Increase in Carbon at Pore Sizes. Science 2015, 313, 1760–1763. [Google Scholar] [CrossRef] [PubMed] [Green Version]
- He, L.; Chathoth, S.M.; Melnichenko, Y.B.; Presser, V.; McDonough, J.; Gogotsi, Y. Small-angle neutron scattering characterization of the structure of nanoporous carbons for energy-related applications. Microporous Mesoporous Mater. 2012, 149, 46–54. [Google Scholar] [CrossRef]
- Leis, J.; Arulepp, M.; Käärik, M.; Perkson, A. The effect of Mo2C derived carbon pore size on the electrical double-layer characteristics in propylene carbonate-based electrolyte. Carbon 2010, 48, 4001–4008. [Google Scholar] [CrossRef]
- Jänes, A.; Thomberg, T.; Kurig, H.; Lust, E. Nanoscale fine-tuning of porosity of carbide-derived carbon prepared from molybdenum carbide. Carbon 2009, 47, 23–29. [Google Scholar] [CrossRef]
- Thomberg, T.; Jänes, A.; Lust, E. Energy and power performance of electrochemical double-layer capacitors based on molybdenum carbide derived carbon. Electrochim. Acta 2010, 55, 3138–3143. [Google Scholar] [CrossRef]
- Eikerling, M.; Kornyshev, A.A.; Lust, E. Optimized Structure of Nanoporous Carbon-Based Double-Layer Capacitors. J. Electrochem. Soc. 2005, 152, E24–E33. [Google Scholar] [CrossRef]
- Borchardt, L.; Oschatz, M.; Paasch, S.; Kaskel, S.; Brunner, E. Interaction of electrolyte molecules with carbon materials of well-defined porosity: Characterization by solid-state NMR spectroscopy. Phys. Chem. Chem. Phys. 2013, 15, 15177–15184. [Google Scholar] [CrossRef]
- Tallo, I.; Thomberg, T.; Kontturi, K.; Jänes, A.; Lust, E. Nanostructured carbide-derived carbon synthesized by chlorination of tungsten carbide. Carbon 2011, 49, 4427–4433. [Google Scholar] [CrossRef]
- Presser, V.; Heon, M.; Gogotsi, Y. Carbide-Derived Carbons—From Porous Networks to Nanotubes and Graphene. Adv. Funct. Mater. 2011, 21, 810–833. [Google Scholar] [CrossRef]
- Ishikawa, S.; Saito, T.; Kuwahara, K. Carbon materials with nano-sized pores derived from carbides. SEI Tech. Rev. 2016, 82, 152–157. [Google Scholar]
- Jäckel, N.; Simon, P.; Gogotsi, Y.; Presser, V. Increase in Capacitance by Subnanometer Pores in Carbon. ACS Energy Lett. 2016, 1, 1262–1265. [Google Scholar] [CrossRef] [Green Version]
- Heimböckel, R.; Hoffmann, F.; Fröba, M. Insights into the influence of the pore size and surface area of activated carbons on the energy storage of electric double layer capacitors with a new potentially universally applicable capacitor model. Phys. Chem. Chem. Phys. 2019, 21, 3122–3133. [Google Scholar] [CrossRef] [PubMed] [Green Version]
- Kim, H.S.; Singer, J.P.; Gogotsi, Y.; Fischer, J.E. Molybdenum carbide-derived carbon for hydrogen storage. Microporous Mesoporous Mater. 2009, 120, 267–271. [Google Scholar] [CrossRef]
- Chmiola, J.; Largeot, C.; Taberna, P.-L.; Simon, P.; Gogotsi, Y. Monolithic Carbide-Derived Carbon Films for Micro-Supercapacitors. Science 2010, 328, 480–483. [Google Scholar] [CrossRef] [PubMed] [Green Version]
- Jäckel, N.; Rodner, M.; Schreiber, A.; Jeongwook, J.; Zeiger, M.; Aslan, M.; Weingarth, D.; Presser, V. Anomalous or regular capacitance? The influence of pore size dispersity on double-layer formation. J. Power Sources 2016, 326, 660–671. [Google Scholar] [CrossRef]
- Stoeckli, F.; Centeno, T.A. Pore size distribution and capacitance in microporous carbons. Phys. Chem. Chem. Phys. 2012, 14, 11589–11591. [Google Scholar] [CrossRef]
- García-Gómez, A.; Moreno-Fernández, G.; Lobato, B.; Centeno, T.A. Constant capacitance in nanopores of carbon monoliths. Phys. Chem. Chem. Phys. 2015, 17, 15687–15690. [Google Scholar] [CrossRef] [Green Version]
- Salitra, G.; Soffer, A.; Eliad, L.; Cohen, Y.; Aurbach, D. Carbon Electrodes for Double-Layer Capacitors I. Relations Between Ion and Pore Dimensions. J. Electrochem. Soc. 2000, 147, 2486–2493. [Google Scholar] [CrossRef]
- Thommes, M.; Kaneko, K.; Neimark, A.V.; Olivier, J.P.; Rodriguez-Reinoso, F.; Rouquerol, J.; Sing, K.S.W. Physisorption of gases, with special reference to the evaluation of surface area and pore size distribution (IUPAC Technical Report). Pure Appl. Chem. 2015, 87, 1051–1069. [Google Scholar] [CrossRef] [Green Version]
- Landers, J.; Gor, G.Y.; Neimark, A.V. Density functional theory methods for characterization of porous materials. Colloids Surf. A Physicochem. Eng. Asp. 2013, 437, 3–32. [Google Scholar] [CrossRef]
- Sing, K. The use of nitrogen adsorption for the characterisation of porous materials. Colloids Surf. A Physicochem. Eng. Asp. 2001, 187, 3–9. [Google Scholar] [CrossRef]
- Radlinski, A.P.; Mastalerz, M.; Hinde, A.L.; Hainbuchner, M.; Rauch, H.; Baron, M.; Lin, J.S.; Fan, L.; Thiyagarajan, P. Application of SAXS and SANS in evaluation of porosity, pore size distribution and surface area of coal. Int. J. Coal Geol. 2004, 59, 245–271. [Google Scholar] [CrossRef]
- Calo, J.M.; Hall, P.J. The application of small angle scattering techniques to porosity characterization in carbons. Carbon 2004, 42, 1299–1304. [Google Scholar] [CrossRef]
- Calo, J.M.; Hall, P.J.; Antxustegi, M. Carbon porosity characterization via small angle neutron scattering. Colloids Surf. A Physicochem. Eng. Asp. 2001, 219–232. [Google Scholar] [CrossRef]
- Perret, R.; Ruland, W. X-ray small-angle scattering of glassy carbon. J. Appl. Crystallogr. 1972, 5, 183–187. [Google Scholar] [CrossRef]
- Diduszko, R.; Swiatkowski, A.; Trznadel, B.J.J. On surface of micropores and fractal dimension of activated carbon determined on the basis of adsorption and SAXS investigations. Carbon 2000, 38, 1153–1162. [Google Scholar] [CrossRef]
- Laudisio, G.; Dash, R.K.; Singer, J.P.; Yushin, G.; Gogotsi, Y.; Fischer, J.E. Carbide-Derived Carbons: A Comparative Study of Porosity Based on Small-Angle Scattering and Adsorption Isotherms. Langmuir 2006, 22, 8945–8950. [Google Scholar] [CrossRef]
- Braun, A.; Huggins, F.E.; Seifert, S.; Ilavsky, J.; Shah, N.; Kelly, K.E.; Sarofim, A.; Huffman, G.P. Size-range analysis of diesel soot with ultra-small angle X-ray scattering. Combust. Flame 2004, 137, 63–72. [Google Scholar] [CrossRef]
- Perret, R.; Ruland, W. X-ray small-angle scattering of non-graphitizable carbons. J. Appl. Crystallogr. 1968, 1, 308–313. [Google Scholar] [CrossRef]
- Prehal, C.; Koczwara, C.; Jäckel, N.; Schreiber, A.; Burian, M.; Amenitsch, H.; Hartmann, M.A.; Presser, V.; Paris, O. Quantification of ion confinement and desolvation in nanoporous carbon supercapacitors with modelling and in situ X-ray scattering. Nat. Energy 2017, 2, 1–8. [Google Scholar] [CrossRef]
- Smarsly, B.; Antonietti, M.; Wolff, T. Evaluation of the small-angle x-ray scattering of carbons using parametrization methods. J. Chem. Phys. 2002, 116, 2618–2627. [Google Scholar] [CrossRef]
- Weth, M.; Mathias, J.; Emmerling, A.; Kuhn, J.; Fricke, J. The Structure of Carbon Blacks Measured with (Ultra)-Small Angle X-ray Scattering. J. Porous Mater. 2001, 8, 319–325. [Google Scholar] [CrossRef]
- Prehal, C.; Koczwara, C.; Jäckel, N.; Amenitsch, H.; Presser, V.; Paris, O. A carbon nanopore model to quantify structure and kinetics of ion electrosorption with in situ small-angle X-ray scattering. Phys. Chem. Chem. Phys. 2017, 19, 15549–15561. [Google Scholar] [CrossRef]
- Gibaud, A.; Xue, J.S.; Dahn, J.R. A small angle X-ray scattering study of carbons made from pyrolyzed sugar. Carbon 1996, 34, 499–503. [Google Scholar] [CrossRef]
- Avdeev, M.A.; Blagoveshchenskiĭ, N.M.; Martynov, P.N.; Mel’nikov, V.P.; Novikov, A.G.; Puchkov, A.V. Investigation of the microstructure of activated carbons by the small-angle slow neutron scattering method. Phys. Solid State 2010, 52, 985–987. [Google Scholar] [CrossRef]
- Hoinkis, E.; Lima, E.B.F.; Schubert-Bischoff, P. A Study of Carbon Black Corax N330 with Small-Angle Scattering of Neutrons and X-rays. Langmuir 2004, 20, 8823–8830. [Google Scholar] [CrossRef]
- Hoinkis, E.; Allen, A. A small angle neutron scattering study of porous graphitic materials before and after adsorption and condensation of C6D6 within the accessible pores. J. Colloid Interface Sci. 1991, 145, 540–556. [Google Scholar] [CrossRef]
- Biscoe, J.; Warren, B.E. An X-ray Study of Carbon Black. J. Appl. Phys. 1942, 13, 364–371. [Google Scholar] [CrossRef]
- Franklin, R.E. The structure of graphitic carbons. Acta Crystallogr. 1951, 4, 253–261. [Google Scholar] [CrossRef]
- Warren, B.E. X-ray Diffraction Study of Carbon Black. J. Chem. Phys. 1934, 2, 551–555. [Google Scholar] [CrossRef]
- Ruland, W.; Smarsly, B. research papers X-ray scattering of non-graphitic carbon: An improved method of evaluation. J. Appl. Crystallogr. 2002, 35, 624–633. [Google Scholar] [CrossRef]
- Faber, K.; Badaczewski, F.; Ruland, W.; Smarsly, B.M. Investigation of the Microstructure of Disordered, Non-graphitic Carbons by an Advanced Analysis Method for Wide-Angle X-ray Scattering. Z. Anorg. Allg. Chem. 2014, 640, 3107–3117. [Google Scholar] [CrossRef]
- Loeh, M.O.; Badaczewski, F.; Faber, K.; Hintner, S.; Bertino, M.F.; Mueller, P.; Metz, J.; Smarsly, B.M. Analysis of thermally induced changes in the structure of coal tar pitches by an advanced evaluation method of X-ray scattering data. Carbon 2016, 109, 823–835. [Google Scholar] [CrossRef]
- Faber, K.; Badaczewski, F.; Oschatz, M.; Mondin, G.; Nickel, W.; Kaskel, S.; Smarsly, B.M. In-Depth Investigation of the Carbon Microstructure of Silicon Carbide-Derived Carbons by Wide-Angle X-ray Scattering. J. Phys. Chem. C 2014, 118, 15705–15715. [Google Scholar] [CrossRef]
- Badaczewski, F.; Loeh, M.O.; Pfaff, T.; Dobrotka, S.; Wallacher, D.; Clemens, D.; Metz, J.; Smarsly, B.M. Peering into the structural evolution of glass-like carbons derived from phenolic resin by combining small-angle neutron scattering with an advanced evaluation method for wide-angle X-ray scattering. Carbon 2019, 141, 169–181. [Google Scholar] [CrossRef]
- Harris, P.J.F. Structure of non-graphitising carbons. Int. Mater. Rev. 1997, 42, 206–218. [Google Scholar] [CrossRef]
- Urbonaite, S.; Juarez-Galán, J.M.; Leis, J.; Rodríguez-Reinoso, F.; Svensson, G. Porosity development along the synthesis of carbons from metal carbides. Microporous Mesoporous Mater. 2008, 113, 14–21. [Google Scholar] [CrossRef]
- Oschatz, M.; Pré, P.; Dörfler, S.; Nickel, W.; Beaunier, P.; Rouzaud, J.-N.; Fischer, C.; Brunner, E.; Kaskel, S. Nanostructure characterization of carbide-derived carbons by morphological analysis of transmission electron microscopy images combined with physisorption and Raman spectroscopy. Carbon 2016, 105, 314–322. [Google Scholar] [CrossRef]
- De Tomas, C.; Suarez-Martinez, I.; Vallejos-Burgos, F.; López, M.J.; Kaneko, K.; Marks, N.A. Structural prediction of graphitization and porosity in carbide-derived carbons. Carbon 2017, 119, 1–9. [Google Scholar] [CrossRef] [Green Version]
- Daniels, H.; Brydson, R.; Rand, B.; Brown, A. Investigating carbonization and graphitization using electron energy loss spectroscopy (EELS) in the transmission electron microscope (TEM). Philos. Mag. 2007, 87, 4073–4092. [Google Scholar] [CrossRef]
- Petzold, A.; Juhl, A.; Scholz, J.; Ufer, B.; Goerigk, G.; Fröba, M.; Ballauff, M.; Mascotto, S.; Goerigk, G.J. Distribution of Sulfur in Carbon/Sulfur Nanocomposites Analyzed by Small-Angle X-ray Scattering. Langmuir 2016, 32, 2780–2786. [Google Scholar] [CrossRef] [PubMed]
- Jafta, C.J.; Petzold, A.; Risse, S.; Clemens, D.; Wallacher, D.; Goerigk, G.J.; Ballauff, M. Correlating pore size and shape to local disorder in microporous carbon: A combined small angle neutron and X-ray scattering study. Carbon 2017, 123, 440–447. [Google Scholar] [CrossRef]
- Härk, E.; Petzold, A.; Goerigk, G.J.; Ballauff, M.; Kent, B.; Keiderling, U.; Palm, R.; Vaas, I.; Lust, E. The effect of a binder on porosity of the nanoporous RP-20 carbon. A combined study by small angle X-ray and neutron scattering. Microporous Mesoporous Mater. 2019, 275, 139–146. [Google Scholar] [CrossRef]
- Härk, E.; Petzold, A.; Goerigk, G.J.; Risse, S.; Tallo, I.; Härmas, R.; Lust, E.; Ballauff, M. Carbide derived carbons investigated by small angle X-ray scattering: Inner surface and porosity vs. graphitization. Carbon 2019, 11, 398–408. [Google Scholar] [CrossRef]
- Mascotto, S.; Wallacher, D.; Brandt, A.; Hauss, T.; Thommes, M.; Zickler, G.A.; Funari, S.S.; Timmann, A.; Smarsly, B.M. Analysis of Microporosity in Ordered Mesoporous Hierarchically Structured Silica by Combining Physisorption With in Situ Small-Angle Scattering (SAXS and SANS). Langmuir 2009, 25, 12670–12681. [Google Scholar] [CrossRef]
- Mascotto, S.; Kuźmicz, D.; Wallacher, D.; Siebenbürger, M.; Clemens, D.; Risse, S.; Yuan, J.; Antonietti, M.; Ballauff, M. Poly(ionic liquid)-derived nanoporous carbon analyzed by combination of gas physisorption and small-angle neutron scattering. Carbon 2015, 82, 425–435. [Google Scholar] [CrossRef]
- Härk, E.; Kardjilov, N.; Hilger, A.; Petzold, A.; Risse, S.; Vaas, I.; Goerigk, G.J.; Jafta, C.J.; Ballauff, M.; Lust, E. The Nanoporous RP-20 Carbon Electrode as a Model for Energy Storage and Conversion Systems—Studied with µCT, SAXS and SANS Techniques. ECS Trans. 2017, 77, 1133–1144. [Google Scholar] [CrossRef]
- Porod, G. Die Röntgenkleinwinkelstreuung von dichtgepackten kolloiden Systemen. Kolloid Z. 1951, 124, 83–114. [Google Scholar] [CrossRef]
- Glatter, O.; Kratky, O. Small Angle X-ray Scattering; Academic Press: London, UK, 1982; pp. 1–515. [Google Scholar] [CrossRef]
- Cohaut, N.; Blanche, C.; Dumas, D.; Guet, J.M.; Rouzaud, J.N. A small angle X-ray scattering study on the porosity of anthracites. Carbon 2000, 38, 1391–1400. [Google Scholar] [CrossRef]
- Ruland, W. Apparent fractal dimensions obtained from small-angle scattering of carbon materials. Carbon 2001, 39, 323–324. [Google Scholar] [CrossRef]
- Nguyen, T.X.; Bhatia, S.K. Characterization of accessible and inaccessible pores in microporous carbons by a combination of adsorption and small angle neutron scattering. Carbon 2012, 50, 3045–3054. [Google Scholar] [CrossRef]
- Mileeva, Z.; Ross, D.K.; Wilkinson, D.; King, S.M.; Ryan, T.A.; Sharrock, H. The use of small angle neutron scattering with contrast matching and variable adsorbate partial pressures in the study of porosity in activated carbons. Carbon 2012, 50, 5062–5075. [Google Scholar] [CrossRef] [Green Version]
- Jänes, A.; Kurig, H.; Lust, E. Characterisation of activated nanoporous carbon for supercapacitor electrode materials. Carbon 2007, 45, 1226–1233. [Google Scholar] [CrossRef]
- Kurig, H.; Russina, M.; Tallo, I.; Siebenbürger, M.; Romann, T.; Lust, E. The suitability of infinite slit-shaped pore model to describe the pores in highly porous carbon materials. Carbon 2016, 100, 617–624. [Google Scholar] [CrossRef]
- Ruch, P.W.; Hahn, M.; Cericola, D.; Menzel, A.; Kötz, R.; Wokaun, A. A dilatometric and small-angle X-ray scattering study of the electrochemical activation of mesophase pitch-derived carbon in non-aqueous electrolyte solution. Carbon 2010, 8, 2–10. [Google Scholar] [CrossRef]
- Kalliat, M.; Kwak, C.Y.; Schmidt, P.W. Small-Angle X-ray Investigation of the Porosity in Coals. New Approaches Coal Chem. 1981, 3–22. [Google Scholar] [CrossRef] [Green Version]
- Debye, P.; Anderson, H.R.; Brumberger, H. Scattering by an Inhomogeneous Solid. II. The Correlation Function and Its Application. J. Appl. Phys. 1957, 28, 679–683. [Google Scholar] [CrossRef]
- Schiller, C.; Mering, J. Diffusion centrale des rayons X par des carbones graphitables. Déviation de la loi de Porod. C. R. Acad. Sci. Paris Ser. B 1967, 264, 247–250. [Google Scholar]
- Ruland, W. Carbon Fibers. Adv. Mater. 1990, 2, 528–536. [Google Scholar] [CrossRef]
- Stoeckel, D.; Wallacher, D.; Zickler, G.A.; Perlich, J.; Tallarek, U.; Smarsly, B.M. Coherent analysis of disordered mesoporous adsorbents using small angle X-ray scattering and physisorption experiments. Phys. Chem. Chem. Phys. 2014, 16, 6583–6592. [Google Scholar] [CrossRef] [PubMed] [Green Version]
- Méring, J.; Tchoubar, D. Interprétation de la diffusion centrale des rayons X par les systèmes poreux. I. J. Appl. Crystallogr. 1968, 1, 153–165. [Google Scholar] [CrossRef]
- Bacon, G.E. The interlayer spacing of graphite. Acta Crystallogr. 1951, 4, 558–561. [Google Scholar] [CrossRef]
- Palm, R.; Härmas, R.; Härk, E.; Kent, B.; Kurig, H.; Koppel, M.; Russina, M.; Tallo, I.; Romann, T.; Mata, J.P.; et al. Study of the Structural Curvature in Mo2C Derived Carbons with Contrast Matched Small-Angle Neutron Scattering. Carbon 2021, 171, 695–703. [Google Scholar] [CrossRef]
- Keiderling, U. The new ’BerSANS-PC’software for reduction and treatment of small angle neutron scattering data. Appl. Phys. A 2002, 74, 1455–1457. [Google Scholar] [CrossRef]
- Keiderling, U.; Wiedenmann, A. New SANS instrument at the BER II reactor in Berlin, Germany. Phys. B Condens. Matter 1995, 213, 895–897. [Google Scholar] [CrossRef]
Figure 1.
Analysis of carbide-derived carbons (CDC) by small-angle X-ray scattering: Mass normalized scattering curves of CDC powders [25] synthesized at different temperatures compared with commercial RP-20 carbon powder [74,85], as noted in the Figure. Reproduced with permission from [74,75] copyright© 2019, Elsevier.

Figure 2.
Analysis of CDC materials by SAXS [75]. Porod plot according to Equation (4) for two CDC powders synthesized at 600 °C and 1000 °C, respectively. The slope and the intercept of the solid line gives the magnitude of (Equation (4)) and the inner surface area (Equation (5)), respectively. This information allow us to correct the experimental scattering curves for the fluctuations in the solid carbonaceous material. Reproduced with permission from [75] copyright © 2019, Elsevier.

Figure 3.
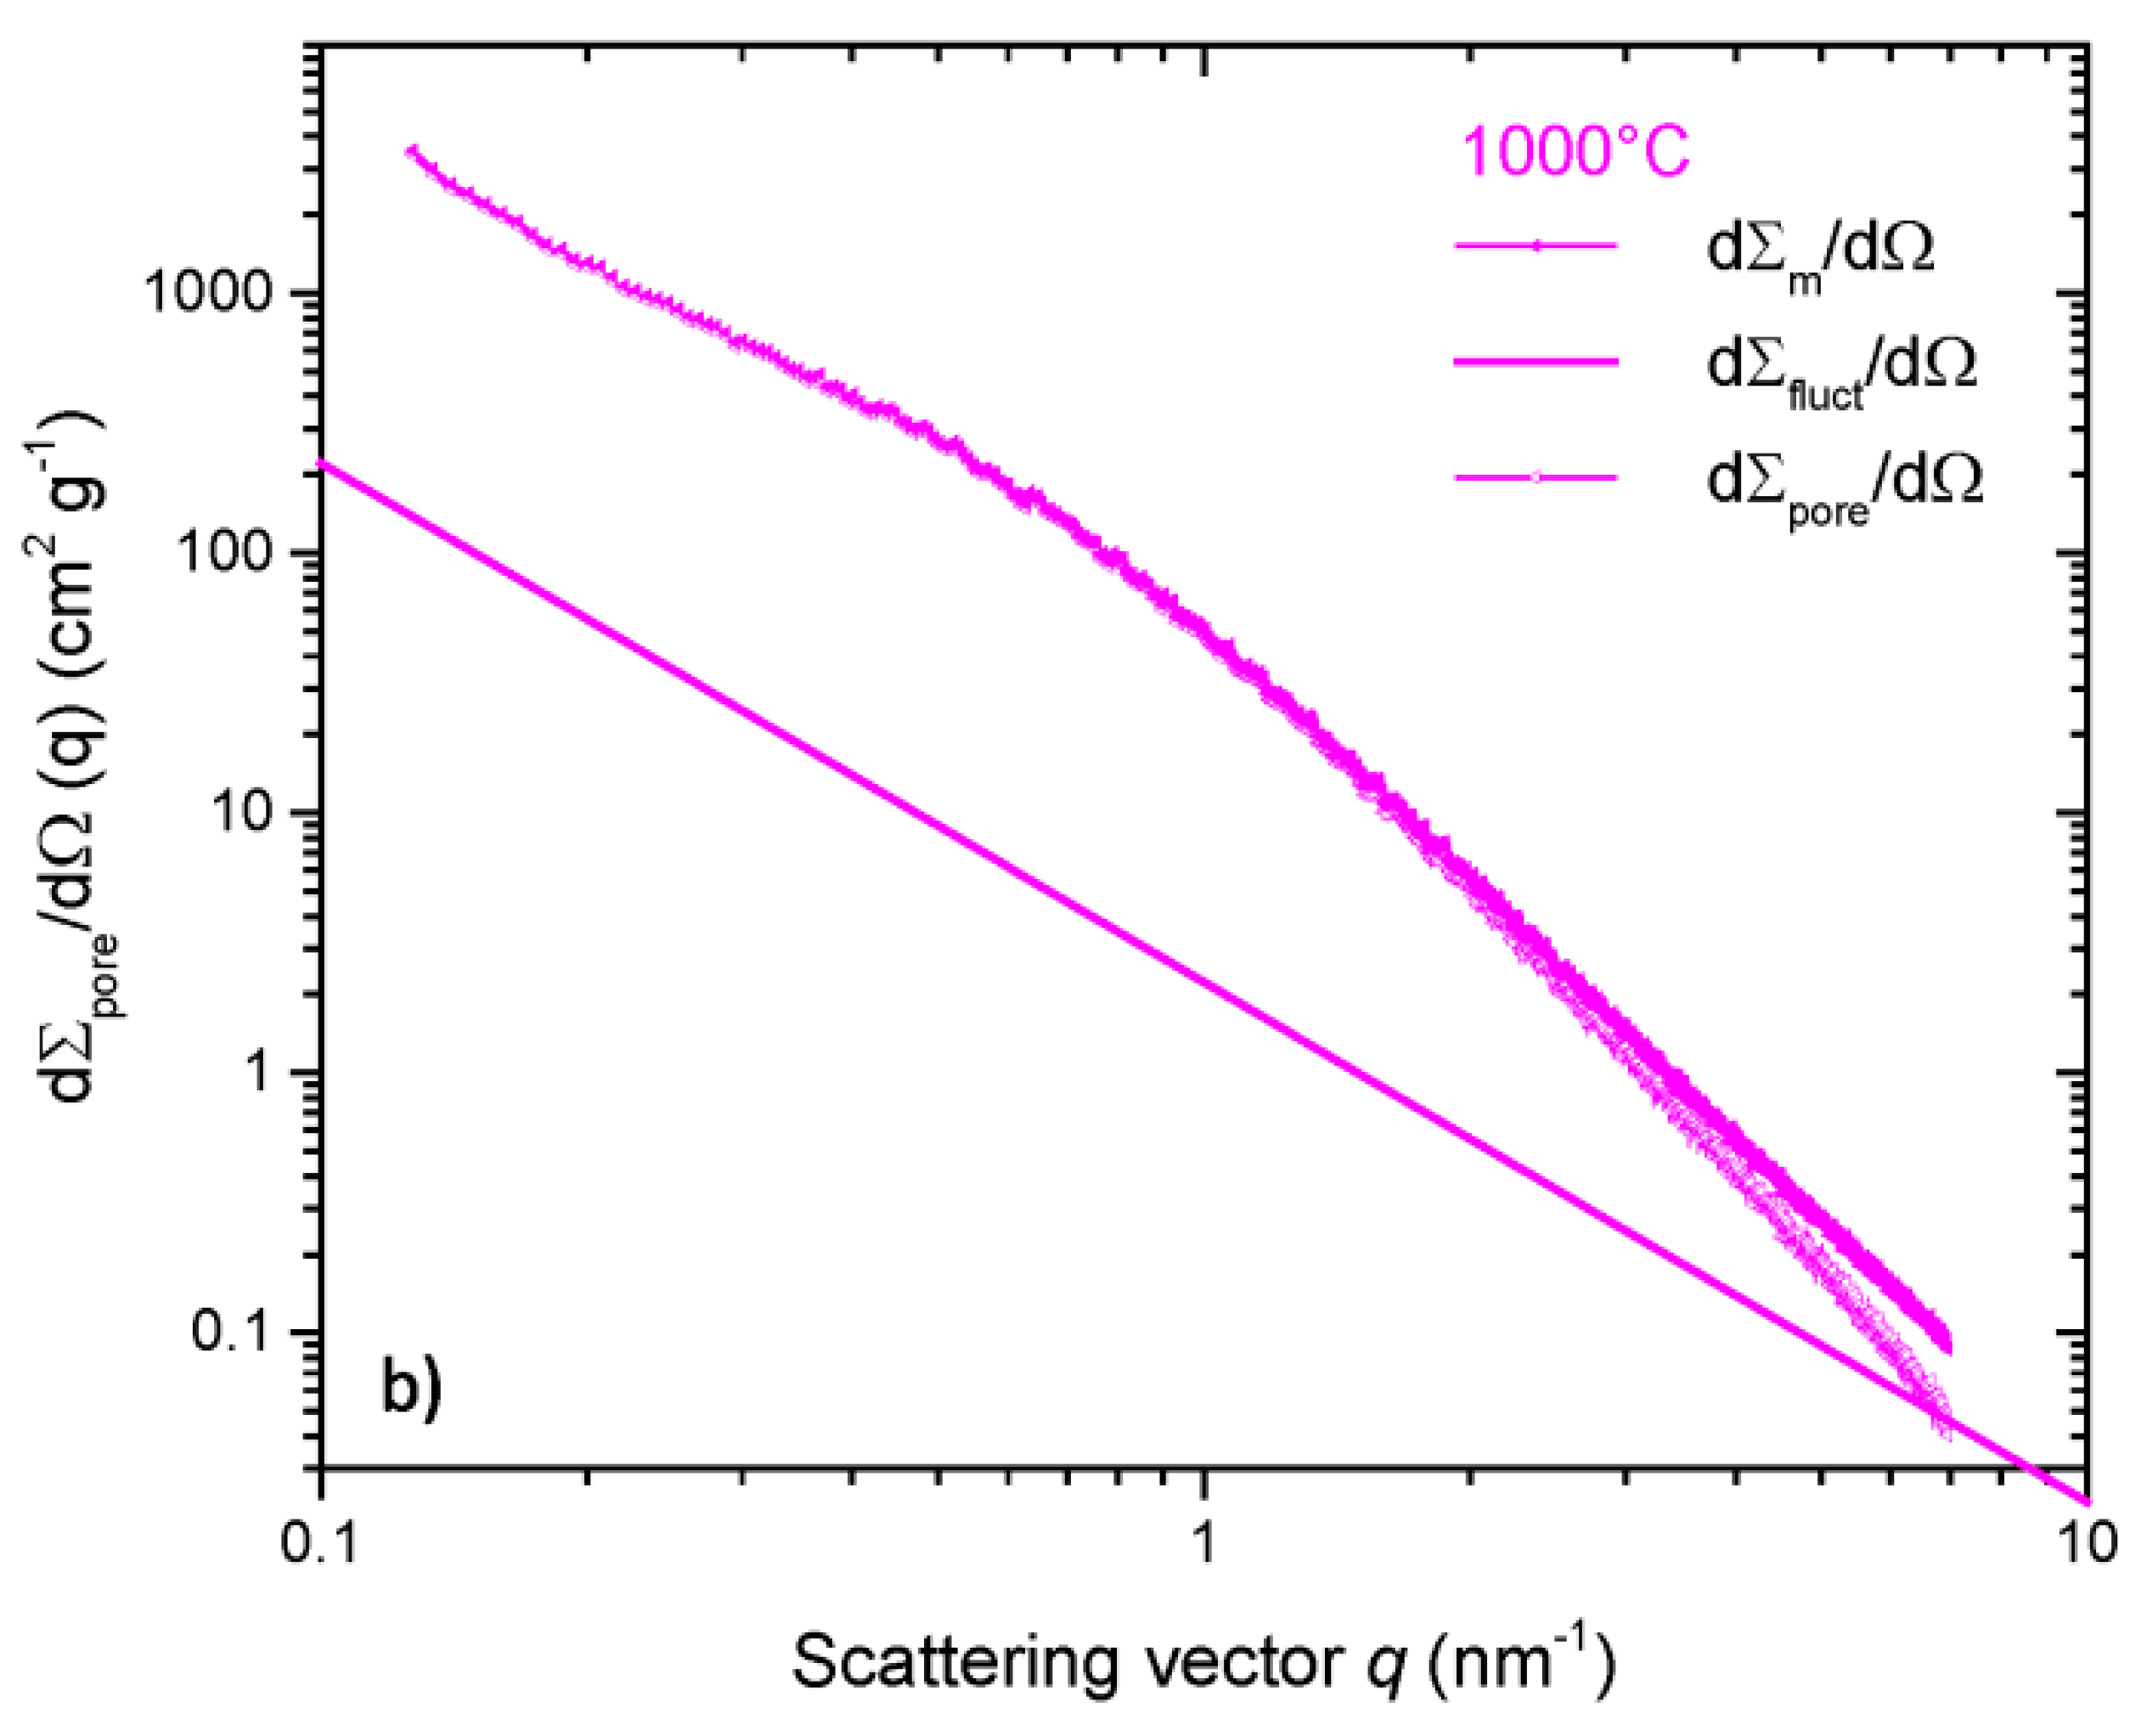
Analysis of CDC-carbon materials by SAXS using the CLD-approach [75]. The scattering curves (mass normalized) for two CDC powder synthesized at 600 °C (a) or 1000 °C (b) are given as filled symbols, and the fluctuation contribution Equation (4) from the lateral imperfection and finite size of the carbon layers is indicated by solid lines in the graphs. Removal of the scattering contribution caused by these fluctuations allow us to analyze the scattering intensity for porosity, given as open symbols. See text for further explanation. Reproduced with permission from [75] copyright © 2019, Elsevier.
Figure 3.
Analysis of CDC-carbon materials by SAXS using the CLD-approach [75]. The scattering curves (mass normalized) for two CDC powder synthesized at 600 °C (a) or 1000 °C (b) are given as filled symbols, and the fluctuation contribution Equation (4) from the lateral imperfection and finite size of the carbon layers is indicated by solid lines in the graphs. Removal of the scattering contribution caused by these fluctuations allow us to analyze the scattering intensity for porosity, given as open symbols. See text for further explanation. Reproduced with permission from [75] copyright © 2019, Elsevier.


Figure 4.
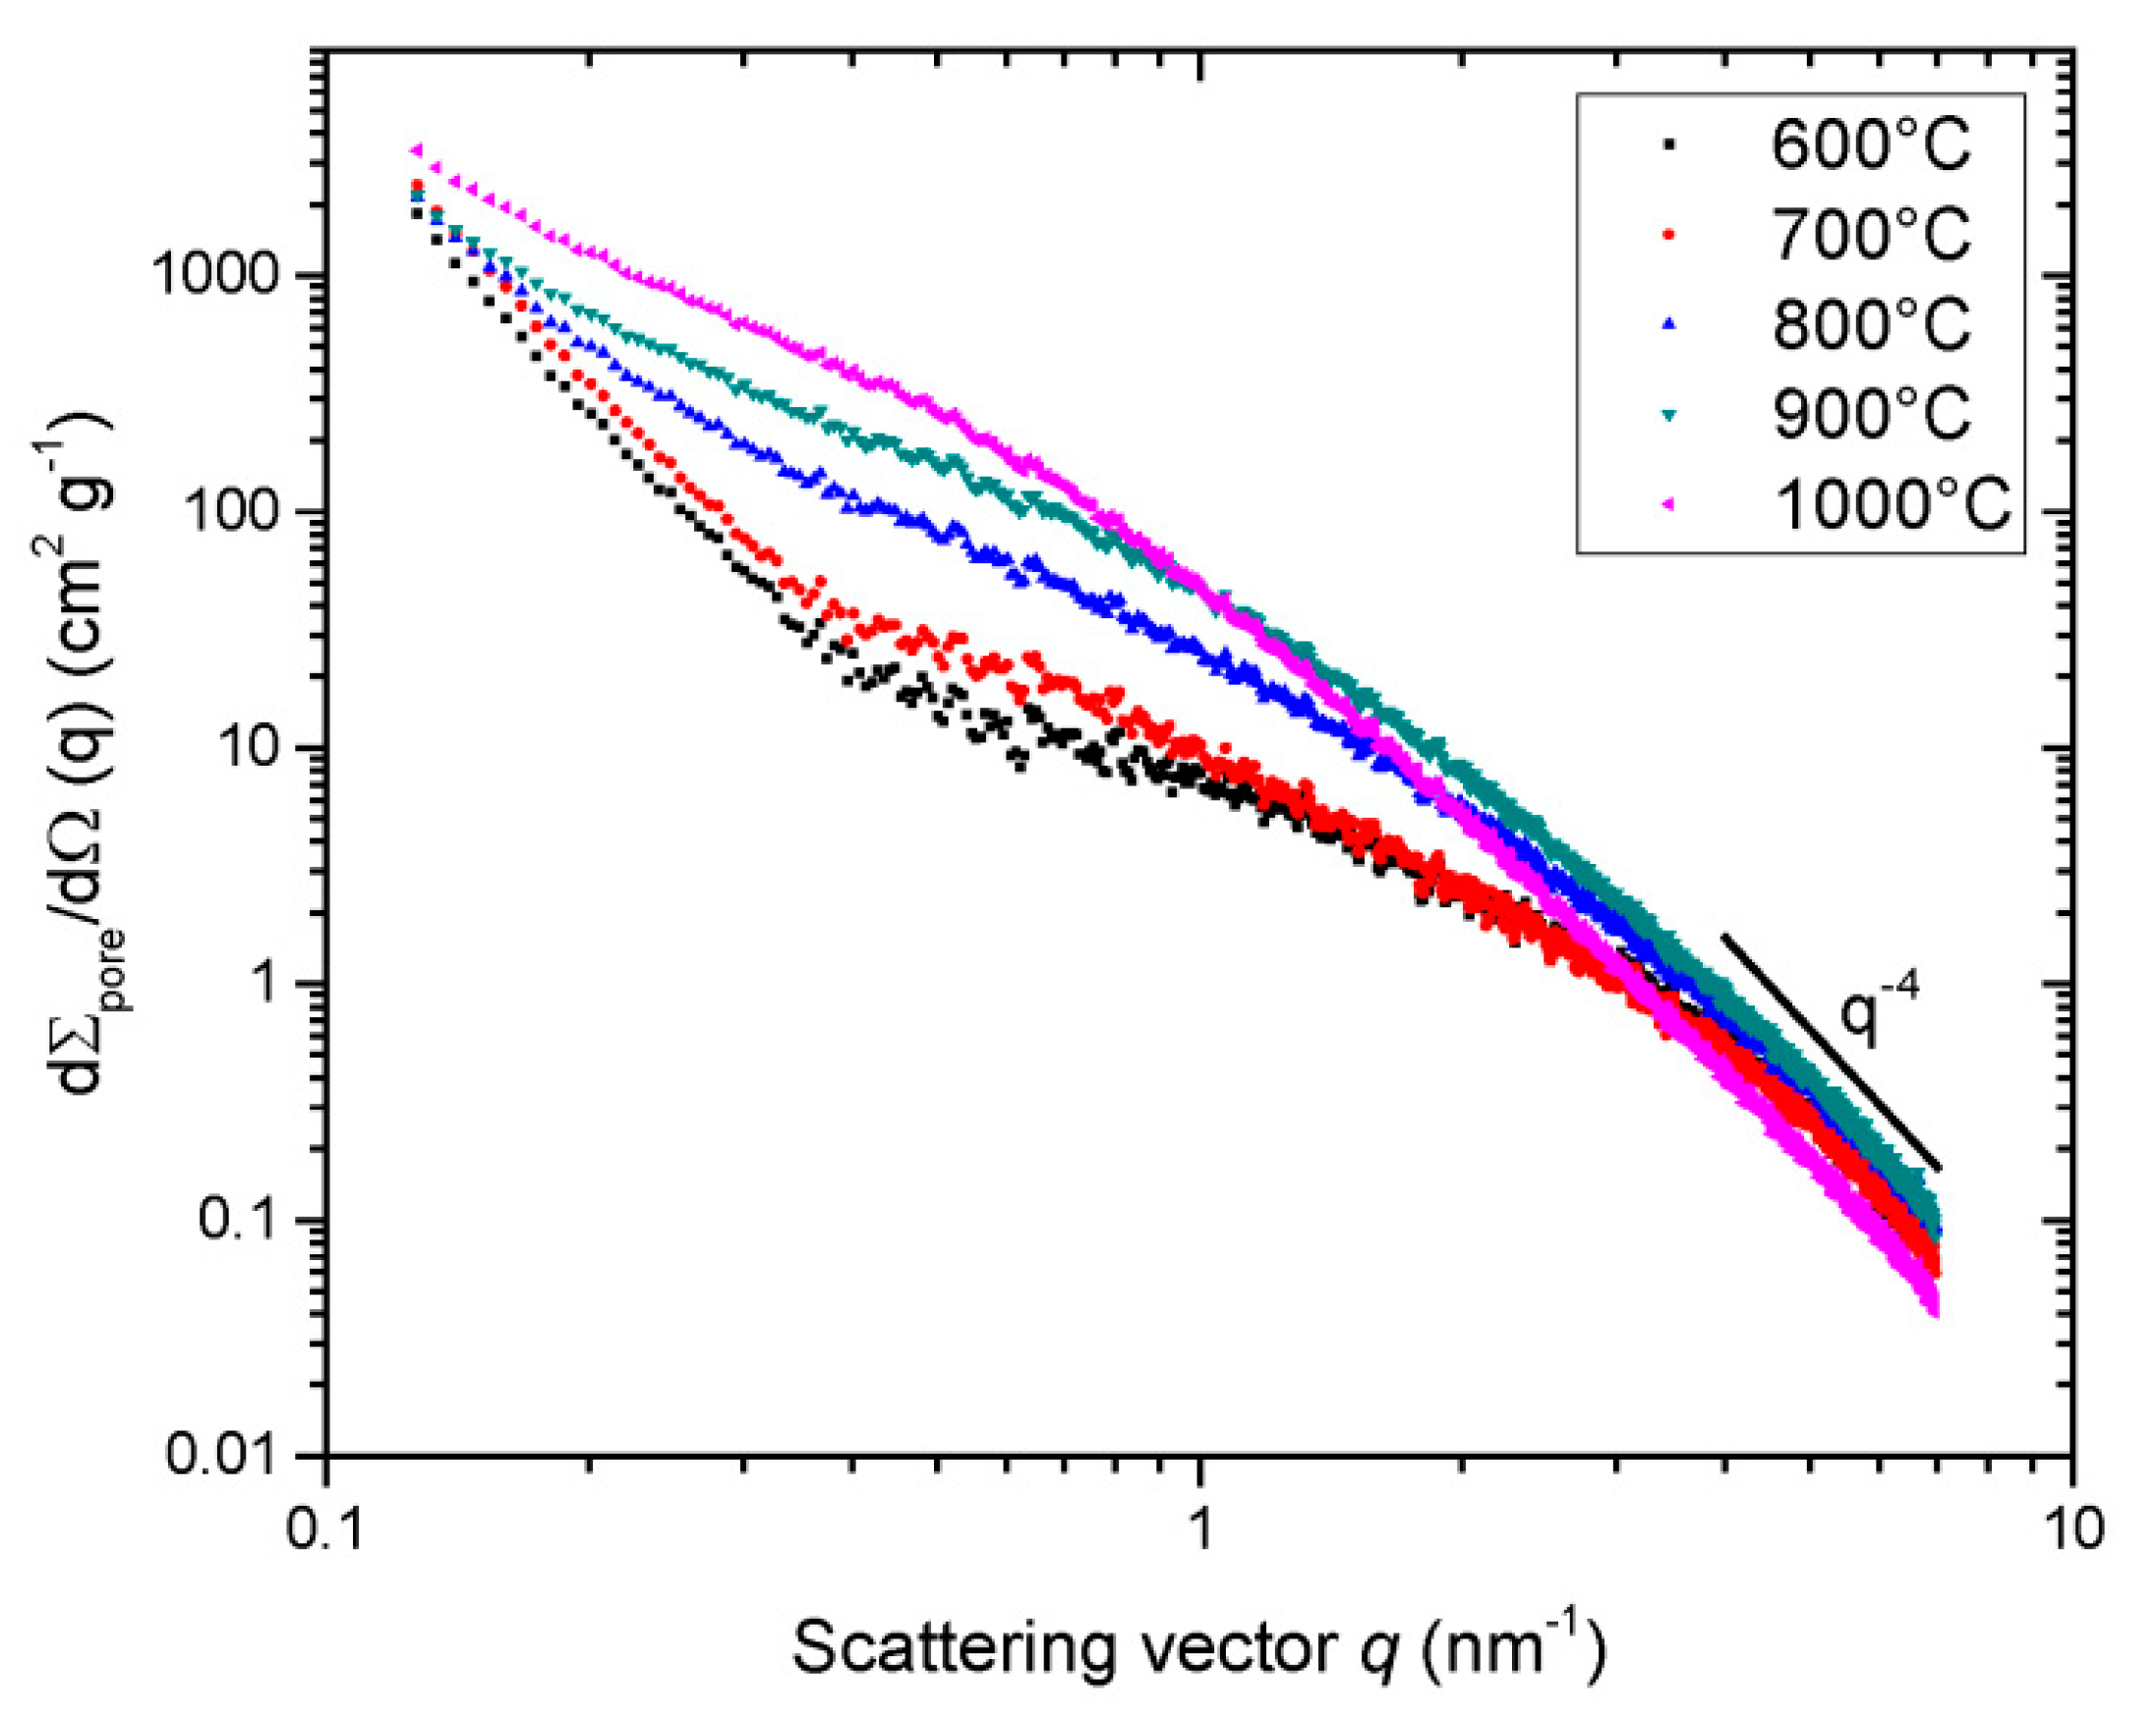
Analysis of CDCs by SAXS [75]. The fluctuation-induced contributions (see the discussion of Figure 2 and Figure 3) have been subtracted from the measured scattering intensities. Hence, the scattering patterns shown in this graph are exclusively associated to the pores in a two-phase system. The color coding given in the graph refer to the different temperatures at which the materials have been synthesized [25,75]. For all CDCs, the final slope q−4 was restored at the high scattering angles (see the discussion of Equation (4) above). Reproduced with permission from [75] copyright © 2019, Elsevier.
Figure 4.
Analysis of CDCs by SAXS [75]. The fluctuation-induced contributions (see the discussion of Figure 2 and Figure 3) have been subtracted from the measured scattering intensities. Hence, the scattering patterns shown in this graph are exclusively associated to the pores in a two-phase system. The color coding given in the graph refer to the different temperatures at which the materials have been synthesized [25,75]. For all CDCs, the final slope q−4 was restored at the high scattering angles (see the discussion of Equation (4) above). Reproduced with permission from [75] copyright © 2019, Elsevier.

Figure 5.
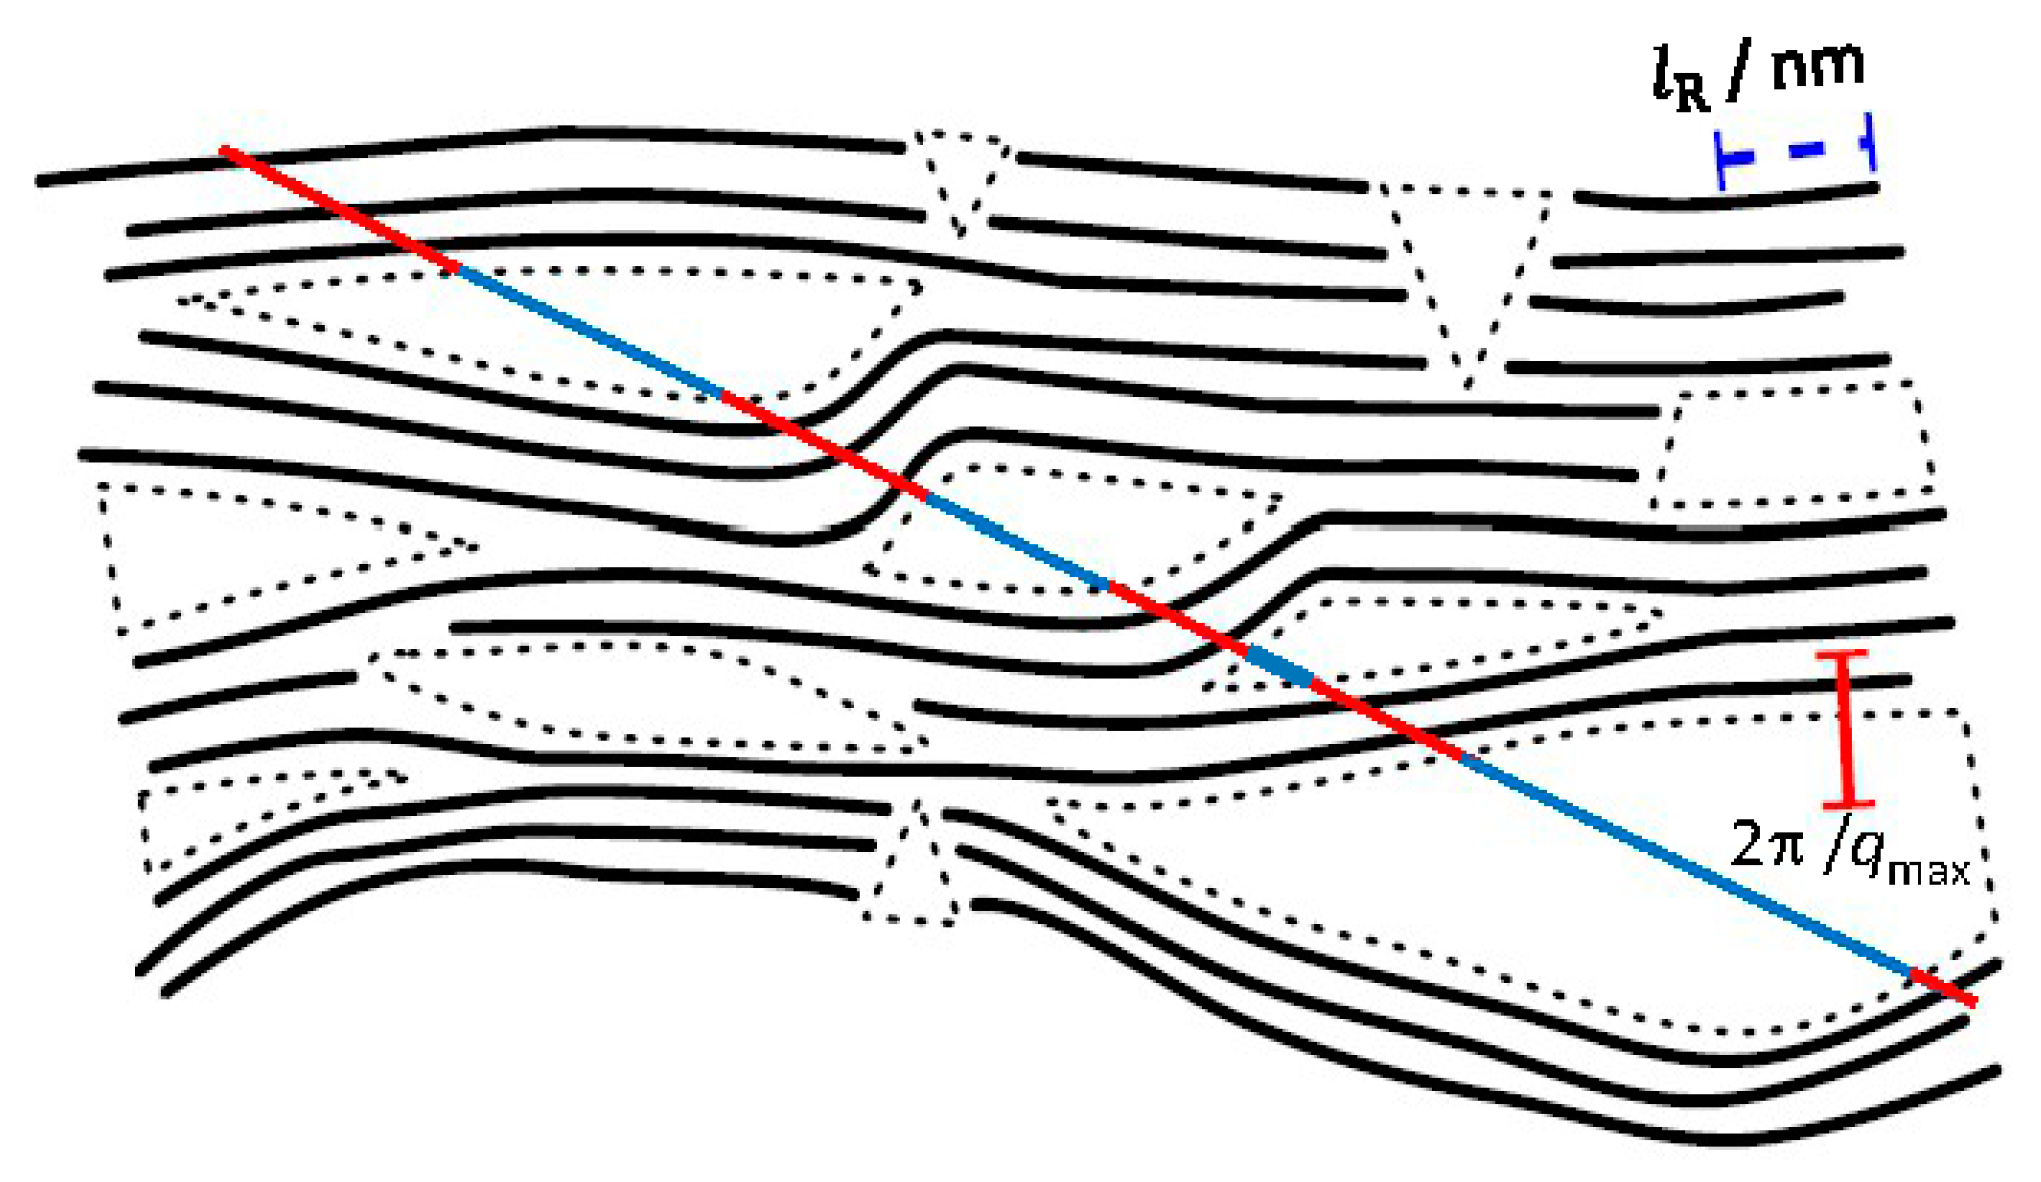
Nanostructure of CDCs described in terms of the chord length distribution [75]. The definition of a chord in partially ordered materials: Contributions to from chords that go through the pores (blue solid lines) and chords that go through the solid pore walls (red solid lines), as noted in Figure. This figure also serves for the visualization of the structure of the CDCs on the nanoscopic level. Reproduced with permission from [75] copyright © 2019, Elsevier.
Figure 5.
Nanostructure of CDCs described in terms of the chord length distribution [75]. The definition of a chord in partially ordered materials: Contributions to from chords that go through the pores (blue solid lines) and chords that go through the solid pore walls (red solid lines), as noted in Figure. This figure also serves for the visualization of the structure of the CDCs on the nanoscopic level. Reproduced with permission from [75] copyright © 2019, Elsevier.

Figure 6.
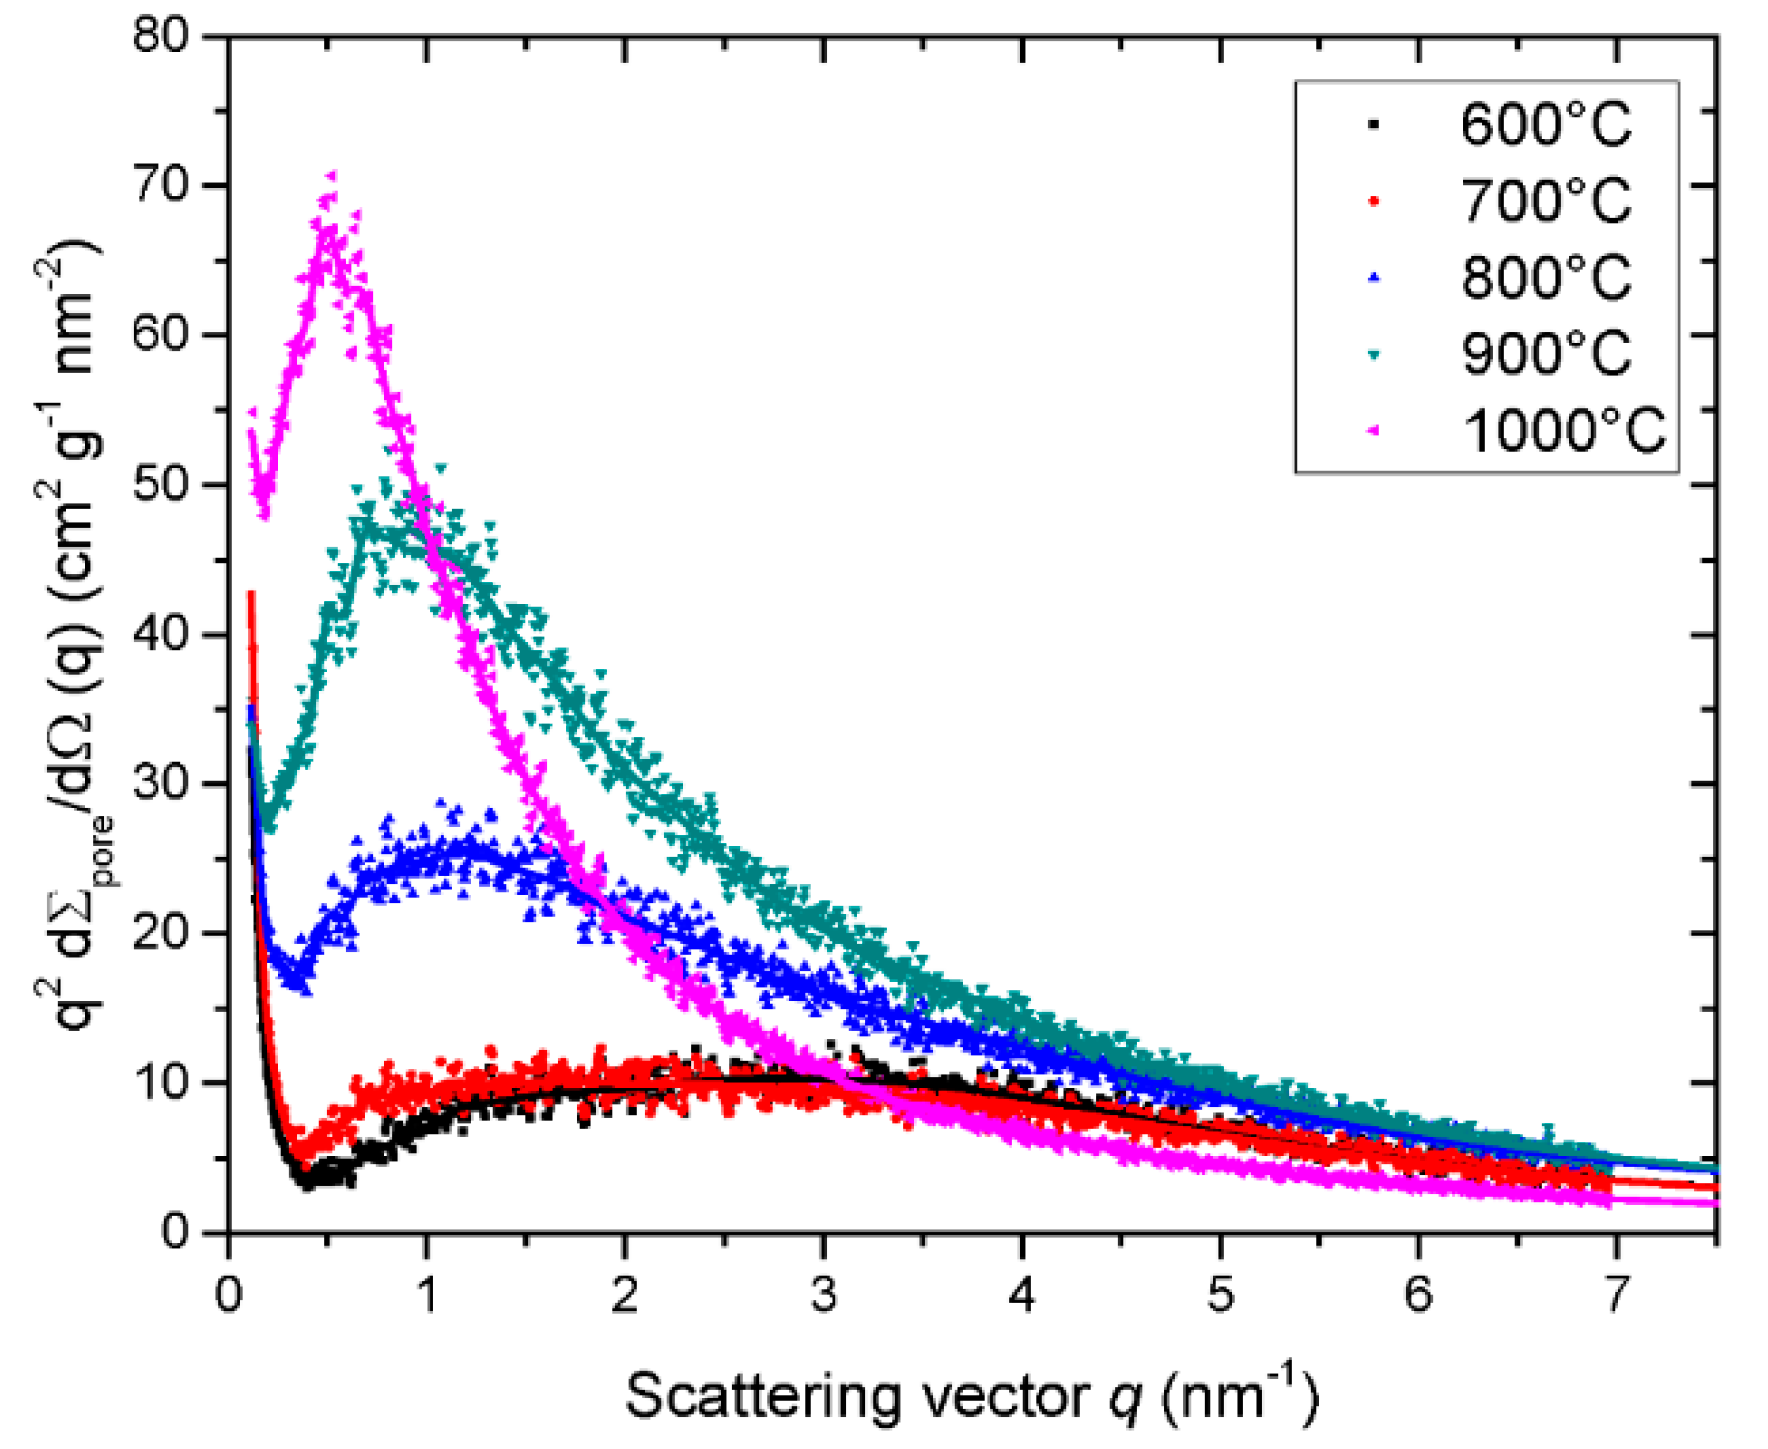
Analysis of CDCs by SAXS in terms of the chord length distribution. Kratky plots of the pore scattering data from Figure 4 vs. scattering vector. The solid lines display the respective fits by the chord length distribution shown in Figure 7. Table 1 summarizes the parameters derived from this analysis. The color coding indicated in the graph refers to the different temperatures at which the CDCs have been synthesized. Reproduced with permission from [75] copyright © 2019, Elsevier.
Figure 6.
Analysis of CDCs by SAXS in terms of the chord length distribution. Kratky plots of the pore scattering data from Figure 4 vs. scattering vector. The solid lines display the respective fits by the chord length distribution shown in Figure 7. Table 1 summarizes the parameters derived from this analysis. The color coding indicated in the graph refers to the different temperatures at which the CDCs have been synthesized. Reproduced with permission from [75] copyright © 2019, Elsevier.

Figure 7.
Analysis of the CDCs by SAXS. The chord length distribution derived from SAXS data (see Figure 4) is plotted against the length of the chords. The color coding in the graph refers to the different temperatures at which these CDCs have been synthesized (see also the discussion of Figure 6 above). Reproduced with permission from [75] copyright © 2019, Elsevier.

Figure 8.
Comparison of the RP-20 carbon measured by SAXS on a SAXSess (Anton Paar) (black symbols) and SANS at the small-angle scattering instrument V4 (cold neutron guide of Helmholtz-Zentrum Berlin—BER II) (red symbols). The SAXS data shown are scaled by the contrast factor 6.47. The corrected SAXS data from Figure 1 and SANS data were normalized to mass as indicated in Equation (1).

Figure 9.
Analysis of carbonaceous nanomaterials by SANS: The scattering curves of the RP-20 carbon obtained from dry powder as measured (black symbols). The corrected scattering curves for RP-20 powder filled with deuterated toluene (C7D8) are shown by blue symbols and RP-20 powder filled with deuterated water (D2O) by red symbols. All intensities have been corrected using the respective volume fractions as noted in Figure. Reproduced with permission from [74] copyright © 2019, Elsevier.


Table 1.
The comparison of structural parameters deduced from SAXS measurements of different carbonaceous materials: The three dimensional fluctuation of scattering contribution , invariant , Porod constant , inner surface area , porosity , number-average chord length , mean chord length of the pore and the carbon matrix , weight-averaged chord length , ansiometric ratio , lateral correlation length , degree of angularity , and the degree of disorder . Reproduced with permission from [73,74,75] copyright © 2019, Elsevier.
| Property | 600 [75] | 700 [75] | 800 [75] | 900 [75] | 1000 [75] | ACN [73] | RP-20 [74] |
|---|---|---|---|---|---|---|---|
| /cm2 g−1 nm−2 | 10.8 ± 0.2 | 9.7 ± 0.2 | 7.6 ± 0.2 | 7.9 ± 0.1 | 2.23 ± 0.03 | 7.77 ± 0.09 | 10.1 ± 0.1 |
| /cm2 g−1 nm−3 | 3.9 ± 0.2 | 4.0 ± 0.2 | 6.8 ± 0.2 | 9.0 ± 0.2 | 6.8 ± 0.1 | 4.2 ± 0.1 | 3.6 ± 0.2 |
| /cm2 g−1 nm−4 | 0.112 ± 0.004 | 0.110 ± 0. 004 | 0.152 ± 0.005 | 0.158 ± 0.002 | 0.072 ± 0.001 | 0.126 ± 0.002 | 0.098 ± 0.002 |
| /m2 g−1 | 965 ± 102 | 950 ± 100 | 1310 ± 137 | 1363 ± 137 | 621 ± 62 | 1090 ± 110 | 842 ± 86 |
| 0.27 ± 0.02 | 0.28 ± 0.02 | 0.47 ± 0.03 | 0.63 ± 0.03 | 0.47 ± 0.03 | 0.29 ± 0.02 | 0.25 ± 0.02 | |
| /nm | 0.57 ± 0.04 | 0.59 ± 0.04 | 0.72 ± 0.03 | 0.92 ± 0.02 | 1.52 ± 0.02 | 0.54 ± 0.03 | 0.59 ± 0.03 |
| /nm | 0.58 ± 0.1 | 0.63 ± 0.1 | 0.74 ± 0.2 | 0.93 ± 0.2 | 1.71 ± 0.1 | 0.53 ± 0.1 | 0.62 ± 0.06 |
| /nm | 0.78 ± 0.6 | 0.81 ± 0.05 | 1.35 ± 0.1 | 2.5 ± 0.2 | 2.9 ± 0.1 | 0.76 ± 0.05 | 0.79 ± 0.04 |
| /nm | 2.1 ± 0.2 | 2.1 ± 0.2 | 1.5 ± 0.1 | 1.5 ± 0.1 | 3.2 ± 0.2 | 1.9 ± 0.2 | 2.4 ± 0.2 |
| /nm | 4.1 ± 0.3 | 5.2 ± 0.3 | 4.5 ± 0.2 | 4.9 ± 0.1 | 9.7 ± 0.1 | 1.2 ± 0.1 | 0.91 ± 0.1 |
| 7.2 ± 0.02 | 8.81 ± 0.09 | 6.25 ± 0.02 | 5.33 ± 0.01 | 6.38 ± 0.02 | 2.22 ± 0.06 | 1.54 ± 0.09 | |
| /nm | 4.0 ± 0.2 | 9.0 ± 0.5 | >20 | >20 | >20 | 1.0 ± 0.1 | 1.2 ± 0.1 |
| /nm−1 | 1.24 ± 0.04 | 1.16 ± 0.05 | 1.13 ± 0.03 | 0.92 ± 0.02 | 0.25 ± 0.1 | 1.0 ± 0.02 | 0.75 ± 0.08 |
| 0.36 ± 0.03 | 0.32 ± 0.03 | 0.25 ± 0.02 | 0.26 ± 0.02 | 0.074 ± 0.004 | 0.25 ± 0.02 | 0.33 ± 0.03 |
Table 2.
The neutron and X-ray scattering length densities [74].
Table 2.
The neutron and X-ray scattering length densities [74].
| Carbon/Contrast Matching Agent | Density (g cm−3) at 25 °C | Neutron SLD (10−6 Å2) | X-ray SLD (10−6 Å2) |
|---|---|---|---|
| Carbon | 2 | 6.334 | 16.159 |
| Deuterated Water | 1.107 | 6.375 | 9.429 |
| Deuterated Toluene | 0.943 | 5.664 | 8.008 |
| Sulfur | 2.07 | 1.107 | 17.896 |
| Deuterated p-Xylene | 0.861 | 5.350 | 7.311 |
Publisher’s Note: MDPI stays neutral with regard to jurisdictional claims in published maps and institutional affiliations. |
© 2020 by the authors. Licensee MDPI, Basel, Switzerland. This article is an open access article distributed under the terms and conditions of the Creative Commons Attribution (CC BY) license (http://creativecommons.org/licenses/by/4.0/).
Share and Cite
MDPI and ACS Style
Härk, E.; Ballauff, M. Carbonaceous Materials Investigated by Small-Angle X-ray and Neutron Scattering. C 2020, 6, 82. https://0-doi-org.brum.beds.ac.uk/10.3390/c6040082
AMA Style
Härk E, Ballauff M. Carbonaceous Materials Investigated by Small-Angle X-ray and Neutron Scattering. C. 2020; 6(4):82. https://0-doi-org.brum.beds.ac.uk/10.3390/c6040082
Chicago/Turabian StyleHärk, Eneli, and Matthias Ballauff. 2020. "Carbonaceous Materials Investigated by Small-Angle X-ray and Neutron Scattering" C 6, no. 4: 82. https://0-doi-org.brum.beds.ac.uk/10.3390/c6040082
Note that from the first issue of 2016, this journal uses article numbers instead of page numbers. See further details here.