Article

Carbide-Derived Carbons: WAXS and Raman Spectra for Detailed Structural Analysis

1
Institute of Chemistry, University of Tartu, Ravila 14a, 50411 Tartu, Estonia
2
Institute of Physical Chemistry, Justus Liebig University, Heinrich-Buff-Ring 17, 35392 Giessen, Germany
3
Institute of Ecology and Earth Sciences, University of Tartu, Ravila 14a, 50411 Tartu, Estonia
*
Author to whom correspondence should be addressed.
Submission received: 24 February 2021 / Revised: 17 March 2021 / Accepted: 18 March 2021 / Published: 20 March 2021
(This article belongs to the Special Issue Carbide Derived Carbons)

Abstract

:
Quick characterization methods to determine the structure of carbon materials are sought after for a wide array of technical applications. In this study we present the combined analysis of the structure of carbide-derived carbons (CDCs) with Raman spectroscopy and wide-angle X-ray scattering (WAXS) methods. We present the optimal deconvolution method to be used for the detailed analysis of Raman spectroscopy data of CDCs and comparison to corresponding WAXS results is made. For a broad set of CDCs both WAXS and Raman spectroscopy data showed that the average graphene layer extent increases with synthesis temperature of CDC, while the coherent domain lengths obtained from Raman spectroscopy higher by an average of 4.4 nm. In addition, the presence of correlations between the parameters (D-band width and the parameter A∑D/A∑G) from Raman spectroscopy and the synthesis temperature are established. Based on the WAXS and Raman spectra data analysis the strong influence of the precursor carbide structure on the graphitization pathway is shown.

1. Introduction

Carbon materials are vital components to a multitude of applications, from energy storage and conversion to gas separation and filtration systems. In case of chemically pure carbons the suitability of a certain carbon material for a specific application is determined by its structural properties, e.g., porosity parameters, particle size and its distribution, level of graphitization, etc. [1,2,3,4]. For the use of a large variety of carbons in applications with different requirements for the structure of carbon it is vital to be able to characterize novel synthesized carbons with quick, relatively cheap, and available quantitative analytical methods.
Carbide-derived carbons (CDCs) are unique model carbon materials, since they contain little to no impurities and their structure can be easily influenced within range from very disordered to well-organized nano-graphitic particles. The CDCs have been successfully used in electrochemical applications such as electrode materials for supercapacitors [5,6,7,8,9,10], as catalyst carriers for polymer-electrolyte membrane fuel cells (PEMFC) [11] and in other applications such as gas adsorption [12,13,14]. In addition, the structure of some CDCs has been investigated in-depth with small-angle X-ray and neutron scattering methods. [15,16] While the CDC materials in this study have been introduced and reported previously, the present study aims at elucidating their sp2 microstructure in more detail, with the emphasis on the interpretation of the Raman spectra.
The shape and intensity of Raman spectrum of carbon is strongly dependent on the synthesis method and heat-treatment temperature applied for the preparation of the carbon powder [17,18,19]. This would make the Raman spectroscopy one of the best and most sensitive methods for the characterization of the crystallographic and electronic structure of carbon materials. The first order Raman spectra of carbon materials exhibits two very pronounced and well-known bands, the D- (disordered) and G- (graphitic) band. The G-band corresponds to one-phonon Raman scattering process at the 1st Brillouin zone center Γ and consists of the collective in-plane bond stretching of the polyaromatic carbon atoms (E2g symmetry) [17,20]. The D-band (~1250–1400 cm−1) corresponds to the excitation of the totally symmetric transversal phonon A1 located near the high symmetry phonon points (K or K’). This activation process (intravalley Raman mode) involves electron-phonon interaction mediated by defects [20,21]. Thus, the G-band originates from the ordered graphite-like areas, and the D-band originates from the edge of the ordered areas and from the vicinity of different defects. Therefore, as the quantity of defects increases, the intensity of the D-band (ID) and, thus, also the ratio of intensity ID/IG increases (IG is the intensity of the G-band). This was discovered by Tuinstra and Koenig in 1970 [17] and the ratio ID/IG has been extensively used as an indicator of the ordering or the characteristic connected with defect density in carbon materials [5,6,9,22,23]. However, the situation is more complicated in the case of disordered and/or partially graphitized carbons, where the first order Raman spectrum is rather complex. Namely, it seems to contain more vibrational bands than just the G- and the D-band [24,25,26,27] and, thus, the deconvolution of the spectrum is not straightforward. Most commonly, two extra functions are added to obtain a reasonable fit to the experimental first order region of the Raman spectrum, at ~1150 cm−1, at ~1450 cm−1 and at ~1620 cm−1 [24,25,27,28]. One of the explanations of these extra bands is that they are analogous to the D- and the G-band, but originate from the highly disordered areas and, thus, because of the softening of the phonon modes are present at lower frequencies [27]. Some authors argue, that there is also a D’-band at ~1620 cm−1, even if its tip is not separated from the G-band [18,26]. This means a total of five functions are needed to fit the first-order Raman spectrum of disordered carbons. Thus, there exists several approaches about how many and which sort of fitting functions should be used for the deconvolution of the first order Raman spectra of disordered carbons [23,24,25,26,27,29]. Possibly, using different approaches for various types of disordered carbons is the best solution and there have been some efforts to classify disordered carbons in terms of their graphene layer extent, La, [19,30] or their origin [18,28].
The spectrum deconvolution procedure can have a great impact on the quantitative results obtained about the structure of the studied carbon. Therefore, one of the objectives of this work is to compare different applied deconvolution approaches [26,27,29] for getting quantitative information (widths, areas of bands, etc.) about the Raman spectrum of carbide-derived carbons (CDC) synthesized at different temperatures. The quantitative parameters of the CDCs from Raman spectra (widths of the D- and the G-band, ID/IG, etc.) are then compared to the results obtained from the WAXS pattern analysis with the algorithm derived by Ruland and Smarsly [31]. This algorithm models the whole WAXS pattern, fitting a total of 14 interlayer and intralayer parameters, including the lateral extent of the graphene sheets (La).
In this study CDCs synthesized from six different precursor carbides (Mo2C, TiC, WC, VC, Ta4HfC5, WTiC2) at different temperatures, Tsyn ranging from 500 °C to 1100 °C, have been characterized in detail. This enables to study the evolution of spectra in a series of materials for which only one parameter (precursor carbide or synthesis temperature) has been varied systematically. The CDC powders are disordered porous materials with specific surface areas ranging from ~500 m2 g−1 to 2000 m2 g−1 [5,6,7,8,9].

2. Materials and Methods

2.1. Carbide-Derived Carbons

Porous carbide-derived carbon powders (so-called CDCs) have been prepared using the method of high-temperature chlorination of binary carbides (TiC, α-WC, VC, Mo2C from Sigma-Aldrich, Steinheim, Germany) and ternary carbides (Ta4HfC5, WTiC2 from Goodfellow, Huntingdon, UK). The full details of this process may be found elsewhere [5,6,7,8,9,10], but are briefly outlined here for convenience.
The chlorination reaction of carbide was performed in a flow of Cl2 (99.99%, Linde Gas, Solna, Sweden) at a fixed temperature, ranging from 500 to 1100 °C (Table 1). The obtained CDC powder was then treated with H2 at 800 °C (or 900 °C) to thoroughly remove residues of chlorine, chloride, and all possible functional groups from the CDC surface. Resulting carbons are noted as C-X Y in the text, where X denotes the precursor carbide and Y denotes the synthesis temperature in degrees of Celsius scale. The resulting CDC powders are disordered porous materials with specific surface areas ranging from ~500 m2 g−1 to 2000 m2 g−1.

2.2. Wide-Angle X-Ray Scattering Measurements

The WAXS patterns of carbon powders were measured using a Bruker D8 Advance diffractometer (Bruker) with a Cu Kα radiation, a Goebel mirror, 2.5° Soller slits and LynxEye 1D detector and Bragg-Brentano geometry. WAXS data was fitted with the algorithm derived by Ruland and Smarsly [31] using the CarbX software (https://www.uni-giessen.de/CarbX accessed on 21 March 2021) [32].

2.3. Raman Spectroscopy

The Raman spectroscopy measurements were conducted on an inVia micro-Raman spectrometer (Renishaw, Kingswood, UK) for all CDCs with excitation wavelength, λL, 514 nm. In addition, the Raman spectrum of C-SiC 1000, C-Mo2C 1000, and C-Mo2C 700 powders were measured with different fixed wavelengths λL = 457, 488, 633, and 785 nm. While measuring the spectrum, the incident power was kept low (~1 mW at the sample) not to damage the carbon sample. Each spectrum analyzed represents the average of at least three measurements from different regions selected on the same sample.
Detailed deconvolution of the first order Raman spectra has been conducted using four different approaches using OriginPro 2016 software (OriginLab, San Francisco, CA, USA). Prior to deconvolution, the baseline (4th order polynomial function) has been subtracted from the spectrum under analysis. For the fitting of the experimental data, the Lorentzian function (henceforth noted as L) corresponds to Equation (1),
L = y x = 2   S p π   FWHM 4 x x 0 2 + FWHM 2   ,
where y(x) is the intensity, Sp is the peak area, x is the wavenumber, x0 is the wavenumber of the peak maximum. FWHM is the full width at half maximum of the peak.
The Gaussian function (henceforth noted as G) follows the equation
G = y x = S p e 4   ln 2 x x 0 2 FWHM 2 / ( FWHM   π 4   ln 2 ) .
The Breit-Weigner-Fano (henceforth noted as BWF) shape is expressed by
BWF = y x = y max   1 + x x 0 q   FWHM 2 / ( 1 + x x 0 FWHM 2 )   ,
where q is a coupling factor (at large q, the function resembles the Lorentzian function).

3. Results

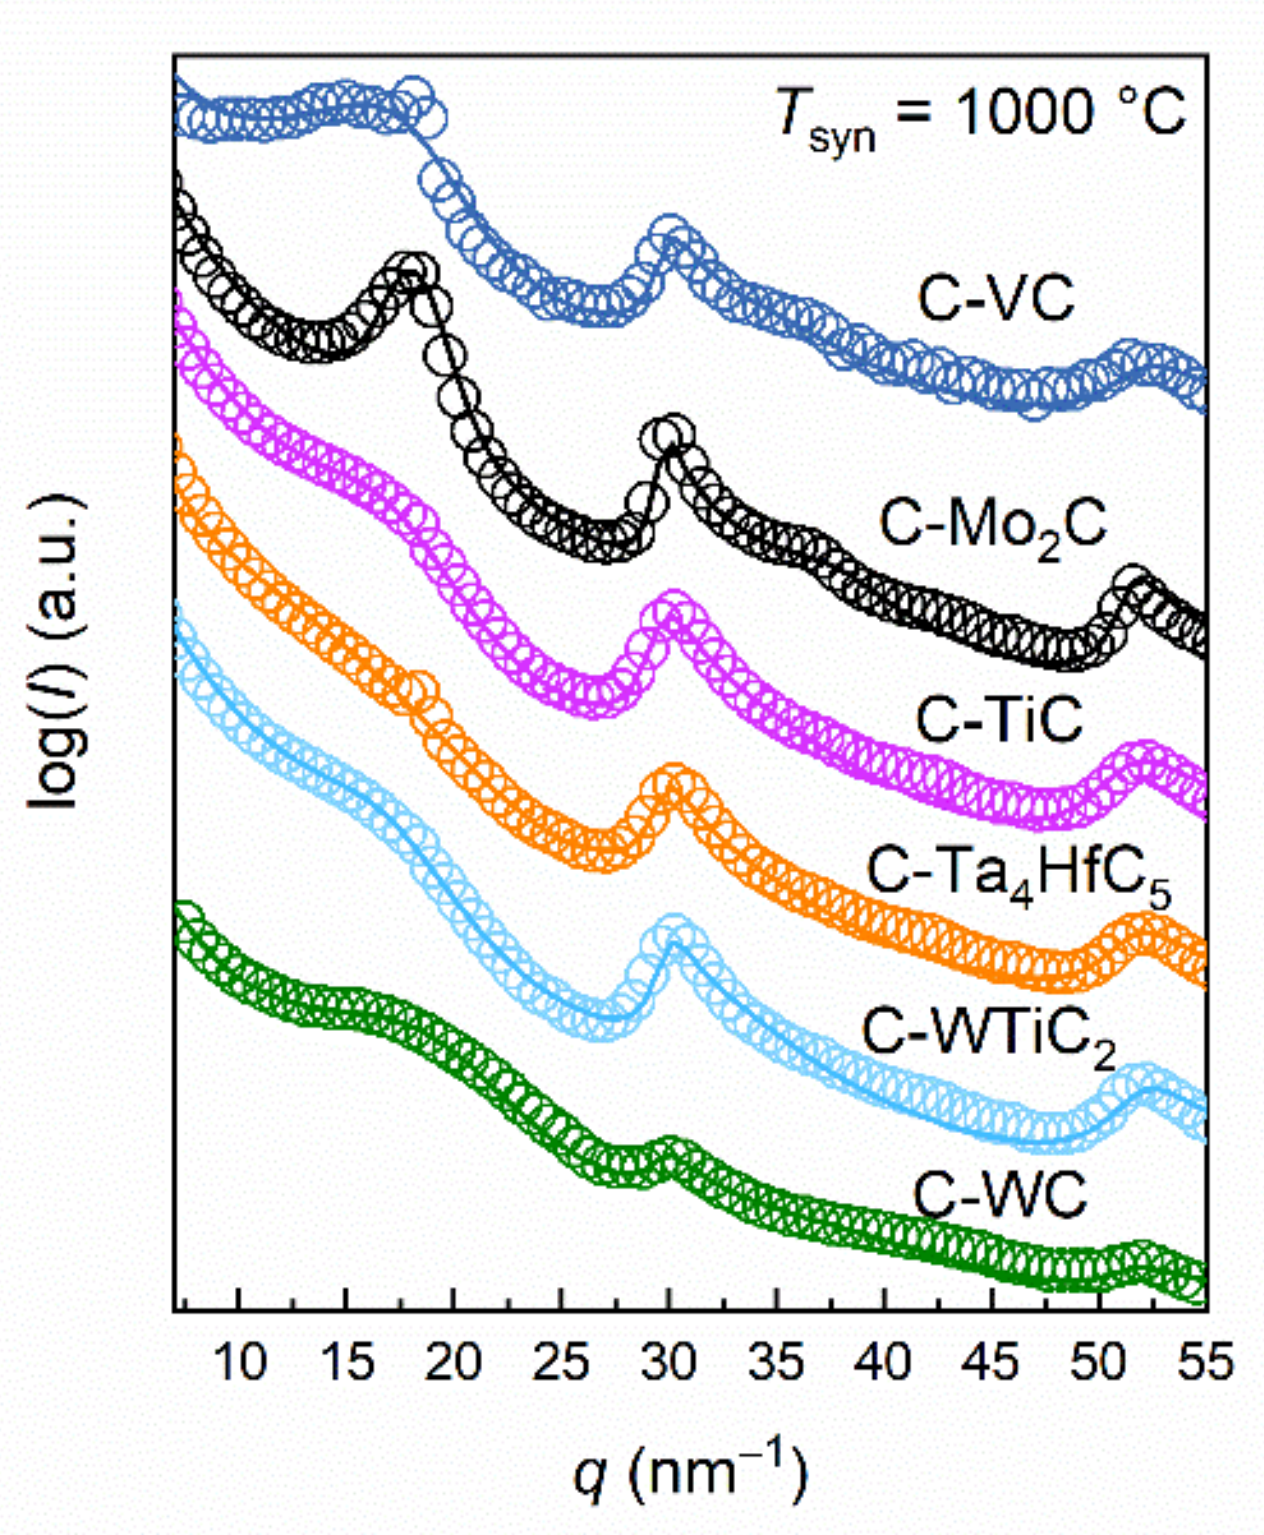
3.1. Wide-Angle X-Ray Scattering

In the Wide-Angle X-ray Scattering (WAXS) patterns of the studied CDCs, there is a diffuse (002) reflection located at scattering vector modulus (The scattering vector modulus, q, is defined as q = 4π sin(θ)/λ, where 2θ is the scattering angle.), q, ~18 nm−1 and a diffuse asymmetric (10) reflection at q ~30 nm−1 (Figure 1, Figure S1 in Supplementary information, SI).The patterns are typical of non-graphitic carbon, since no well-expressed (hkl) reflections can be seen and, thus, were analyzed using the algorithm derived by Ruland and Smarsly [31], which is implemented in the CarbX software [32] (Figure 1). Distinct tendencies of the microstructural parameters to the Tsyn of the CDCs are obtained from fitting of the CDCs WAXS data (Table 2, Table S1 in SI). The size of the graphene layer is described by the graphene layer extent, La, and average chord length, ⟨l⟩. Both La and ⟨l⟩ increase with Tsyn for all CDCs, where the minimal La is 2.5 nm and maximal 8.3 nm in case of C-VC 600 and C-Mo2C 1000, respectively. The standard deviation of the first-neighbor distribution, σ1, which is correlated to the defect density in a graphene layer decreases slightly with Tsyn for most CDCs, from the maximal value of ~0.022 nm to a minimal value of 0.008 nm characteristic of the highest Tsyn. The average C−C bond length, lcc, is mostly constant at 0.141 nm (±0.0006 nm), i.e., typical of aromatic carbons. This means that CDCs derived at higher Tsyn contain larger and more defect-free graphene sheets.
For most CDCs, the interlayer parameters like average stacking size, Lc, and average interlayer spacing, a3, only slight change is seen with Tsyn (Table 2, Table S1). The effect of the stacking not changing significantly with the increase in Tsyn was also shown by Faber et al. and deemed a peculiarity of CDCs [33]. Surprisingly, the exceptions are carbons C-Mo2C and C-VC, where Lc increases and a3 decreases with Tsyn. The average number of graphene layers per stack increases significantly with the increase in Tsyn for C-Mo2C, which refers to the formation of multilayer graphene at higher Tsyn.

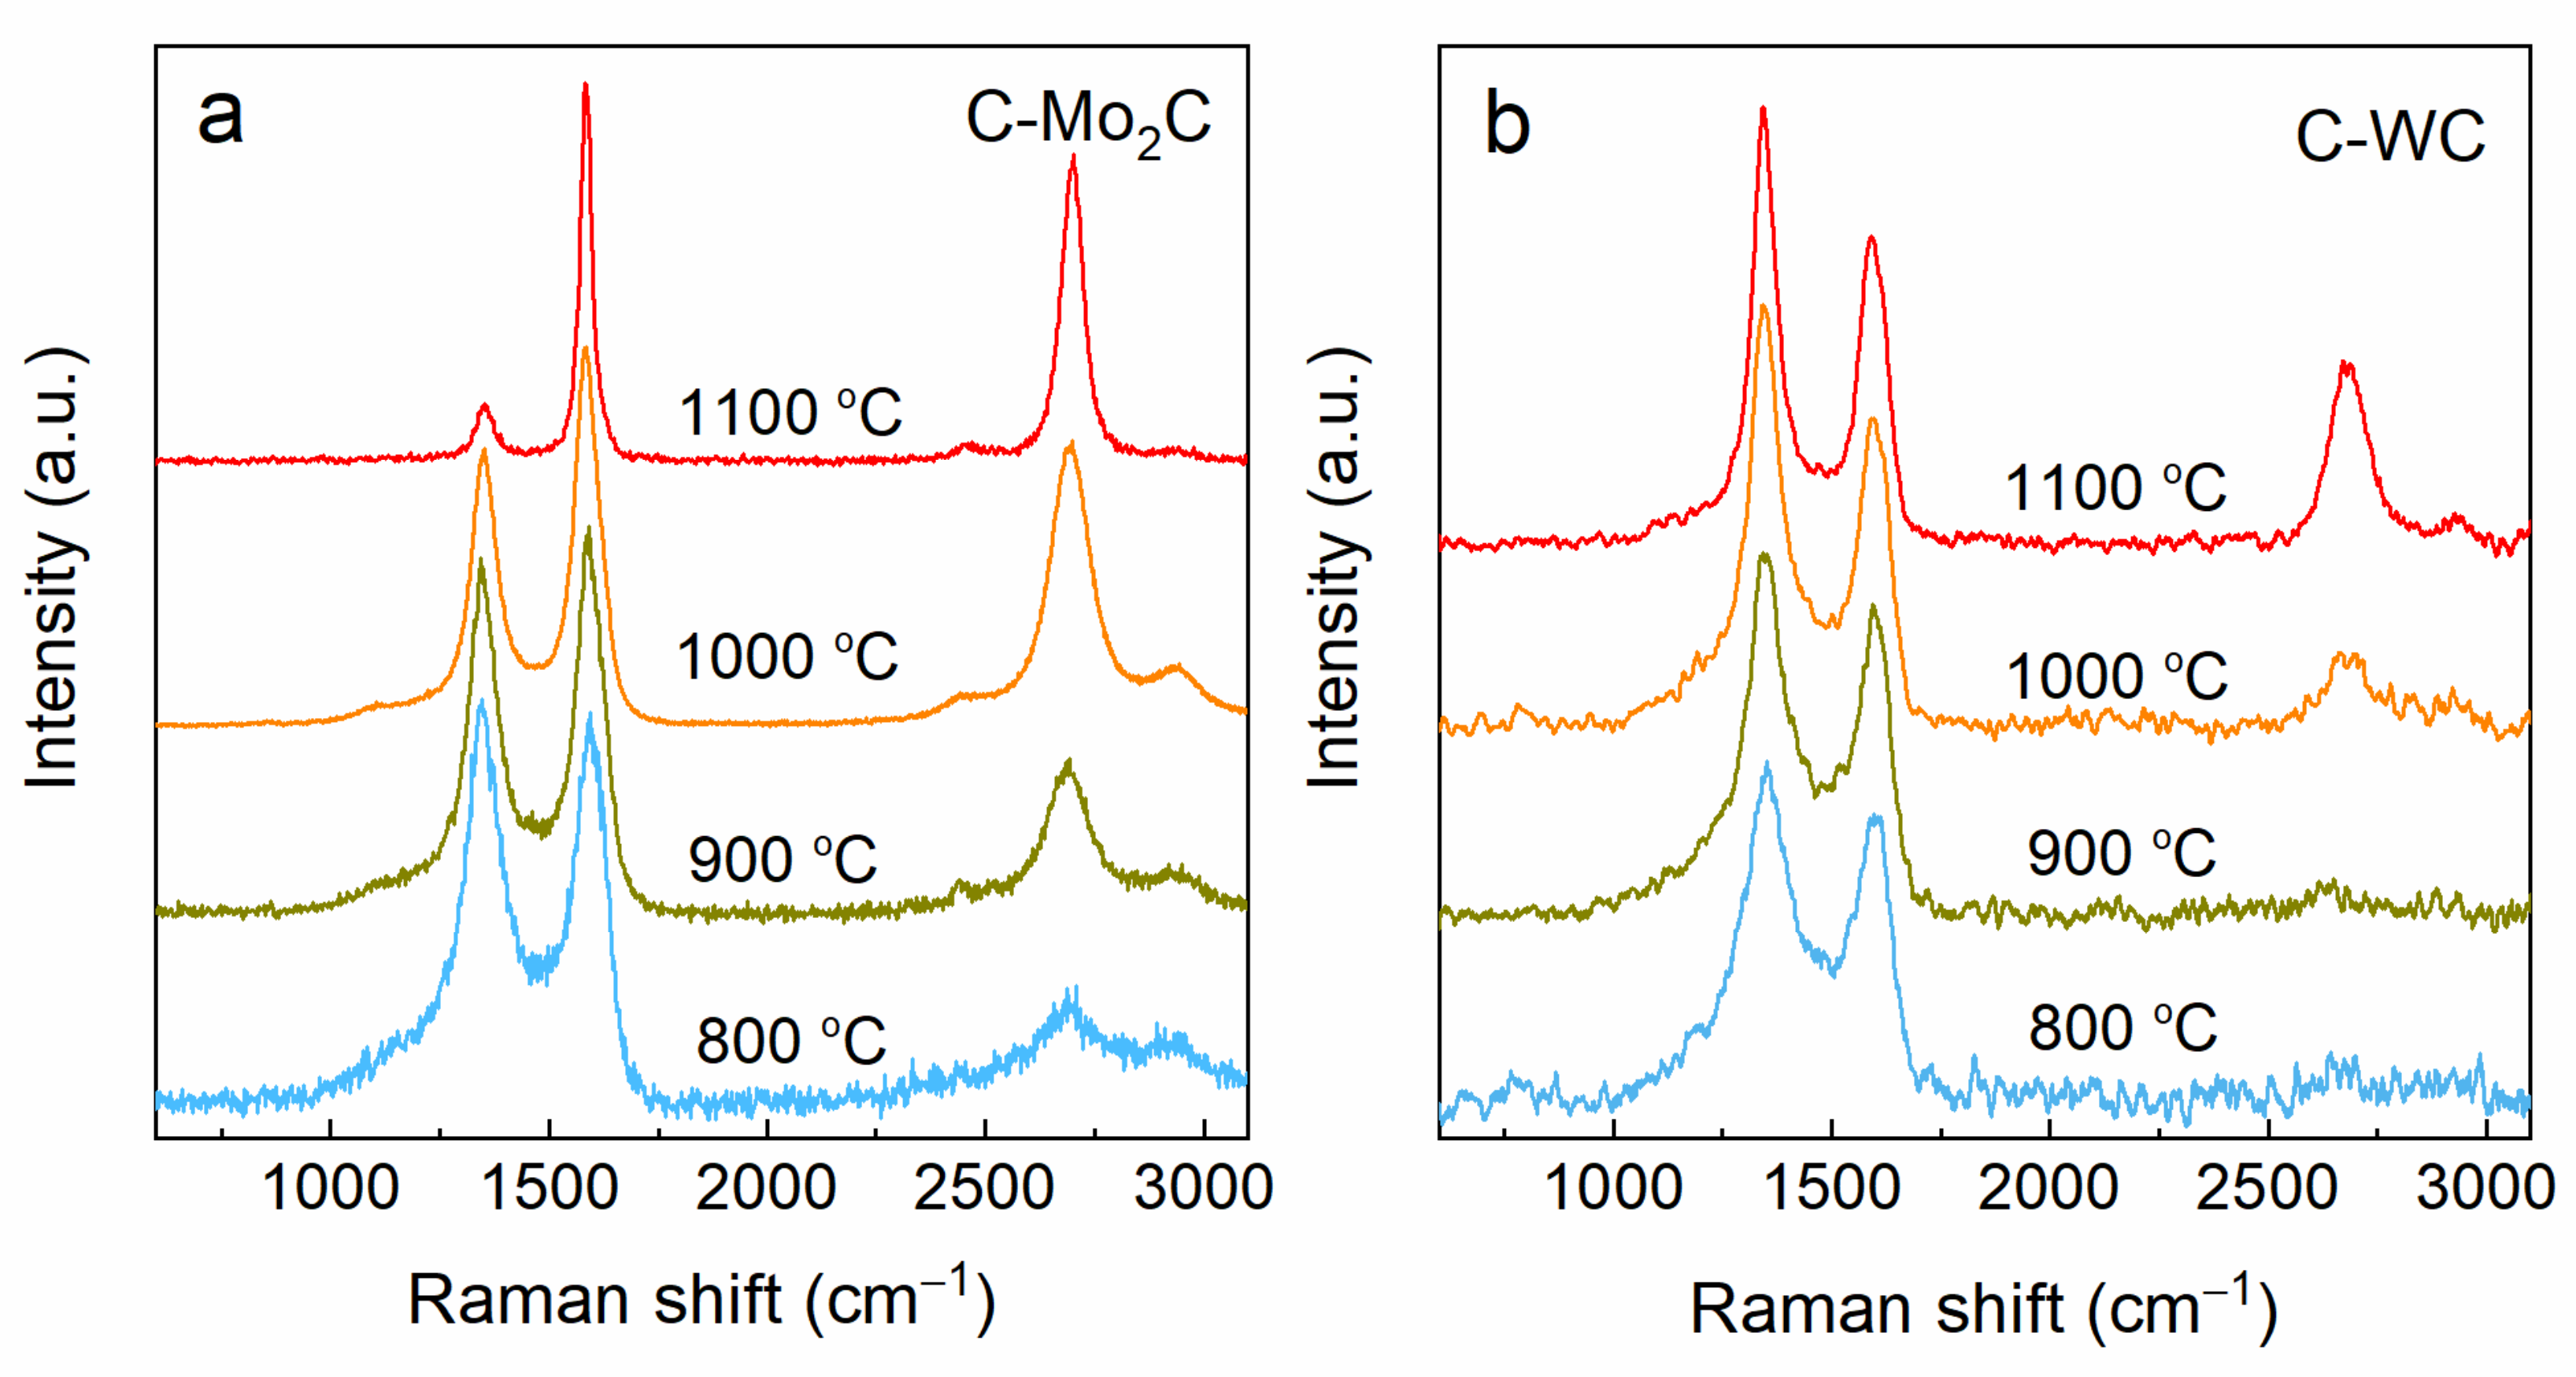
3.2. The Raman Spectra of CDCs: The Stages of Graphitization

With the increase of Tsyn, the D- and G-band become narrower and the intensity between these two bands (at ν~1450 cm−1) decreases. This is related to the increasing ordering of the carbon structure (Figure 2a,b). The D- and G-band raw height ratio, ID/IG, determined directly from the measured spectra, along with the width of the bands, can be used to discern the typical stages along the pathway of transformation from disordered to graphitic structure as defined by Schuepfer et al. [30]. However, while in the latter study the carbons were synthesized via heat-treatment of carbonaceous material at different temperatures, the Tsyn of CDCs has an inherently different effect on the formation of the material than the heat-treatment temperature. Namely, for CDCs the crystalline domains are formed at Tsyn as opposed to reorganizing from previously existing carbonaceous structure. Still, it has been shown for both heat-treated carbonaceous materials and CDCs that the impact of the heating temperature on the structure of the resulting carbon is strongly dependent on the starting material [30,34], i.e., for CDCs the chemical composition and crystallographic structure of the precursor carbide.
Based on the characteristics of the Raman spectra, the CDCs can be divided to Stage I, Stage II and Stage III in the graphitization pathway. The disordered (In the original publication the term „amorphous carbon“ was used, but this refers to carbons with considerable sp3-content (IUPAC [35]), which is not the case for CDCs. ) carbon of Stage I is characterized by broad and overlapping D- and G-bands and ID/IG < In the case of the nanoparticular carbon of Stage II, the D- and G-bands are still broad, but the ID/IG ratio increases further with the increase in the heat-treatment temperature and reaches its maximum value of ID/IG = 1.2−1.Stage III (non-graphitic carbon) is characterized by narrow Raman bands and the decrease of the ID/IG ratio towards zero with the increase in the heat-treatment temperature.
The Raman spectrum of C-WC shows very broad and overlapping bands even at the high Tsyn = 1100 °C (Figure 2b), which corresponds to Stage II (i.e., nanoparticular). C-Mo2C at Tsyn = 1100 °C can be classified as Stage III (i.e non-graphitic, Figure 2a) based on the Raman spectrum. Thus, CDCs derived at the same Tsyn from different carbides can have vastly different structures and the graphitization pathway is strongly dependent on the precursor carbide.
Most of the studied CDCs can be classified as carbons belonging to the Stage II of graphitization based on their Raman spectra (Table 3, Figure S2 in supplementary information, SI). For carbons, which belong to Stage II of graphitization, the increase of the ID/IG ratio is related to the increase in structural order [22,30]. The intensity of the Raman spectra D-band increases in the Stage II of graphitization because the intensity of D-band from the ordered area near the edge/defect is ~7 times greater than the intensity of the D-band originating from the border/defect area itself [27]. Thus, at Stage I of graphitization (i.e., disordered) there are not enough sufficiently ordered hexagonal carbon domains from which the D-band vibrations can effectively originate, i.e., the density of defects is much larger than the coherent carbon domain area. The density of defects decreases in Stage II, allowing for more defect-free areas from which the D-band vibrations are of higher intensity, and thus, the overall D-band intensity increases.
In the second order Raman spectrum of CDCs synthesized at Tsyn ≥ 1000 °C, three distinct bands are seen at ~2440 cm−1, ~2730 cm−1 and ~2920 cmThese bands are attributed to the convolution of the band at 1150 cm−1 and D-band (noted as 1150+D) [36,37], the 2D-band [20,21,38], and convolution of the G-band and the D-band (noted as G+D) [36,39] excitations, respectively. The most prominent feature in the second order Raman spectrum is the 2D-band, which is present in most of the CDCs spectra synthesized at Tsyn ≥ 900 °C. A distinct D + G band is seen only in certain CDCs, which are mostly the ones synthesized at Tsyn ≥ 1000 °C (Figure 2a,b, Figure S2). The 1150+D band is a shoulder at lower wavenumbers from the 2D-band in the spectra of some CDC (Figure 2a,b).
The dispersive behavior of some Raman bands is seen from the spectra measured with different laser excitation wavelengths (Figure S3 in SI). In agreement with the results of previous studies, the D-band frequency upshifts linearly with the increasing excitation laser energy (Elaser) with the slope being about 50 cm−1 eV−1, but the 2D-band frequency upshifts with a slope ~100 cm−1 eV−1 [21,40,41]. The G-band exhibits a non-dispersive behavior and the D + D’ band upshifts by ~15 cm−1 eV−1 [21,41].

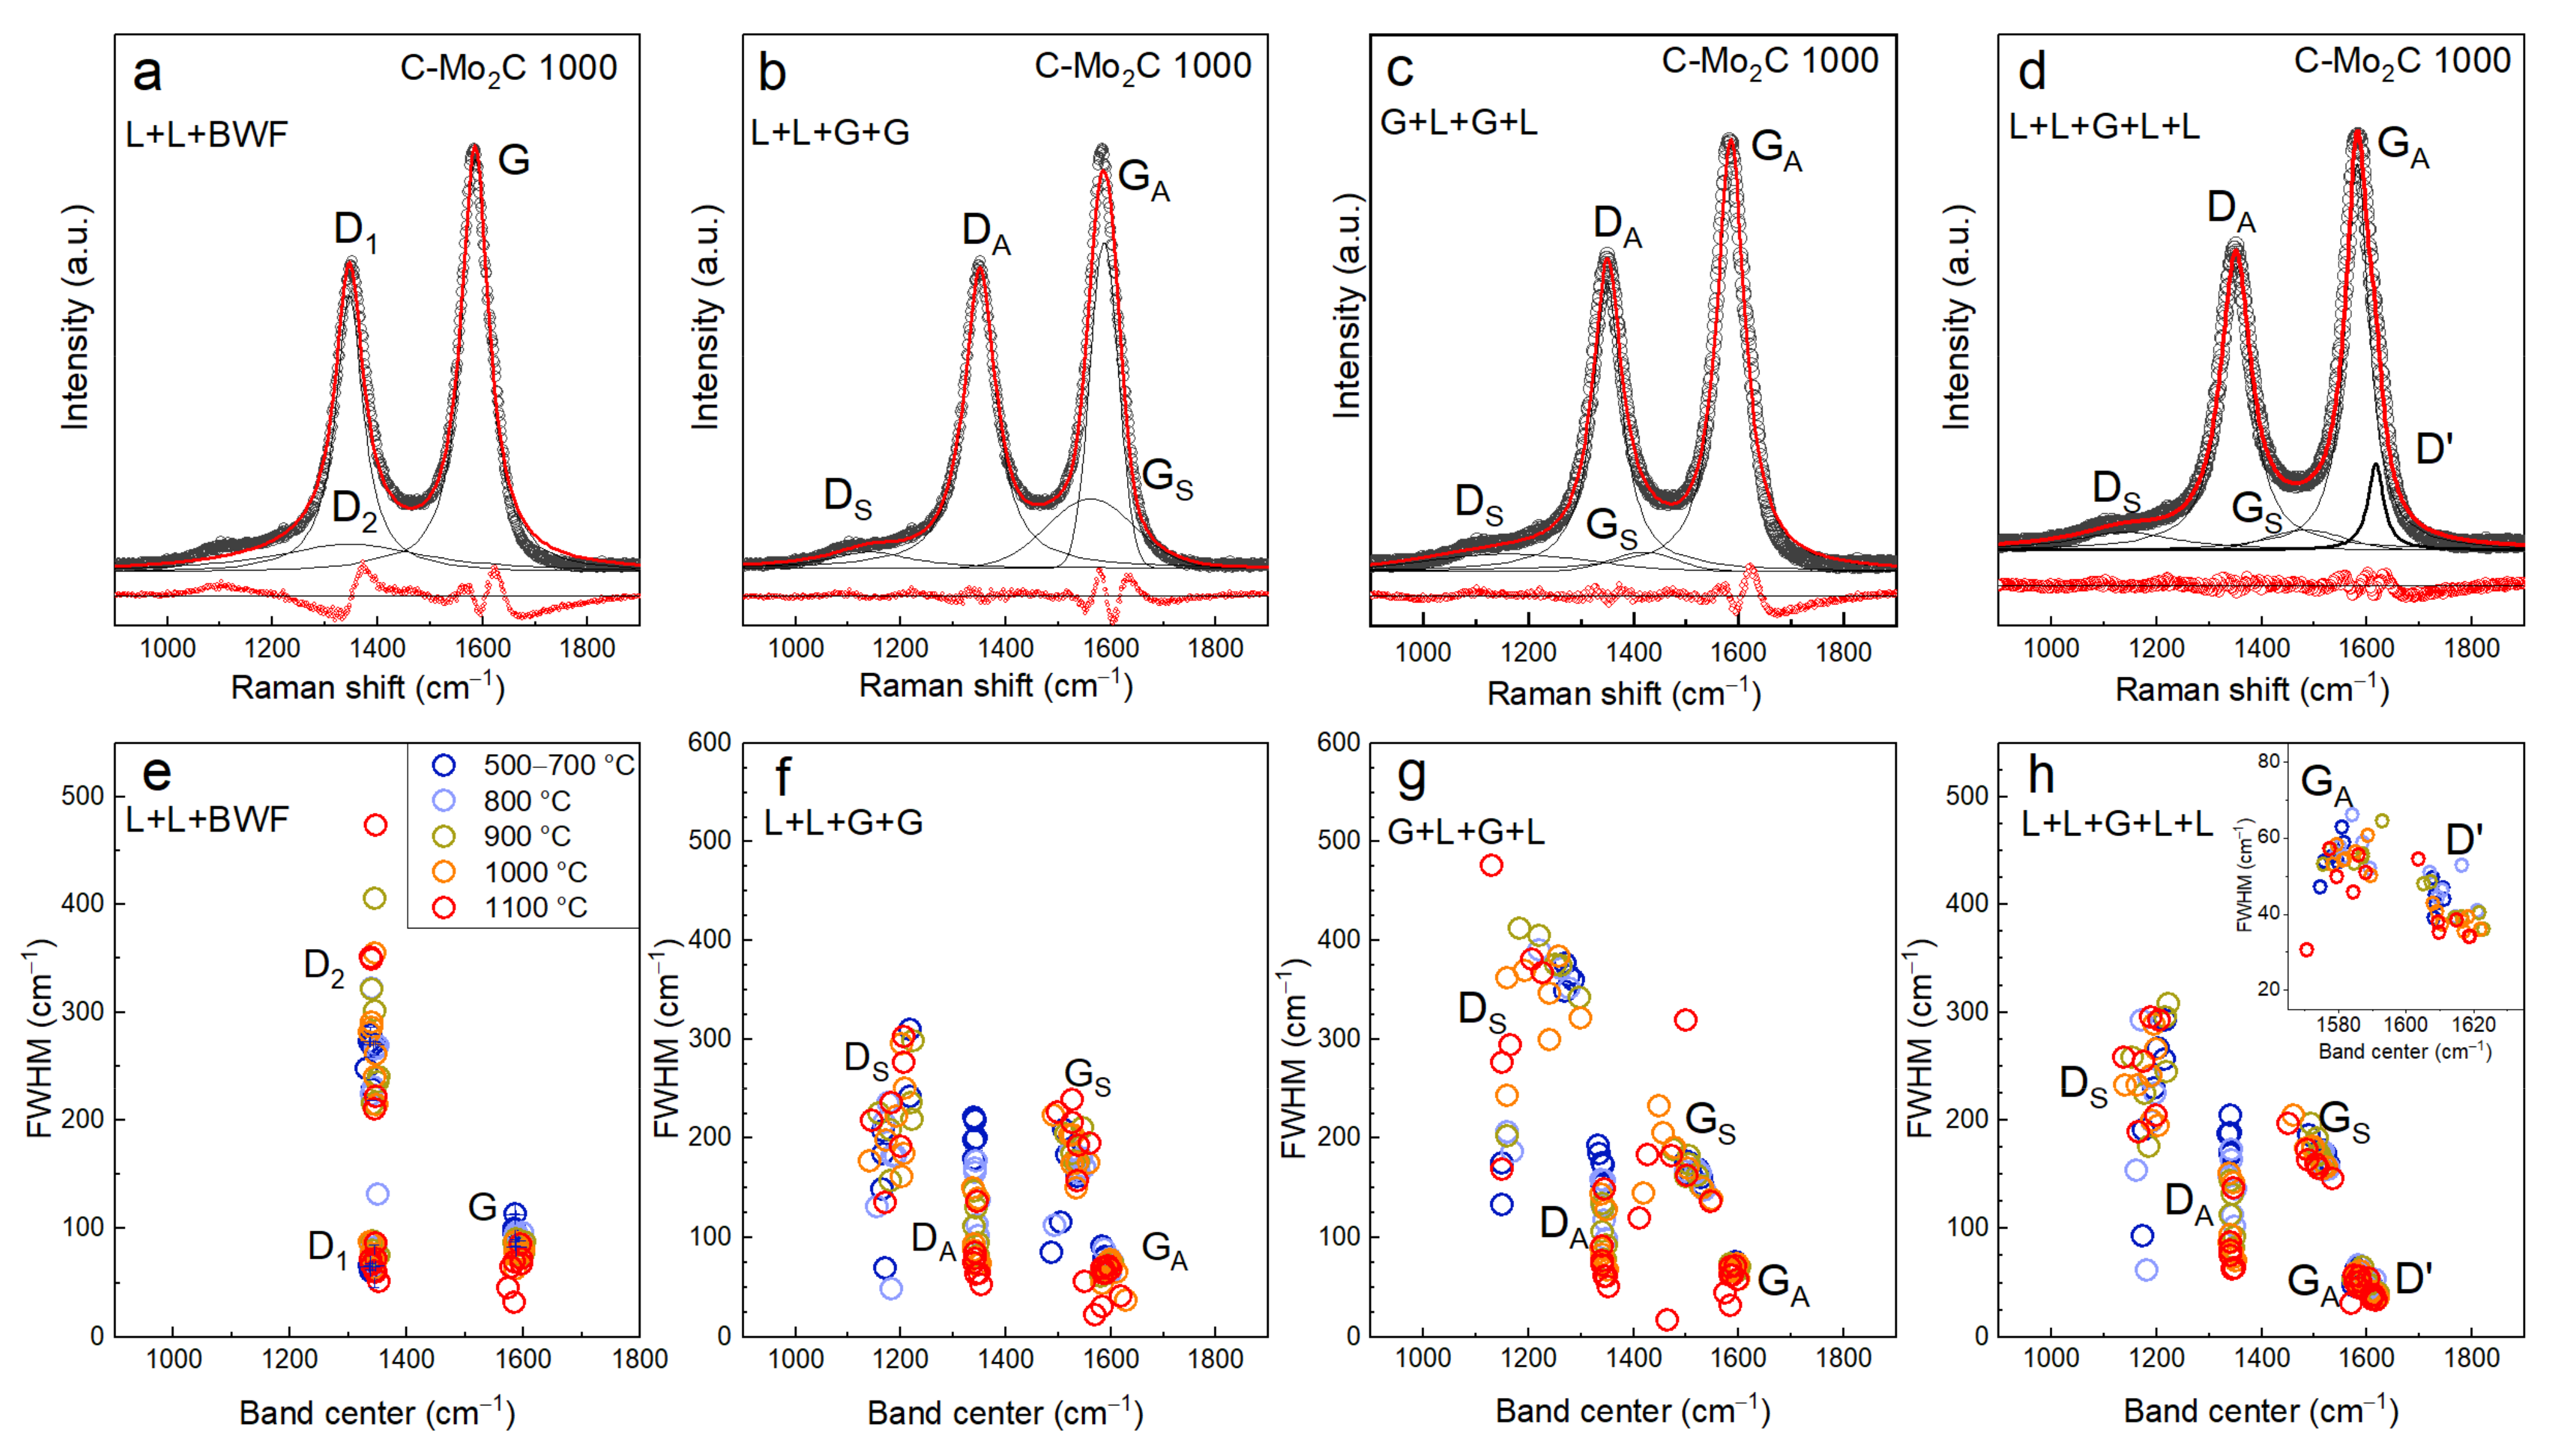
3.3. Impact of Band Deconvolution Method on Calculated Peak Properties

Detailed deconvolution of the first order Raman spectra has been conducted using four different approaches:
  • Deconvolution by two Lorentzian functions (Equation (1)) centered at ~1350 cm−1 (denoted as D1 and D2) and a Breit-Weigner-Fano (BWF) function (Equation (3)) centered at ~1500 cm−1 (denoted as G) as proposed by Mallet-Ladeira [29], henceforth denoted as L + L + BWF (Figure 3a).
  • Deconvolution by two Lorentzian functions centered at ~1350 cm−1 (denoted as D) and 1500 cm−1 (denoted as G), respectively, and two Gaussian functions (Equation (2)) centered at both sides of the D-band (denoted as DS and GS, respectively) as proposed by Ribeiro-Soares [27], henceforth denoted as G + L + G + L (Figure 3b).
  • Deconvolution by two Lorentzian functions centered at ~1200 cm−1 and 1350 cm−1 (DS and D, respectively) and two Gaussian functions centered at wavenumbers ~1450 cm−1 and 1500 cm−1 (GS and G, respectively), henceforth denoted as L + L + G + G (Figure 3c).
  • Deconvolution by four Lorentzian functions centered at ~1200 cm−1, 1350 cm−1, 1500 cm−1 and 1620 cm−1 (DS, D, G and D’, respectively) and one Gaussian function centered at ~1450 cm−1 (GS) as proposed by Sadezky et al. [26], henceforth denoted as L + L + G + L + L (Figure 3d).
The asymmetric BWF line supposedly arises from the coupling of a discrete mode to a continuum [24] and its asymmetrical shape helps to better account for the regions at ~1150 cm−1 and ~1500 cm−1, which fits poorly with a single symmetrical function. However, the L+L+BWF deconvolution method (Figure 3a) still represents these regions on both side of the D-band worse than the 4- or 5-function deconvolution approaches (Figure 3b−d). Thus, in the case of disordered CDCs, the 4- and 5-function approaches are more successful in reproducing the Raman scattering data within the region ~1000–1500 cm−1.
When the D’-band has not been accounted for and a Lorentzian-like function is used to describe the G-band, like in the L+L+BWF and G + L + G + L deconvolution approaches, the intensity at higher wavenumbers in comparison to the G-band is overestimated (Figure 3a,b). This region is better represented with the other two deconvolution methods (L + L + G + G and L + L + G + L + L.; Figure 3c,d). However, with the L + L + G + G approach, the height of the G-band has not been fully reproduced, which can also be seen from the residual values (Figure 3c). In conclusion, the 5-band deconvolution yields the best fit to the measured spectrum as is evident from the smallest residuals.
The main differences of the band positions and widths obtained with various deconvolution approaches become clearer by plotting the FWHM vs. the band center (x0) (as in [28]) (Figure 3e−h). Both the G-band and the D-band (denoted as D1 in Figure 3a) have a well-defined band center position and width according to all the different deconvolution methods applied. In the case of the 4-band deconvolution methods (Figure 3f,g) both the position and the FWHM of the DS, at ~1200 cm−1, and GS, at 1550 cm−1, bands are widely scattered. However, the scattering of both DS and GS band positions and the FWHM of the DS and GS bands are greater in case of the G + L + G + L approach in comparison to the L + L + G + G approach. In case of the 5-band deconvolution approach (inset in Figure 3h) the position of the D’-band is separated from the position of the GA-band. In addition, the position and width of the GS-band is better defined with the L + L + G + L + L approach (Figure 3h).

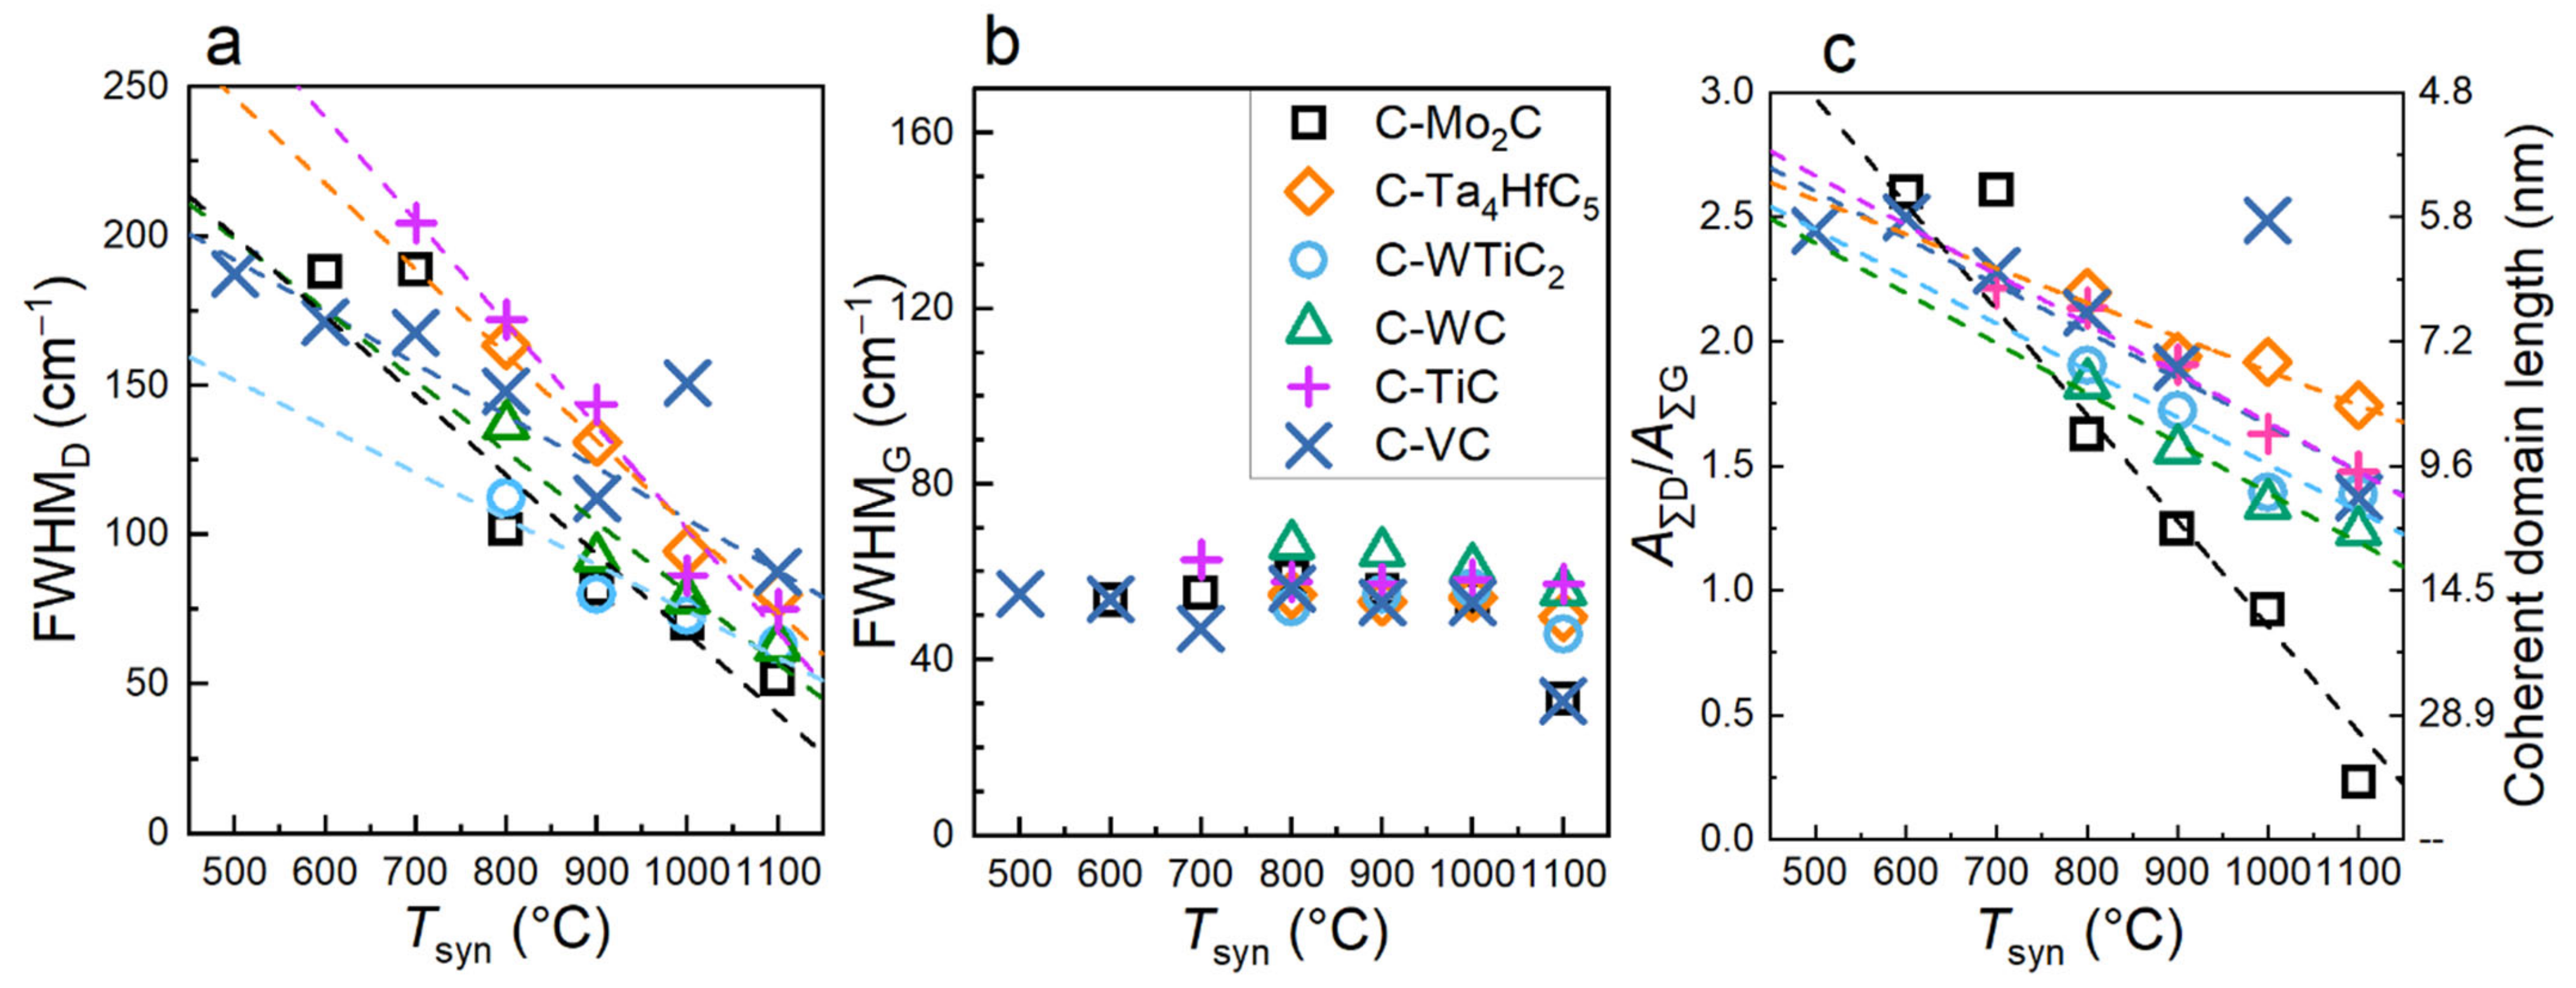
3.4. First Order Raman Spectra Deconvolution Results

The relation of the D- and G-band intensities, ID/IG, has been widely used to describe the relative structural order of a carbon material [17,22,23,42], but a clear limit of ID/IG for practical applications has been demonstrated previously [18,24]. In addition, as discussed in Section 3.3, the interpretation of the ID/IG is not always straightforward, since ID/IG initially increases and then decreases along the graphitization pathway of a disordered carbon from Stage I to Stage III. It has been suggested to use the width of the D-band [18,43] or the G-band [27,29,44], instead of the ID/IG ratio, to evaluate the structural order of carbon materials. Ribeiro-Soares et al. [27] proposed that for the analysis of Raman spectrum of polycrystalline carbons heat-treated at Tsyn ≥ 2000 °C, contributions from four Raman bands have to be used to characterize the spectrum, resulting in parameter A∑D/A∑G,
A D A G = A D S + A D A G S + A G ,
where A D S , S D , A G S , A G are the areas of the bands located at ~1200 cm−1, ~1340 cm−1, ~1500 cm−1 and ~1600 cm−1, respectively.
Since the 5-band deconvolution model is best for the CDCs in our dataset, the parameter A∑D/A∑G was modified to include the D’ band,
A D A G A D A G +   D   = A D S + A D A G S + A G + A D     ,
where AD’ is the area of the band situated at ~1620 cm-1.
With the increase in the Tsyn of CDCs the FWHMD decreases (Figure 4a). The decrease of the FWHMD is linear for most CDCs with the slope of 0.2−0.3 cm−1/°C. However, the width of the G-band does not change remarkably with the increase in Tsyn, as it stays around 55 cm−1 for most CDCs (Figure 4b). Ribeiro-Soares et al. [27] defined the upper limit of La for carbons in which case the FWHMG is a useful parameter, La < 30 nm, but apparently there is a lower limit as well. Namely, if the La is too small the FWHMG does not change remarkably and stays in the order of ~55 cmMallet-Ladeira et al. [45] also found that for carbons with La 2−5 nm, the width of the G-band stays constant. Only the FWHMG of C-Mo2C 1100 and C-VC 1100 are considerably smaller (~30 cm−1) than the FWHMGs of the rest of the CDCs. These carbons have been classified to be in the Stage III of graphitization in Section 3. In addition, the stacking size, Lc, of carbons derived from Mo2C and VC increased considerably with Tsyn. Therefore, the FWHMG is better suited to characterize carbons in the Stage III of graphitization or carbons with Lc > 2 nm.
Interestingly, when the G-band region was modeled with the BWF function (the L + L + BWF approach), there is a slight systematic decrease in the FWHMG with the increase in Tsyn (Figure S4). In case of the L + L + BWF approach, the G-band is not separated from the D’-band. Instead, the spectral region of the G- and D’-band is fitted with one function, the BWF function. When the G- and D’-band have been separated (L + L + G + L + L), it can be seen, that it is actually the FWHM of the D’-band that decreases with the increase in Tsyn (Figure S5).
The A∑D/A∑G ratio expressed in Equaton (5), exhibits a clear dependence on the Tsyn of the CDC under study (Figure 4c). These results follow the theory of Ribeiro-Soares et al. [27], based on which the extra bands, DS and GS, are related to the D- and the G-band characteristics. The A∑D/A∑G parameter changes with a slope of 0.002 °C−1, except for C-Mo2C, which yields a slope of 0.004 °C−1.
Unlike the FWHMD and the FWHMG parameters, the A∑D/A∑G ratio depends on the laser energy, Elaser, used (Figure S6a−d). However, the power dependence of A∑D/A∑G on Elaser is not given as A∑D/A∑G~E4 (Figure S6d) as previously established in [27,46], but instead the exponent 4 is reduced to a somewhat lower (but positive) value, which is characteristic of small crystallite sizes in carbon particles [29].
In an earlier study on the Raman spectra of CDCs [23], the equation by Ferrari and Robertson [22] was used for the calculation of the coherent domain length based on Raman spectra. However, the Ferrari-Robertson equation is meant to characterize carbons with La < 2 nm, which is not the case for the CDCs in this study. Ribeiro-Soares et al. [27] proposed an equation for calculating the coherent domain length from Raman spectra based on the A∑D/A∑G ratio. Using this equation, the coherent domain lengths for the studied CDCs are from 6 to 16 nm (Figure 4c, Figure S7 in SI) and increase systematically with increased Tsyn for CDCs from the same precursor carbide, proving its applicability to characterize the structure of the studied CDCs. The coherent domain lengths calculated from the A∑D/A∑G ratio are larger by 3–6 nm (average 4.4 nm) compared to the La from WAXS analysis. The reason for this discrepancy might be that when a layer contains defects and/or is curved, the coherent domains seen by WAXS are diminished, whereas phonon propagation is not stopped [47]. Especially given that the D-band is not only activated near the edge of the graphene domain, but also near different defects in the graphene domain [48] and even curvature without defects activates the D-band [49]. The change of curvature in the graphene planes of C-Mo2C was previously shown with contrast matched small-angle neutron scattering in [50]. Consequently, the coherent domains detected via Raman spectroscopy are somewhat larger in comparison to the La values established by the WAXS analysis method. The curved graphene layers can indeed be longer than 10 nm, as has been shown by transmission electron microscopy of CDCs [7,10,23]. Therefore, the higher the number of defects and/or increased amount of curvature in the graphene layers the larger is the discrepancy between the Raman spectroscopy and WAXS data analyzed with the used methods. In conclusion, the coherent domain length calculated from the Raman spectra of disordered carbon reflects the length to which phonon propagation can occur in the graphene domain containing defects and the La from WAXS is characteristic of the flat, mostly defect-free graphene domains in the carbon particle. Therefore, the WAXS and Raman analysis are complementary to each other and the simultaneous use of both methods is of high value for the characterization disordered non-graphitic carbon materials.

4. Conclusions

A combination of Raman spectroscopy and WAXS methods were applied on CDC materials obtained from six precursor carbides synthesized at various temperatures, from 500 to 1100 °C. The 5-peak fit of the Raman spectrum first order scattering region, suggested by Sadezky et al., obtained the most coherent results, i.e., the influence of the Tsyn on the peak parameters was the clearest. Results from both WAXS and Raman spectroscopy methods clearly showed the influence of the precursor carbide structure and chemical composition on stage of graphitization at equivalent synthesis temperature conditions. The graphitization of C-Mo2C and C-VC at T = 1100 °C was evident from the considerable narrowing of the G-band and from the increase in average stacking size, Lc, values obtained from the WAXS data.
The use of the parameter A∑D/A∑G for the determination of the coherent domain length from Raman spectra based on the Ribeiro-Soares method yielded the most reliable results when compared to the La value obtained from WAXS data. The coherent domain length obtained from the Raman spectra was larger by ~4.4 nm in comparison to the average graphene layer extent, La, value obtained from WAXS. This discrepancy is attributed to the number of defects and curvature in the graphene domains in the CDC particles. Thus, based the results under analysis in this work, our combination methodology is suggested for the characterization of CDCs and possibly other disordered non-graphitic carbons.

Supplementary Materials

The following are available online at https://0-www-mdpi-com.brum.beds.ac.uk/2311-5629/7/1/29/s1, Figure S1: WAXS data of different CDCs and fit curve of (a) C-VC, (b) C-WC, (c) C-Mo2C, (d) C-TiC and (e) C-WTiC2 synthesized at different Tsyn. Table S1: Parameters derived from WAXS patterns. Figure S2: The Raman spectra of (a) C-WTiC2, (b) C-TiC, (c) C-Mo2C, (d) C-Ta4HfC5, (e) C-VC and (f) C-WC synthesized at different Tsyn (noted in Figure) and measured with excitation laser wavelength 514 nm (laser energy 2.41 eV). The Raman spectra of all the investigated CDCs (laser wavelength 514 nm). Figure S3: The Raman spectra of (a) C-SiC 1000, (b) C-Mo2C 700 and (c) Mo2C 1000 measured with different laser excitation energies. Figure S4: Parameters (a) FWHMD (b) FWHMG and (c) A∑D/A∑G (as expressed in Equation (5)). obtained from spectra (Elaser = 2.41 eV) of CDCs using different deconvolution methods (noted in Figure) plotted against the synthesis temperature (Tsyn) of the CDC. Figure S5: The width of the D’-band (FWHMD’) vs. the synthesis temperature of the CDC (noted in Figure) obtained with the L + L + G + L + L deconvolution approach. Figure S6: Different parameters obtained from the spectra of C-Mo2C 700, C-Mo2C 1000 and C-SiC 1000 using different deconvolution methods (noted in Figure) plotted against the excitation laser energy (Elaser). Full width half maximum of the (a) G-band (FWHMG); (b) D-band (FWHMD) and (c) ratio AΣD/AΣG (as expressed in Equation (5)). The lines given are guides to the eye. (d) The ratio ratio AΣD/AΣG vs. Elaser, where the line corresponds to the equation ratio AΣD/AΣG = B Elaserx, where parameters B and x are fitted and seen in the graph. Figure S7: The comparison of the coherent domain length calculated from Raman spectra using ratio AΣD/AΣG and equation La = 490/Elaser4 (AΣD/AΣG)−1 [27] (y-axis) and the graphene domain lengths, La, from wide-angle X-ray scattering pattern analysis by CarbX (x-axis).

Author Contributions

Conceptualization, H.K.; R.H. and R.P.; methodology, H.K.; T.R., T.P. and R.H.; formal analysis, R.H.; L.P. and J.A.; investigation, R.H., J.A. and T.R.; resources, I.T., T.T., A.J. and E.L.; data curation, R.H.; writing—original draft preparation, R.H.; writing—review and editing, R.P.; T.R., A.J. and E.L.; supervision, H.K., R.P. and E.L.; project administration, E.L.; funding acquisition, E.L.; software, T.P. All authors have read and agreed to the published version of the manuscript.

Funding

This research was funded by the EU through the European Regional Development Fund under Grants TK141 2014–2020.4.01.15–0011 and TK117 3.2.0101–0030, European Spallation Source under Grant SLOKT12026T and Graduate School of Functional materials and technologies receiving funding from the European Regional Development Fund in University of Tartu, Estonia. This work has been also partially supported by Estonian Research Council Institutional Research under Grant IUT20–13 and personal research grants PRG676, PUT55, PUT1033, and PUTJD957.

Acknowledgments

Hugo Mändar is thanked for the measurement of some of the WAXS patterns; Martti Pärs and Ilmo Sildos are thanked for the measurement of some of the Raman spectra.

Conflicts of Interest

The authors declare no conflict of interest.

References

  1. Schimmel, H.G.; Kearley, G.J.; Nijkamp, M.G.; Visser, C.T.; De Jong, K.P.; Mulder, F.M. Hydrogen Adsorption in Carbon Nanostructures: Comparison of Nanotubes, Fibers, and Coals. Chem. Eur. J. 2003, 9, 4764–4770. [Google Scholar] [CrossRef] [Green Version]
  2. Brown, R.C. Review: Activated Carbon Filters in Respiratory Protective Equipment. Int. J. Occup. Saf. Ergon. 1995, 1, 330–373. [Google Scholar] [CrossRef] [PubMed] [Green Version]
  3. Candelaria, S.L.; Shao, Y.; Zhou, W.; Li, X.; Xiao, J.; Zhang, J.-G.; Wang, Y.; Liu, J.; Li, J.; Cao, G. Nanostructured carbon for energy storage and conversion. Nano Energy 2012, 1, 195–220. [Google Scholar] [CrossRef]
  4. Härmas, R.; Palm, R.; Härmas, M.; Pohl, M.; Kurig, H.; Tallo, I.; Tee, E.; Vaas, I.; Väli, R.; Romann, T.; et al. Influence of porosity parameters and electrolyte chemical composition on the power densities of non-aqueous and ionic liquid based supercapacitors. Electrochim. Acta 2018, 283, 931–948. [Google Scholar] [CrossRef]
  5. Jänes, A.; Thomberg, T.; Kurig, H.; Lust, E. Nanoscale fine-tuning of porosity of carbide-derived carbon prepared from molybdenum carbide. Carbon 2009, 47, 23–29. [Google Scholar] [CrossRef]
  6. Tallo, I.; Thomberg, T.; Kurig, H.; Kontturi, K.; Jänes, A.; Lust, E. Novel micromesoporous carbon materials synthesized from tantalum hafnium carbide and tungsten titanium carbide. Carbon 2014, 67, 607–616. [Google Scholar] [CrossRef]
  7. Tallo, I.; Thomberg, T.; Kontturi, K.; Jänes, A.; Lust, E. Nanostructured carbide-derived carbon synthesized by chlorination of tungsten carbide. Carbon 2011, 49, 4427–4433. [Google Scholar] [CrossRef]
  8. Tallo, I.; Thomberg, T.; Jänes, A.; Lust, E. Replacing Chlorine with Hydrogen Chloride as a Possible Reactant for Synthesis of Titanium Carbide Derived Carbon Powders for High-Technology Devices. IOP Conf. Ser. Mater. Sci. Eng. 2013, 49, 012018. [Google Scholar] [CrossRef]
  9. Jänes, A.; Thomberg, T.; Lust, E. Synthesis and characterisation of nanoporous carbide-derived carbon by chlorination of vanadium carbide. Carbon 2007, 45, 2717–2722. [Google Scholar] [CrossRef]
  10. Tee, E.; Tallo, I.; Kurig, H.; Thomberg, T.; Jänes, A.; Lust, E. Huge enhancement of energy storage capacity and power density of supercapacitors based on the carbon dioxide activated microporous SiC-CDC. Electrochim. Acta 2015, 161, 364–370. [Google Scholar] [CrossRef]
  11. Jäger, R.; Härk, E.; Romann, T.; Joost, U.; Lust, E. C(Mo2C) and Pt–C(Mo2C) based mixed catalysts for oxygen reduction reaction. J. Electroanal. Chem. 2016, 761, 89–97. [Google Scholar] [CrossRef]
  12. Palm, R.; Tallo, I.; Romann, T.; Kurig, H. Methane adsorption on specially designed TiC and Mo 2 C derived carbons with different pore size and surface morphology. Microporous Mesoporous Mater. 2015, 218, 167–173. [Google Scholar] [CrossRef]
  13. Härmas, R.; Palm, R.; Russina, M.; Kurig, H.; Grzimek, V.; Härk, E.; Koppel, M.; Tallo, I.; Paalo, M.; Oll, O.; et al. Transport properties of H2 confined in carbide-derived carbons with different pore shapes and sizes. Carbon 2019, 155, 122–128. [Google Scholar] [CrossRef]
  14. Kim, H.S.; Singer, J.P.; Gogotsi, Y.; Fischer, J.E. Molybdenum carbide-derived carbon for hydrogen storage. Microporous Mesoporous Mater. 2009, 120, 267–271. [Google Scholar] [CrossRef]
  15. Härk, E.; Petzold, A.; Goerigk, G.; Risse, S.; Tallo, I.; Härmas, R.; Lust, E.; Ballauff, M. Carbide derived carbons investigated by small angle X-ray scattering: Inner surface and porosity vs. graphitization. Carbon 2019, 146, 284–292. [Google Scholar] [CrossRef]
  16. Kurig, H.; Russina, M.; Tallo, I.; Siebenbürger, M.; Romann, T.; Lust, E. The suitability of infinite slit-shaped pore model to describe the pores in highly porous carbon materials. Carbon 2016, 100, 617–624. [Google Scholar] [CrossRef]
  17. Tuinstra, F.; Koenig, J.L. Raman Spectrum of Graphite. J. Chem. Phys. 1970, 53, 1126–1130. [Google Scholar] [CrossRef] [Green Version]
  18. Cuesta, A.; Dhamelincourt, P.; Laureyns, J.; Martínez-Alonso, A.; Tascón, J. Raman microprobe studies on carbon materials. Carbon 1994, 32, 1523–1532. [Google Scholar] [CrossRef]
  19. Puech, P.; Kandara, M.; Paredes, G.; Moulin, L.; Weiss-Hortala, E.; Kundu, A.; Ratel-Ramond, N.; Plewa, J.-M.; Pellenq, R.; Monthioux, M. Analyzing the Raman Spectra of Graphenic Carbon Materials from Kerogens to Nanotubes: What Type of Information Can Be Extracted from Defect Bands? C 2019, 5, 69. [Google Scholar] [CrossRef] [Green Version]
  20. Malard, L.M.; Pimenta, M.A.; Dresselhaus, G.; Dresselhaus, M.S. Raman spectroscopy in graphene. Phys. Rep. 2009, 473, 51–87. [Google Scholar] [CrossRef]
  21. Pimenta, M.A.; Dresselhaus, G.; Dresselhaus, M.S.; Cançado, L.G.; Jorio, A.; Saito, R. Studying disorder in graphite-based systems by Raman spectroscopy. Phys. Chem. Chem. Phys. 2007, 9, 1276–1290. [Google Scholar] [CrossRef]
  22. Ferrari, A.C.; Robertson, J. Interpretation of Raman spectra of disordered and amorphous carbon. Phys. Rev. B 2000, 61, 14095–14107. [Google Scholar] [CrossRef] [Green Version]
  23. Urbonaite, S.; Hälldahl, L.; Svensson, G. Raman spectroscopy studies of carbide derived carbons. Carbon 2008, 46, 1942–1947. [Google Scholar] [CrossRef]
  24. Zickler, G.A.; Smarsly, B.; Gierlinger, N.; Peterlik, H.; Paris, O. A reconsideration of the relationship between the crystallite size La of carbons determined by X-ray diffraction and Raman spectroscopy. Carbon 2006, 44, 3239–3246. [Google Scholar] [CrossRef]
  25. Hu, C.; Sedghi, S.; Silvestre-Albero, A.; Andersson, G.G.; Sharma, A.; Pendleton, P.; Rodríguez-Reinoso, F.; Kaneko, K.; Biggs, M.J. Raman spectroscopy study of the transformation of the carbonaceous skeleton of a polymer-based nanoporous carbon along the thermal annealing pathway. Carbon 2015, 85, 147–158. [Google Scholar] [CrossRef] [Green Version]
  26. Sadezky, A.; Muckenhuber, H.; Grothe, H.; Niessner, R.; Pöschl, U. Raman microspectroscopy of soot and related carbonaceous materials: Spectral analysis and structural information. Carbon 2005, 43, 1731–1742. [Google Scholar] [CrossRef]
  27. Ribeiro-Soares, J.; Oliveros, M.E.; Garin, C.; David, M.V.; Martins, L.G.P.; Almeida, C.A.; Martins-Ferreira, E.H.; Takai, K.; Enoki, T.; Magalhães-Paniago, R.; et al. Structural analysis of polycrystalline graphene systems by Raman spectroscopy. Carbon 2015, 95, 646–652. [Google Scholar] [CrossRef] [Green Version]
  28. Shimodaira, N.; Masui, A. Raman spectroscopic investigations of activated carbon materials. J. Appl. Phys. 2002, 92, 902–909. [Google Scholar] [CrossRef]
  29. Mallet-Ladeira, P.; Puech, P.; Toulouse, C.; Cazayous, M.; Ratel-Ramond, N.; Weisbecker, P.; Vignoles, G.L.; Monthioux, M. A Raman study to obtain crystallite size of carbon materials: A better alternative to the Tuinstra–Koenig law. Carbon 2014, 80, 629–639. [Google Scholar] [CrossRef]
  30. Schuepfer, D.B.; Badaczewski, F.; Guerra-Castro, J.M.; Hofmann, D.M.; Heiliger, C.; Smarsly, B.; Klar, P.J. Assessing the structural properties of graphitic and non-graphitic carbons by Raman spectroscopy. Carbon 2020, 161, 359–372. [Google Scholar] [CrossRef]
  31. Ruland, W.; Smarsly, B. X-ray scattering of non-graphitic carbon: An improved method of evaluation. J. Appl. Crystallogr. 2002, 35, 624–633. [Google Scholar] [CrossRef]
  32. Pfaff, T.; Simmermacher, M.; Smarsly, B.M. CarbX: A program for the evaluation of wide-angle X-ray scattering data of non-graphitic carbons. J. Appl. Crystallogr. 2018, 51, 219–229. [Google Scholar] [CrossRef] [Green Version]
  33. Faber, K.; Badaczewski, F.; Oschatz, M.; Mondin, G.; Nickel, W.; Kaskel, S.; Smarsly, B.M. In-Depth Investigation of the Carbon Microstructure of Silicon Carbide-Derived Carbons by Wide-Angle X-ray Scattering. J. Phys. Chem. C 2014, 118, 15705–15715. [Google Scholar] [CrossRef]
  34. Christians, H.; Brunnengräber, K.; Gläsel, J.; Etzold, B.J. Mesoporous and crystalline carbide-derived carbons: Towards a general correlation on synthesis temperature and precursor structure influence. Carbon 2021, 175, 215–222. [Google Scholar] [CrossRef]
  35. Nič, M.; Jirát, J.; Košata, B.; Jenkins, A.; McNaught, A. (Eds.) IUPAC Compendium of Chemical Terminology: Gold Book; 2.1.0.; IUPAC: Research Triagle Park, NC, USA, 2009; ISBN 978–0-9678550–9-7. [Google Scholar]
  36. Ferrari, A.C.; Basko, D.M. Raman spectroscopy as a versatile tool for studying the properties of graphene. Nat. Nanotechnol. 2013, 8, 235–246. [Google Scholar] [CrossRef] [PubMed] [Green Version]
  37. Wang, Y.; Alsmeyer, D.C.; McCreery, R.L. Raman spectroscopy of carbon materials: Structural basis of observed spectra. Chem. Mater. 1990, 2, 557–563. [Google Scholar] [CrossRef]
  38. Dresselhaus, M.S.; Jorio, A.; Saito, R. Characterizing Graphene, Graphite, and Carbon Nanotubes by Raman Spectroscopy. Annu. Rev. Condens. Matter Phys. 2010, 1, 89–108. [Google Scholar] [CrossRef]
  39. Lee, Y.-J. The second order Raman spectroscopy in carbon crystallinity. J. Nucl. Mater. 2004, 325, 174–179. [Google Scholar] [CrossRef]
  40. Matthews, M.J.; Pimenta, M.A.; Dresselhaus, G.; Dresselhaus, M.S.; Endo, M. Origin of dispersive effects of the RamanDband in carbon materials. Phys. Rev. B 1999, 59, R6585–R6588. [Google Scholar] [CrossRef]
  41. Sato, K.; Saito, R.; Oyama, Y.; Jiang, J.; Cançado, L.; Pimenta, M.; Jorio, A.; Samsonidze, G.; Dresselhaus, G.; Dresselhaus, M. D-band Raman intensity of graphitic materials as a function of laser energy and crystallite size. Chem. Phys. Lett. 2006, 427, 117–121. [Google Scholar] [CrossRef]
  42. Deldicque, D.; Rouzaud, J.-N.; Velde, B. A Raman–HRTEM study of the carbonization of wood: A new Raman-based paleothermometer dedicated to archaeometry. Carbon 2016, 102, 319–329. [Google Scholar] [CrossRef]
  43. Vallerot, J.-M.; Bourrat, X.; Mouchon, A.; Chollon, G. Quantitative structural and textural assessment of laminar pyrocarbons through Raman spectroscopy, electron diffraction and few other techniques. Carbon 2006, 44, 1833–1844. [Google Scholar] [CrossRef] [Green Version]
  44. Merlen, A.; Buijnsters, J.G.; Pardanaud, C. A Guide to and Review of the Use of Multiwavelength Raman Spectroscopy for Characterizing Defective Aromatic Carbon Solids: From Graphene to Amorphous Carbons. Coatings 2017, 7, 153. [Google Scholar] [CrossRef]
  45. Mallet-Ladeira, P.; Puech, P.; Weisbecker, P.; Vignoles, G.L.; Monthioux, M. Behavior of Raman D band for pyrocarbons with crystallite size in the 2–5 nm range. Appl. Phys. A 2013, 114, 759–763. [Google Scholar] [CrossRef]
  46. Cançado, L.G.; Takai, K.; Enoki, T.; Endo, M.; Kim, Y.A.; Mizusaki, H.; Jorio, A.; Coelho, L.N.; Magalhães-Paniago, R.; Pimenta, M.A. General equation for the determination of the crystallite size La of nanographite by Raman spectroscopy. Appl. Phys. Lett. 2006, 88, 163106. [Google Scholar] [CrossRef]
  47. Vázquez-Santos, M.B.; Geissler, E.; László, K.; Rouzaud, J.-N.; Martínez-Alonso, A.; Tascón, J.M. Comparative XRD, Raman, and TEM Study on Graphitization of PBO-Derived Carbon Fibers. J. Phys. Chem. C 2012, 116, 257–268. [Google Scholar] [CrossRef]
  48. Cançado, L.G.; Da Silva, M.G.; Ferreira, E.H.M.; Hof, F.; Kampioti, K.; Huang, K.; Pénicaud, A.; Achete, C.A.; Capaz, R.B.; Jorio, A. Disentangling contributions of point and line defects in the Raman spectra of graphene-related materials. 2D Mater. 2017, 4, 025039. [Google Scholar] [CrossRef]
  49. Gupta, A.K.; Nisoli, C.; Lammert, P.E.; Crespi, V.H.; Eklund, P.C. Curvature-induced D-band Raman scattering in folded graphene. J. Phys. Condens. Matter 2010, 22, 334205. [Google Scholar] [CrossRef]
  50. Palm, R.; Härmas, R.; Härk, E.; Kent, B.; Kurig, H.; Koppel, M.; Russina, M.; Tallo, I.; Romann, T.; Mata, J.; et al. Study of the structural curvature in Mo2C derived carbons with contrast matched small-angle neutron scattering. Carbon 2021, 171, 695–703. [Google Scholar] [CrossRef]
Figure 1. Wide-angle X-ray scattering data (spheres) of different carbide-derived carbons (CDCs, noted in Figure) and fit curve (solid line), where the scattering vector modulus, q, is defined as q = 4π sin(θ)/λ, where 2θ is the scattering angle.
Carbon 07 00029 g001
Figure 2. The Raman spectra normalized to the G-band intensity measured with excitation laser wavelength 514 nm (laser energy EL = 2.41 eV) for CDCs synthesized from (a) Mo2C and (b) WC at different Tsyn (noted in Figure).
Carbon 07 00029 g002
Figure 3. The deconvolution of the first-order Raman spectrum of C-Mo2C 1000 using (a) L + L + BWF, (b) L + L + G + G, (c) G + L + G + L and (d) L + L + G + L + L deconvolution methods. Experimental spectra are given as scatter plots (black circles), fits are given as solid lines (orange lines for cumulative fits and black lines for single peak fits). The residuals (red dots) are plotted below the spectra. Plots of the full width half maximum (FWHM) of the band vs. the band center position (x0) obtained by different first order Raman spectrum band deconvolution methods (e) L + L + BWF, (f) L + L + G + G, (g) G + L + G + L and (h) L + L + G + L + L deconvolution methods for CDCs synthesized at different temperatures (noted in Figure). The inset in (h) shows the zoomed in G-band region.
Carbon 07 00029 g003
Figure 4. The full-width half maximum of the (a) D-band (FWHMD), (b) the G-band (FWHMG) and (c) the ratio A∑D/A∑G (Equation (5)), versus the synthesis temperature of the CDC. The axis on the right shows the La = 490/Elaser4 (SΣD/SΣG)−1 [27]. Parameters are obtained from spectra (laser wavelength 514 nm) of CDCs with different precursor carbides (noted in Figure) using the L + L + G + L + L deconvolution method. Lines are guides for the eye.
Carbon 07 00029 g004
Table 1. The precursor carbides and corresponding chlorination temperatures of carbide-derived carbon powders analyzed.
Precursor CarbideChlorination Temperature (°C)Ref.
Mo2C 60070080090010001100[5]
Ta4HfC5 80090010001100[6]
WTiC2 80090010001100[6]
WC 80090010001100[7]
TiC 80090010001100[8]
VC50060070080090010001100[9]
Table 2. Parameters derived from WAXS patterns for some CDCs. La–average graphene layer extent, lcc–average C-C bond length, σ1–standard deviation of the first-neighbor distribution, ⟨N⟩–average number of graphene layers per stack, Lc–average stacking size, a3–average interlayer spacing, σ3–standard deviation of interlayer spacing.
C-Mo2CC-Ta4HfC5C-WTiC2C-WCC-TiCC-VC
Tsyn800100080010008001000800100080010006001100
La, nm3.8 ± 0.68.3 ± 2.9 2.5 ± 0.35.6 ± 1.32.6 ± 0.37.1 ± 2.12.8 ± 0.34.5 ± 0.82.6 ± 0.35.6 ± 1.32.5 ± 0.36.3 ± 1.6
lcc, nm0.14120.1410 0.13810.14090.14050.14000.14110.14110.14100.14140.14160.1406
σ1, nm0.0160.012 0.0130.0160.0220.0160.0160.0150.0210.0180.0200.011
N1.056.74 0.191.210.661.021.401.901.080.971.510.09
Lc, nm1.3 ± 0.22.7 ± 0.2 0.7 ± 0.10.52 ± 0.050.37 ± 0.050.56 ± 0.10.55 ± 0.030.8 ± 0.10.5 ± 0.10.6 ± 0.10.82 ± 0.053.1 ± 0.7
a3, nm0.3640.351 0.3330.3800.3540.3690.3140.3470.3650.3650.3950.343
σ3, nm0.0610.048 0.1100.0010.0240.000.0570.0210.0380.0390.0510.011
Table 3. Carbide derived carbons divided by the graphitization stages based on the Raman spectra.
50060070080090010001100
C-Mo2C Stage IStage IIStage III
C-Ta4HfC5Stage IStage II
C-WTiC2Stage II
C-WCStage II
C-TiCStage IStage II
C-VCStage IStage IIStage III
Publisher’s Note: MDPI stays neutral with regard to jurisdictional claims in published maps and institutional affiliations.

