Article

Preparation of Pt/CNT Thin-Film Electrodes by Electrochemical Potential Pulse Deposition for Methanol Oxidation

by
Jose Quintero-Ruiz
1,
Ramiro Ruiz-Rosas
2,3,
Javier Quílez-Bermejo
2,
David Salinas-Torres
1,
Diego Cazorla-Amorós
2 and
Emilia Morallón
1,*
1
Departamento de Química Física and Instituto de Materiales, Universidad de Alicante, Ap. 99, 03080 Alicante, Spain
2
Departamento de Química Inórganica and Instituto de Materiales, Universidad de Alicante, Ap. 99, 03080 Alicante, Spain
3
Departamento de Ingeniería Química, Campus de Teatinos s/n, Universidad de Málaga, 29010 Málaga, Spain
*
Author to whom correspondence should be addressed.
Submission received: 4 February 2021 / Revised: 19 March 2021 / Accepted: 23 March 2021 / Published: 26 March 2021
(This article belongs to the Collection Feature Papers in the Science and Engineering of Carbons)

Abstract

:
High-quality performance of catalysts is increasingly required to meet industry exigencies. However, chemical synthesis is often insufficient to maximize the potential properties of the catalysts. On the other hand, electrochemical synthesis has arisen as a promising alternative to overcome these limitations and provide precise control in the preparation of catalysts. In this sense, this work involved the well-controlled electrochemical synthesis of a catalyst based on platinum nanoparticle deposition on carbon nanotubes using only electrochemical treatments. Thin films of functionalized carbon nanotubes were cast onto the surface of a glassy carbon electrode using potential pulsed electrodeposition, resulting in a better distribution of the carbon nanotubes on the electrode when comparing with traditional methods. Then, platinum nanoparticles were electrodeposited on the carbon nanotube-modified electrode. To check the performance of the catalyst and the relevance of the electrochemical synthesis treatments, the samples were analyzed as electrocatalysts towards methanol electrooxidation, showing an important improvement in the catalytic activity in comparison with electrodes that were prepared by traditional methodologies.

Graphical Abstract

1. Introduction

The growing demand of modern society for a fast transition to a new energy model is encouraging researchers and companies to find, develop, and implement cleaner, inexpensive, safer, and renewable energy sources. In this sense, the thriving renewable energy industry requires the development of more and new sophisticated chemical and electrochemical energy storage and conversion systems. Thus, the demand for the preparation of more efficient electrocatalysts using environmentally friendly techniques is increasing daily [1,2,3,4]. This leads to scientific efforts focused on every detail of electrocatalysts.
Among all metals, platinum is highlighted because of its interesting catalytic properties since it is considered the most catalytic metal towards oxygen reduction reaction (ORR) [5], hydrogen evolution reaction (HER) [6], and hydrogen oxidation reaction [7,8], all of which being key reactions in energy devices required for the full development of new energy models based on renewable sources [9]. However, some of the main limitations of this metal are the low abundance in nature and high cost. This leads to the necessity of reducing the platinum loading of the catalysts. In this context, metal nanoparticles are crucial for the high efficiency of electrocatalysts. These nanoparticles act as active sites in which the ratio between surface to bulk atoms is improved, increasing the performance of the catalyst and decreasing the metal loading requirements [10].
On the other hand, the catalytic support is another limiting factor for the catalytic activity of electrocatalysts [11,12,13]. Such support has the role of supplying a large surface to achieve a homogeneous distribution of metal nanoparticles. It can also act as an activity promoter owing to beneficial modifications of the electronic configuration of the active sites [14]. The support also determines the stability of the electrocatalysts through the catalyst–support interaction that may prevent undesirable agglomeration or lixiviation of those nanoparticles, which would hamper the performance of the electrode [11,12,13]. Nanostructured carbon materials, such as carbon nanotubes (CNTs), have a large impact on the catalytic activity of heterogeneous electrocatalysts, not only as active sites [15,16,17] but also as a support of metal nanoparticles since they exhibit high electrical conductivity, surface area, stability, and strong interaction with metal nanoparticles [18,19,20].
Unfortunately, nanostructured carbon materials are difficult to handle and cannot be easily processed into electrodes. Most preparation methods involve the method of drop-casting from a binder-containing solution [21,22]. This method has important limitations like the lack of control over the film thickness, the use of other chemicals in the solution, and the heterogeneous distribution of the carbon material on the pristine electrode. In recent years, electrochemistry has been proposed as a new tool to overcome all these limitations [21,22,23,24,25,26,27,28,29,30]. Electrodeposition or electrophoretic deposition methods have potentially interesting applications because of their high deposition rate, simple operation, uniformity, control over thickness, and large-scale production capabilities [21,22,23,24,25,26,27,28,29,30,31]. They have been successfully applied for the preparation of CNT electrodes [32,33] and electrochemically active platinum nanoparticles [34,35,36].
In this work, we applied electrochemical pulse deposition for the preparation of well-dispersed platinum nanoparticles on homogenously distributed CNT coatings obtained also using electrochemical methods. To that end, oxygen-containing CNTs were ultrasonically dispersed in aqueous solution from which the electrochemically assisted deposition of CNTs was performed. To achieve a higher accuracy level, the addition of Na2SO4 as supporting electrolyte and the use of chronoamperometric pulses in both positive and negative potentials were utilized to attain excellent control over the thickness of the deposit. As active phase, platinum nanoparticles were introduced into the carbon-based support through electrodeposition methods for evaluation as methanol oxidation electrocatalysts. Fine control of the electrochemical deposition of platinum nanoparticles leads to a metal loading of 7 µgPt cm−2 with homogeneous distribution and interesting catalytic properties. These results highlight the promising improvement in the performance of electrocatalysts that can be achieved by electrochemically assisted deposition of carbon nanotubes and electrochemical deposition of well-dispersed platinum nanoparticles.

2. Materials and Methods

2.1. Materials and Reagents

Multiwall carbon nanotubes were obtained from Nanoblack Columbian Chemicals Co (Atlanta, GA, USA). Hexachloroplatinic acid (H2PtCl6·6H2O) was purchased from Johnson Matthey (London, UK). Sodium sulfate was provided by Sigma-Aldrich (Darmstadt, Germany). Sulfuric acid, nitric acid, and methanol were supplied by Merck (Darmstadt, Germany). All the solutions were prepared using ultrapure water (18 MΩ cm from an Elga Labwater Purelab system, Lane End, High Wycombe, UK). N2 gas (99.999%) was provided by Air Liquide (Paris, France) and was used without any further purification or treatment.

2.2. CNT Functionalization

The success of electrochemically assisted deposition relies on the functionalization of carbon materials, which generates surface charge in contact with water and facilitates the suspension of the carbon-based support in aqueous media. Moreover, this acidic oxidation treatment is also useful to remove the metallic traces of the pristine CNTs. To that end, 200 mg of CNTs were introduced in reflux of 100 mL of 3 M HNO3 solution over 24 h. Then, the resultant solid was filtered and washed several times with water to remove any traces of nitric acid. Finally, the material was dried at 120 °C for 12 h. The resultant functionalized carbon nanotubes are referred to as fCNTs.

2.3. Characterization of the fCNT dispersions

Prior to the electrochemically assisted deposition, 100 mg of fCNTs were ultrasonically dispersed into 10 mL of ultrapure water. The resultant dispersion was centrifuged at 4000 rpm for 10 min. The non-soluble fraction was separated from the dispersion, and the remaining liquid was kept for later use as the working solution. The same conditions were used with the introduction of 0.01 M Na2SO4 as the supporting electrode.
All dispersions were evaluated through UV–Vis to estimate the concentration, which was tracked following the absorbance of the π-plasmon band (241 nm) [33]. The UV–Vis spectrum was recorded using a JASCO (V-670) spectrophotometer.

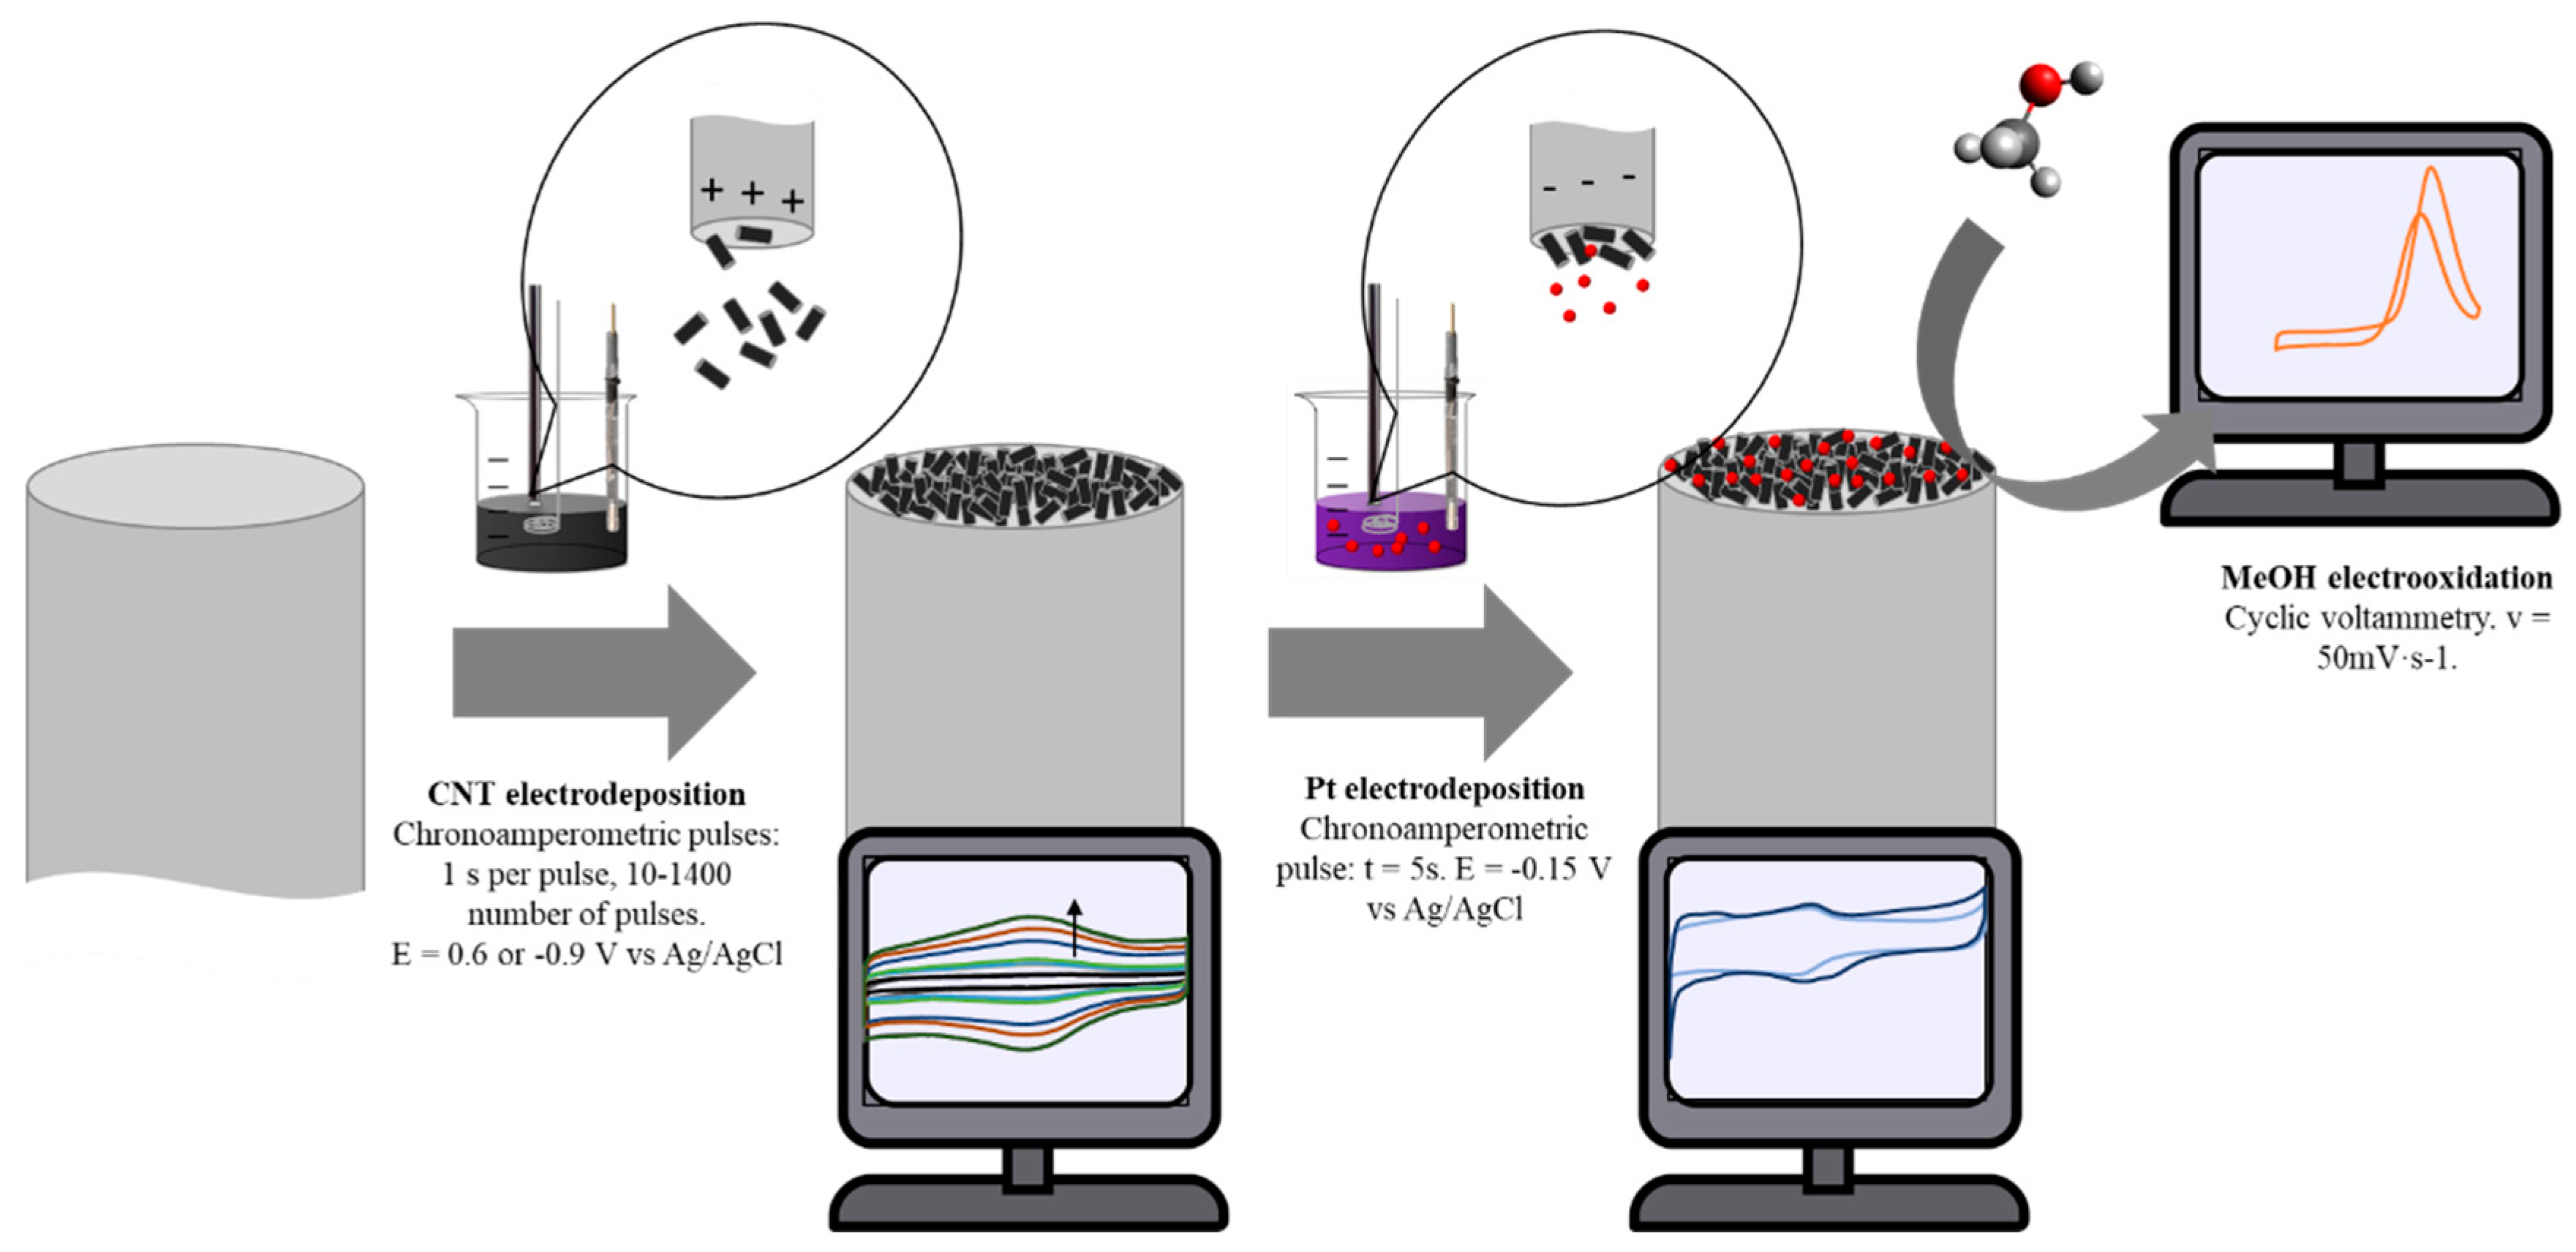
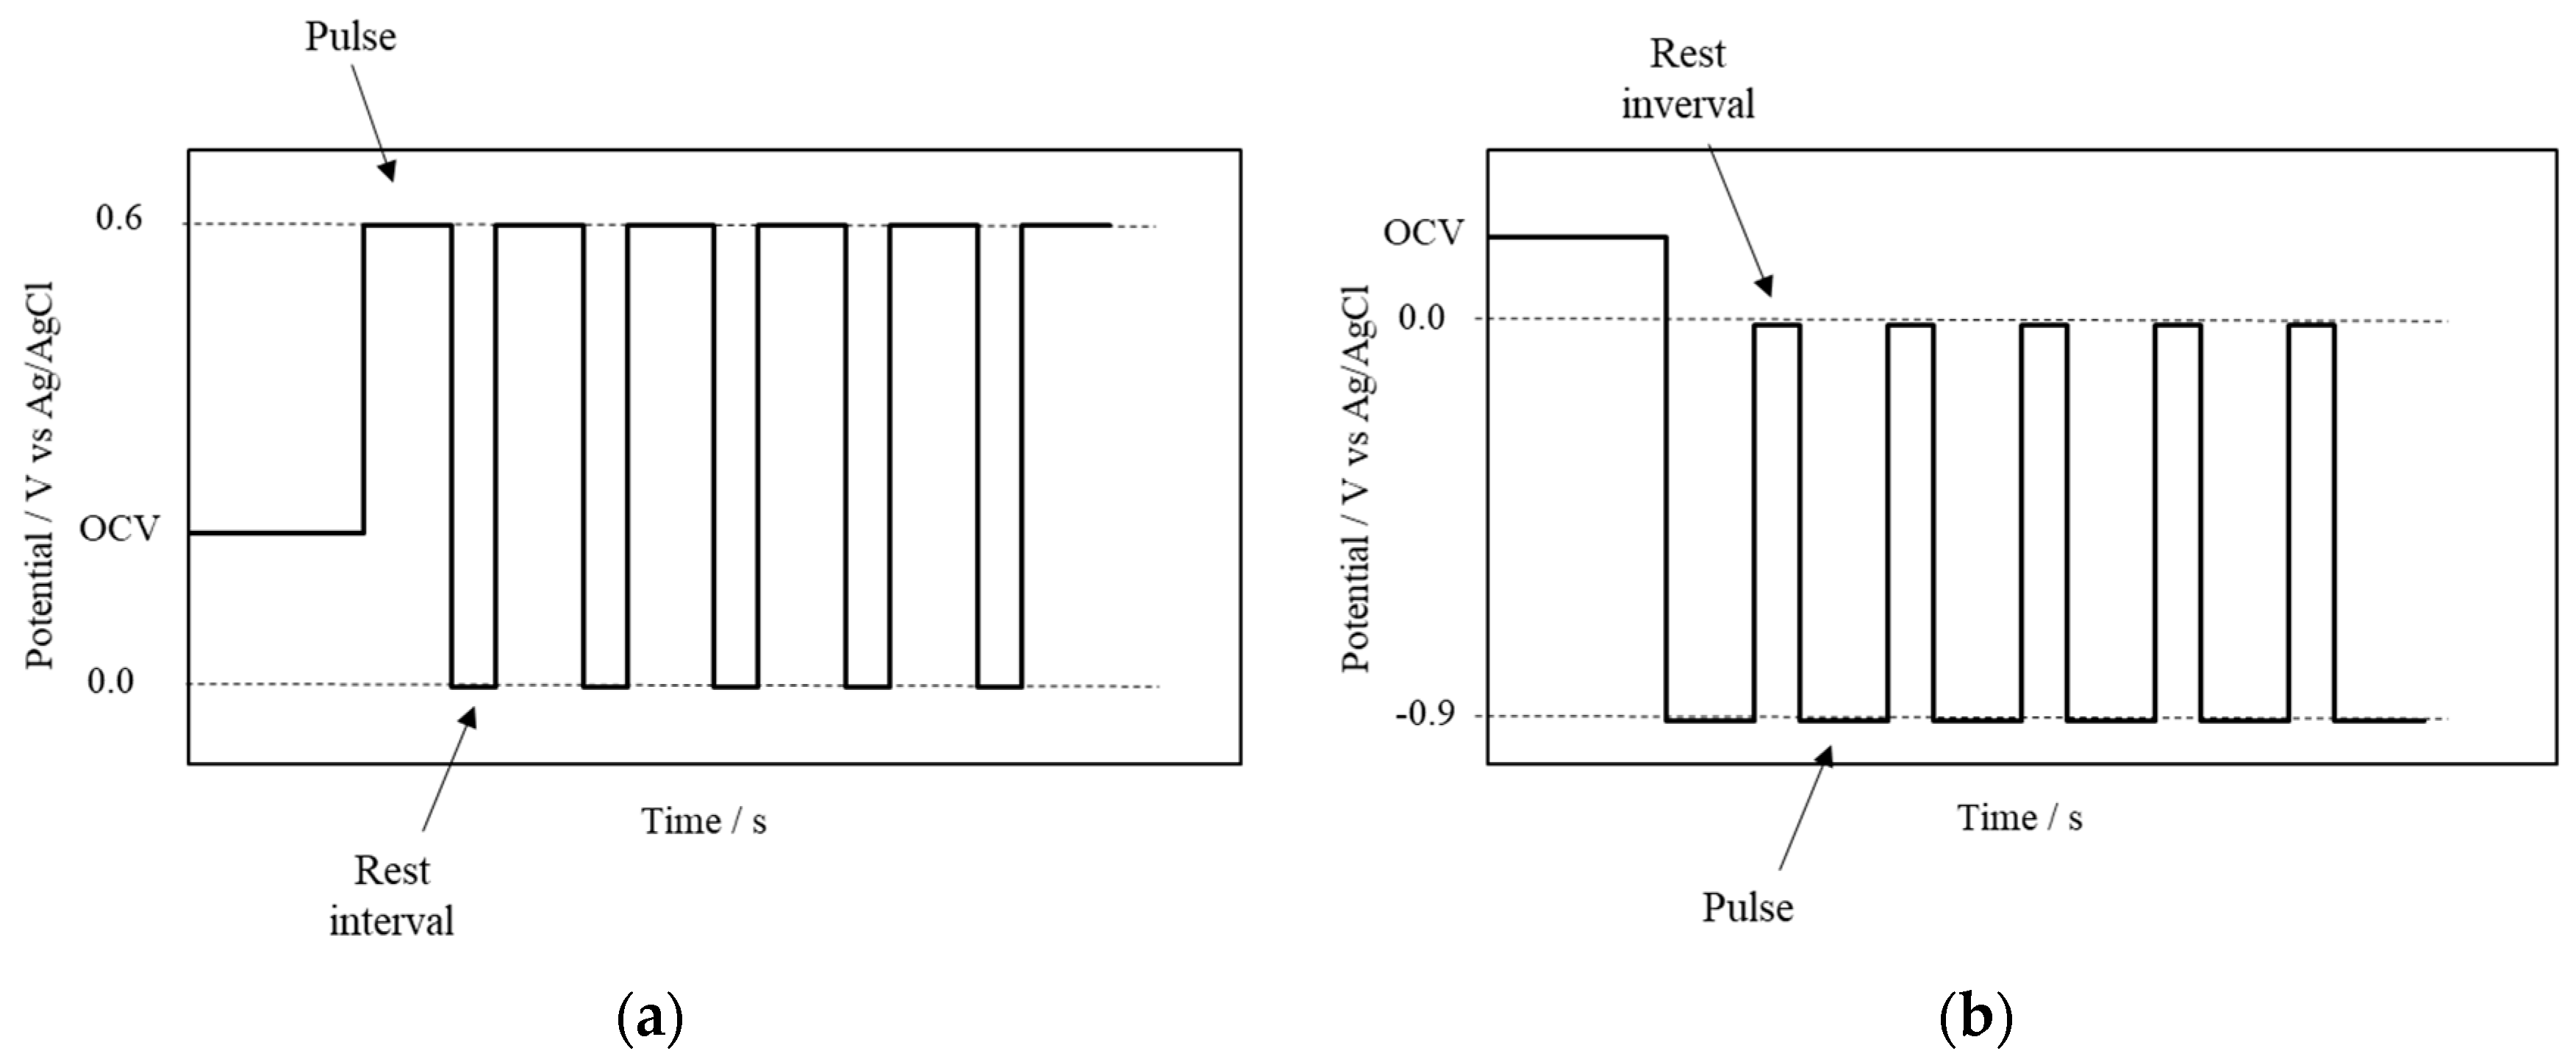
2.4. Electrochemically Assisted Deposition of fCNTs

Electrochemical characterization (cyclic voltammetry) and electrochemically assisted deposition were performed using a Biologic VSP potentiostat with a standard three-electrode cell configuration, with a platinum wire as the counter electrode and Ag/AgCl/Cl- electrode as the reference electrode. Figure 1 shows a schematic representation of the experimental procedure.
The electrochemically assisted deposition of fCNTs was performed on the surface of a polished glassy carbon bar (GC). First, the cyclic voltammetry (CV) response of the GC was recorded in a nitrogen-saturated 0.5 M H2SO4 solution (potential range of −0.2 and 0.8 V vs. Ag/AgCl, scan rate of 50 mV s−1). Then, the GC was moved to the fCNT working solution. Afterwards, the electrochemically assisted deposition of fCNTs was performed through pulsed chronoamperometric treatments. Figure 2 shows the scheme of the potential step of multiple steps programs. The working electrode was immersed in the solution at the open circuit potential (OCV). Then, chronoamperometric pulses of 1 s were applied at a controlled potential of 0.6 or −0.9 V vs. Ag/AgCl for a total of 10–1400 pulses. The electrochemically assisted pulses were applied with rest intervals of 0.5 s in which the potential was fixed at 0.0 V vs. Ag/AgCl.
The nomenclature is as follows: fCNT-p for the positive pulses at 0.6 V vs. Ag/AgCl and fCNT-n for the negative pulses at −0.9 V vs. Ag/AgCl. Furthermore, in the cases in which 0.01 M Na2SO4 solution was used in the dispersion of fCNTs, the nomenclature of the final electrodes is fCNT-p-Na and fCNT-n-Na for positive and negative pulses, respectively.

2.5. Electrochemical Characterization of Electrochemically Assisted Deposited fCNTs

After 10, 40, 80, 130, 200, 300, 500, 800, and 1400 accumulated pulses, the electrodeposition was stopped, and the working electrode was withdrawn for fCNT dispersion. The electrode was rinsed in ultrapure water several times, dried using an infrared lamp, and moved to the 0.5 M H2SO4 solution in order to determine the cyclic voltammetric response.

2.6. Electrodeposition of Platinum Nanoparticles

The electrodeposition of platinum nanoparticles was carried out in two different electrodes: bare GC and fCNT-Na-p. The two working electrodes were immersed in a 0.5 M H2SO4 solution containing 5 mM of H2PtCl6 at a controlled potential of 0.6 V vs. Ag/AgCl (in which the platinum electrodeposition does not take place). After this, a potential pulse was carried out to −0.15 V vs. Ag/AgCl for 5 s. The resultant samples are referred to as Pt/GC and Pt/fCNT-p-Na.

2.7. Physicochemical Characterization

The textural properties of CNTs and fCNTs were evaluated by N2-adsorption isotherms at −196 °C in an automatic adsorption system (Autosorb-6, Quantachrome). Prior to the measurements, the samples were degassed at 150 °C for 8 h under vacuum. Apparent surface areas were determined using the Brunauer–Emmett–Teller (BET) method, and total micropore volume (pore size < 2 nm) was assessed by applying the Dubinin–Radushkevich (VDR) equation to the N2-adsorption isotherms.
The samples were characterized by field-emission scanning electronic microscopy (FESEM) with a Merlin VP Compact microscope, BRUKER, operating at 30 kV with a spatial resolution of 0.8 nm. Temperature-programmed desorption (TPD) experiments were performed with DSC-TGA equipment (TA Instruments, SDT 2960 Simultaneous) coupled to a mass spectrometer (Thermostar, Balzers, GSD 300 T3), which was used to follow the m/z lines related to the decomposition of the surface functional groups from the surface of the CNTs and fCNTs. The thermobalance was purged for 2 h under a helium flow rate of 100 mL·min−1 and then heated up to 950 °C with a heating rate of 20 °C min−1. Raman experiments were performed using a dispersive Raman system (Jasco NRS-5100, laser wavelength: 532 nm).

2.8. Electrocatalytic Test towards Methanol Electrooxidation

The electrocatalytic activity towards methanol (MeOH) electrooxidation of the different electrodes was studied through cyclic voltammetry in a nitrogen-saturated 0.5 M H2SO4 solution, containing 0.1 M of MeOH at a scan rate of 50 mV s−1 and between a potential range of 0.06 and 1.0 V vs. Ag/AgCl. The electrochemical stability of the samples was evaluated for 1 h of MeOH electrooxidation.

3. Results and Discussion

Figure S1 shows the N2-adsorption isotherms of CNTs and fCNTs, and Table 1 summarizes the most important porous texture data. Both samples show type II isotherms [37], typical of non-porous solids. Furthermore, hysteresis is observed in CNTs and fCNTs due to the capillary condensation that takes place in the space between carbon nanotubes. The differences between the hysteresis loops of CNTs and fCNTs are due to changes in NT aggregation as consequence of functionalization. BET surface areas are in agreement with typical values in carbon nanotubes [38]. Interestingly, the BET surface area of fCNTs is slightly higher than CNTs, probably because of the formation of oxygen functional groups during the acid treatment. Such oxygen species promote higher inter-CNT space because of a lower degree of stacking. Raman spectra were obtained for the fCNT and CNT samples (Figure S2). It can be observed that both spectra show a similar profile, which indicates that the functionalization does not modify the structure of the pristine CNTs.
The surface chemistry of fCNTs and CNTs was studied by temperature-programmed desorption (TPD). The decomposition of surface oxygen functionalities using TPD is widely used for characterizing the surface chemistry of carbon materials. CO2 evolution is associated with the decomposition of anhydride, carboxylic, and lactone groups [39,40,41,42], whereas the CO evolution is related to the decomposition of anhydride, carbonyl, phenol, and ether groups [39,40,41,42]. Figure 3 shows that the CNTs sample has a significant CO evolution where two contributions predominate. The first one at 620 °C is mainly related to the carbothermal reduction of the metallic traces that the carbon nanotubes contain. The desorption at higher temperatures observed in the CNTs sample is attributed to the presence of phenolic and carbonyl groups [39,40]. In the case of the fCNTs sample, the evolution of CO and CO2 is significantly higher than for the CNTs sample due to the oxidation treatment (Table 1 and Figure 3). The CO2 profile shows three regions: a peak at around 250 °C due to the decomposition of carboxylic groups, a peak below 500 °C due to the decomposition of anhydrides, and a desorption at higher temperatures associated with lactone group decomposition. In this sample, the peak at 620 °C is not appreciated in the CO evolution since the functionalization treatment in nitric acid can also eliminate the metallic moieties of the pristine carbon nanotubes [43]. In the CO profile, a peak at around 500 °C is observed due to anhydride. The CO peak between 600 and 800 °C and the desorption observed at higher temperatures can be attributed to the decomposition of phenol and carbonyl groups. The higher number of oxygen functional groups results in a higher wettability and an easier dispersion of carbon materials in ultrapure water [44]. Therefore, fCNTs can be dispersed in ultrapure water as described in the experimental section for the electrochemically assisted deposition experiments.

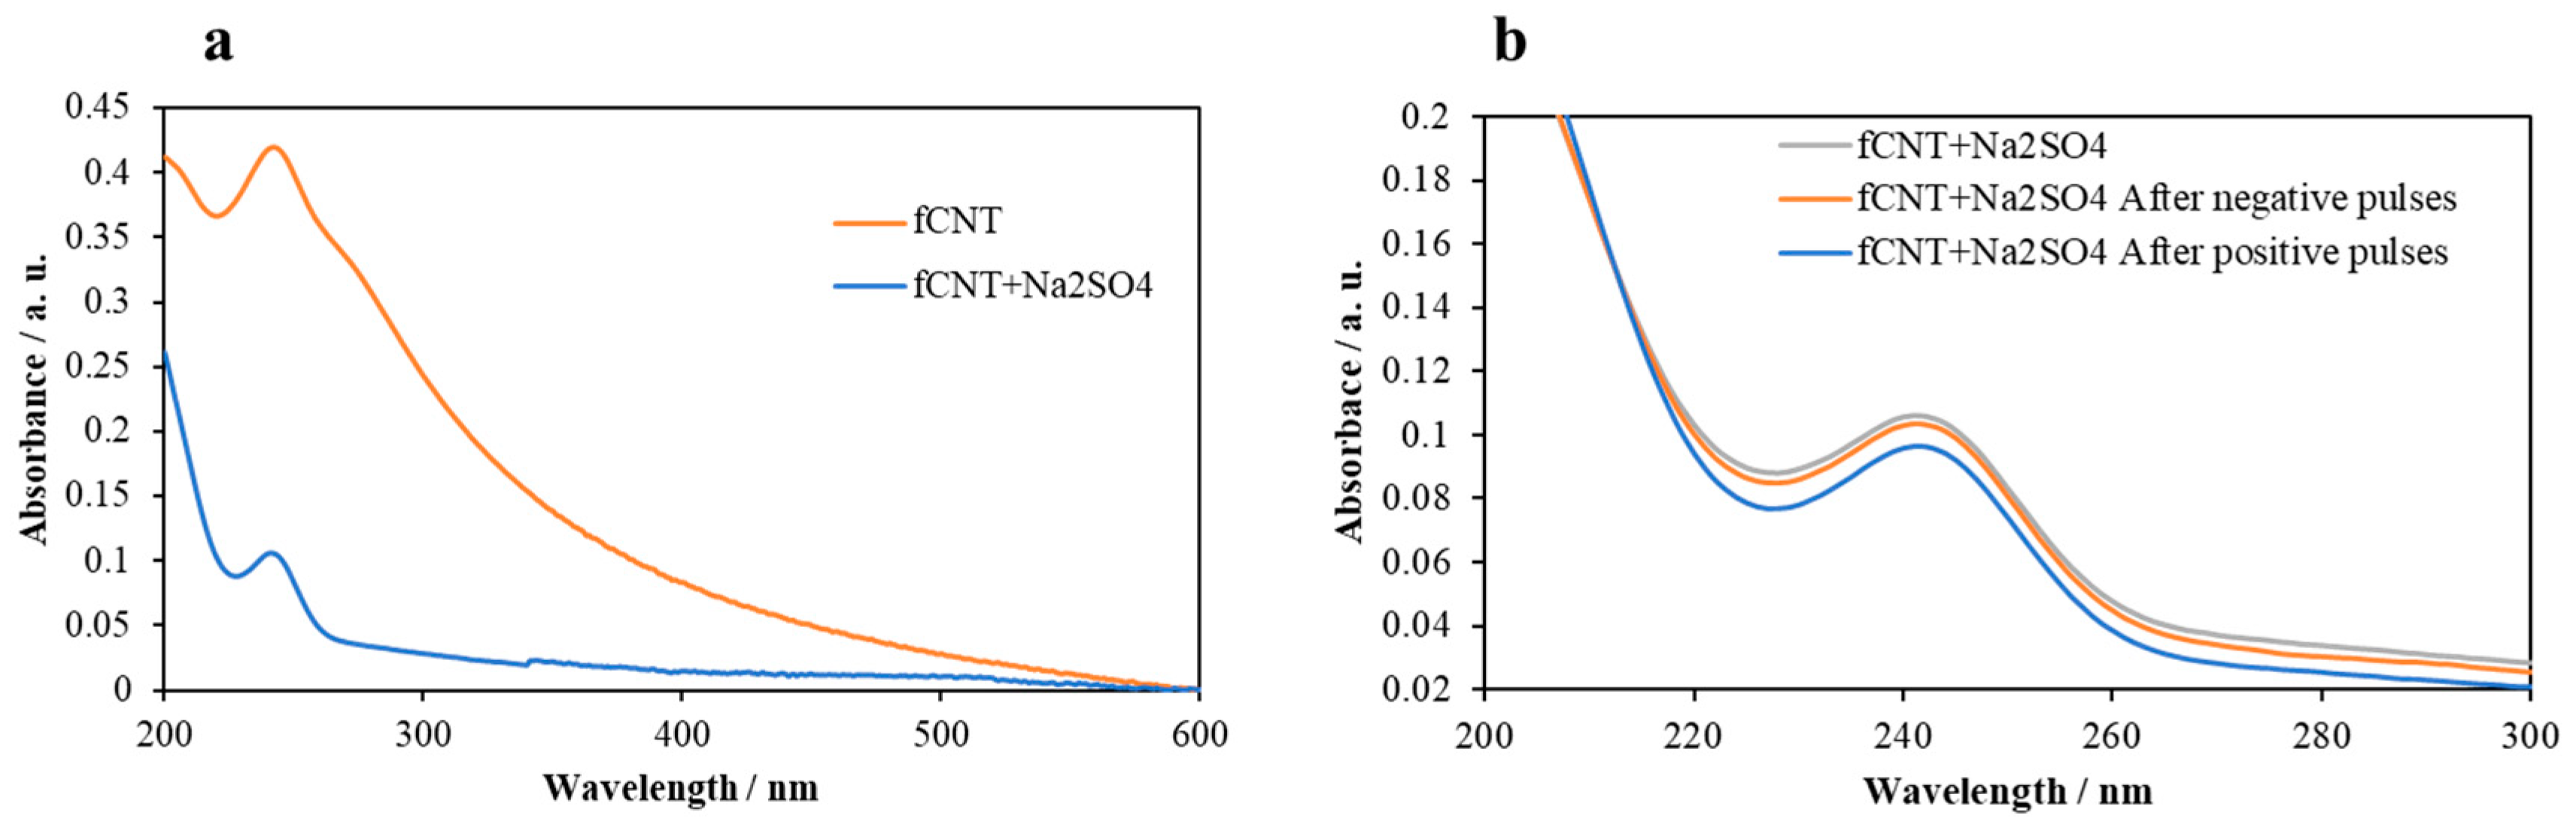
3.1. Characterization of the fCNT dispersions

After the preparation of the fCNT working solutions and prior to the electrodeposition of carbon nanotubes, the effect of the addition of the supporting electrolyte in the fCNT dispersion was studied by means of UV–Vis analysis (see Figure 4).
The whole UV–Vis spectrum of the fCNTs solution displays a significant decrease in the contribution of the peak at 241 nm after the addition of 0.1 M Na2SO4. The addition of supporting electrolyte may lead to some surface charge screening in the fCNTs, thereby generating a decrease of the solubility of functionalized carbon nanotubes in the aqueous medium [33], which was also appreciable due to the appearance of fCNT deposits in the bottom of the flask. Moreover, the negatively charged oxygen functional groups of the fCNTs, such as -COOH species, can lead to the formation of sodium salt that can also be responsible for the decrease of the UV–Vis absorbance profile. The concentration of the dispersed fCNTs was further checked by controlled evaporation of water at mild conditions, obtaining values of 0.24 mg·mL−1 in the absence of Na2SO4 and 0.06 mg·mL−1 in presence of supporting electrolyte.
From the comparison of the fCNT dispersion in presence of supporting electrolyte before and after the electrochemical deposition, an interesting observation must be highlighted (also included in Figure 4). After the electrodeposition, a slight decrease of the contribution of the peak at 241 nm appears related to the decrease of the fCNT concentration. Although electrochemical deposition at positive and negative potential show similar trends, it should be pointed out that there exists a larger decrease of the contribution of this peak by using positive potentials in the chronoamperometric deposition. This may be associated with the fact that positive potentials would lead to a higher quantity of electrodeposited carbon nanotubes.

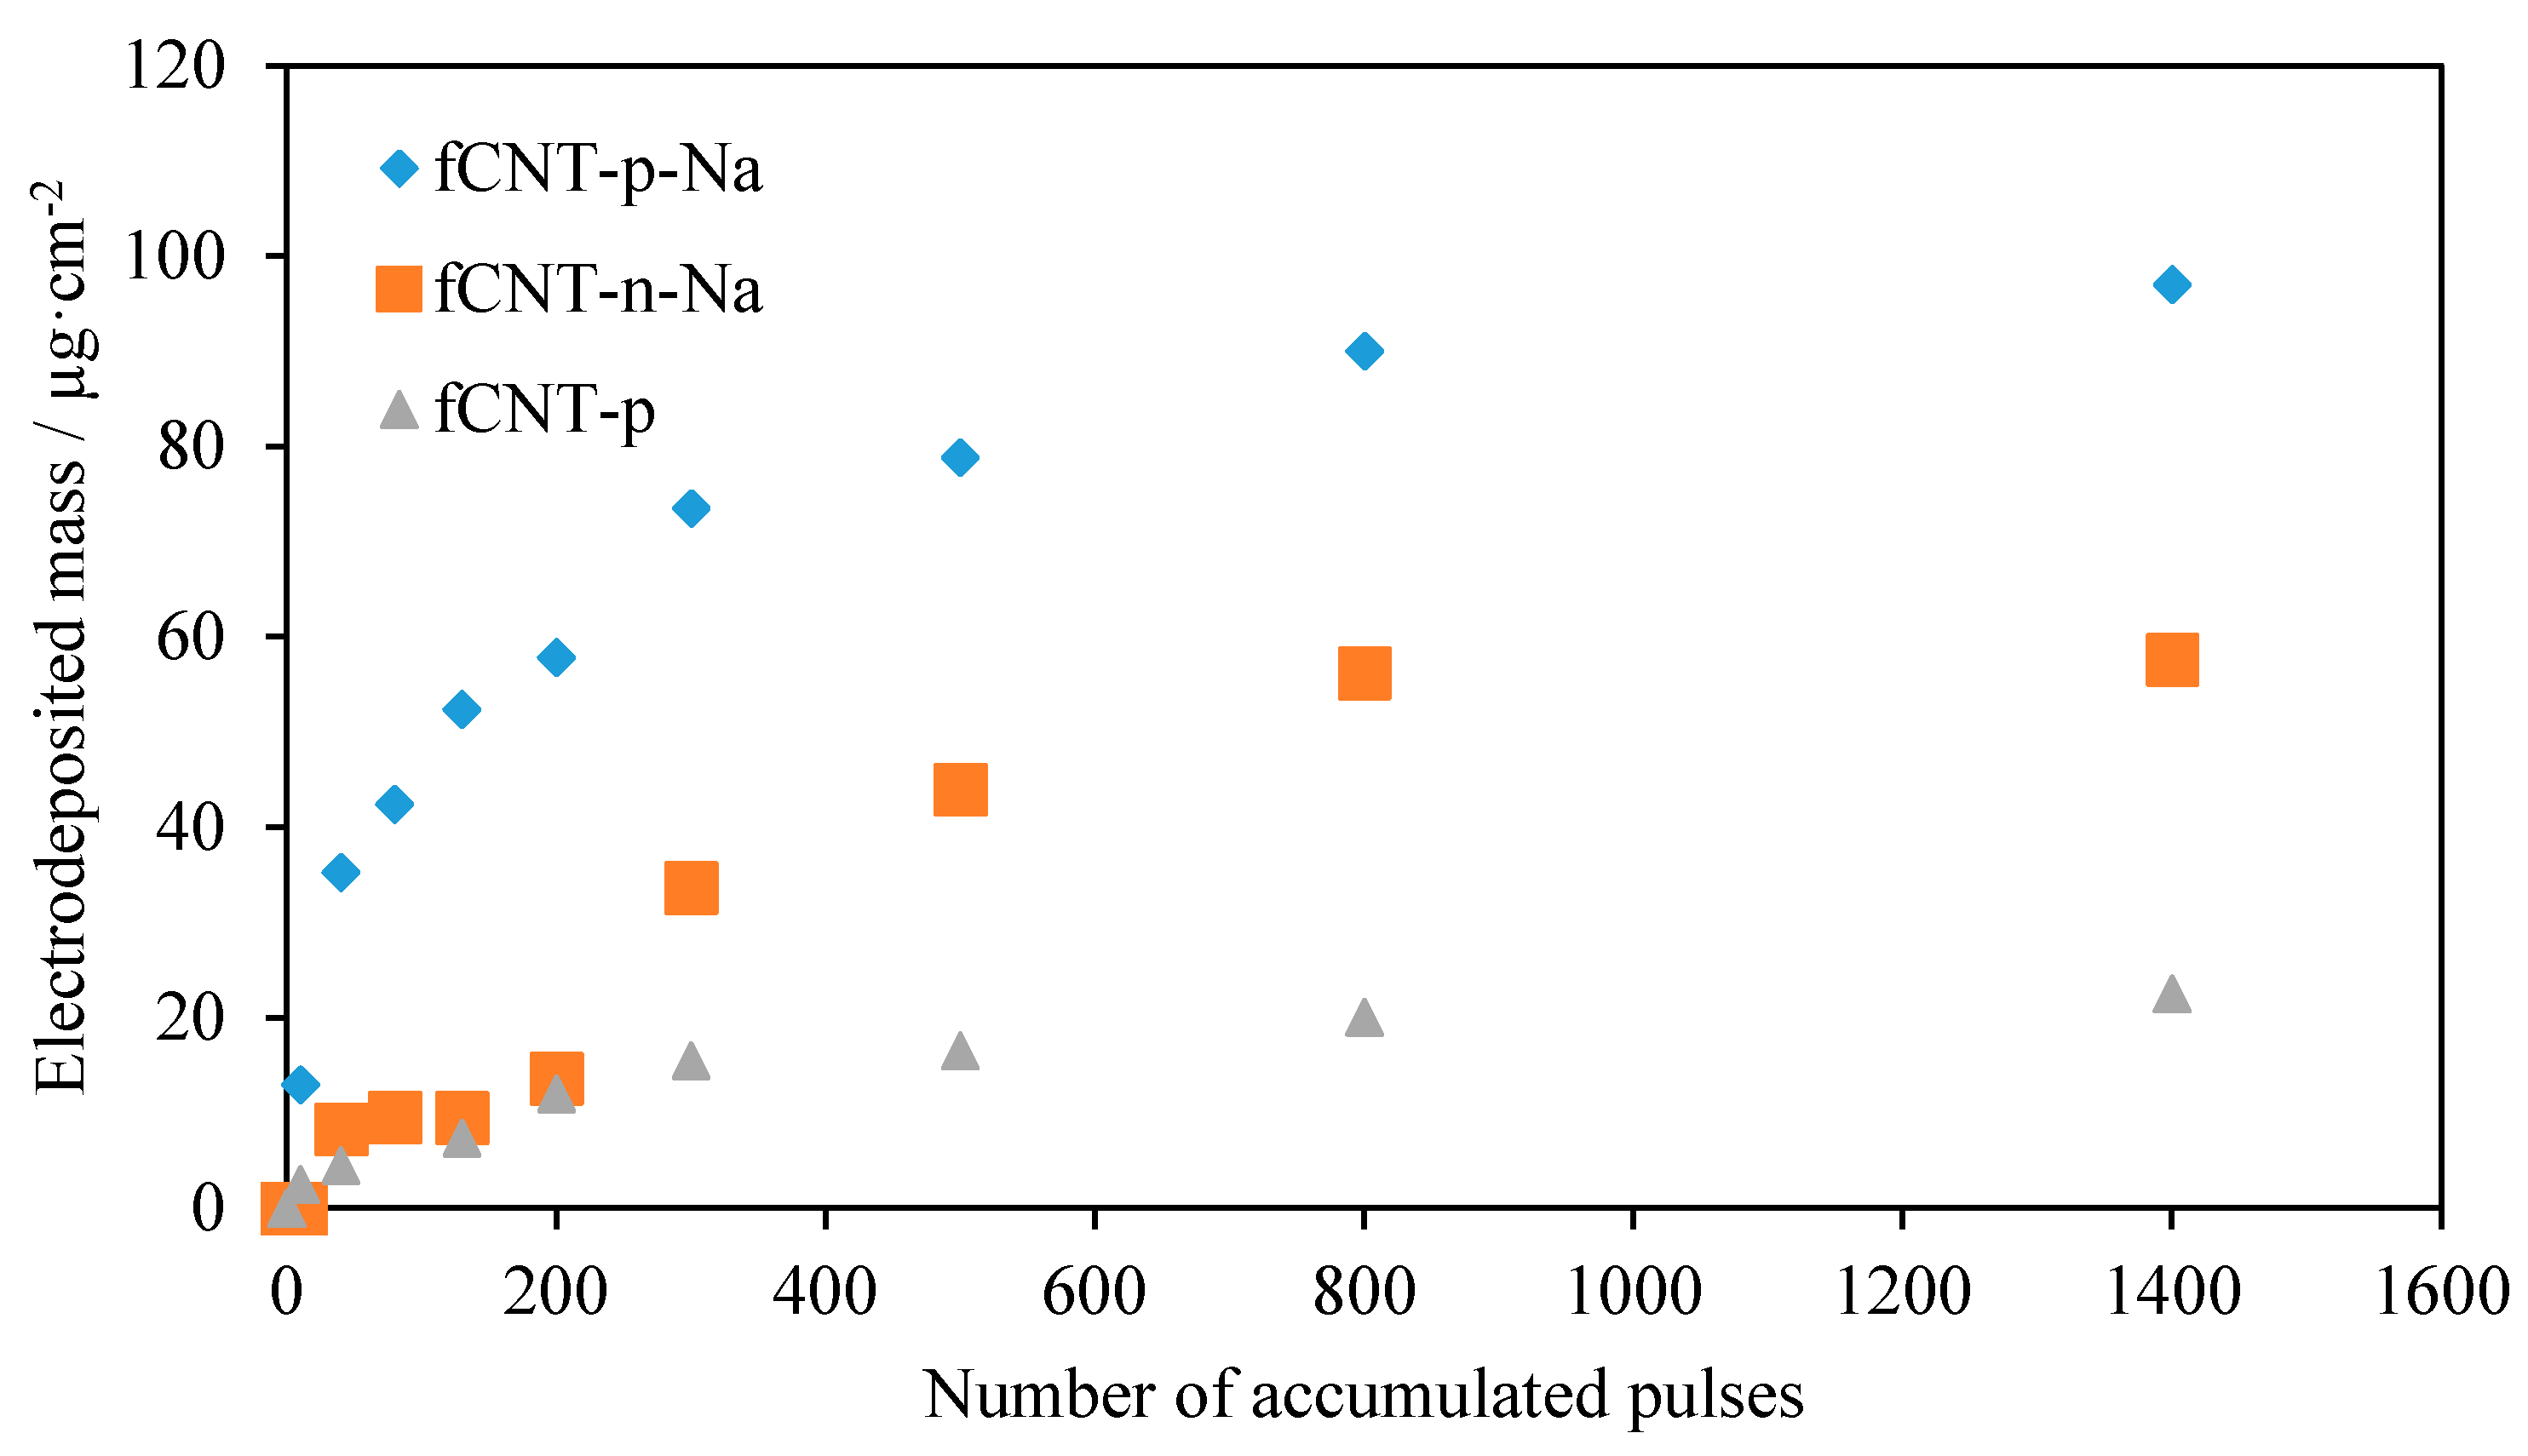
3.2. Electrochemically Assisted Deposition of fCNTs

Figure 5 shows the cyclic voltammetric profiles obtained after the electrochemical deposition of fCNTs over a glassy carbon electrode in the presence of the supporting electrolyte under potential steps with positive potential (Figure 5a) and negative potential (Figure 5b) polarizations. After the electrodeposition of fCNTs, an increase in the current of the double layer charge (i.e., the capacitance) of the CV profile is noticeable. The higher the number of applied pulses, the higher the charge in the cyclic voltammograms. A blank experiment where the bare GC was exposed to the same pulse electrochemical treatment in the absence of fCNTs did not render any relevant modification of the electrical double layer charge observed by means of CV (results not included in Figure 5 for the sake of clarity). Therefore, the increase in the capacitance is undoubtedly related to the electrochemically assisted deposition of fCNTs. In addition, the quantity of electrodeposited fCNTs seems to grow with the number of pulses, thereby explaining the rise of the current of the double layer charge of the working electrode. If the electrodeposition is performed without supporting electrolyte, the same effect is observed, as shown in Figure 5c, although the increase in the capacitance is lower due to the lower quantity of electrodeposited fCNTs. Interestingly, although the supporting electrolyte results in a lower concentration of fCNTs in the working solution, the presence of Na2SO4 leads to increased fCNT deposition during the chronoamperometric analysis.
The calculated quantities of deposited fCNTs are presented in Figure 6. The gravimetric capacitance of pristine fCNTs was previously calculated and determined to be 49 F g−1. Therefore, the quantity of electrodeposited fCNTs was calculated from the difference between the capacitance of the pristine glassy carbon and the value of the CV profile after the electrochemically assisted deposition. From such differences and employing the determined capacitance, the mass of fCNTs on the GC electrode was obtained. By comparing the loading of fCNTs after the positive chronoamperometric pulses, it is possible to observe the important difference resulting from employing a supporting electrolyte (Figure 6). After 1400 pulses, fCNT-p-Na shows a surface loading of around 97 µg cm−2, whereas by using the same number of pulses without the supporting electrolyte (fCNT-p), the quantity of deposited fCNTs is 22 µg cm−2.
On the other hand, when comparing the effect of the polarization for the pulsed electrodeposition (in the presence of the supporting electrolyte), it is observed that higher surface loadings are achieved for positive polarization. This result is in agreement with the larger decrease in the absorbance on the UV–Vis of the fCNT dispersion after the positively polarized potential pulsed electrodeposition (Figure 4). This seems to be associated with the surface oxidation of the fCNTs in which the acidic groups generate a negative charge that can be attracted to the positive charge of the polarized working electrode. Moreover, when the working electrode is negatively polarized, the adsorption of sodium cations may occur, thus facilitating the adsorption of the negatively charged carbon nanotubes through a phenomenon known as the screening effect [45,46]. In any case, the electrochemical deposition of fCNTs is more favored under positive potential polarization.
Furthermore, if the same fCNTs + 0.1 Na2SO4 solution is reused with a second working electrode, the quantity of electrodeposited fCNTs is lower than in the first electrochemically assisted deposition for both positive potential and negative potential pulses, confirming the loss of fCNTs in the solution and the correct deposition of carbon nanotubes on the surface of the working electrode (Figures S3 and S4).

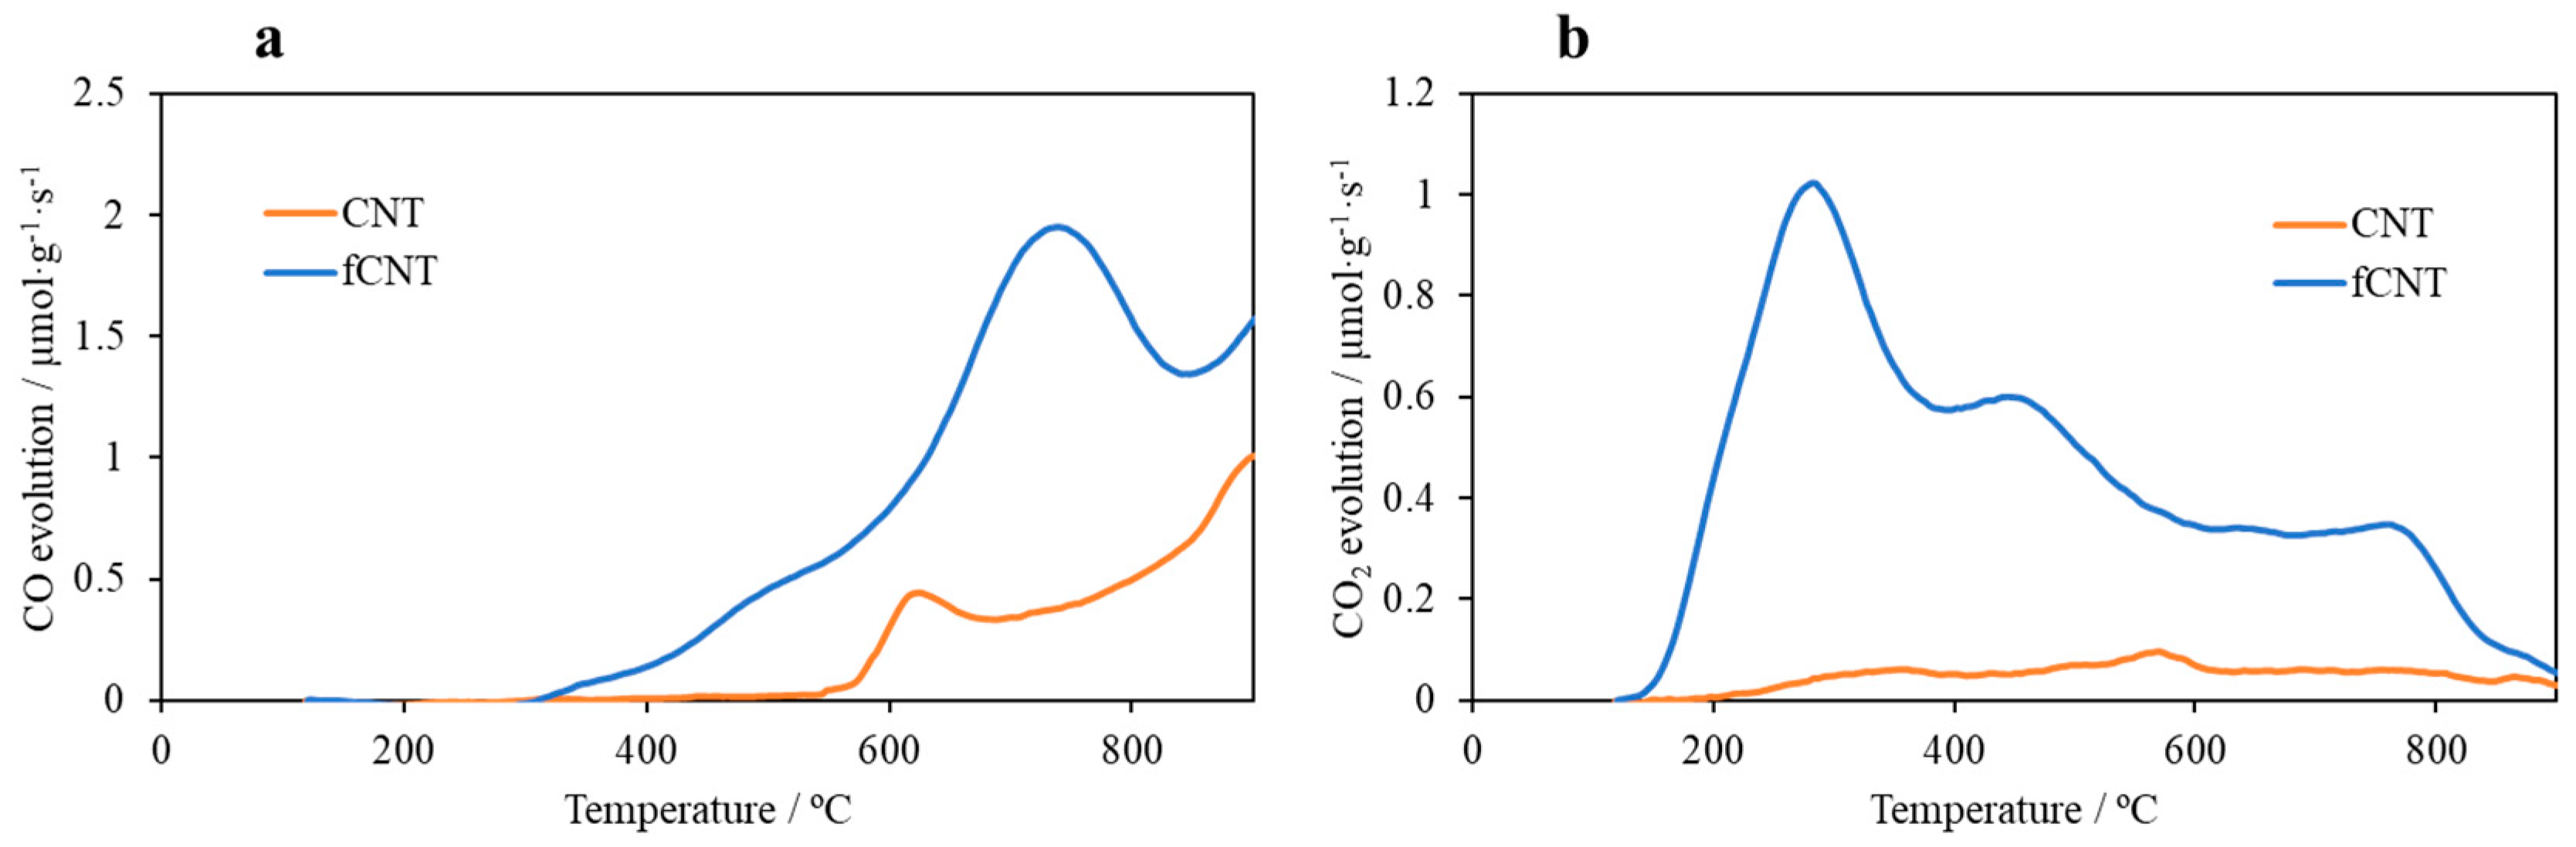
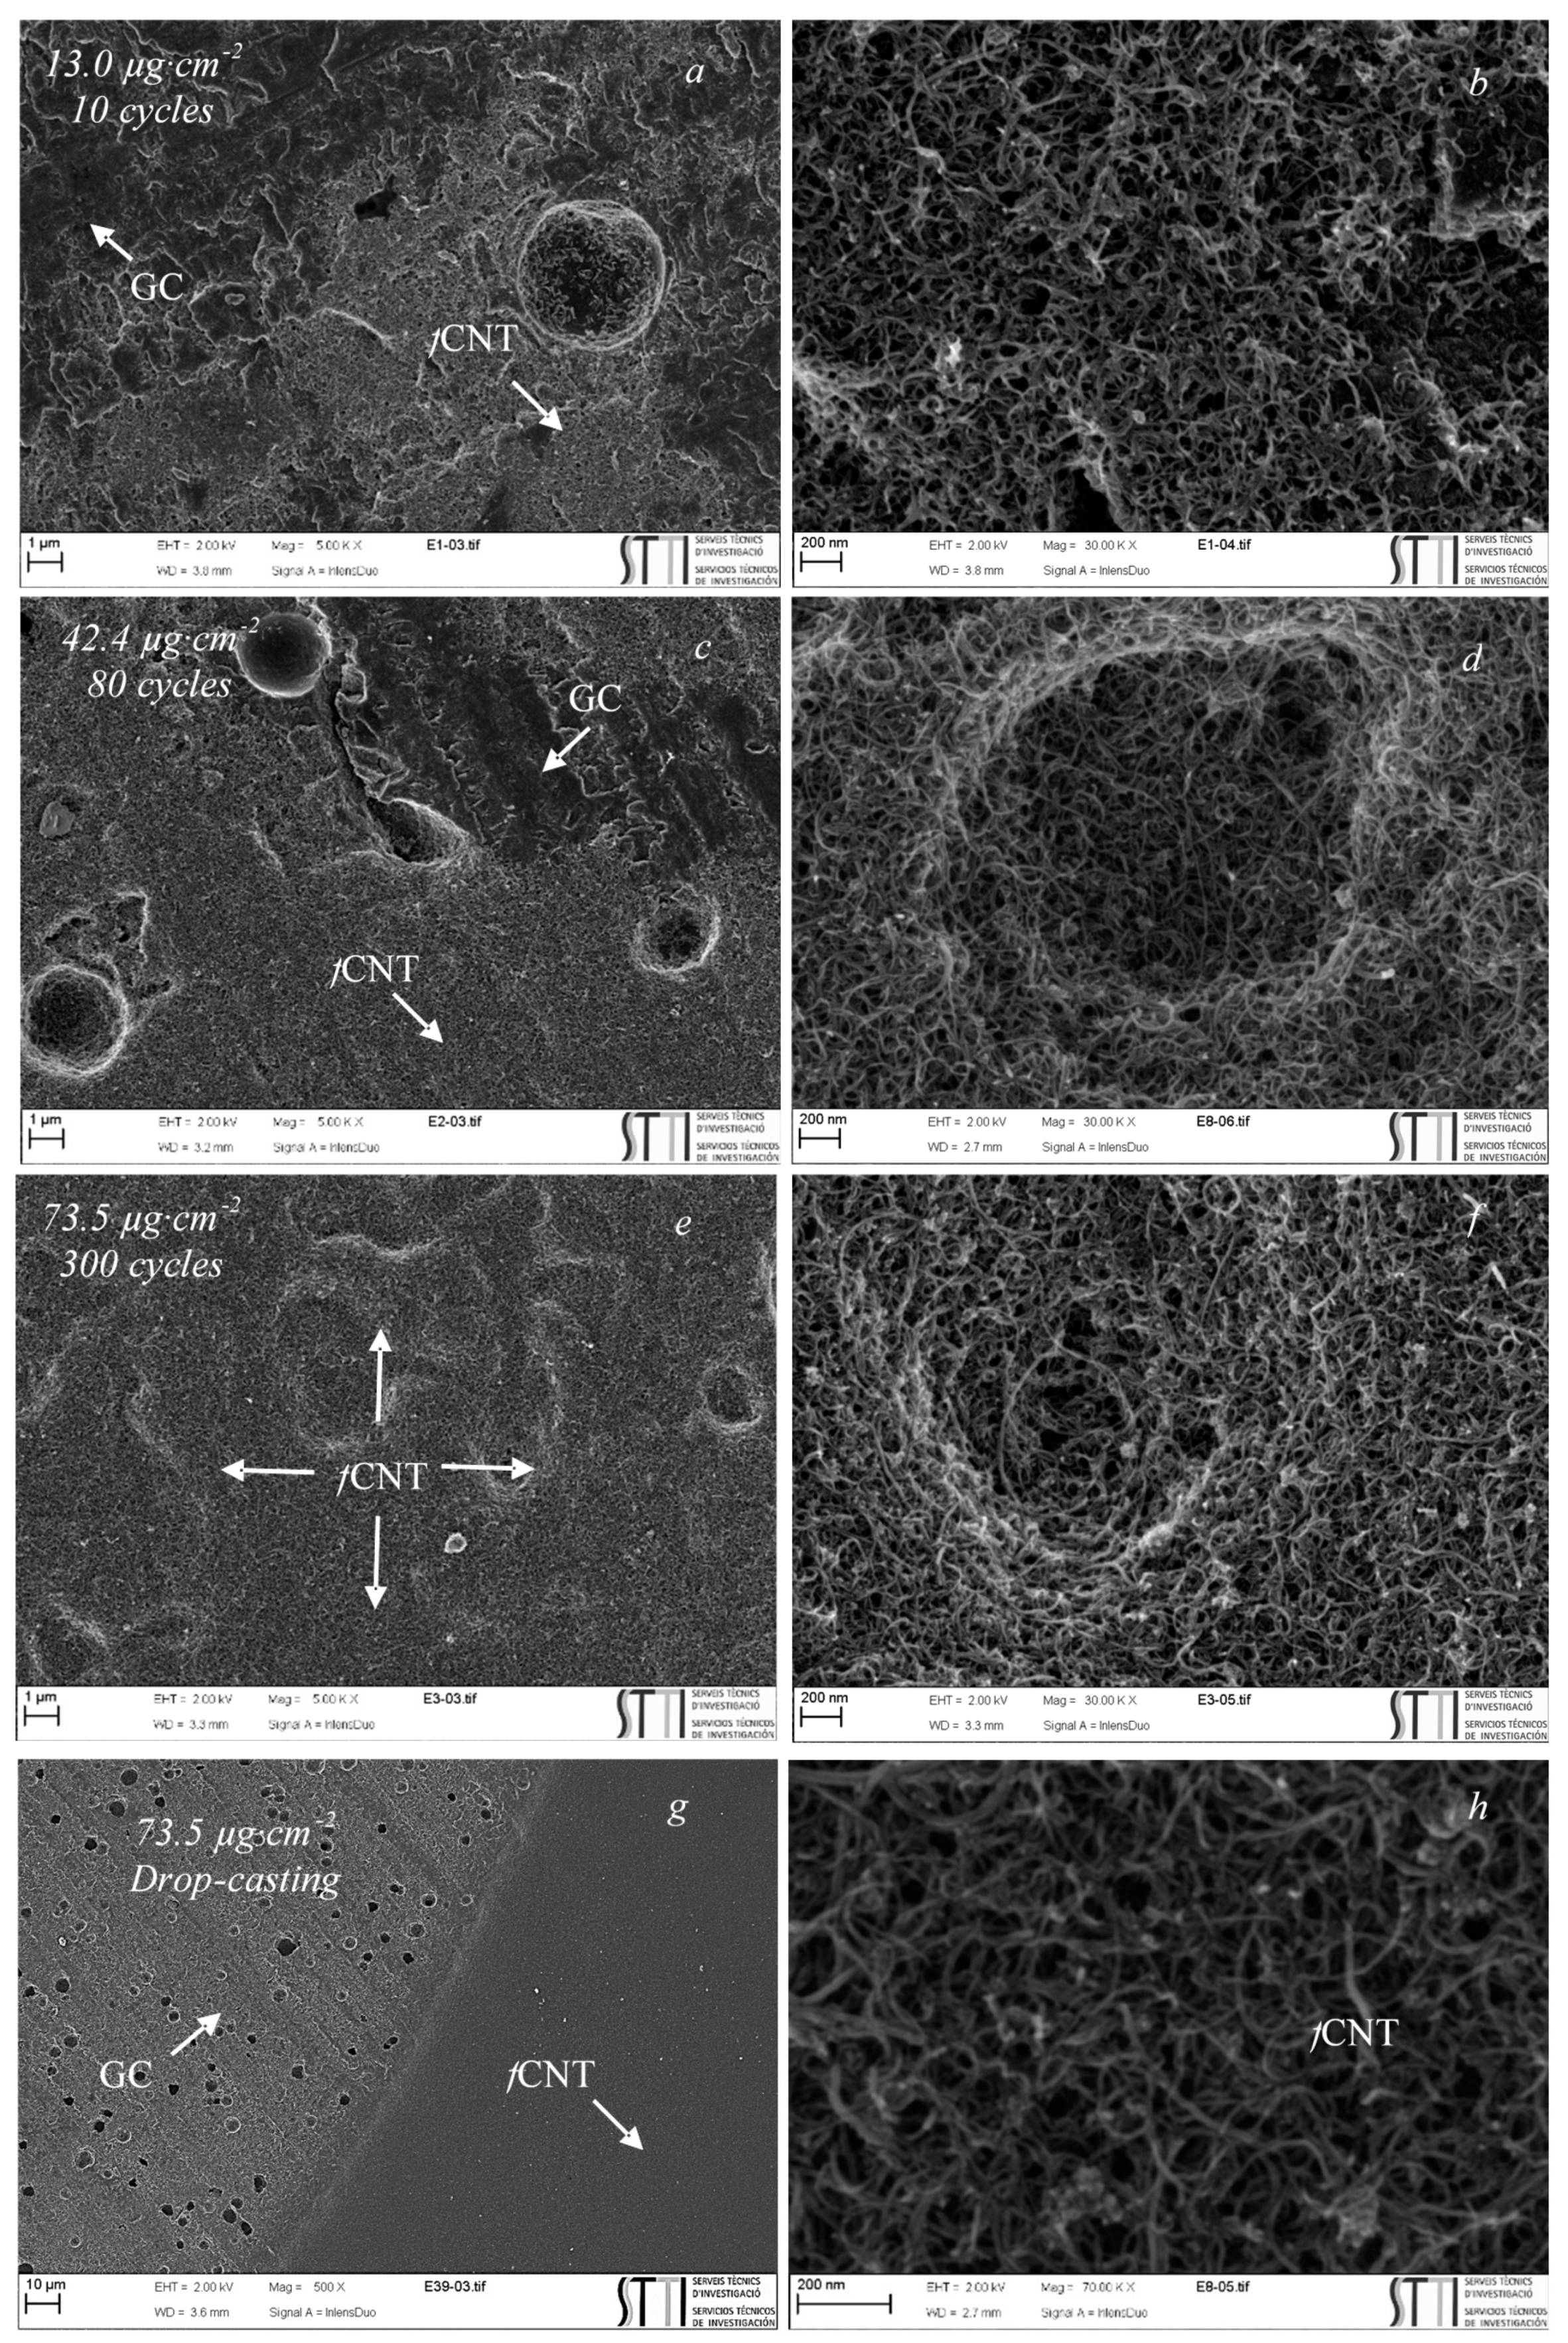
3.3. Physicochemical Characterization of the Electrodeposited fCNTs

Figure 7 shows FESEM images of the fCNT-p-Na, confirming that electrochemically assisted deposition of fCNTs results in a good dispersion of the carbon nanotubes over the surface of the glassy carbon. Moreover, this electrochemical method of potential step deposition enables a high control over the coverage of the surface of the working electrode. The higher the number of pulses, the higher the amount of coating. For more details, Figure 7a shows the fCNT-p-Na after 10 pulses. In this image, the typical structure of glassy carbon is observed with some small traces of the surface being covered by carbon nanotubes. Once a higher number of pulses is applied (80 and 300 pulses in Figure 7c,e), larger patches of the surface of the working electrode are covered by fCNTs. By increasing the number of pulses above 300 (Figure 7e), the full coverage of the working electrode is reached with a full and homogeneous distribution. Assuming a cylindrical shape for the fCNTs and that their external surface can be similar to the BET surface area (Table 1), the number of fCNTs required to achieve a monolayer coverage would be 1.1 µg cm−2. Taking into account the loading density at 300 pulses (73.5 µg cm−2, Figure 6), a thickness of only 66 fCNTs layer-equivalent for the electrochemically assisted deposited thin film was required to observe a full coverage of the glassy carbon surface. Figure 7g,h show FESEM images of fCNTs deposited on the surface of a glassy carbon through the drop-casting method with the same loading of fCNTs as in Figure 7e for comparison purposes. Interestingly, the good distribution achieved via the electrochemically assisted potential step deposition method is not possible through the drop-casting method in which the different phases of pristine glassy carbon and fCNTs are easily observed. The topology of the GC surface, which was still observed for the electrodeposited sample, is no longer observed in Figure 7g owing to the greater thickness of the denser fCNT patches.

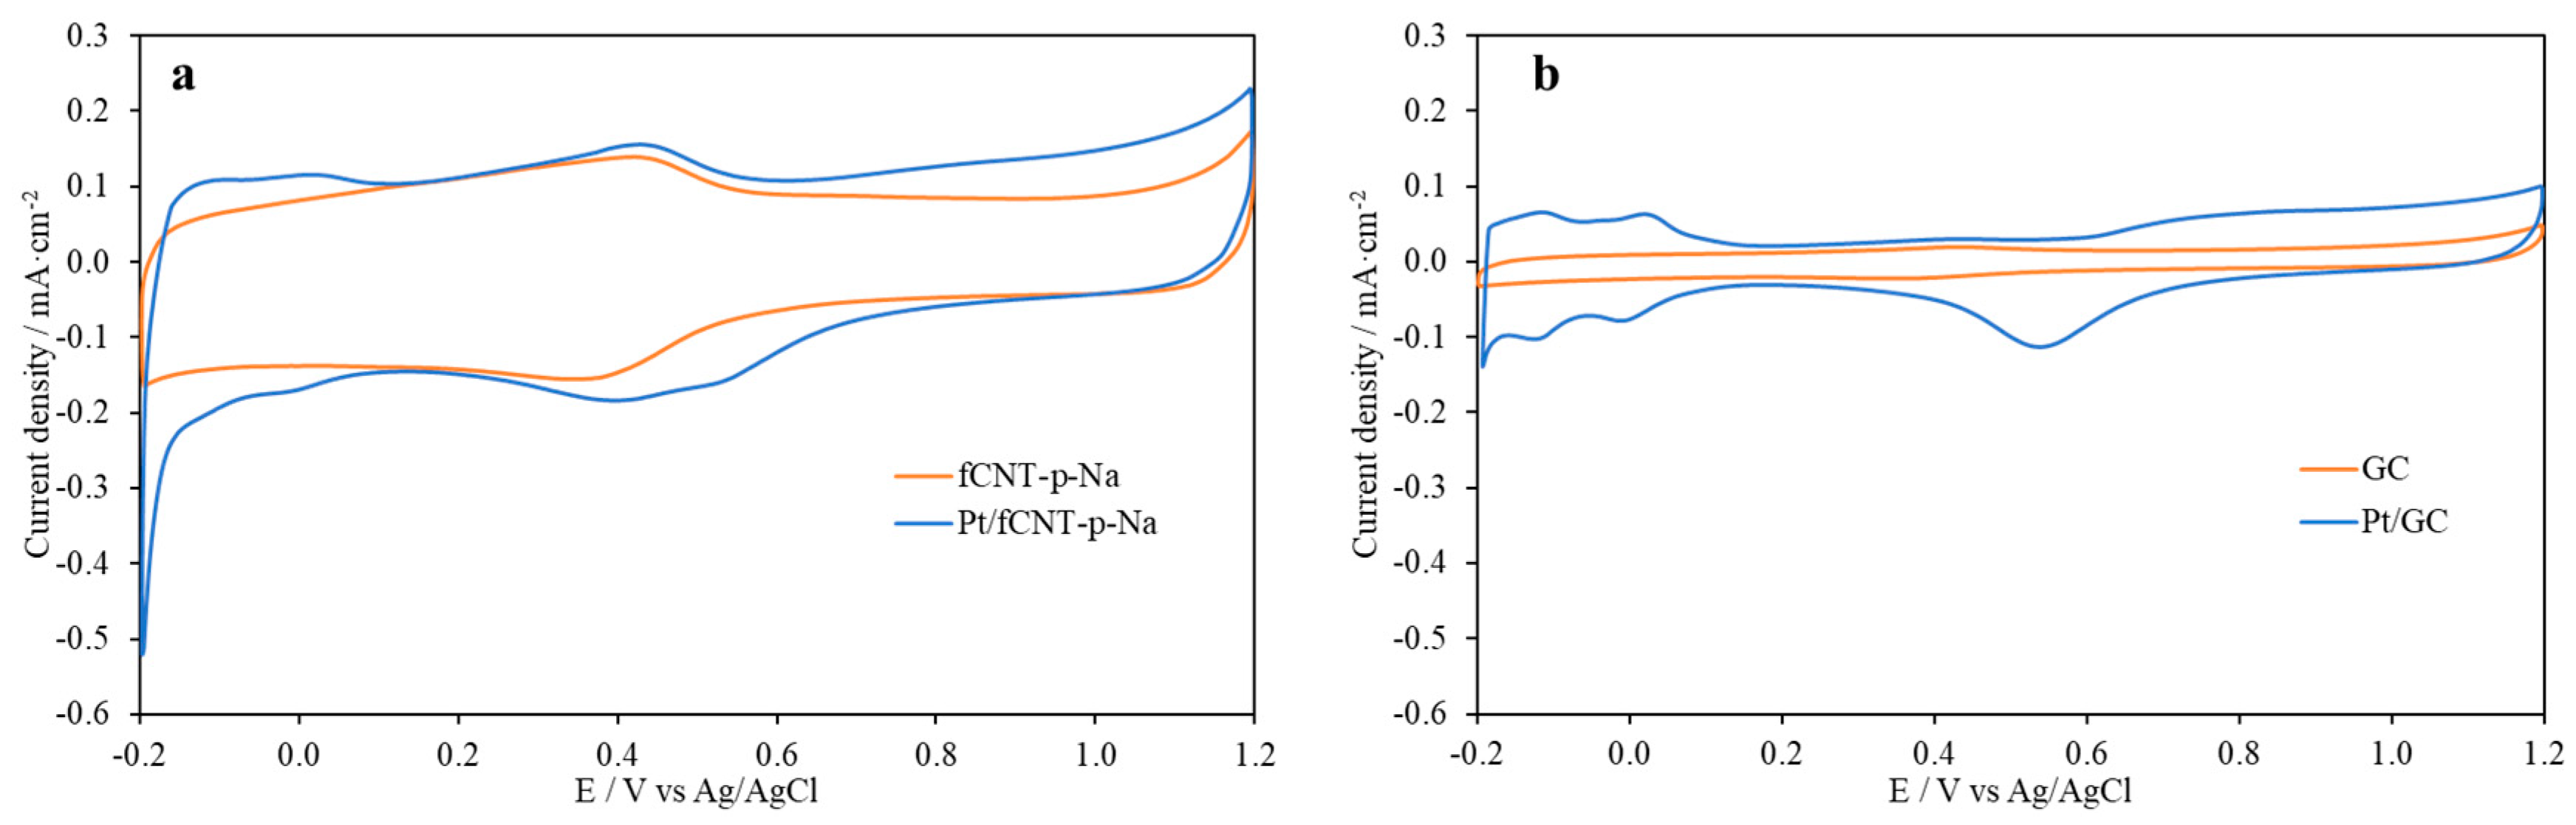
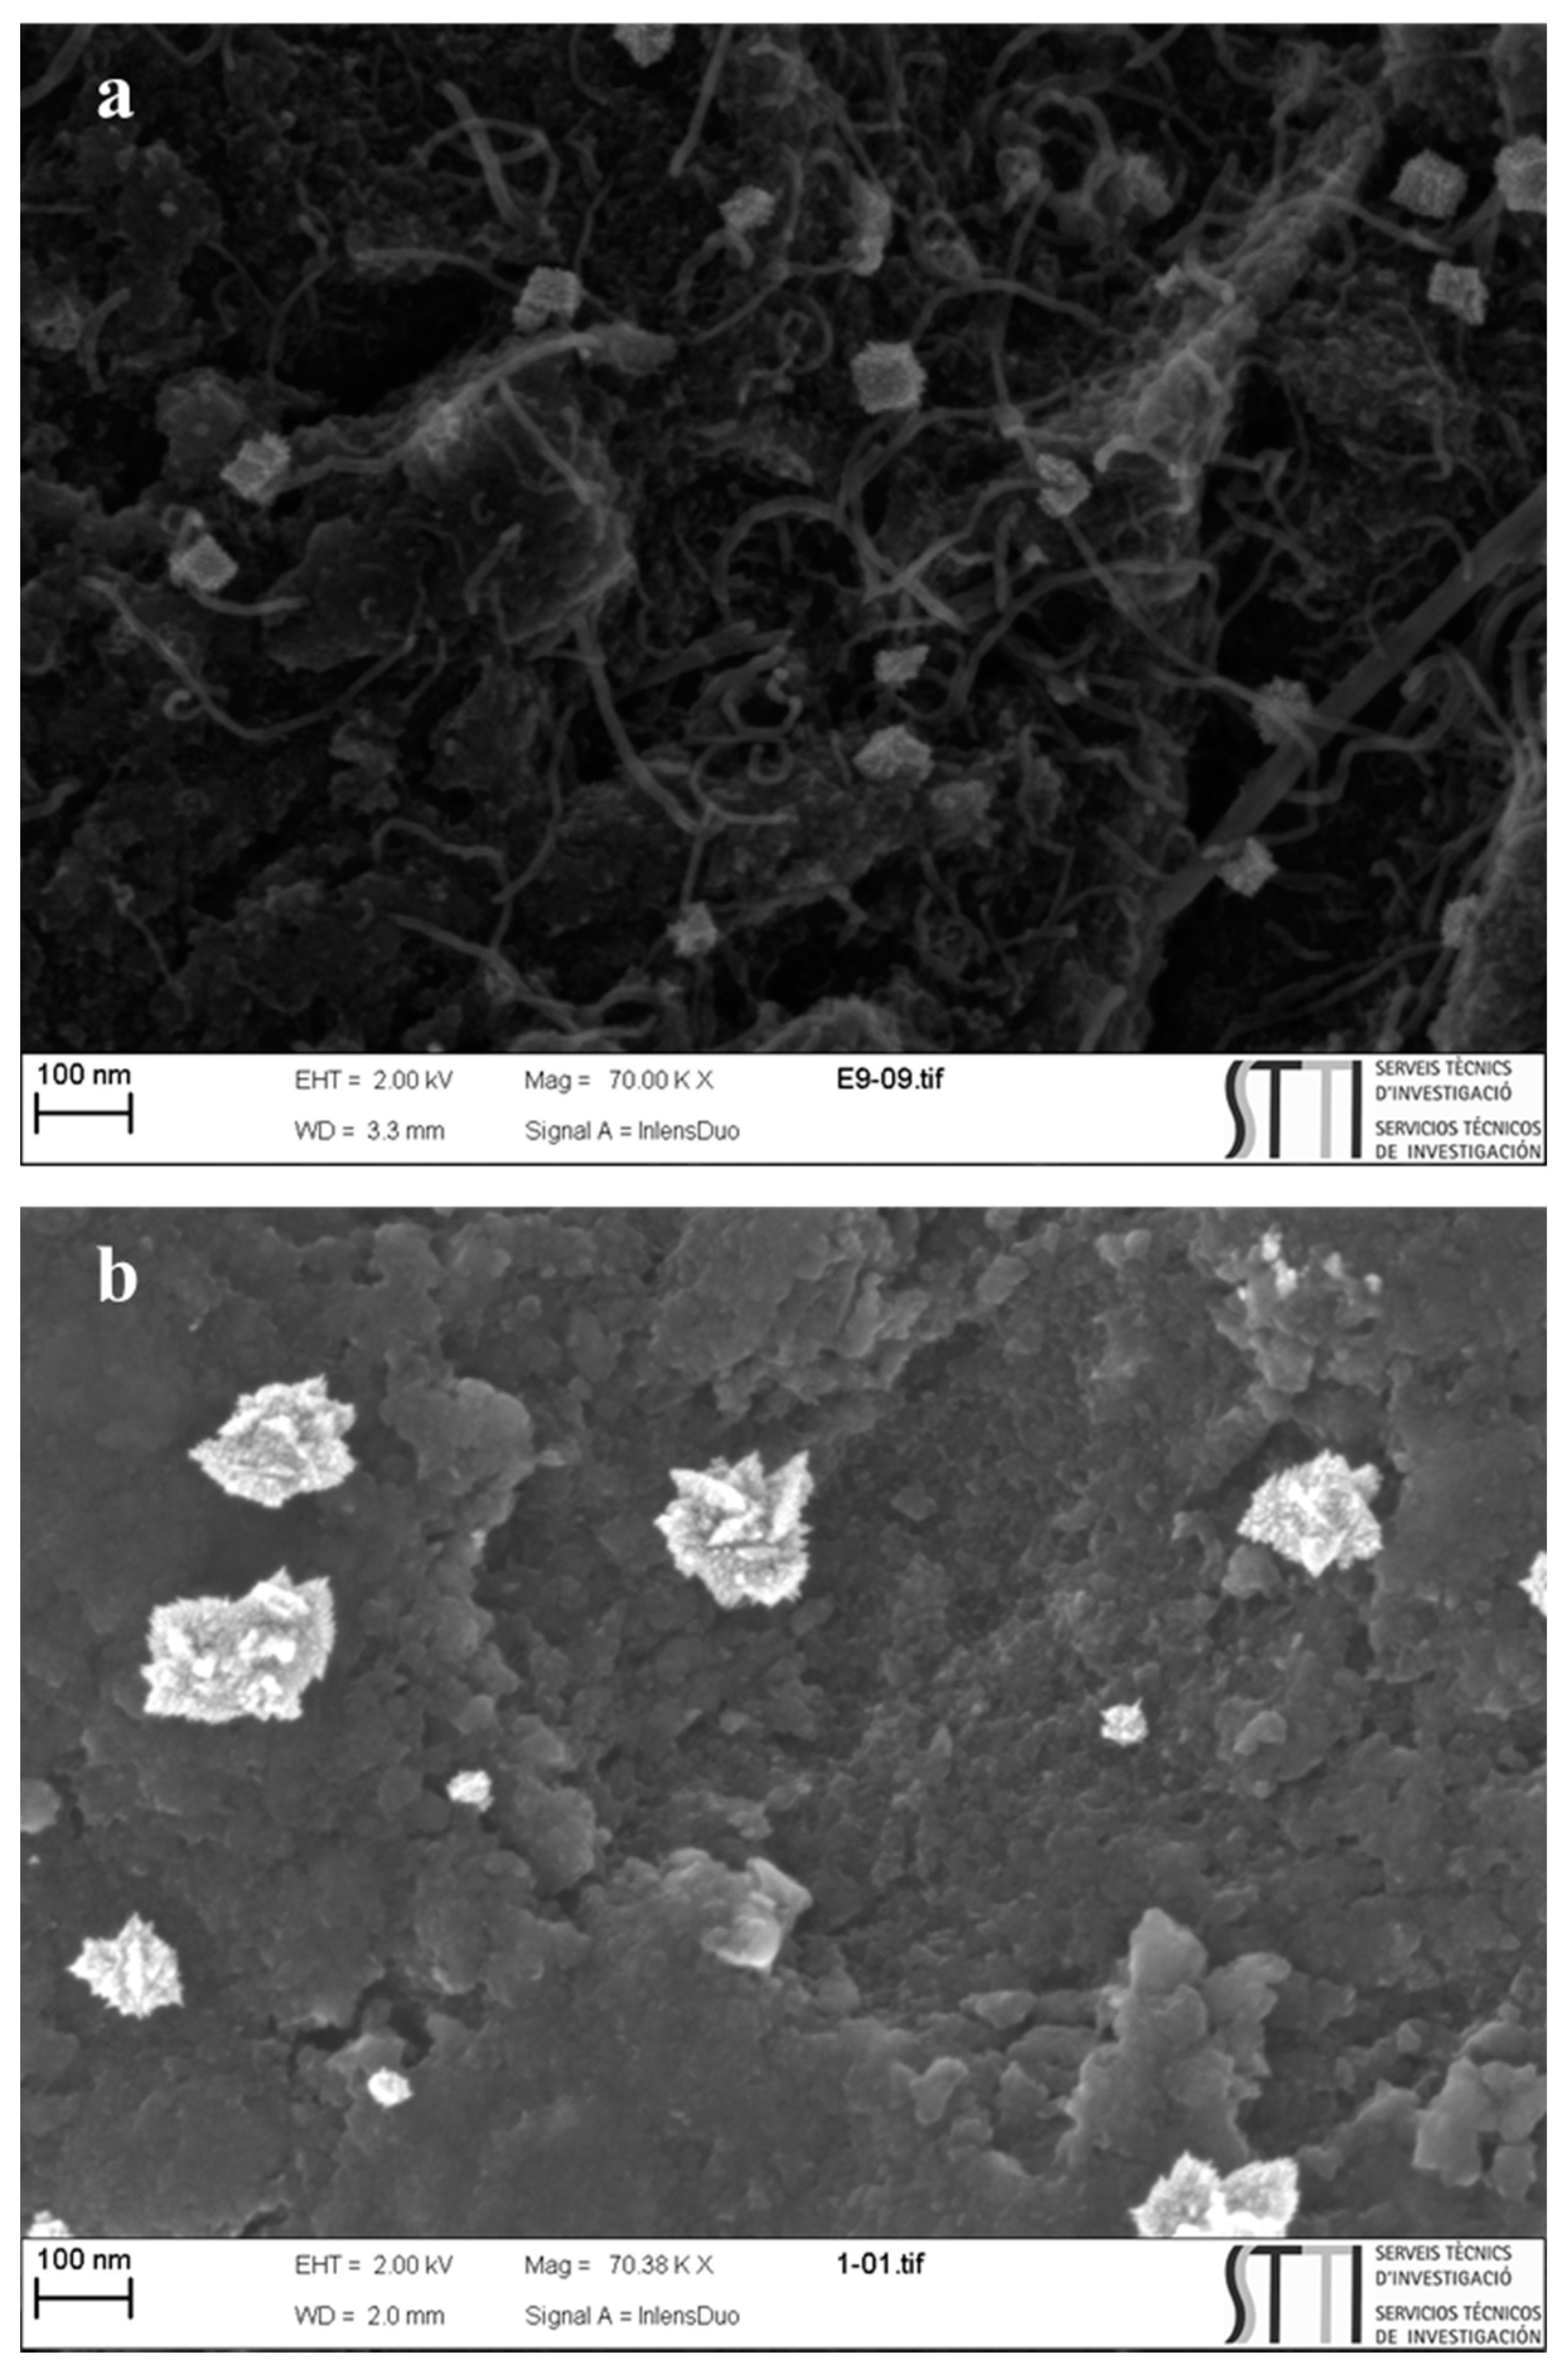
3.4. Electrochemical Potential Step Deposition of Platinum Nanoparticles over Electrochemically Assisted Deposited fCNTs

In order to verify their role as electrocatalyst support, platinum nanoparticles were electrochemically deposited onto the fCNTs, and their catalytic activity was measured towards methanol electrooxidation. Since positive potential pulses are the most favorable route for the electrodeposition of fCNTs, and 300 pulses are required to achieve full coverage of the surface of the GC electrode (see FESEM images, Figure 7c), fCNT-p-Na with 300 pulses was the selected material for the introduction of platinum nanoparticles. Furthermore, the electrodeposition of platinum nanoparticles onto pristine GC was performed for comparison purposes.
Figure 8 shows the cyclic voltammograms of the fCNT-p-Na electrode before and after the electrochemical potential step deposition of platinum nanoparticles. The introduction of platinum nanoparticles is confirmed since the redox peaks associated with hydrogen adsorption/desorption processes appear in the range of potential between −0.17 and 0.10 V vs. Ag/AgCl as well as the contribution of the oxygen adsorption/desorption processes (0.5–1.2 V vs. Ag/AgCl). The electrodeposition of platinum nanoparticles in the pristine GC was performed for comparison purposes and to show the relevance of the use of a support based on well-dispersed fCNTs. The deposition of platinum nanoparticles is confirmed via cyclic voltammetry in Figure 8b, in which all hydrogen adsorption/desorption processes are observed. The voltammetric profile of platinum is clearly appreciable in the Pt/GC sample since the glassy carbon displays a minor contribution of the double layer charge compared to fCNT samples. In addition, Raman spectra of the Pt/fCNT-p-Na electrode (see Figure S2) were acquired, and a similar Raman spectrum to that acquired with the fCNT-p-Na was obtained, confirming that the fCNT-p-Na is not affected by the electrochemically deposited Pt.
Considering a current efficiency of 100% for the reduction of Pt4+ to Pt0, the amount of electrodeposited platinum was obtained from the electric charge of the chronoamperometric curve. Interestingly, the amount of platinum electrodeposited is similar whether the working electrode employed is fCNT-p-Na or GC. Indeed, the platinum loading is 7 µgPt cm−2 using this electrochemical methodology in Pt/fCNT-p-Na and 6 µgPt cm−2 in Pt/GC. In terms of percentage of platinum per mass of electrocatalyst (platinum plus carbon nanotubes), the estimated loading of platinum is 8 wt.%.
To verify the correct platinum electrodeposition and to check the size of these metal nanoparticles, FESEM images were obtained for the samples Pt/fCNT-p-Na and Pt/GC. Figure 9a,b show a homogenous distribution of the platinum nanoparticles along the carbon nanotubes for Pt/fCNT-p-Na material. It is also observed that metal nanoparticles are not only deposited on the outer surface of the fCNTs but also in the intertubular spaces between carbon nanotubes and the outermost nanotubes. To determine the size of such metallic nanoparticles, the electron back scattering diffraction (EBSD) technique was also employed (Figures S5 and S6 for Pt/fCNT-p-Na and Pt/GC, respectively). These images highlight the difference in the size of the platinum nanoparticles when either fCNTs or pristine GC are employed as the electrocatalyst support. Pt/fCNT-p-Na shows small platinum nanoparticles, 74 nm being the average diameter with a more homogeneous particle size. Such a parameter is higher (116 nm) when bare GC is used in support of the metal electrodeposition, pointing out the importance of using a higher surface area CNT support during the deposition of metal nanoparticles. Regarding the 8-fold rise in capacitance achieved by the electrode after the electrodeposition (Figure 6), the available electrode surface could have faced an increase of almost one order of magnitude in fCNT-p-Na. The larger surface area delivers a larger number of nucleation sites for nanoparticle formation, favoring nucleation over growing interactions that would explain the enhanced metal dispersion on Pt/fCNT-p-Na.

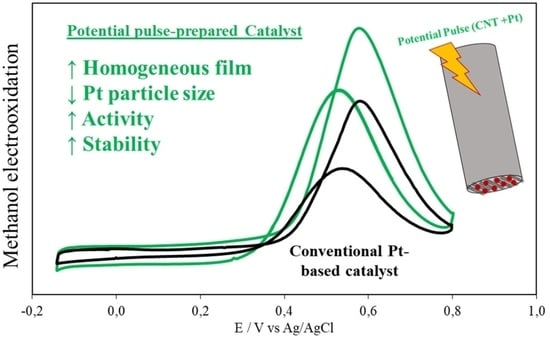
3.5. Electrocatalytic Activity towards MeOH Electrooxidation

The electrocatalytic activities towards methanol electrooxidation of Pt/fCNT-p-Na and Pt/GC were studied in a N2-saturated 0.1 M MeOH + 0.5 M H2SO4 solution. Figure 10 shows the cyclic voltammogram profiles of the electrodes during oxidation of methanol in which one oxidation peak is appreciable during both the anodic and cathodic sweeps at around 0.55 and 0.59 V vs. Ag/AgCl, respectively. The achieved current density was determined to be 0.54 mA cm−2 and 80 A gPt−1 for Pt/fCNT-p-Na and 0.36 mA cm−2 and 63 A gPt−1 for Pt/GC. Those peaks are characteristics of methanol oxidation, and the onset potential (EONSET) was obtained at 0.31 V for Pt/fCNT-p-Na and 0.36 V for Pt/GC. Pt/fCNT-p-Na shows lower overpotential than its counterpart, probably because of the smaller size of platinum nanoparticles deposited onto the well-dispersed and high surface area layers of carbon nanotubes. Furthermore, such a difference is also observed in the current density of the electrooxidation peak, being higher for Pt/fCNT-p-Na than for Pt/GC. These values are comparable to or even higher than other platinum-based catalysts obtained in the literature [35]. The differences in the catalytic activity of both samples point to the key role of the electrochemical assisted deposition of the carbon nanotubes, which leads to a homogeneous distribution of carbon nanotubes on the electrode in which smaller platinum nanoparticles are finally deposited. This is of relevance in the catalytic activity since smaller nanoparticles often lead to higher catalytic activities.
Another relevant feature achieved after the addition of a thin film of electrodeposited fCNTs on the glassy surface is the large decrease observed on the oxidation currents for the forward and backward sweeps (values of 1.36 for Pt/fCNT-p-Na and 1.80 for Pt/GC). This ratio is related to the tolerance of methanol oxidation catalysts to the CO-like intermediates that are generated during the forward CV sweep [47]. A decrease on the oxidation current ratio means that the tolerance towards CO of the Pt/fCNT-p-Na catalyst is especially improved.
Interestingly, the electrocatalytic results during methanol oxidation are comparable with the most promising low-platinum-loading electrocatalysts found in the literature that have been prepared by other chemical and electrochemical methods, especially in the EONSET [48,49,50,51]. However, the optimization of all the conditions in the electrochemically assisted deposition of carbon electrodes is a challenge that might lead to a major enhancement of the catalytic activity. The strong influence that the structure of the carbon support has on the nature of the electrodeposited platinum nanoparticles is widely known [35]. In this sense, the electrochemical pulse deposition of a thin film of carbon nanotubes enhances the surface area of the electrode and improves the distribution of carbon nanotubes, making it more suitable support for platinum electrodeposition, which, in turn, leads to smaller and more uniform metal nanoparticles. Since the size of metal particles is a key parameter in electrocatalysts, those catalysts obtained using fCNTs as support show a higher catalytic activity towards methanol electrooxidation.
Moreover, the stability of the catalysts towards MeOH electrooxidation was evaluated during ninetieth cycles (1 h) under operando conditions. After this time, the initial and the final current density associated with MeOH oxidation on the Pt/fCNT-p-Na electrode were identical, indicating that the activity does not decay after 1h. However, the catalytic activity of the Pt/GC electrode shows a decrease of 10% using the same working conditions. Regarding the EONSET, it remains unaltered for both electrodes. It is worth noting that the presence of fCNTs not only seems to improve the catalytic activity of the Pt nanoparticles but also increase the catalytic stability during the oxidation of MeOH.

4. Conclusions

This work reports a novel method to prepare electrocatalysts based only on electrochemical methods. Electrochemically assisted deposition of functionalized carbon nanotubes was performed through multiple pulses at a constant potential. The number of applied pulses enables full control over the thickness of the electrochemical deposition of CNTs along with improved homogeneity in the distribution of functionalized nanotubes. Moreover, experimental characterization demonstrates the beneficial effect of applying pulses at a positive potential, in which the working electrode and the carbon nanotubes have a stronger attraction. This novel electrochemical method was found to be suitable for controlling the distribution of the carbon nanotubes on the surface electrode. As active sites, platinum nanoparticles were electrochemically potential step deposited onto the deposited CNTs, during which the larger surface area of the previously electrodeposited carbon nanotubes led to smaller and homogenously distributed platinum nanoparticles. The catalytic activity of the samples towards MeOH electrooxidation was tested, highlighting the overall improvement achieved when electrodeposited carbon nanotubes are used in support of the metal nanoparticles.
In the light of the favorable results, this work presents a simple, efficient, and scalable alternative to the conventional chemical synthesis of catalysts. (Electro)catalysts obtained solely by electrochemical treatments lead to excellent performance in terms of control over the coverage and loading during the preparation of catalysts, which has a direct impact on the catalytic activity for reactions such as electrooxidation of methanol.

Supplementary Materials

The following are available online at https://0-www-mdpi-com.brum.beds.ac.uk/article/10.3390/c7020032/s1, Figure S1: N2-adsorption isotherms at −196 °C of CNT and fCNT samples, Figure S2: Raman spectra of CNT, fCNT, and Pt/fCNT-p-Na samples, Figure S3: Electrochemically assisted deposited mass of fCNTs with the number of potential pulses for fCNT-p-Na using a fresh dispersion (orange square) and a reused dispersion (violet triangle). Figure S4: Electrochemically assisted deposited mass of fCNTs with the number of potential pulses for fCNT-n-Na using a fresh dispersion (blue circle) and a reused dispersion (violet triangle). Figure S5: ESBD image of Pt/fCNT-p-Na. Figure S6: ESBD image of Pt/GC.

Author Contributions

Data curation, J.Q.-R.; Formal analysis, J.Q.-B., J.Q.-R., D.S.-T. and R.R.-R.; Funding acquisition, E.M. and D.C.-A.; Investigation, E.M., J.Q.-B., J.Q.-R., R.R.-R., D.S.-T. and D.C.-A.; Methodology, E.M., R.R.-R. and D.C.-A.; Resources, E.M. and D.C.-A.; Writing—original draft, J.Q.-B., J.Q.-R. and R.R.-R.; Writing—review and editing, E.M., J.Q.-B., R.R.-R. and D.C.-A. All authors have read and agreed to the published version of the manuscript.

Funding

This research was funded by MICINN and FEDER (RTI2018-095291-B-I00 and PID2019-105923RB-I00), “Juan de la Cierva” contract (IJCI-2016-27636), and the Vicerrectorado de Investigación y Transferencia de Conocimiento de la Universidad de Alicante (GRE19-16).

Institutional Review Board Statement

Not applicable.

Informed Consent Statement

Not applicable.

Data Availability Statement

The data presented in this study are available in the article and Supplementary Materials.

Acknowledgments

The authors would like to thank MICINN and FEDER (RTI2018-095291-B-I00 and PID2019-105923RB-I00) for the financial support. D.S.-T. thanks MICINN for the “Juan de la Cierva” contract (IJCI-2016-27636), and the Vicerrectorado de Investigación y Transferencia de Conocimiento de la Universidad de Alicante for the financial support (GRE19-16).

Conflicts of Interest

The authors declare no conflict of interest.

References

  1. Debe, M.K. Electrocatalyst approaches and challenges for automotive fuel cells. Nature 2012, 486, 43–51. [Google Scholar] [CrossRef]
  2. Thackeray, M.M.; Wolverton, C.; Isaacs, E.D. Electrical energy storage for transportation- approaching the limits of, and going beyond, lithium-ion batteries. Energy Environ. 2012, 5, 7854–7863. [Google Scholar] [CrossRef]
  3. Yang, Z.; Zhang, J.; Kintner-Meyer, M.C.W.; Lu, X.; Choi, D.; Lemmon, J.P.; Liu, L. Electrochemical Energy Storage for Green Grid. Chem. Rev. 2011, 111, 3577–3613. [Google Scholar] [CrossRef] [PubMed]
  4. Mccrory, C.C.L.; Jung, S.; Peters, J.C.; Jaramillo, T.F. Benchmarking Heterogeneous Electrocatalysts for the Oxygen Evolution Reaction. J. Am. Chem. Soc. 2013, 135, 16977–16987. [Google Scholar] [CrossRef]
  5. Stephens, I.E.L.; Bondarenko, A.S.; Grønbjerg, U.; Rossmeisl, J.; Chorkendorff, I. Understanding the electrocatalysis of oxygen reduction on platinum and its alloys. Energy Environ. Sci. 2012, 5, 6744–6762. [Google Scholar] [CrossRef] [Green Version]
  6. Ruqia, B.; Choi, S. Pt and Pt-Ni(OH)2 Electrodes for the Hydrogen Evolution Reaction in Alkaline Electrolytes and Their Nanoscaled Electrocatalysts. ChemSusChem 2018, 11, 2643–2653. [Google Scholar] [CrossRef] [PubMed]
  7. Esposito, D.V.; Chen, J.G. Monolayer platinum supported on tungsten carbides as low-cost electrocatalysts: Opportunities and limitations. Energy Environ. Sci. 2011, 4, 3900–3912. [Google Scholar] [CrossRef]
  8. Ramli, Z.A.C.; Kamarudin, S.K. Platinum-Based Catalysts on Various Carbon Supports and Conducting Polymers for Direct Methanol Fuel Cell Applications: A Review. Nano Rev. 2018, 13, 410. [Google Scholar] [CrossRef] [PubMed] [Green Version]
  9. Katsounaros, I.; Cherevko, S.; Zeradjanin, A.R.; Mayrhofer, K.J.J. Oxygen Electrochemistry as a Cornerstone for Sustainable Energy Conversion Angewandte. Angew. Chem. Int. Ed. 2014, 53, 102–121. [Google Scholar] [CrossRef] [PubMed]
  10. Zhang, Q.; Uchaker, E.; Candelaria, S.L.; Cao, G. Nanomaterials for energy conversion and storage. Chem. Soc. Rev. 2013, 42, 3127–3171. [Google Scholar] [CrossRef]
  11. Zhang, Z.; Liu, J.; Gu, J.; Su, L.; Cheng, L. An overview of metal oxide materials as electrocatalysts and supports for polymer electrolyte fuel cells. Energy Environ. Sci. 2014, 7, 2535–2558. [Google Scholar] [CrossRef]
  12. Trogadas, P.; Fuller, T.F.; Strasser, P. Carbon as catalyst and support for electrochemical energy conversion. Carbon 2014, 75, 5–42. [Google Scholar]
  13. Wang, Y.J.; Zhao, N.; Fang, B.; Li, H.; Bi, X.T.; Wang, H. Carbon-Supported Pt-Based Alloy Electrocatalysts for the Oxygen Reduction Reaction in Polymer Electrolyte Membrane Fuel Cells: Particle Size, Shape, and Composition Manipulation and Their Impact to Activity. Chem. Rev. 2015, 115, 3433–3467. [Google Scholar] [CrossRef] [PubMed] [Green Version]
  14. Görlin, M.; de Araújo, J.F.; Schmies, H.; Bernsmeier, D.; Dresp, S.; Gliech, M.; Jusys, Z.; Chernev, P.; Kraehnert, R.; Dau, H.; et al. Tracking catalyst redox states and reaction dynamics in Ni-Fe oxyhydroxide oxygen evolution reaction (OER) electrocatalysts: The role of catalyst support and electrolyte pH. J. Am. Chem. Soc. 2017, 139, 2070–2082. [Google Scholar] [CrossRef] [PubMed]
  15. Wei, Q.; Tong, X.; Zhang, G.; Qiao, J.; Gong, Q.; Sun, S. Nitrogen-Doped Carbon Nanotube and Graphene Materials for Oxygen Reduction Reactions. Catalysts 2015, 5, 1574–1602. [Google Scholar] [CrossRef] [Green Version]
  16. Duan, X.; Xu, J.; Wei, Z.; Ma, J.; Guo, S.; Wang, S.; Liu, H.; Dou, S. Metal-Free Carbon Materials for CO2 Electrochemical Reduction. Adv. Mater. 2017, 29, 1701784. [Google Scholar] [CrossRef] [PubMed]
  17. Quílez-Bermejo, J.; Morallón, E.; Cazorla-Amorós, D. Metal-Free Heteroatom-doped Carbon-based catalysts for ORR. A critical assessment about the role of heteroatoms. Carbon 2020, 165, 434–454. [Google Scholar] [CrossRef]
  18. Chen, Y.; Zhang, X.; Zhou, Z. Carbon-Based Substrates for Highly Dispersed Nanoparticle and Even Single-Atom Electrocatalysts. Adv. Sci. News 2019, 3, 1900050. [Google Scholar] [CrossRef]
  19. Kopec, M.; Lamson, M.; Yuan, R.; Tang, C.; Kruk, M.; Zhong, M.; Matyjaszewski, K.; Kowalewski, T. Polyacrylonitrile-derived nanostructured carbon materials. Prog. Polym. Sci. 2019, 92, 89–134. [Google Scholar] [CrossRef]
  20. Figueiredo, J.L.; Pereira, M.F.R. Synthesis and functionalization of carbon xerogels to be used as supports for fuel cell catalysts. J. Energy Chem. 2013, 22, 195–201. [Google Scholar] [CrossRef]
  21. Ervina, J.; Ghaleb, Z.A.; Hamdan, S.; Mariatti, M. Colloidal Stability of Water-based Carbon Nanotube Suspensions in Electrophoretic Deposition Process: Effect of Applied Voltage and Deposition Time. Compos. Part A Appl. Sci. Manuf. 2019, 117, 1–10. [Google Scholar] [CrossRef]
  22. Nie, C.; Pan, L.; Li, H.; Chen, T.; Lu, T.; Sun, Z. Electrophoretic deposition of carbon nanotubes film electrodes for capacitive deionization. J. Electroanal. Chem 2012, 666, 85–88. [Google Scholar] [CrossRef]
  23. Besra, L.; Liu, M. A review on fundamentals and applications of electrophoretic deposition (EPD). Prog. Mater. Sci. 2007, 52, 1–61. [Google Scholar] [CrossRef]
  24. Haghbin, A.; Liaghat, G.; Hadavina, H.; Arabi, A.M.; Pol, M.H. Enhancement of the Electrical Conductivity and Interlaminar Shear Strength of CNT/GFRP Hierarchical Composite Using an Electrophoretic Deposition Technique. Materials 2017, 10, 1120. [Google Scholar] [CrossRef] [PubMed] [Green Version]
  25. Boccaccini, A.R.; Cho, J.; Roether, J.A.; Thomas, B.J.C.; Minay, E.J.; Shaffer, M.S.P. Electrophoretic deposition of carbon nanotubes. Carbon 2006, 44, 3149–3160. [Google Scholar] [CrossRef]
  26. Haghbin, A.; Liaghat, G.H.; Arabi, A.M.; Hadavinia, H.; Pol, M.H. Investigations on electrophoretic deposition of carbon nanotubes on glass textures to improve polymeric composites interface. Compos. Sci. Technol. 2018, 155, 197–204. [Google Scholar] [CrossRef] [Green Version]
  27. Battisti, A.; los Ojos, D.E.; Ghisleni, R.; Brunner, A.J. Single fiber push-out characterization of interfacial properties of hierarchical CNT-carbon fiber composites prepared by electrophoretic deposition. Compos. Sci. Technol. 2014, 95, 121–127. [Google Scholar] [CrossRef]
  28. Guo, J.; Lu, C. Continuous preparation of multiscale reinforcement by electrophoretic deposition of carbon nanotubes onto carbon fiber tows. Carbon 2012, 50, 3101–3103. [Google Scholar] [CrossRef]
  29. Kamat, P.V.; Thomas, K.G.; Barazzouk, S.; Girishkumar, G.; Vinodgopal, K.; Meisel, D. Self-Assembled Linear Bundles of Single Wall Carbon Nanotubes and Their Alignment and Deposition as a Film in a dc Field. J. Am. Chem. Soc. 2004, 126, 10757–10762. [Google Scholar] [CrossRef]
  30. Wang, Y.; Chen, K.S.; Mishler, J.; Cho, S.C.; Adroher, X.C. A review of polymer electrolyte membrane fuel cells: Technology, applications, and needs on fundamental research. Appl. Energy 2011, 88, 981–1007. [Google Scholar] [CrossRef] [Green Version]
  31. Berenguer-Murcia, A.; Morallón, E.; Cazorla-Amorós, D.; Linares-Solano, Á. Preparation of thin silicalite-1 layers on carbon materials by electrochemical methods. Microporous Mesoporous Mater. 2003, 66, 331–340. [Google Scholar] [CrossRef]
  32. Sanchís, C.; Ruiz-Rosas, R.; Berenguer-Murcia, Á.; Morallón, E.; Cazorla-Amorós, D. Switchable surfactant-assisted carbon nanotube coatings: Innovation through pH shift. Front. Mater. 2015, 2, 1–8. [Google Scholar] [CrossRef] [Green Version]
  33. Sanchís, C.; Berenguer-Murcia, Á.; Ruiz-Rosas, R.; Morallón, E.; Cazorla-Amorós, D. Preparation of homogeneous CNT coatings in insulating capillary tubes by an innovative electrochemically-assisted method. Carbon 2014, 67, 564–571. [Google Scholar] [CrossRef] [Green Version]
  34. Arias-Pardilla, J.; Berenguer-Murcia, Á.; Cazorla-Amóros, D.; Morallón, E. Electrochemical Preparation of Nanoparticle Deposits: Application to Membranes and Catalysis. Membr. Membr. React. Prep. Optim. Sel. 2011, 395–407. [Google Scholar] [CrossRef]
  35. Dominguez-Dominguez, S.; Arias-Pardilla, J.; Berenguer-Murcia, A.; Morallón, E.; Cazorla-Amorós, D. Electrochemical deposition of platinum nanoparticles on different carbon supports and conducting polymers. J. Appl. Electrochem. 2008, 38, 259–268. [Google Scholar] [CrossRef] [Green Version]
  36. Ourari, A.; Zerdoumi, R.; Ruiz-Rosas, R.; Morallon, E. Synthesis and Catalytic Properties of Modified Electrodes by Pulsed Electrodeposition of Pt/PANI Nanocomposite. Materials 2019, 12, 723. [Google Scholar] [CrossRef] [Green Version]
  37. Thommes, M.; Kaneko, K.; Neimark, A.V.; Olivier, J.P.; Rodriguez-Reinoso, F.; Rouquerol, J.; Sing, K.S.W. Physisorption of gases, with special reference to the evaluation of surface area and pore size distribution (IUPAC Technical Report). Pure Appl. Chem. 2015, 87, 1051–1069. [Google Scholar] [CrossRef] [Green Version]
  38. Eswaramoorthy, M.; Sen, R.; Rao, C.N.R. A study of micropores in single-walled carbon nanotubes by the adsorption of gases and vapors. Chem. Phys. Lett. 1999, 304, 207–210. [Google Scholar] [CrossRef]
  39. Figueiredo, J.L.; Pereira, M.F.R.; Freitas, M.M.A.; Órfão, J.J.M. Modification of the surface chemistry of activated carbons. Carbon 1999, 37, 1379–1389. [Google Scholar] [CrossRef]
  40. Otake, Y.; Jenkins, R.G. Characterization of oxygen-containing surface complexes created on a microporous carbon by air and nitric acid treatment. Carbon 1993, 31, 109–121. [Google Scholar] [CrossRef]
  41. Román-Martínez, M.C.C.; Cazorla-Amorós, D.; Linares-Solano, A.; de Lecea, C.S.M. TPD and TPR characterization of carbonaceous supports and Pt/C catalysts. Carbon 1993, 31, 895–902. [Google Scholar] [CrossRef]
  42. Li, N.; Ma, X.; Zha, Q.; Kim, K.; Chen, Y.; Song, C. Maximizing the number of oxygen.containing functional groups on activated carbon by using ammonium persulfate and improving the temperature-programmed desorption characterization of carbon surface chemistry. Carbon 2011, 49, 5002–5013. [Google Scholar] [CrossRef]
  43. Gabe, A.; García-Aguilar, J.; Berenguer-Murcia, Á.; Morallón, E.; Cazorla-Amorós, D. Key factors improving oxygen reduction reaction activity in cobalt nanoparticles modified carbon nanotubes. Appl. Catal. B Environ. 2017, 217, 303–312. [Google Scholar] [CrossRef] [Green Version]
  44. González-Gaitán, C.; Ruiz-Rosas, R.; Morallón, E.; Cazorla-Amorós, D. Electrochemical Methods to Functionalize Carbon Materials. In Chemical Functionalization of Carbon Nanomaterials; Taylor & Francis: Boca Raton, FL, USA, 2015; pp. 256–287. [Google Scholar]
  45. Moreno-Castilla, C. Adsorption of organic molecules from aqueous solutions on carbon materials. Carbon 2004, 42, 83–94. [Google Scholar] [CrossRef] [Green Version]
  46. Newcombe, G.; Drikas, M. Adsorption of NOM onto activated carbon: Electrostatic and non-electrostatic effects. Carbon 1997, 35, 1239–1250. [Google Scholar] [CrossRef]
  47. Sieben, J.M.; Ansón-Casaos, A.; Martínez, M.T.; Morallón, E. Single-walled carbon nanotube buckypapers as electrocatalyst supports for methanol oxidation. J. Power Sources 2013, 242, 7–14. [Google Scholar] [CrossRef] [Green Version]
  48. Yang, L.; Ding, Y.; Chen, L.; Luo, S. ScienceDirect Hierarchical reduced graphene oxide supported dealloyed platinum-copper nanoparticles for highly efficient methanol electrooxidation. Int. J. Hydrogen Energy 2017, 42, 6705–6712. [Google Scholar] [CrossRef]
  49. Li, K.; Xiao, M.; Jin, Z.; Zhu, J.; Ge, J.; Liu, C.; Xing, W. Advanced architecture carbon with in-situ embedded ultrafine titanium dioxide as outstanding support material for platinum catalysts towards methanol electrooxidation. Electrochim. Acta 2017, 235, 508–518. [Google Scholar] [CrossRef]
  50. Zhang, Y.; Li, F.; Liu, X.; Lu, J.; Zhang, G. Promoting Influence of Activated Carbon used in Carbon Paste Electrode on Platinum Nanoparticles Efficiency in Methanol Electrooxidation. Electrochim. Acta 2017, 242, 165–172. [Google Scholar] [CrossRef]
  51. Sevilla, M.; Sanchís, C.; Valdés-Solís, T.; Morallón, E.; Fuertes, A.B. Highly dispersed platinum nanoparticles on carbon nanocoils and their electrocatalytic performance for fuel cell reactions. Electrochim. Acta 2009, 54, 2234–2238. [Google Scholar] [CrossRef] [Green Version]
Figure 1. Schematic representation of the experimental procedure used in this work.
Carbon 07 00032 g001
Figure 2. Scheme of the potential step of multiple steps during the electrochemically assisted deposition of fCNTs at (a) positive and (b) negative potentials.
Carbon 07 00032 g002
Figure 3. (a) CO and (b) CO2−TPD evolution profiles for CNT (orange lines) and fCNT (blue lines) samples.
Carbon 07 00032 g003
Figure 4. (a) UV–Vis spectra of the stable dispersion of fCNTs (orange line) and fCNTs + 0.1 M Na2SO4 (blue line). (b) UV–Vis spectra of the stable dispersion of fCNTs + 0.1 M Na2SO4 (grey line) after negative (orange line) and positive pulses (blue line).
Carbon 07 00032 g004
Figure 5. Cyclic voltammograms of electrochemically assisted deposition on the GC electrode of (a) fCNT-p-Na, (b) fCNT-n-Na, and (c) fCNT-p with the increase in the number of potential step pulses (from 0 to 1400). 0.5 M H2SO4 solution. Scan rate = 50 mV·s−1. Black represents pristine GC, dark grey represents 10 pulses, light grey color represents 40 pulses, flesh color represents 80 pulses, orange represents 130 pulses, brown represents 200 pulses, dark blue represents 300 pulses, light blue represents 500 pulses, light green represents 800 pulses, and dark green represents 1400 pulses.
Carbon 07 00032 g005
Figure 6. Electrochemically assisted deposited mass of fCNTs with the number of potential pulses. Grey symbols correspond to positive potential pulses in water, orange symbols correspond to negative potential pulses in presence of Na2SO4 in the solution, and blue symbols correspond to positive potential pulses in presence of Na2SO4 in the solution.
Carbon 07 00032 g006
Figure 7. FESEM images of fCNT-p-Na potential step deposited with different pulses: (a,b) 10, (c,d) 80, and (e,f) 300 pulses. (g,h) FESEM images of fCNTs deposited via drop-casting with the same fCNT loading as that shown in (e).
Carbon 07 00032 g007
Figure 8. Cyclic voltammograms before and after the electrodeposition of platinum nanoparticles on (a) fCNT-p-Na (orange line) and Pt/fCNT-p-Na (blue line) electrodes and (b) GC (orange line) and Pt/GC (blue line) electrodes; 0.5M H2SO4, v = 50 mV s−1.
Carbon 07 00032 g008
Figure 9. FESEM images of (a) Pt/fCNT-p-Na and (b) Pt/GC.
Carbon 07 00032 g009
Figure 10. Cyclic voltammograms of Pt/fCNT-p-Na (orange line) and Pt/GC (blue line) in a 0.1 M MeOH + 0.5 M H2SO4 solution. Scan rate = 50 mV s−1.
Carbon 07 00032 g010
Table 1. Porous textural data obtained from N2-adsorption isotherms and surface oxygen groups obtained from CO and CO2 evolution.
SampleSBET/
m2 g−1
Vμpore/
cm3 g−1
CO/
μmol g−1
CO2/
μmol g−1
CNTs2600.01600120
ƒCNTs2800.0317401030
Publisher’s Note: MDPI stays neutral with regard to jurisdictional claims in published maps and institutional affiliations.

