
A Threshold Line for Safe Geologic CO2 Storage Based on Field Measurement of Soil CO2 Flux


1
Japan Oil, Gas and Metals National Corporation (JOGMEC), Minato-ku, Tokyo 105-0001, Japan
2
Department of Earth Resources Engineering, Faculty of Engineering, Kyushu University, Fukuoka 819-0395, Japan
3
PT Tura Consulting Indonesia, South Jakarta 12520, Indonesia
*
Author to whom correspondence should be addressed.
C 2021, 7(2), 34; https://0-doi-org.brum.beds.ac.uk/10.3390/c7020034
Submission received: 10 February 2021
/
Revised: 23 March 2021
/
Accepted: 24 March 2021
/
Published: 27 March 2021
(This article belongs to the Special Issue CO2 Capture and Valorization)
Abstract
:Carbon capture and storage (CCS) is an established and verified technology that can implement zero emissions on a large enough scale to limit temperature rise to below 2 °C, as stipulated in the Paris Agreement. However, leakage from CCS sites must be monitored to ensure containment performance. Surface monitoring of carbon dioxide (CO2) concentrations at onshore CCS sites is one method to locate and quantify CCS site leakage. Employing soil accumulation chambers, we have established baseline data for the natural flux of CO2 as a threshold alert to detect CO2 leakage flux to ensure the safety of onshore CCS sites. Within this context, we conducted on-site CO2 measurements at three different locations (A, B, and C) on the INAS test field at the Ito campus, Kyushu University (Japan). Furthermore, we developed a specific measurement system based on the closed-chamber method to continuously measure CO2 flux from soil and to investigate the correlation between CO2 flux from the soil surface and various parameters, including environmental factors and soil sample characteristics. In addition, gas permeability and the effect of different locations on soil CO2 flux are discussed in this study. Finally, we present an equation for estimating the soil CO2 flux used in the INAS field site that includes environmental factors and soil characteristics. This equation assists in defining the threshold line for an alert condition related to CO2 leakage at onshore CCS sites.
1. Introduction
Carbon dioxide (CO2) emissions to the atmosphere have gradually increased, causing a global warming phenomenon over the past one to two centuries. According to the Intergovernmental Panel on Climate Change (IPCC), global CO2 emissions are currently rising at approximately 42 ± 3 Pg C per year [1]. Consequently, surface temperatures will be 2 °C higher than in the pre-industrial era (before 1876) in the next coming decades. Currently, a number of different approaches are being considered to mitigate CO2 emissions [2], as set out in the Paris Agreement and include the following:
- Improve energy efficiency and promote energy conservation.
- Increase usage of low-carbon fuels, including natural gas, hydrogen, or nuclear power.
- Utilize renewable energy such as solar, wind, hydropower, and bioenergy.
- Apply geoengineering approaches, for example afforestation and reforestation.
- CO2 capture and storage (CCS) or CO2 capture, usage, and storage (CCUS).
Of these methods, CCS can potentially achieve zero emissions on a large enough scale to decrease the forecast temperature rise to less than 2 °C. In 2019, the number of large-scale CCS facilities increased to 65, including 26 operational, three under construction, two have been suspended, 13 in advanced development, and 21 in early development [3]. The global capture and storage capacity of projects currently in operation or under construction equates to approximately 40 million tons per annum.
However, for reasons concerning health, safety, and the surrounding environment, geological CO2 storage sites need to monitor all types of CO2 leakage into the atmosphere. Monitoring methods include seismic monitoring, geo-electrical methods, temperature logs, gravity methods, remote sensing, geochemical sampling, atmospheric monitoring, tracers, soil gas, and microbiology. Of these, atmospheric monitoring methods play an important role in the detection of environmental abnormalities. In particular, the monitoring of subsurface CO2 leakage from natural fractures or tectonic faults is essential. Leakage monitoring can be conducted by continuously measuring soil CO2 flux from the soil surface to identify possible leakage sources [4,5,6,7,8,9,10,11].
A number of studies have concluded that soil, as a carbon source, can store approximately 2300 Pg C in the upper 100 cm of soil [12]. The amount of CO2 flux emitted from soil to the atmosphere ranges from 280 Pg C per year [13] to 359 Pg C per year [14], which is approximately one-quarter of the total emissions in the carbon cycle. Principally, CO2 gas in the soil is produced by respiration of plant roots, decomposition of soil organic matter (SOM), and microbial activities [15]. As the CO2 concentration in the soil layer increases, a higher rate of diffusion into the atmosphere occurs at the soil surface due to the concentration gradient effect.
The emission of CO2 from the soil surface is a complicated process affected by many factors. Among these, environmental elements such as soil temperature, soil water content (moisture), and SOM content are the primary factors that have been investigated by several researchers [13,16,17,18,19,20]. A number of studies have shown that soil CO2 flux depends on soil temperature, moisture content, and oxygen concentration [21,22,23]. Furthermore, soil characteristics such as porosity and water saturation have also been shown to be important, because they affect the transport of gas in the soil. Although numerous studies have been conducted within this field, the flux of CO2 from soils is still not well understood due to complicated environmental and soil-related factors.
In this study, we developed an equation to estimate the threshold line to find a possibility of CO2 leakage at onshore geological CO2 storage sites. The established baseline play an essential role as a threshold alert to ensure the safety of onshore CCS sites. Once abnormal CO2 flux from soil surface is detected, it is necessary to take action immediately. In addition, the effect of various environmental factors and soil characteristics on soil CO2 flux was also investigated at the INAS test field site located on the Ito campus, Kyushu University.
2. Methods and Study Area
2.1. Study Area
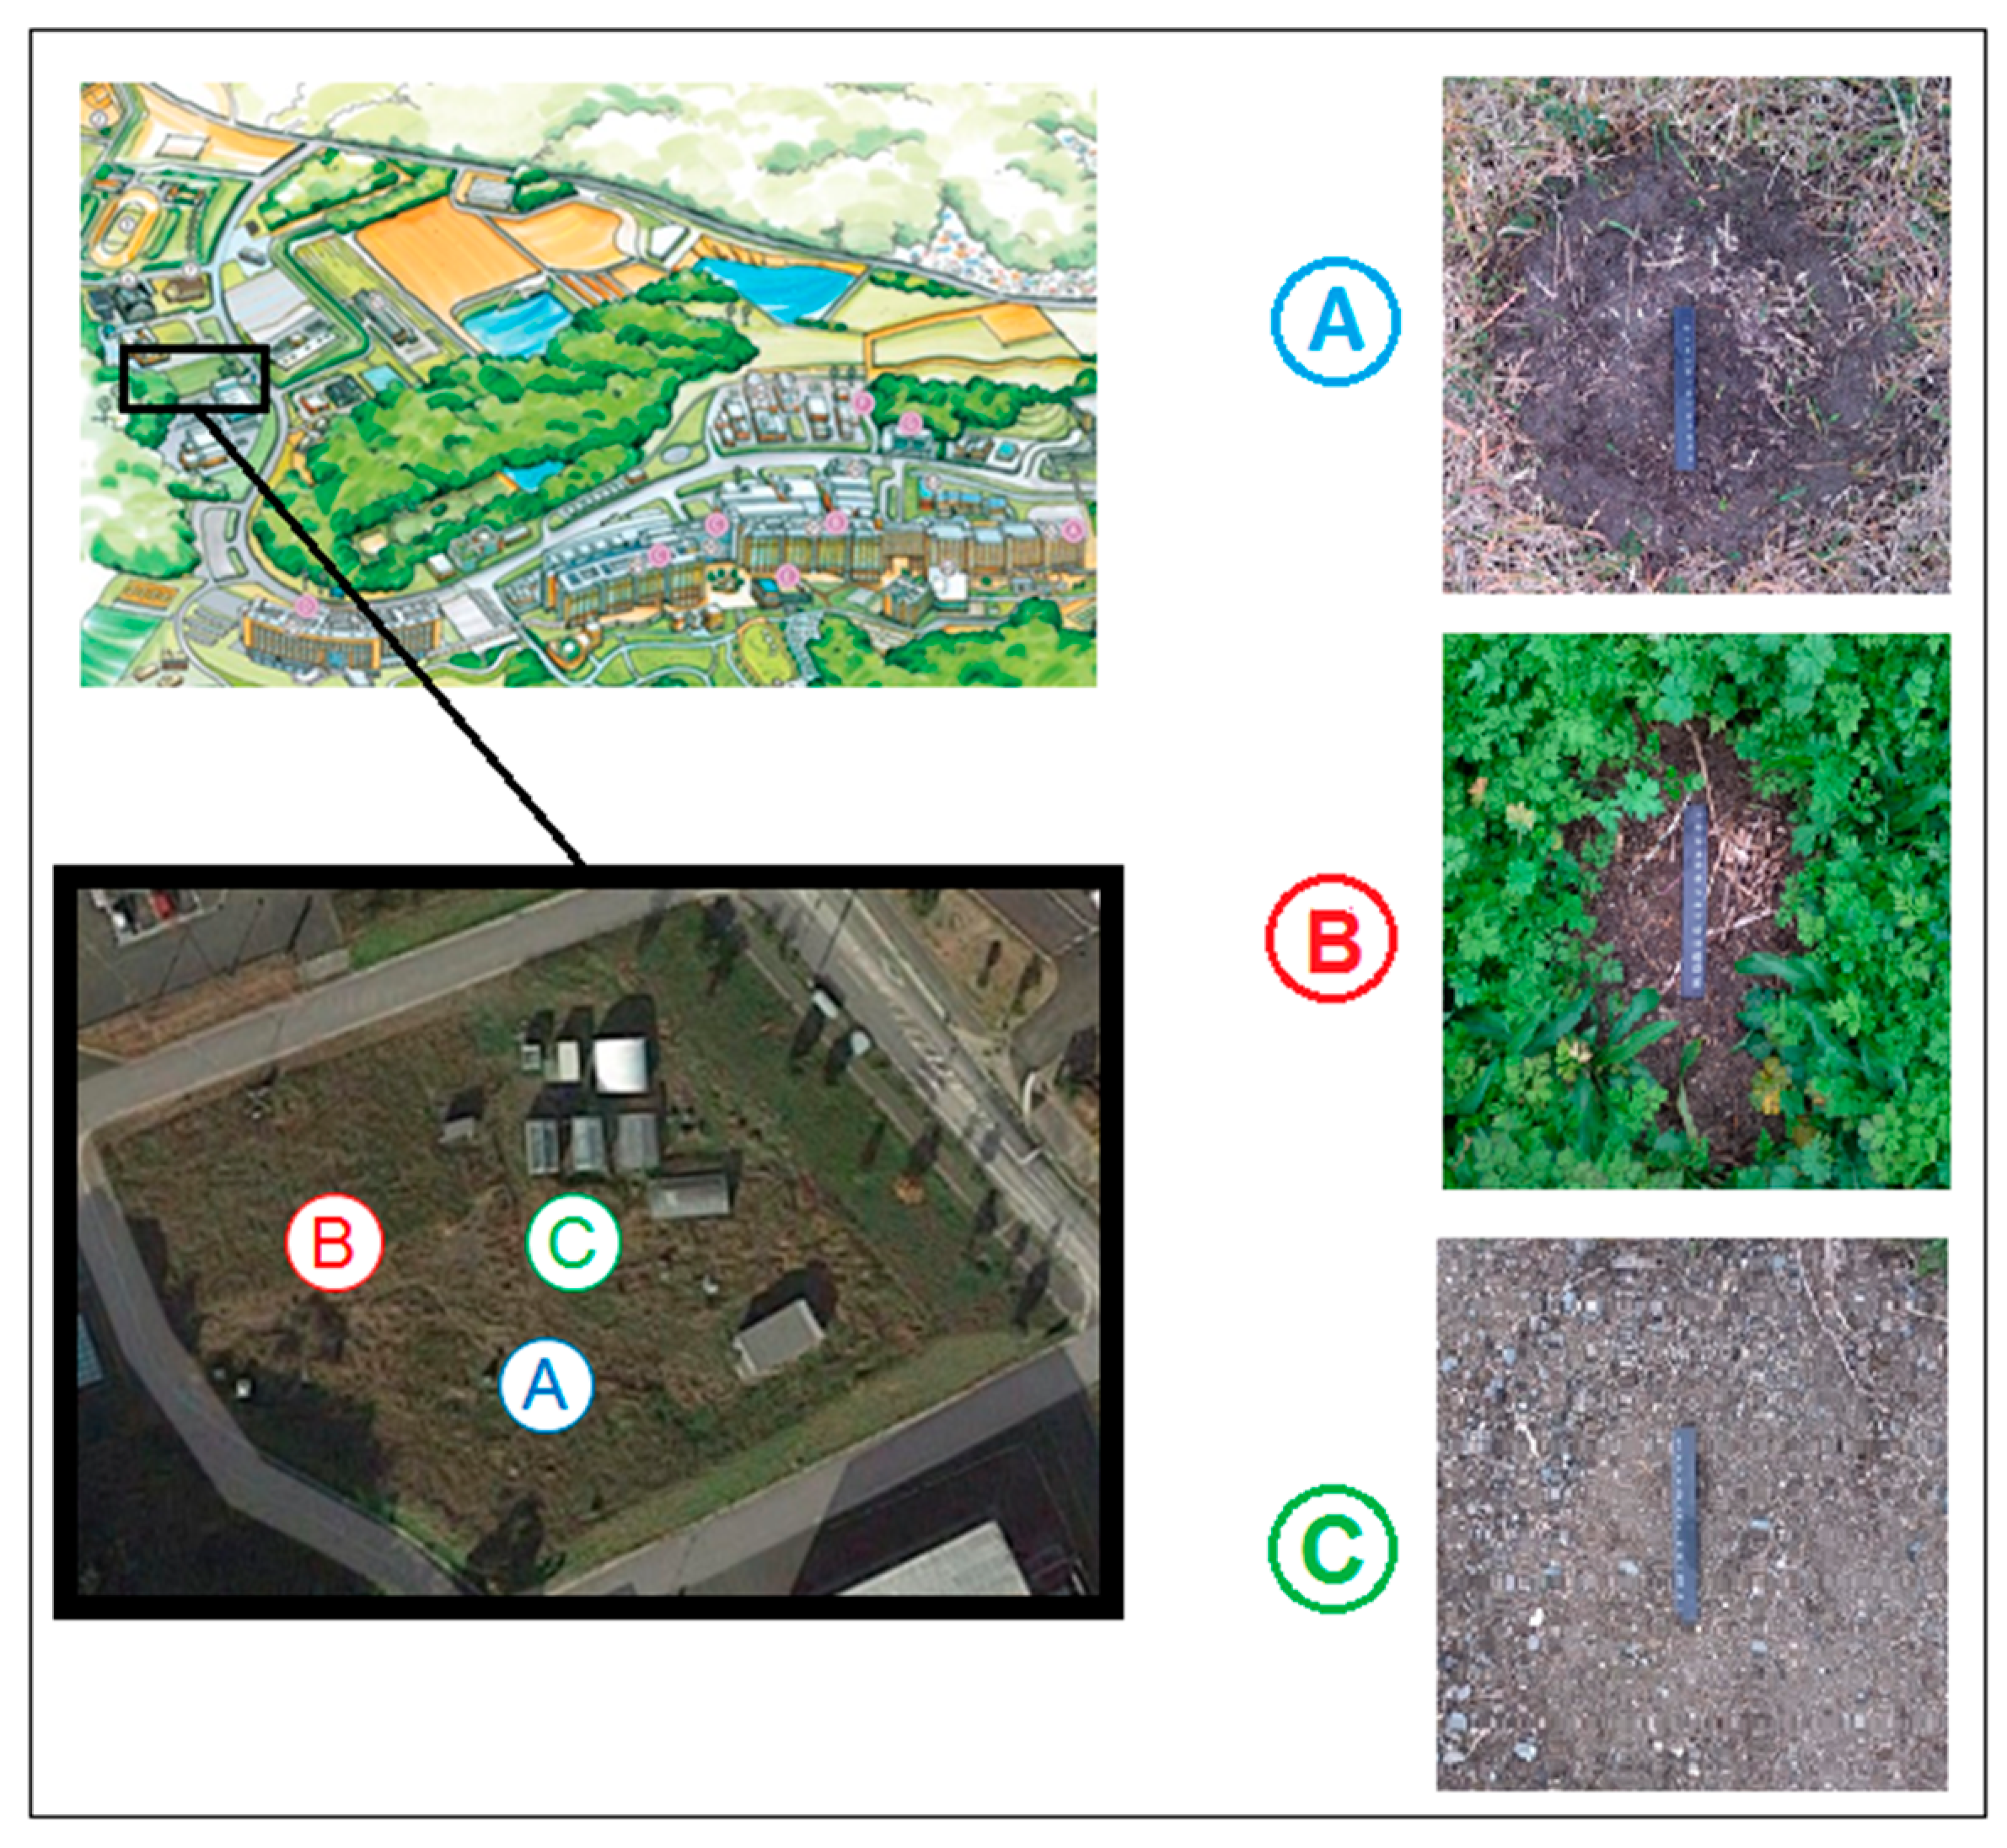
Site investigations for this study were conducted at the INAS test field site (Figure 1), located on the west side of Ito campus, Kyushu University (Japan) at latitude 33°35′ N and longitude 130°12′ E. The test field has previously been used for various environmental studies. Based on data obtained from the official website of the Japan Meteorological Agency (JMA), the average temperature in 2017 was 17.6 °C, with minimum and maximum monthly average temperatures of 7.4 °C in January and 29.5 °C in August, respectively. A maximum precipitation of 289.5 mm was recorded in October, with a minimum of 23.5 mm recorded in November.
2.2. Soil CO2 Flux
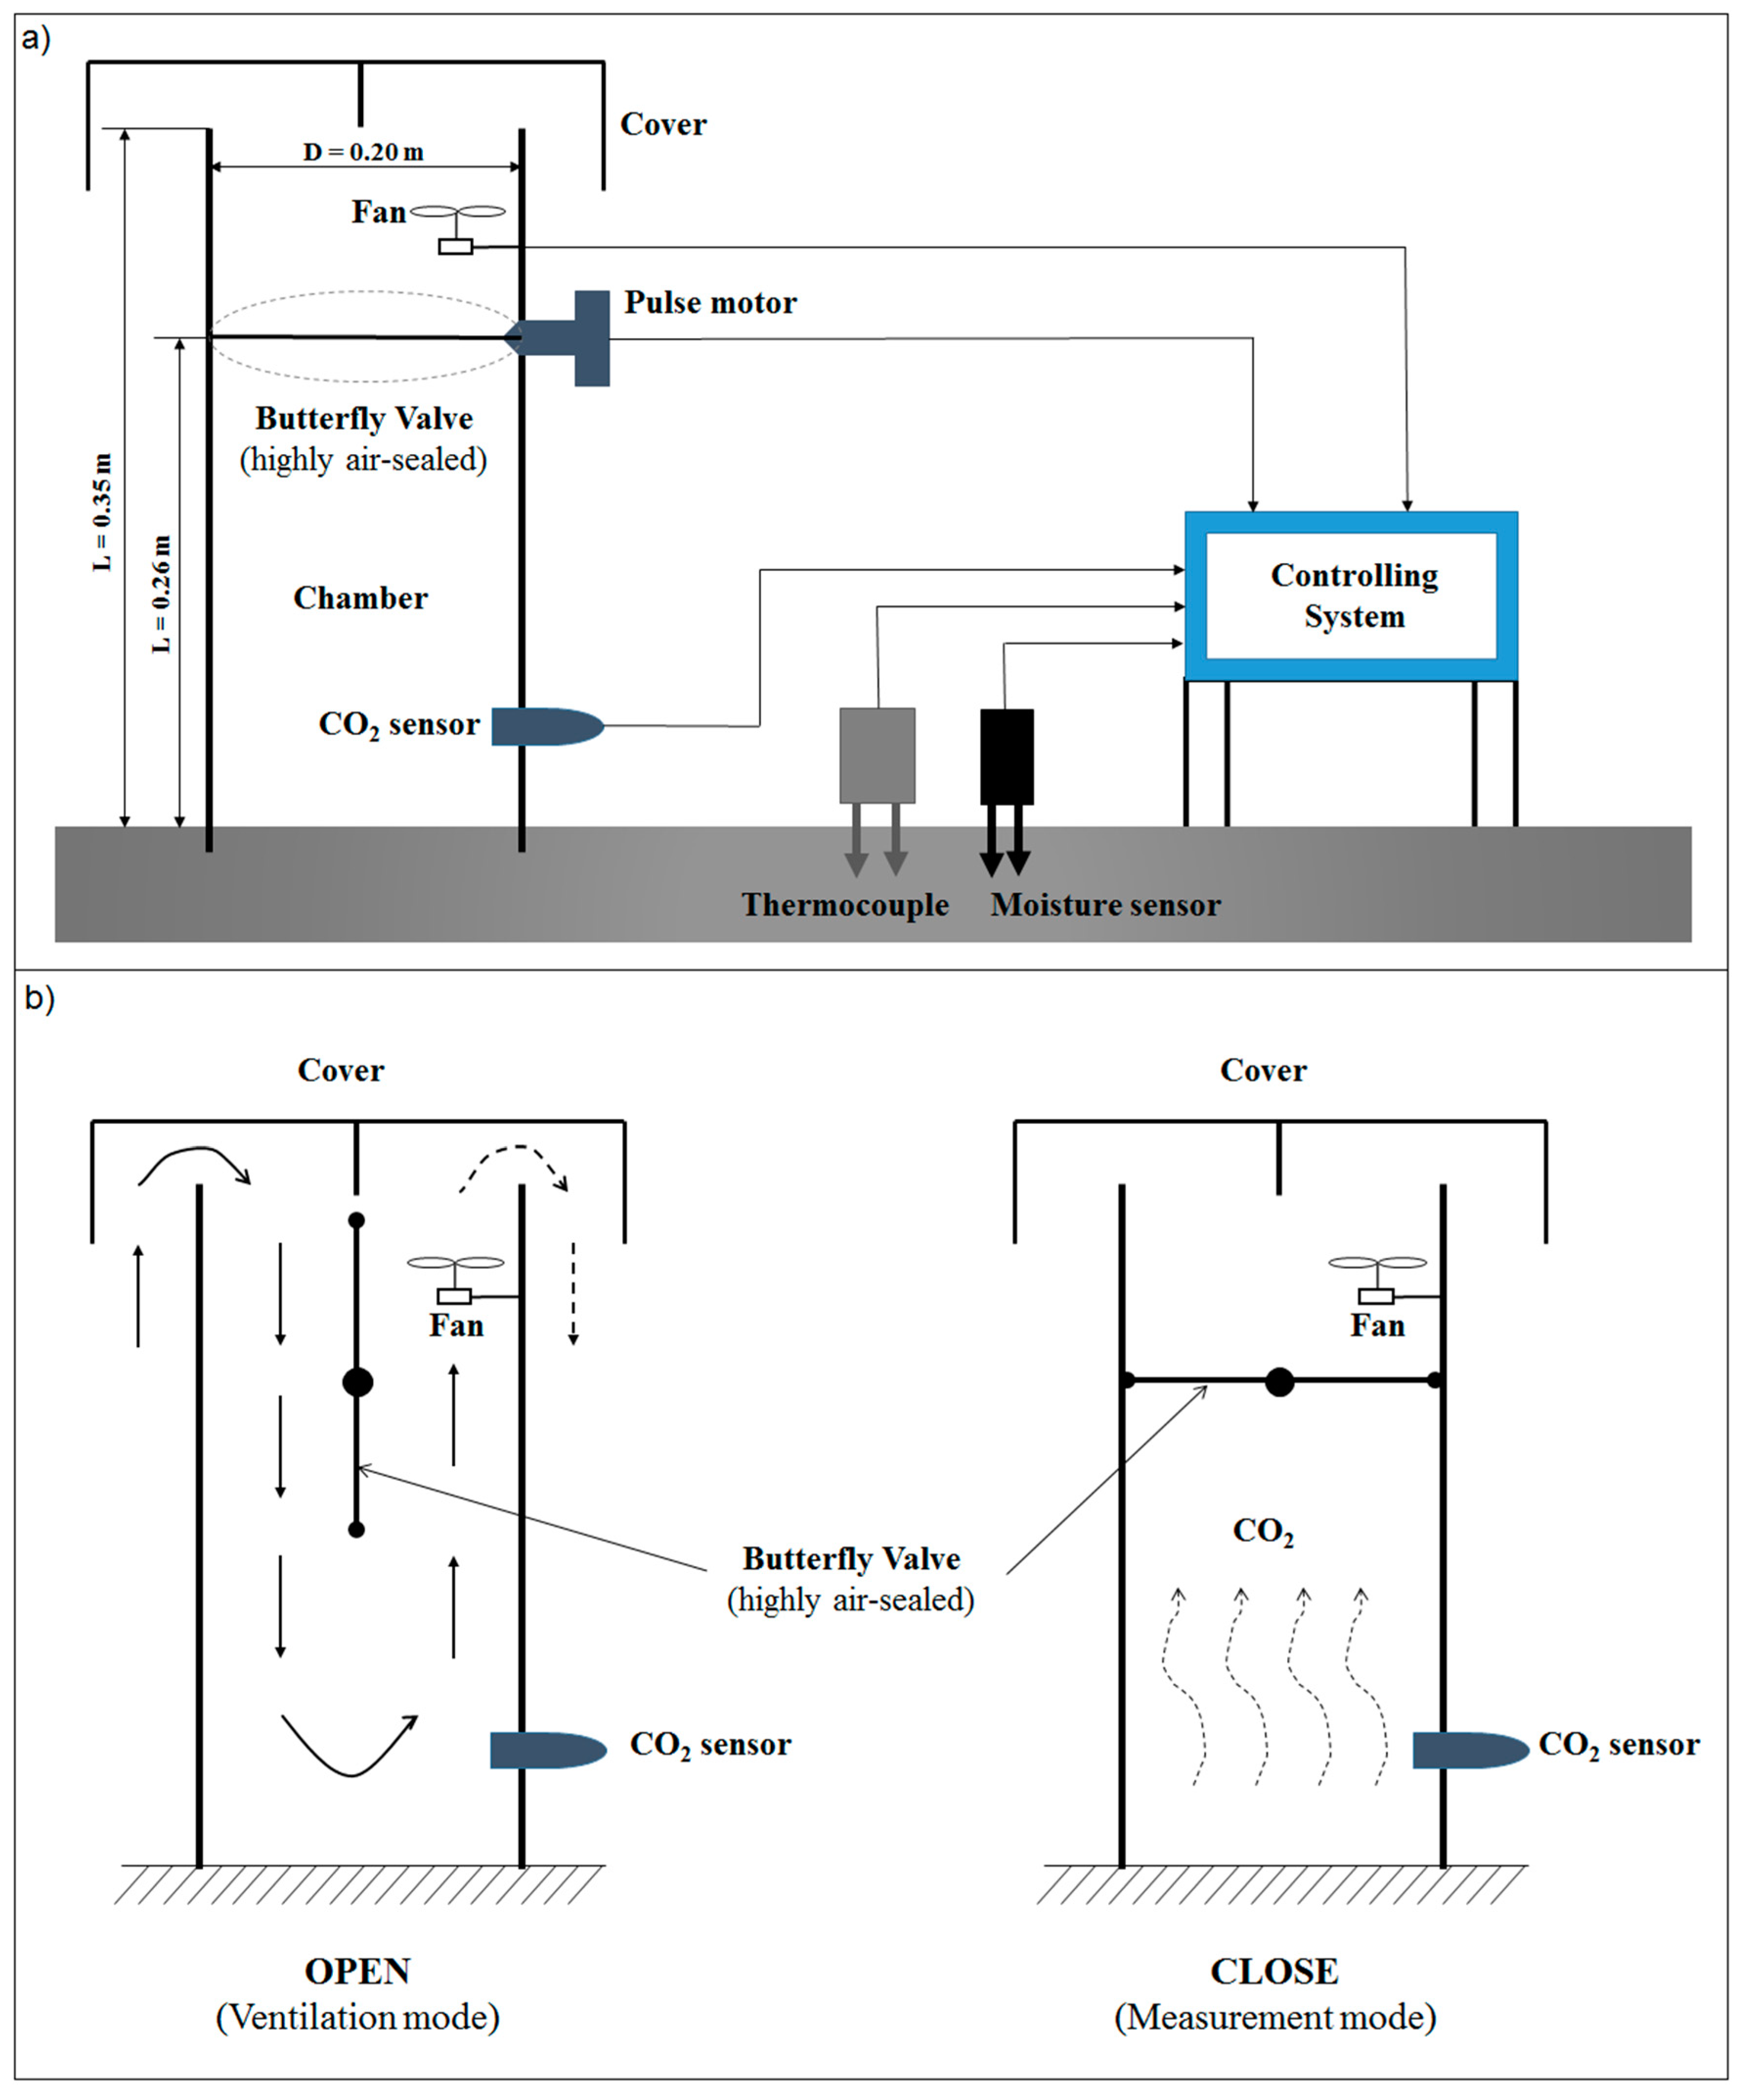
To accurately measure soil CO2 flux, the authors developed a soil CO2 flux measuring system based on the closed-chamber method that includes a measuring chamber and controlling system. An airtight chamber, 0.20 m in diameter and 0.35 m in height, was used to trap emitted gas from the soil (Figure 2). In addition, a CO2 gas sensor (GMP-343, VAISALA Inc., Helsinki, Finland) was used to measure CO2 concentrations and calibrated using ±0.5% accurate gases at 0, 200, 370, 600, 1000, 4000 ppm, and 2%. While a high butterfly valve with an automated close-open regime was located inside the chamber at 0.26 m from the soil surface, a circulated fan located at the top of the chamber was used to replace the air in the chamber with atmospheric air. Thermocouples (T-type, CHINO Inc., Tokyo, Japan) with a range from 0 to 200 °C and ±1.0 °C or ±0.75% in accuracy were set up to measure the temperature at different depths. Moisture sensors (EC-5, METTER Inc., Pullman, WA, USA) with a range from 0 to 100% were then inserted into the subsurface at a depth of 5 to 10 cm near the measuring chamber. A controlling system (Logger 308, CYBER MELON, Hyogo, Japan) was used to control and record signals from these sensors.
The following procedure was used to measure soil CO2 flux:
- All measuring apparatuses and related devices were carefully prepared to ensure that they were in good working order. A power supply was set up to allow continuous measurements to be taken, while a vinyl sheet was used to cover and protect all measuring apparatuses and devices from rain. In addition, all measuring locations were cleaned and leveled to ensure measurement stability.
- The chamber was inserted vertically at the selected area to a depth of 1.5 cm to minimize interference from the surrounding atmosphere. In addition, the installation of the chamber was completed 1 to 2 h before measurements were taken to ensure precise and accurate results.
- The CO2 sensor, fan, butterfly valve, thermocouples, and moisture sensors were connected to the controlling system, with one end of the thermocouple and moisture sensors inserted into the soil at a depth of 7 cm.
- The power source was connected to the controlling system with adapters, and all switches were turned on.
- The butterfly valve was opened fully, the fan was turned on for approximately one min for gas circulation, and CO2 concentrations were stabilized to atmospheric levels (400–500 ppm). Next, the butterfly valve was gradually closed until completely shut. Finally, the CO2 concentration inside the chamber was measured for 10 min, together with other parameters such as soil temperature and moisture content.
- Soil CO2 flux was calculated using the following equation [24]:
The total time for a measuring cycle was 16 min, which included ten minutes for measuring, one minute for air circulation, and five minutes for opening and closing the butterfly valve. All data, including CO2 concentrations and soil temperature, were recorded every four seconds. In contrast, the time gradient of the CO2 concentration was recorded and calculated every 16 min using a data logger (Serial Ghost DB9, KEELOG, Minami, FL, USA).
2.3. Measurement of Soil Moisture
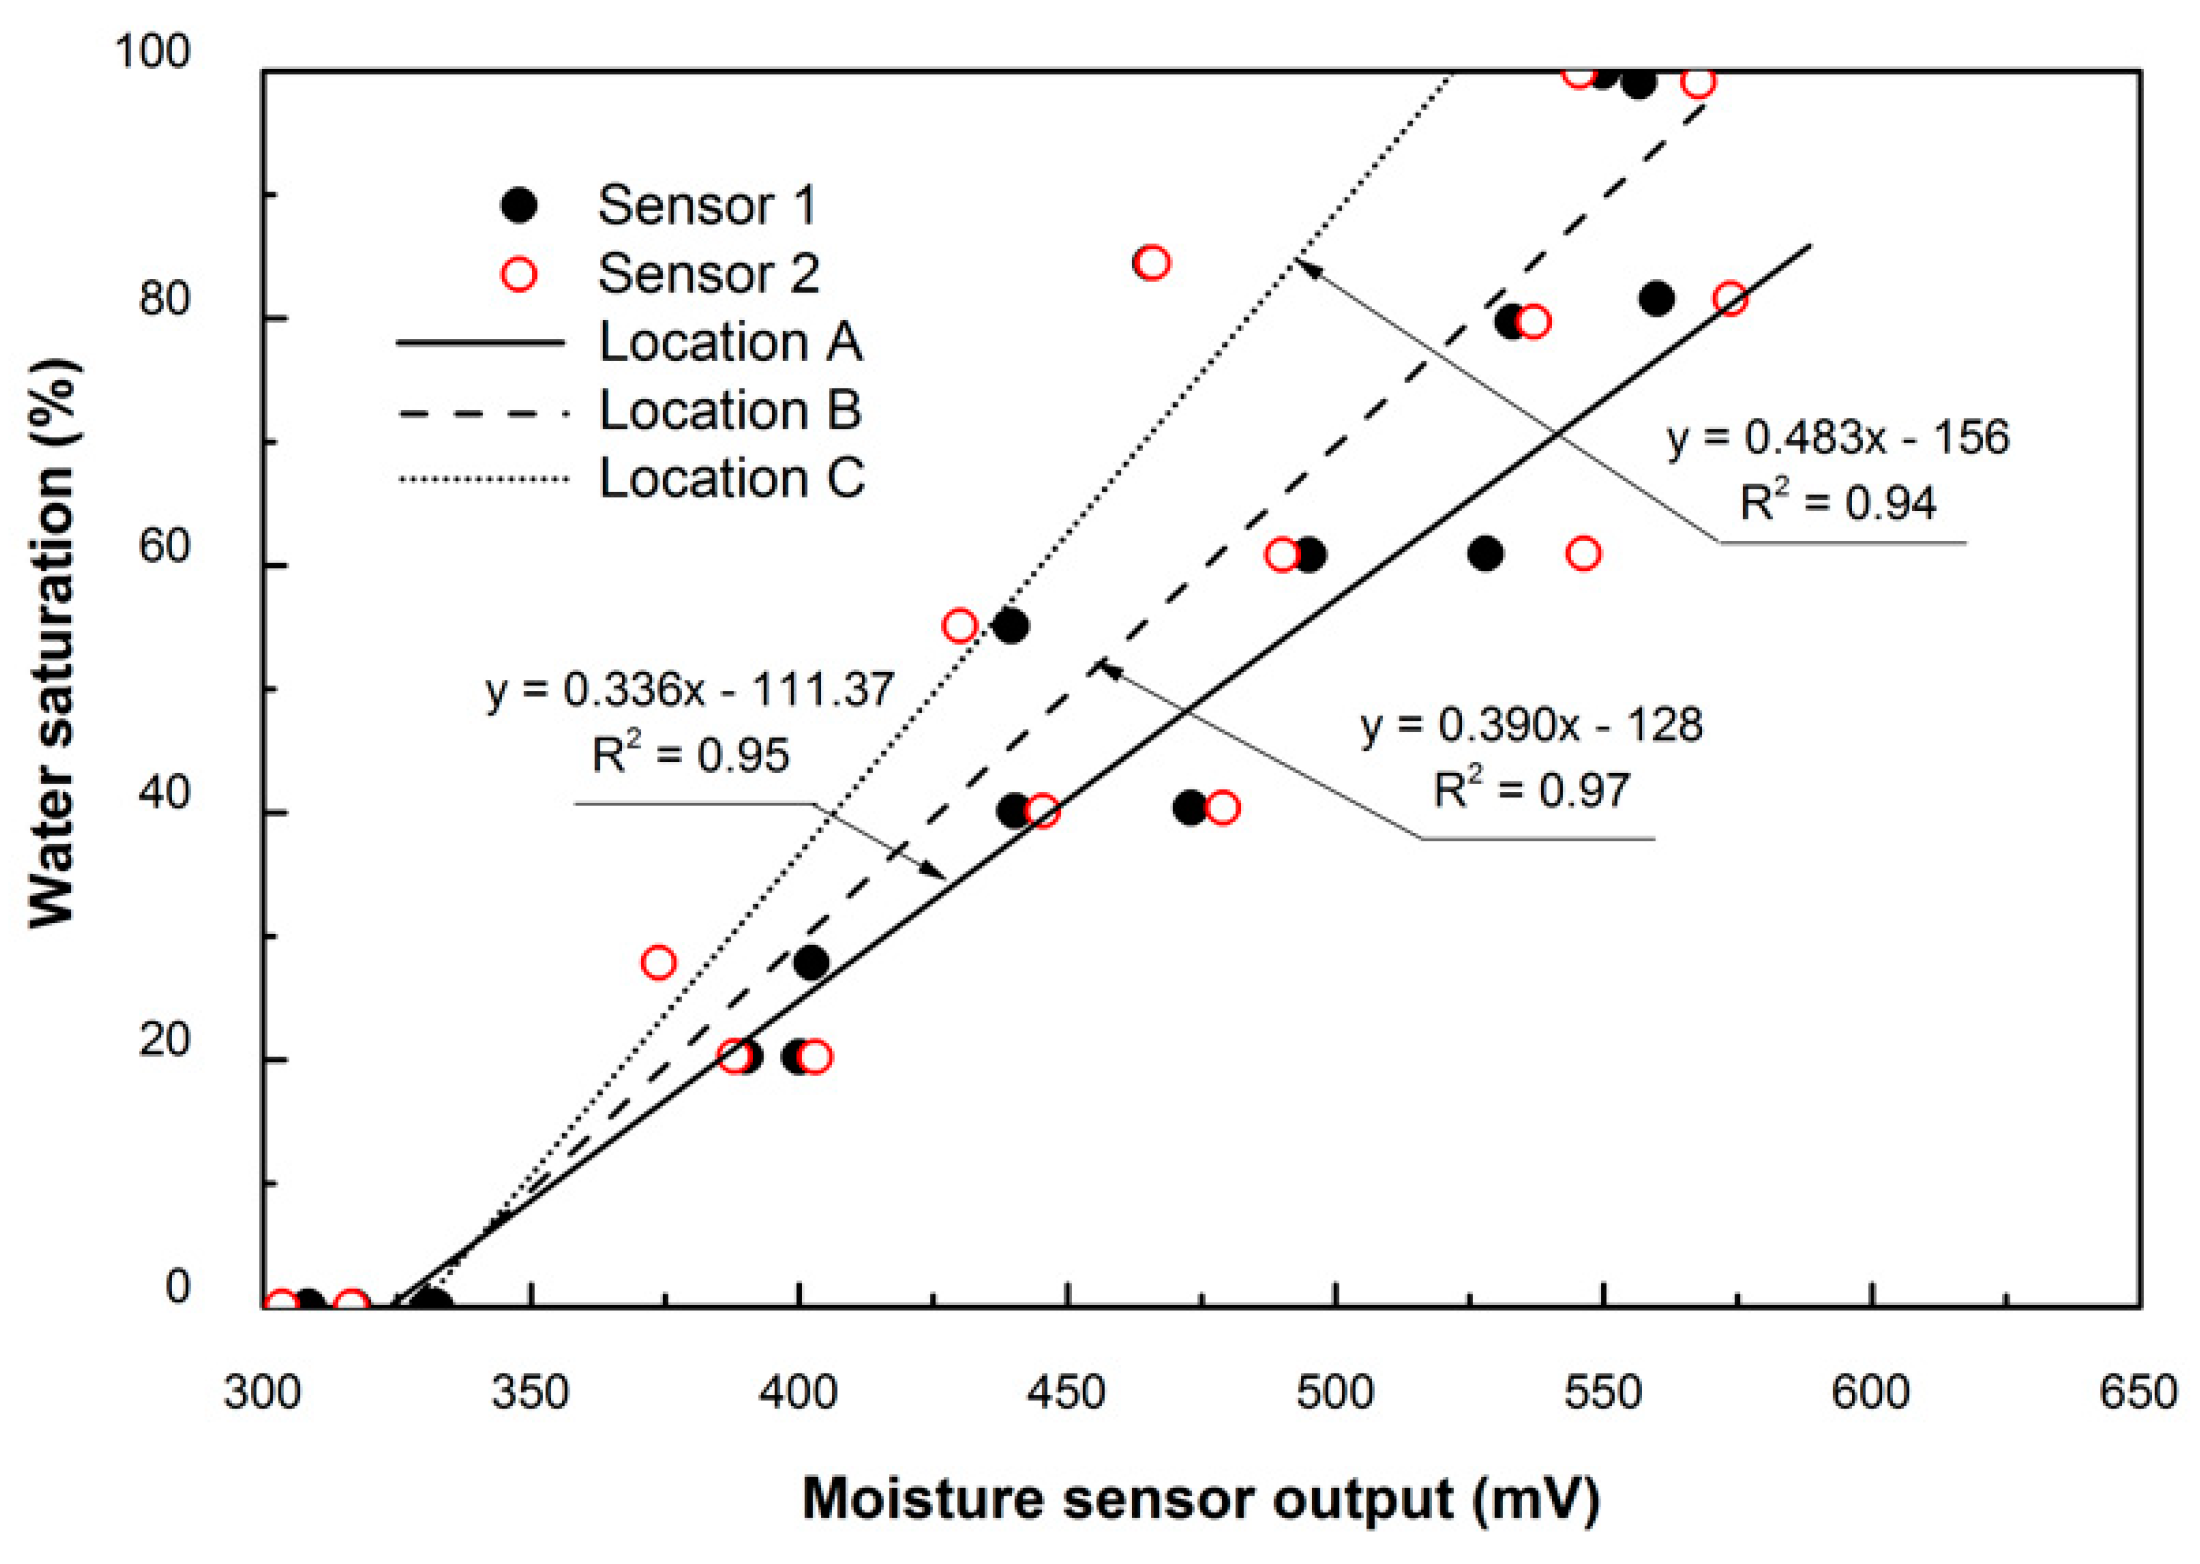
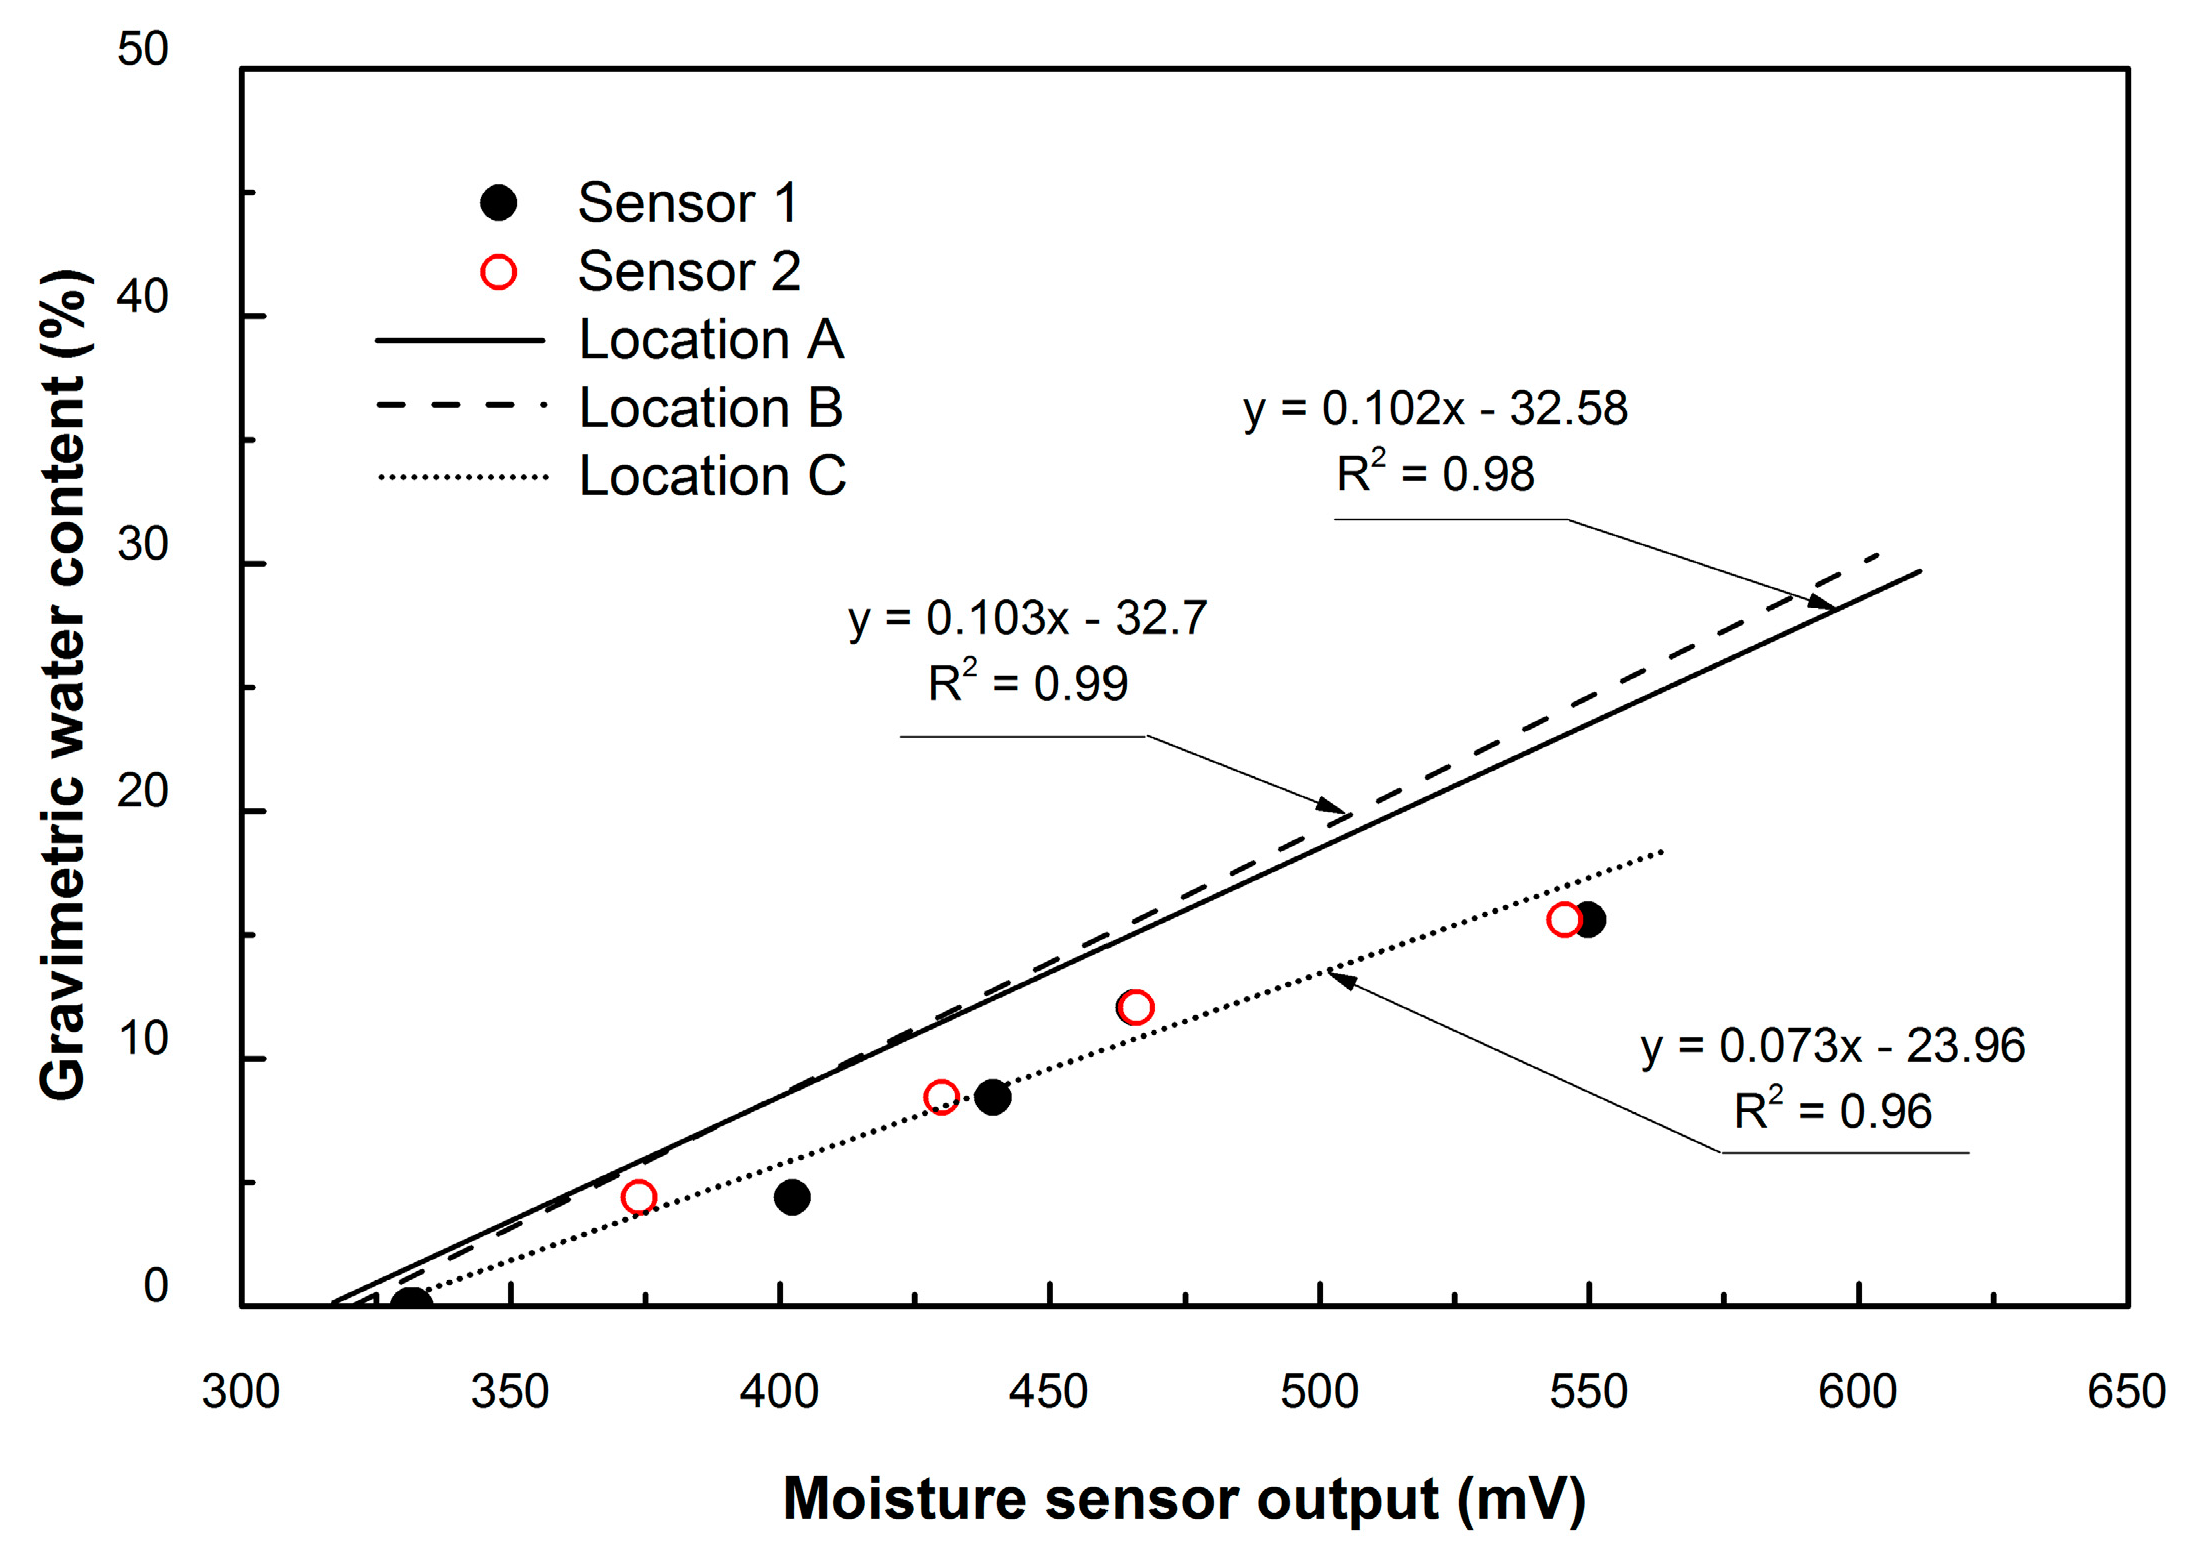
In this study, soil moisture was measured with soil moisture sensors using capacitance/frequency domain technology. Principally, soil capacitance is measured by the sensor output with a range from 0 to 2500 mV, equivalent to a moisture content of 0 and 100%, respectively. Therefore, soil moisture is calculated from the correlation between output voltage and measured soil moisture. As soil moisture–capacitance is correlated to soil type, the soil moisture output must be calibrated using the sampled soil. Several soil samples were taken from locations A, B, and C at the INAS test field to verify the correlation between the output voltage from soil moisture sensors and moisture measurements in the laboratory. Using this correlation, an appropriate amount of water was added to the dried soil in the laboratory to prepare mixed soil samples with different moisture contents. Soil samples were then packed into plastic containers that matched the original volume in the field. Two soil moisture sensors were inserted into the soil samples, and sensor outputs, water saturation, volumetric water content, and gravimetric water content of soils were recorded for varying moisture contents.
Water saturation can be described as the volume of water per unit of pore volume using the following equation:
where Sw (%) represents water saturation, Vw (cm3) is the volume of water, and Vpore (cm3) is the volume of the pores in the soil. Soil water content includes gravimetric and volumetric soil water measured as mass or volume [25]. Gravimetric soil water content is the mass of water in the soil, measured as the difference between moist soil and the soil dried at 105 °C, or oven-dry weight. Notably, gravimetric soil water content is expressed per unit mass of oven-dried soil using the following equation:
where GWC (%) is the gravimetric soil water content, m1 (g) is the mass of moist soil, and m2 (g) is the mass of the oven-dried soil. Measurements of soil gravimetric water content are considered destructive (oven-drying) and therefore, the soil sample was not used for further chemical analysis.
Volumetric soil water content is the volume of water per unit volume of soil expressed by the following equation:
where VWC (%) is the volumetric soil water content, Vw (cm3) is the volume of water, and Vs (cm3) is the volume of soil.
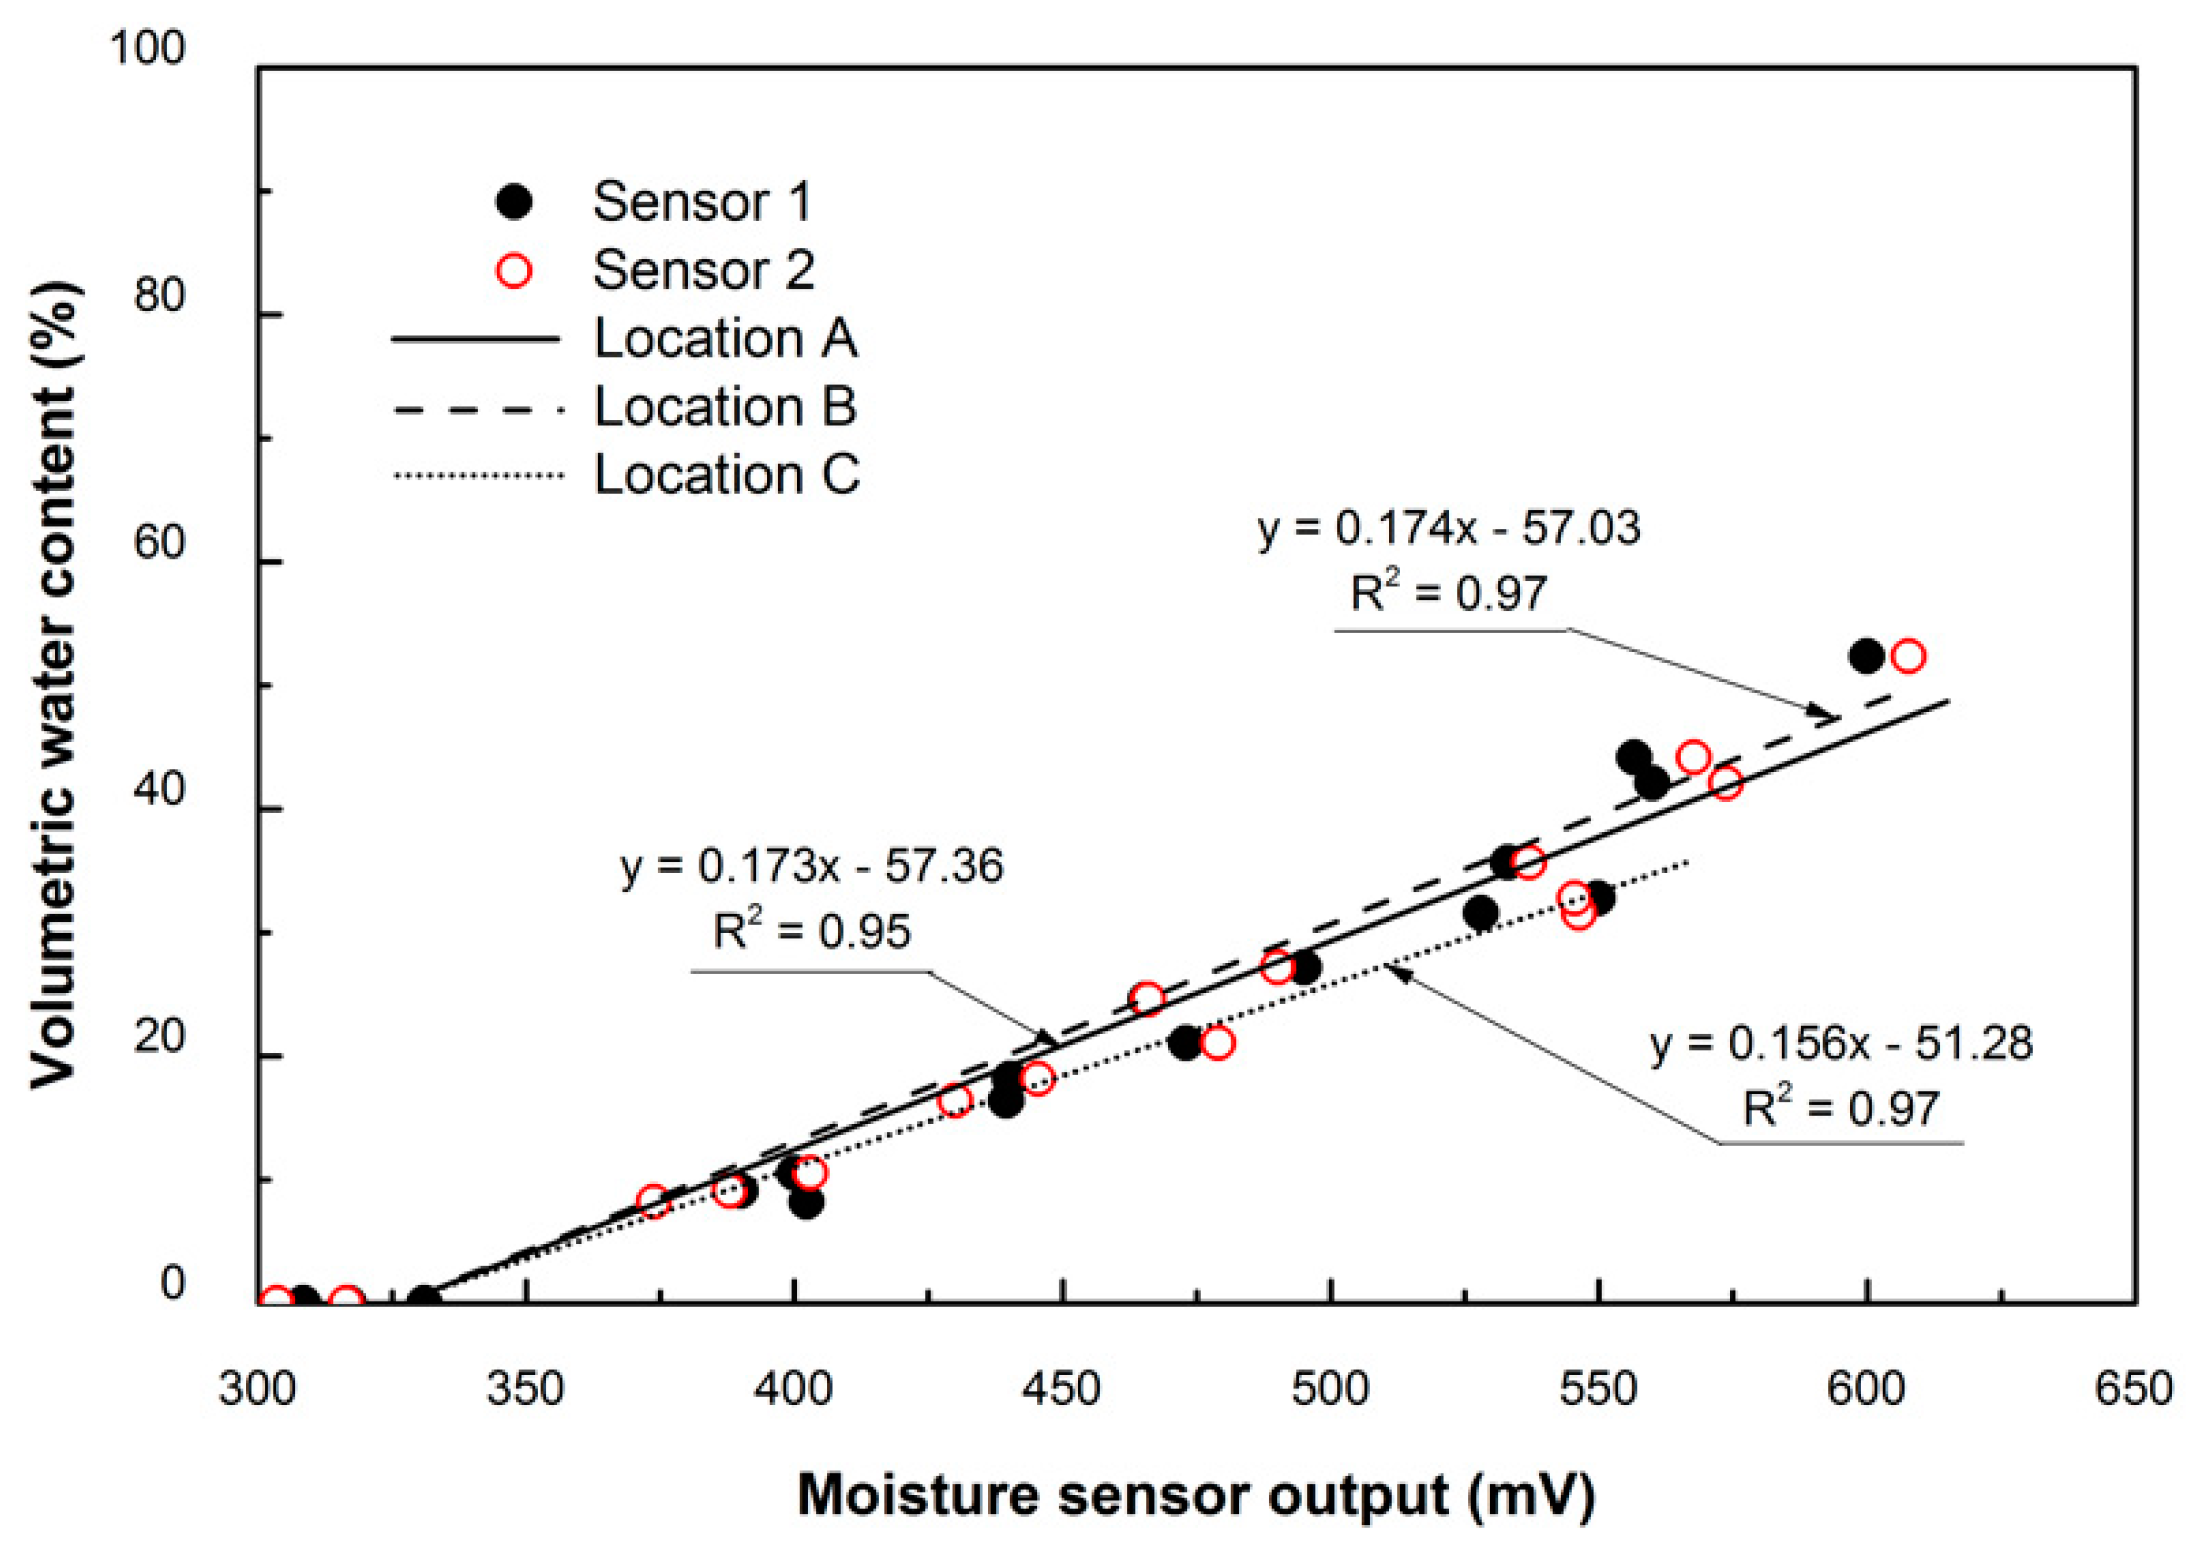
Soil moisture data were calculated using Equations (2) to (4) together with output data from the sensors at each water weight level to investigate the correlation between output voltage and analyzed soil moisture for samples from locations A, B, and C (Figure 3, Figure 4 and Figure 5).
As shown in Figure 3, Figure 4 and Figure 5, the correlation coefficient (R2) between sensor output and water content was over 0.94 across all samples. Therefore, it is possible to use moisture sensor output data to calculate soil moisture using correlation equations. In this study, VWC represents soil moisture in all calculations and discussions and was calculated using the following equations:
where y (%) represents the volumetric soil water content and x (mV) represents the sensor output data.
2.4. Measurement of Soil Organic Matter (SOM)
Soil organic matter (SOM) and soil moisture were analyzed in the laboratory using 1 g soil samples taken from a 2.5 cm subsurface soil layer at the INAS testing field locations. First, the weight of moisture (WW) was derived by subtracting the weight of the soil sample after placing it in a drying oven at 105 °C for 1 h from the weight of the initial soil sample. Next, to determine the weight of ash (WC), soil samples were placed in an electric furnace at 500 °C for 1 h. Then, the temperature was increased to 800 °C for 45 min and cooled down for 3 h in a vacuum canister. Subsequently, WC was calculated by determining the difference between the sample weights before and after heating. Finally, the weight of SOM (WO) was derived by subtracting the weight of moisture and ash from the weight of the initial soil sample.
The amount of SOM rate was calculated using the following equation:
where WO (g) refers to the weight of soil organic matter and WS (g) is the weight of the soil sample.
The weight of SOM, WO was calculated from the proximate analysis results of moisture and ash content in soil using the following equation:
where WS (g) represents the weight of the soil sample, WW (g) is the weight of moisture, and WC (g) the weight of the ash.
2.5. Laboratory Measurement of Gas Permeability
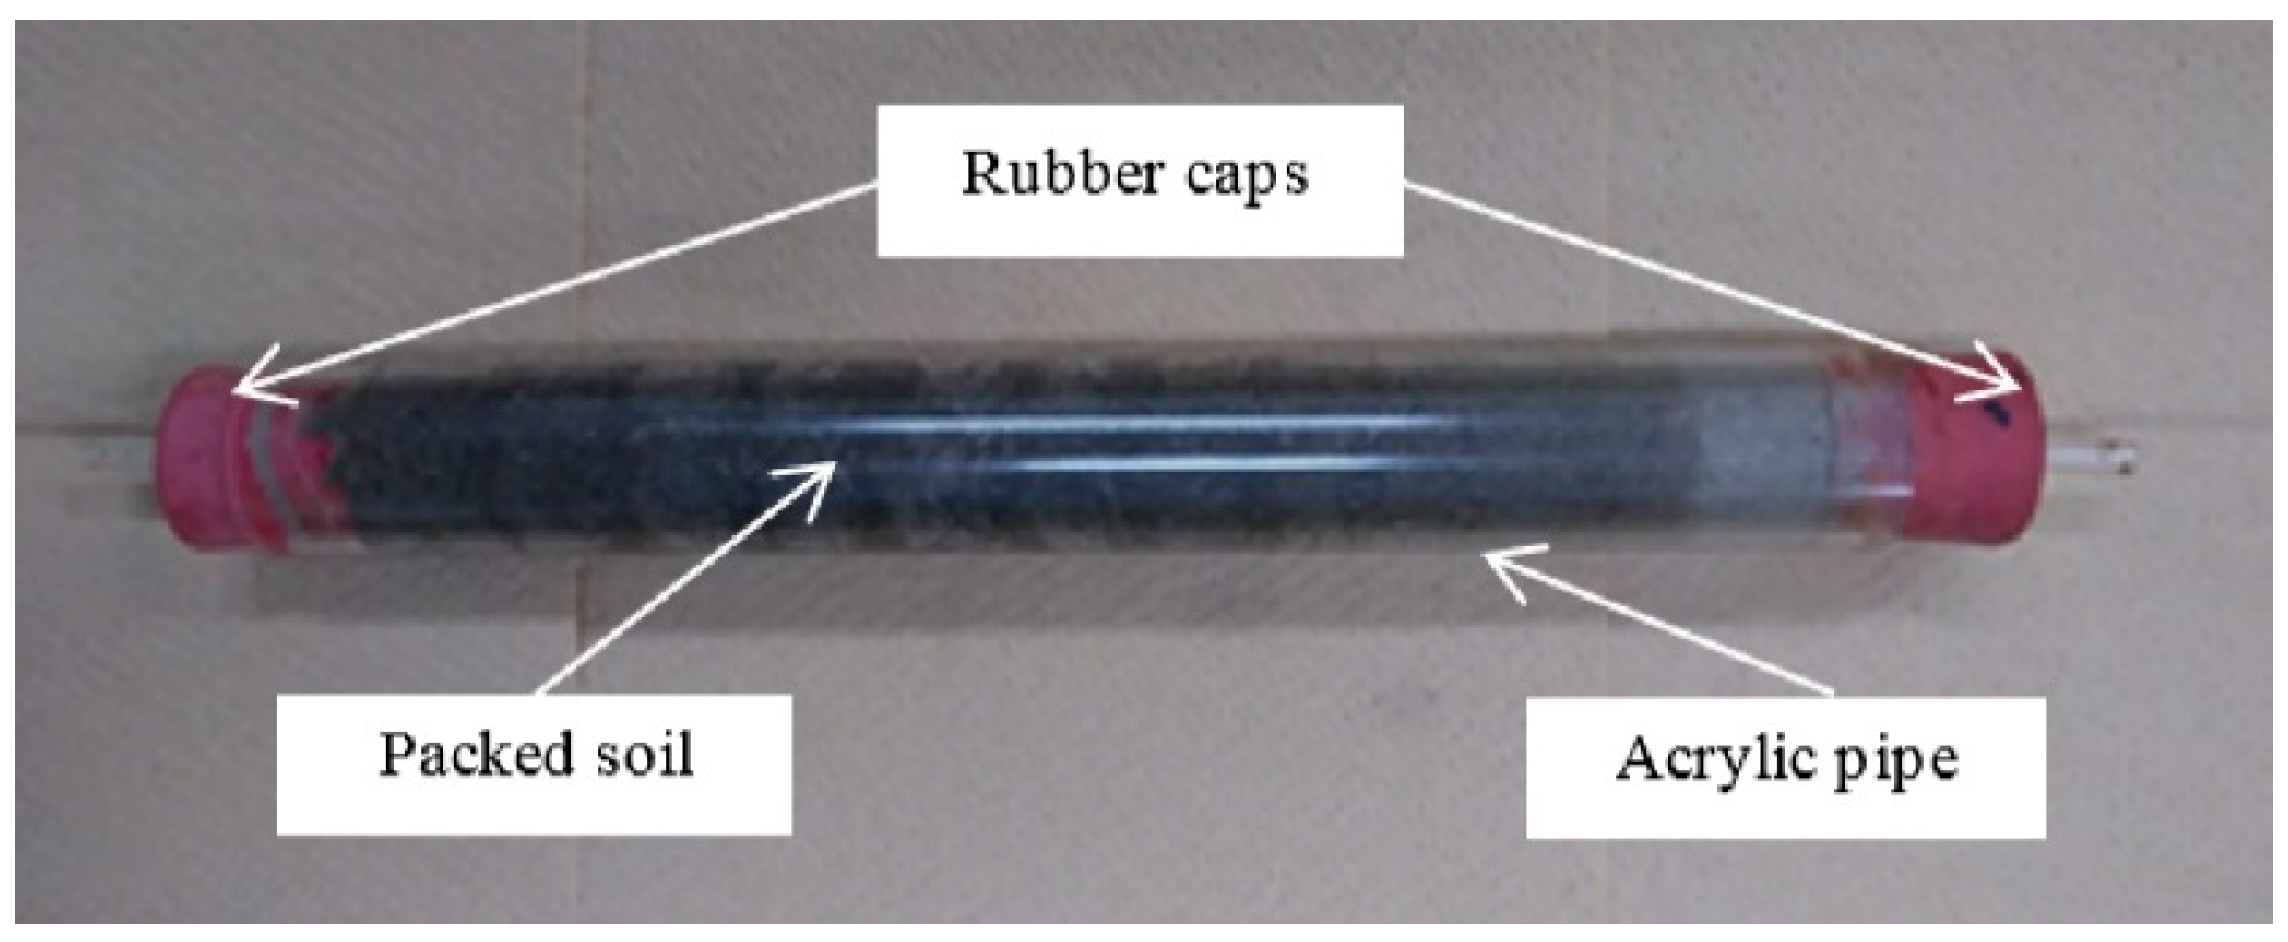
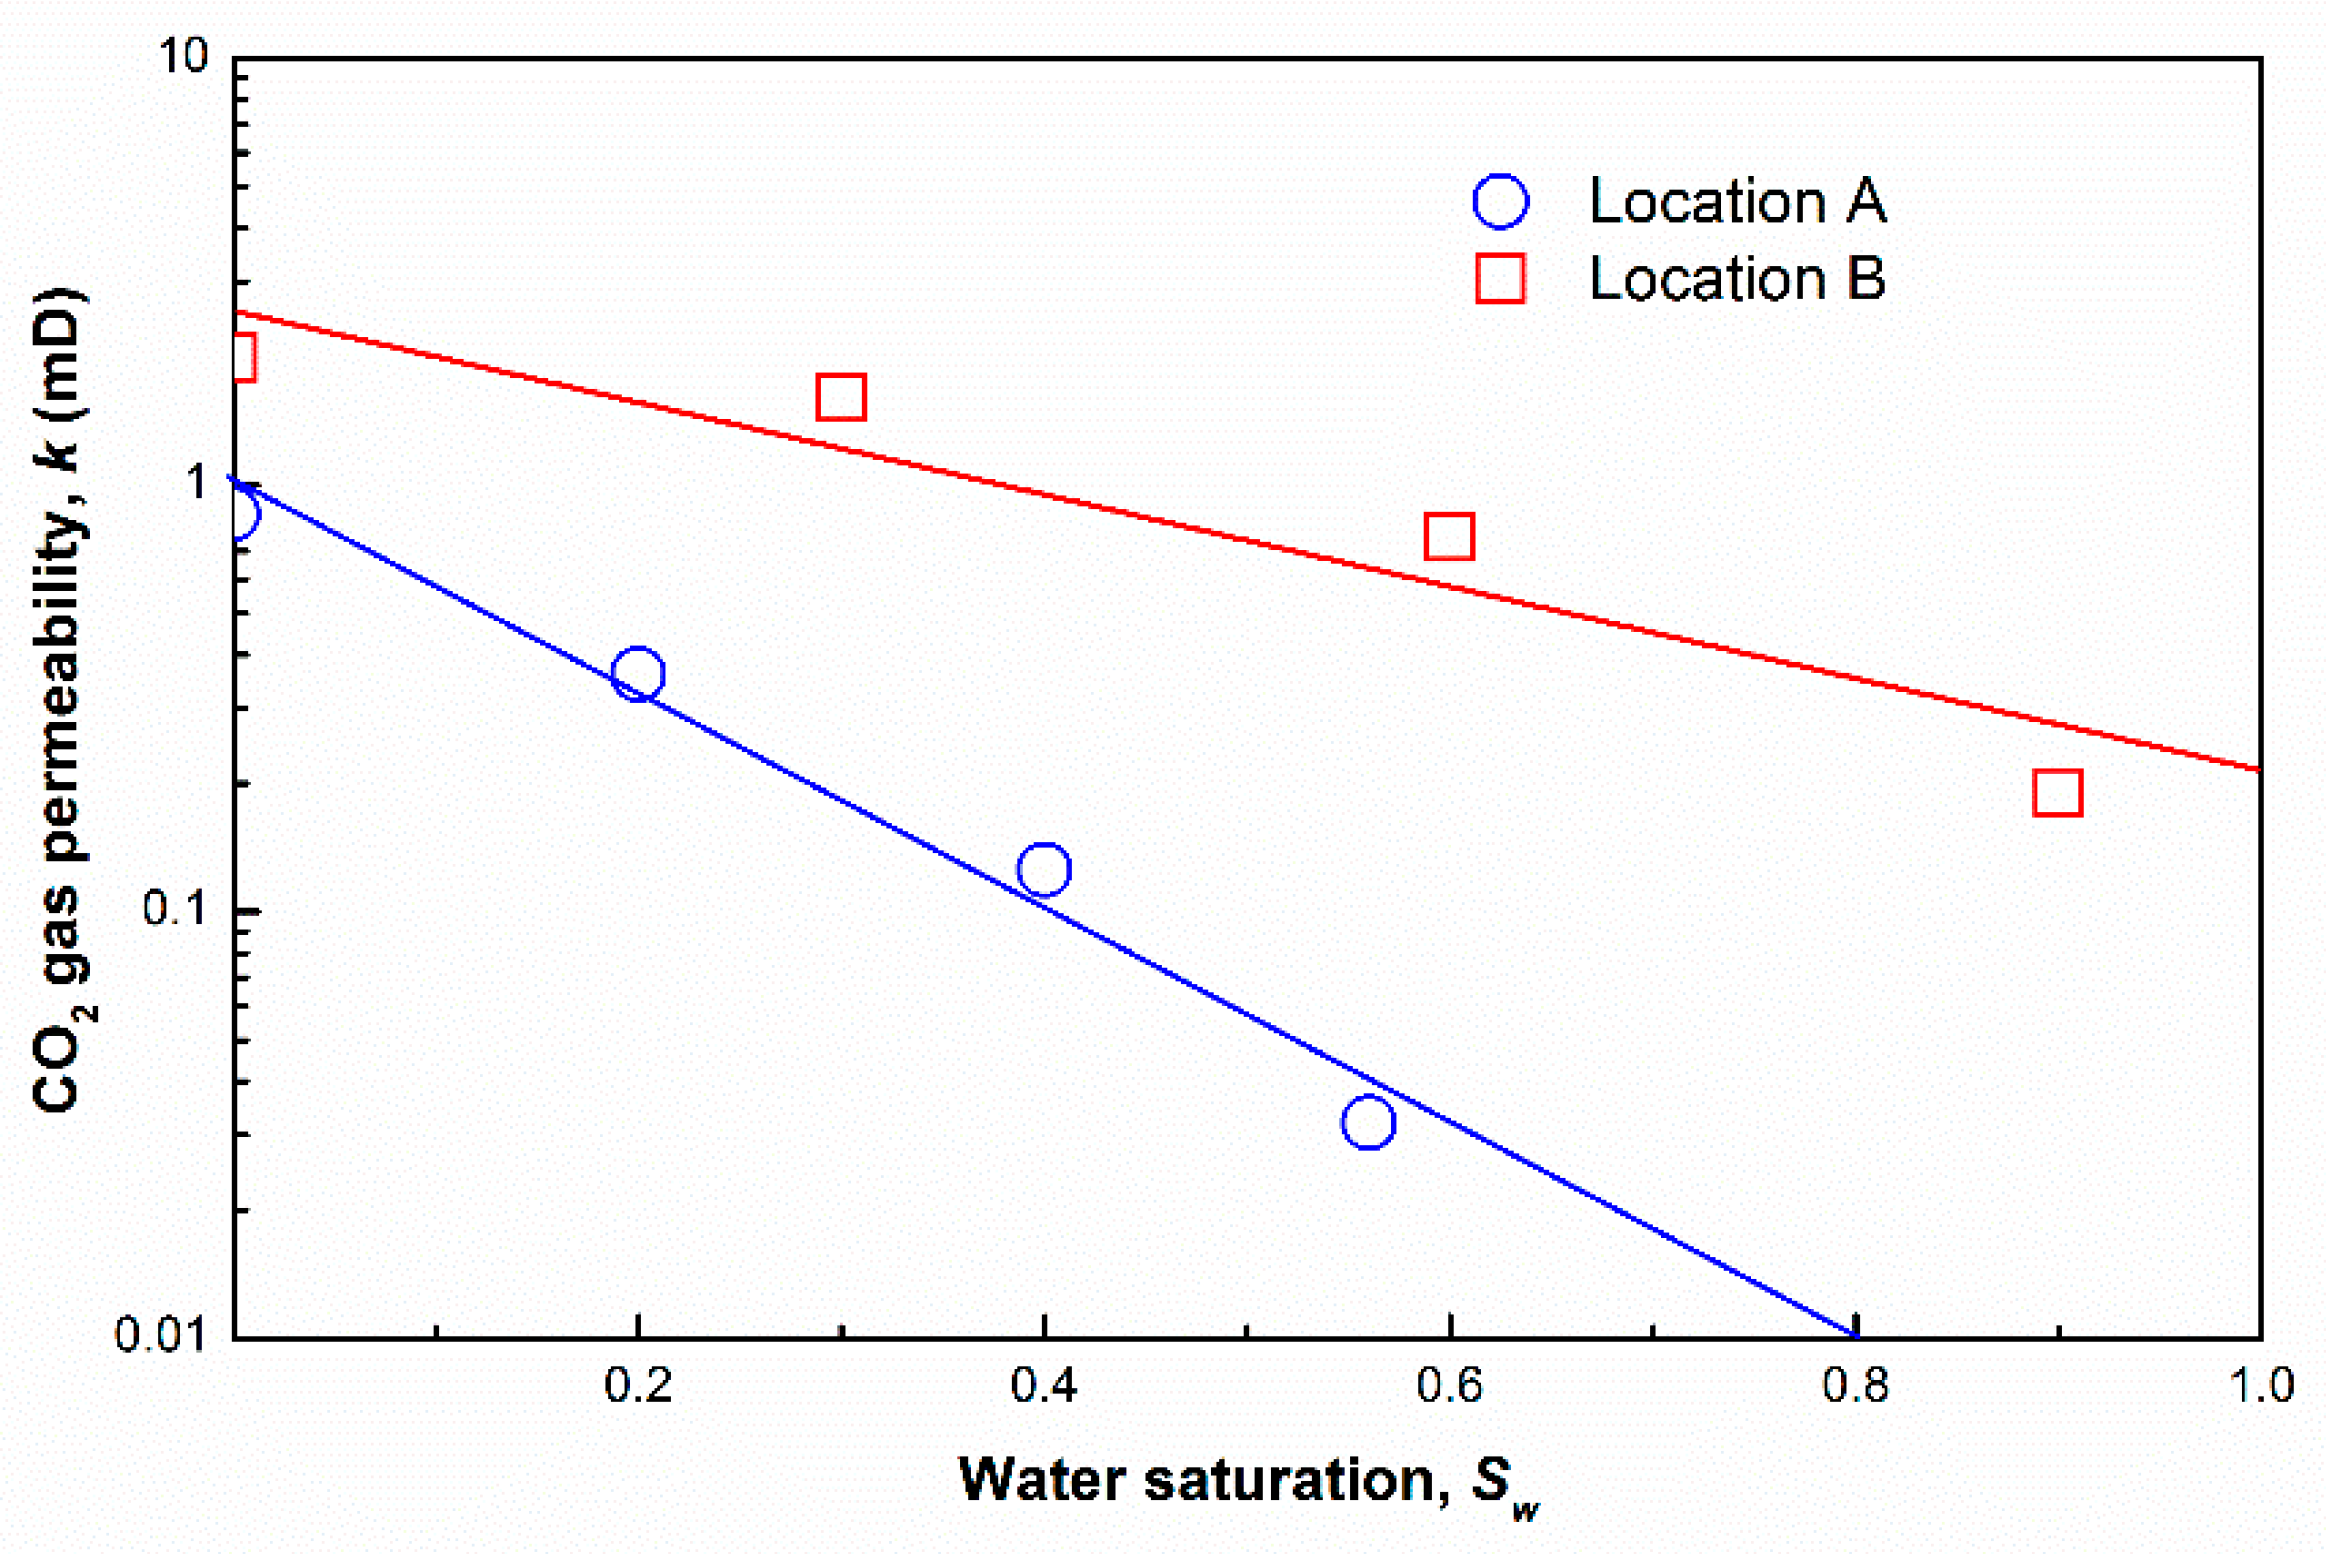
The decrease in soil CO2 flux from the soil surface after rainfall is primarily due to an increase in soil water saturation (Sw > 0.4). This is due to a reduction in CO2 gas diffusion as pores are filled by water. Therefore, in this study, the physical effect of soil water saturation was estimated from CO2 gas permeability using packed soil (6.38 cm2 cross-section, 21.8 cm length) from locations A and B (Figure 6). Gas permeability of soil can be correlated to the gas diffusion coefficient through soil porosity (ε). Furthermore, based on the Kozeny-Carman equation [26], permeability k (mD) is expressed by a function of εn/(1 − ε)2, where n = 3–4, while the gas diffusion coefficient D (m2/s) is approximately proportional to ε. Therefore, although both increase with an increase in ε, k is more sensitive to ε than D. In the laboratory-based investigations, permeability was calculated using pressure drop and CO2 gas flow rate through soil packed in acrylic pipes using Darcy’s equation [27].
Results regarding gas permeability of soils are shown in Figure 7. As water saturation increases, CO2 gas permeability decreases because of the declining porosity. The clear correlation between gas permeability and water saturation indicates that CO2 diffusion is constrained by increasing water content in soil. Consequently, soil CO2 flux decreased with increasing soil moisture, due to the physical effect of moisture on soil. However, in lower soil moisture ranges (Sw ≤ 0.3), the soil gas flux may be affected differently owing to enhanced biological activity in the soil. We will discuss in detail the effect in Section 3.2. In summary, our results indicate the permeability of soil at Location A to be lower than that at Location B.
3. Results and Discussion
3.1. Soil Temperature at Different Depths
Soil temperature is one of the most significant parameters related to soil CO2 flux. To determine the appropriate depth at which to measure soil temperature, temperature measurements were taken on the surface and at 5, 7, and 10 cm depths. Temperature readings were carried out simultaneously with soil CO2 flux measurements.
Our results indicate that soil temperature on the surface and at a depth of 5 cm had a wide range of fluctuation, while temperatures at a depth of 7 cm were more stable and consistent and showed the highest correlation coefficient with soil CO2 flux (Figure 8). Hence, our results and discussion, we primarily focus on temperature data recorded at a depth of 7 cm.
3.2. Effect of Environmental Factors on Soil CO2 Flux
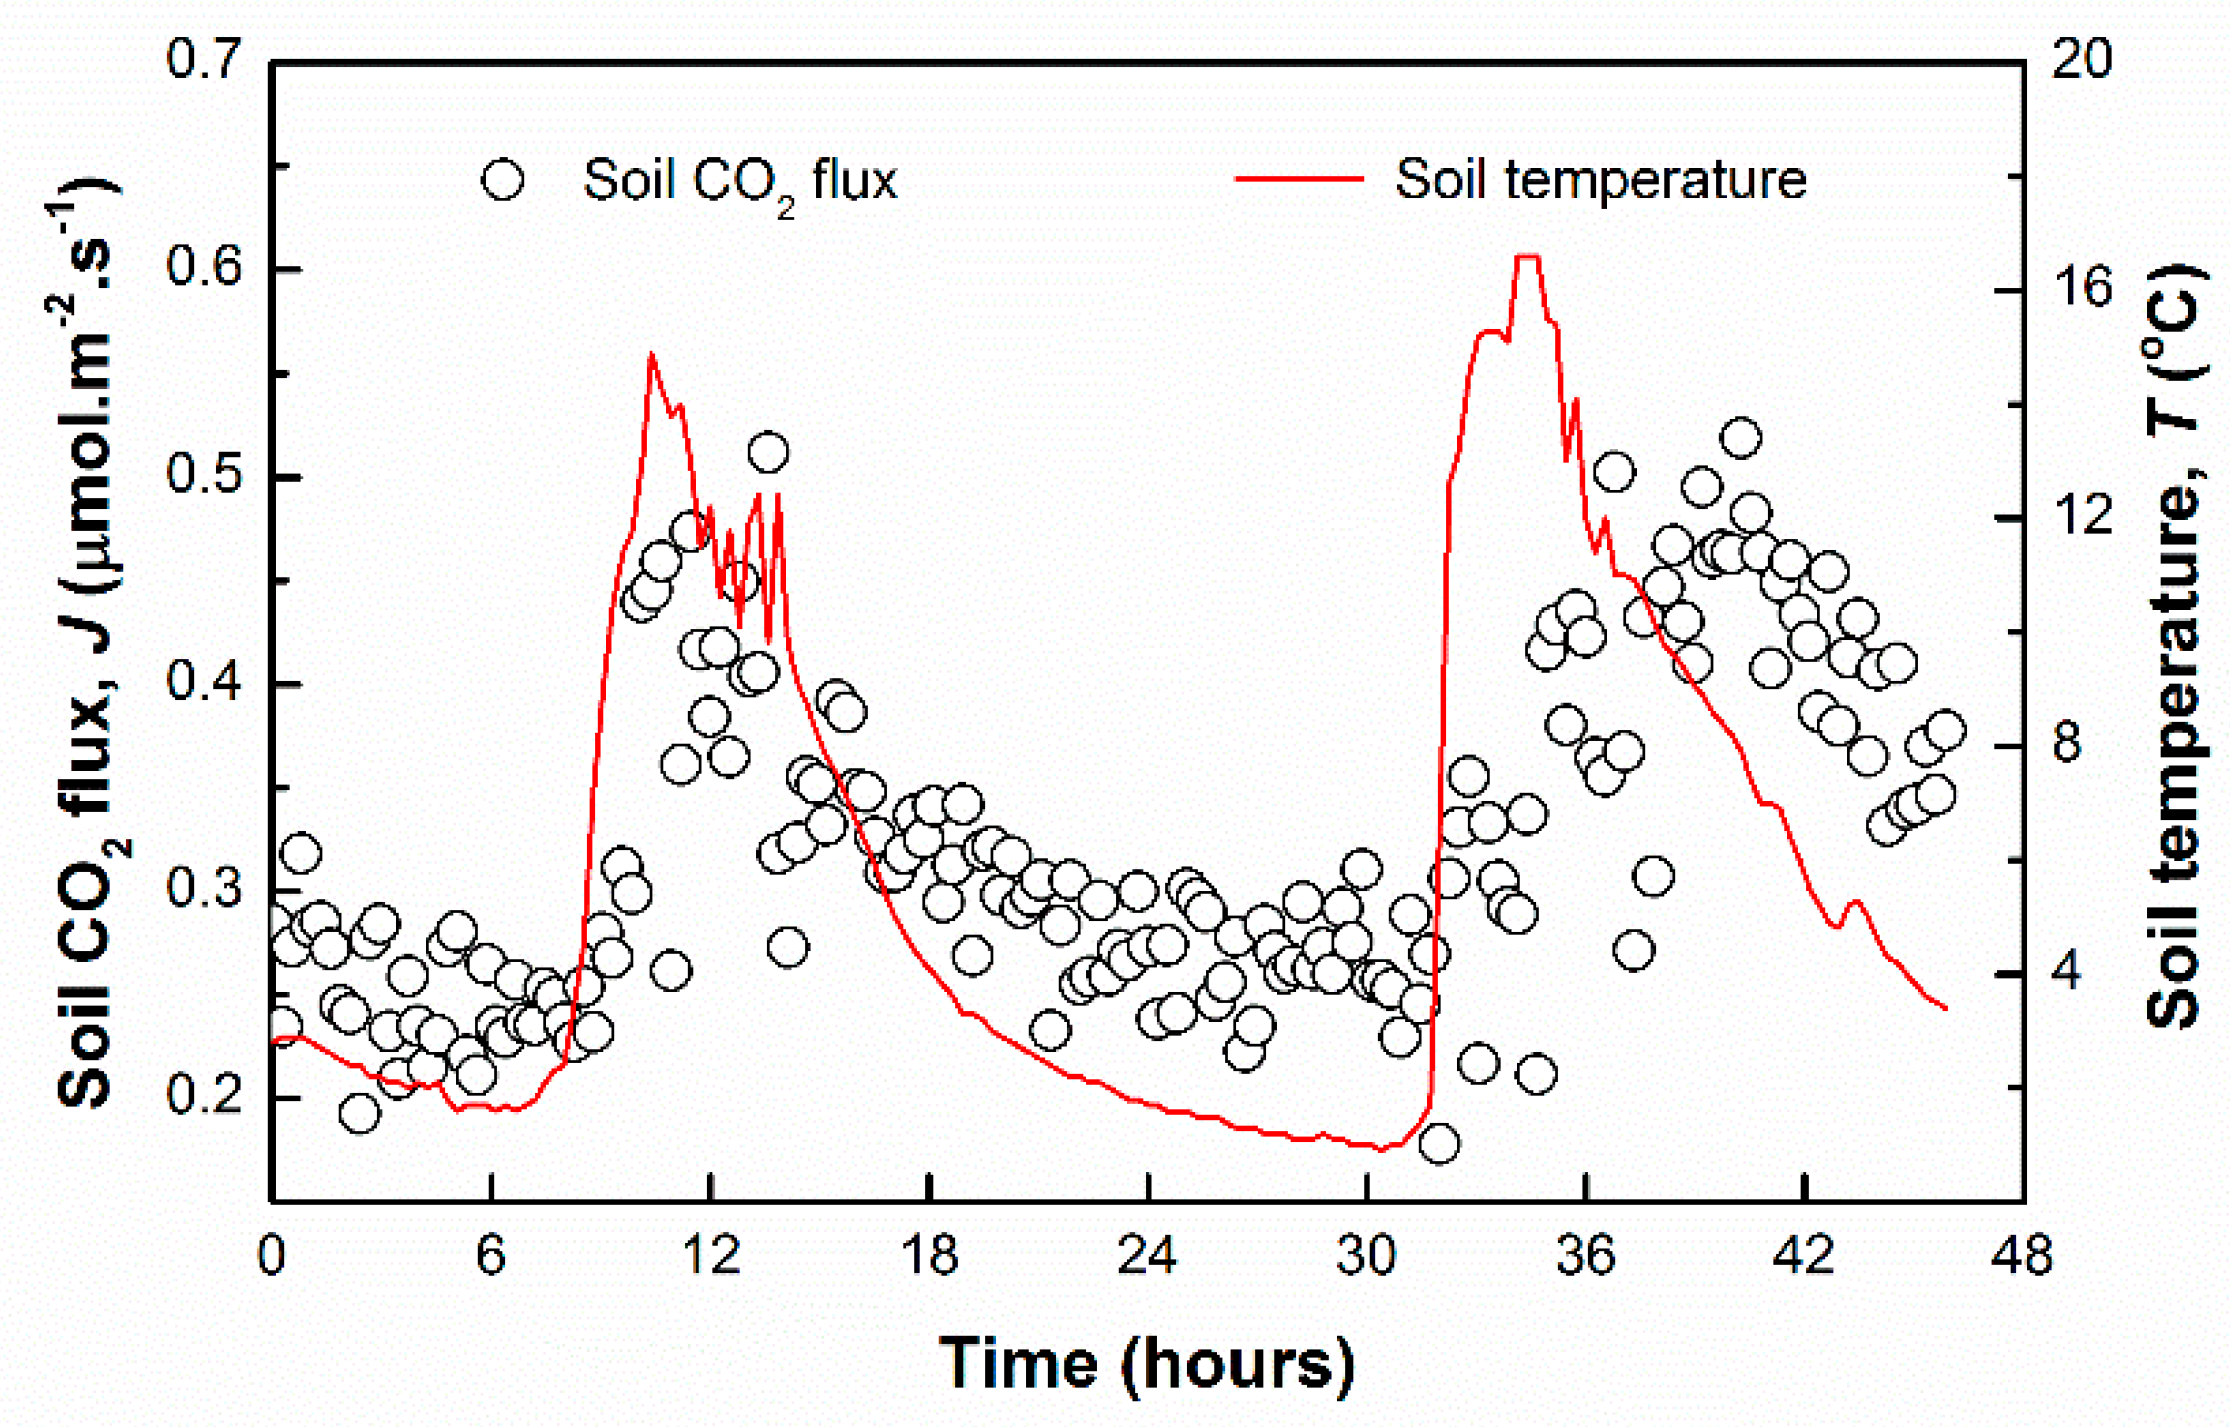
Results from our study indicate a general trend of an increase in soil temperature leading to an increase in soil CO2 flux (Figure 9). Notably, a similar tendency was observed with the vertical fluctuation of soil temperature and soil CO2 flux, indicating a specific correlation between soil temperature and soil CO2 flux. Furthermore, as soil temperature fluctuated ahead of the soil CO2 flux in both increasing and decreasing soil temperature trends, we conclude that CO2 flux from soils was affected by the respiration of plant roots and soil microorganisms. As described by Pavelka [28], CO2 molecules produced by respiration diffuse to the soil surface and are then released into the atmosphere. Therefore, soil temperature is a significant environmental factor that affects CO2 flux from soils.
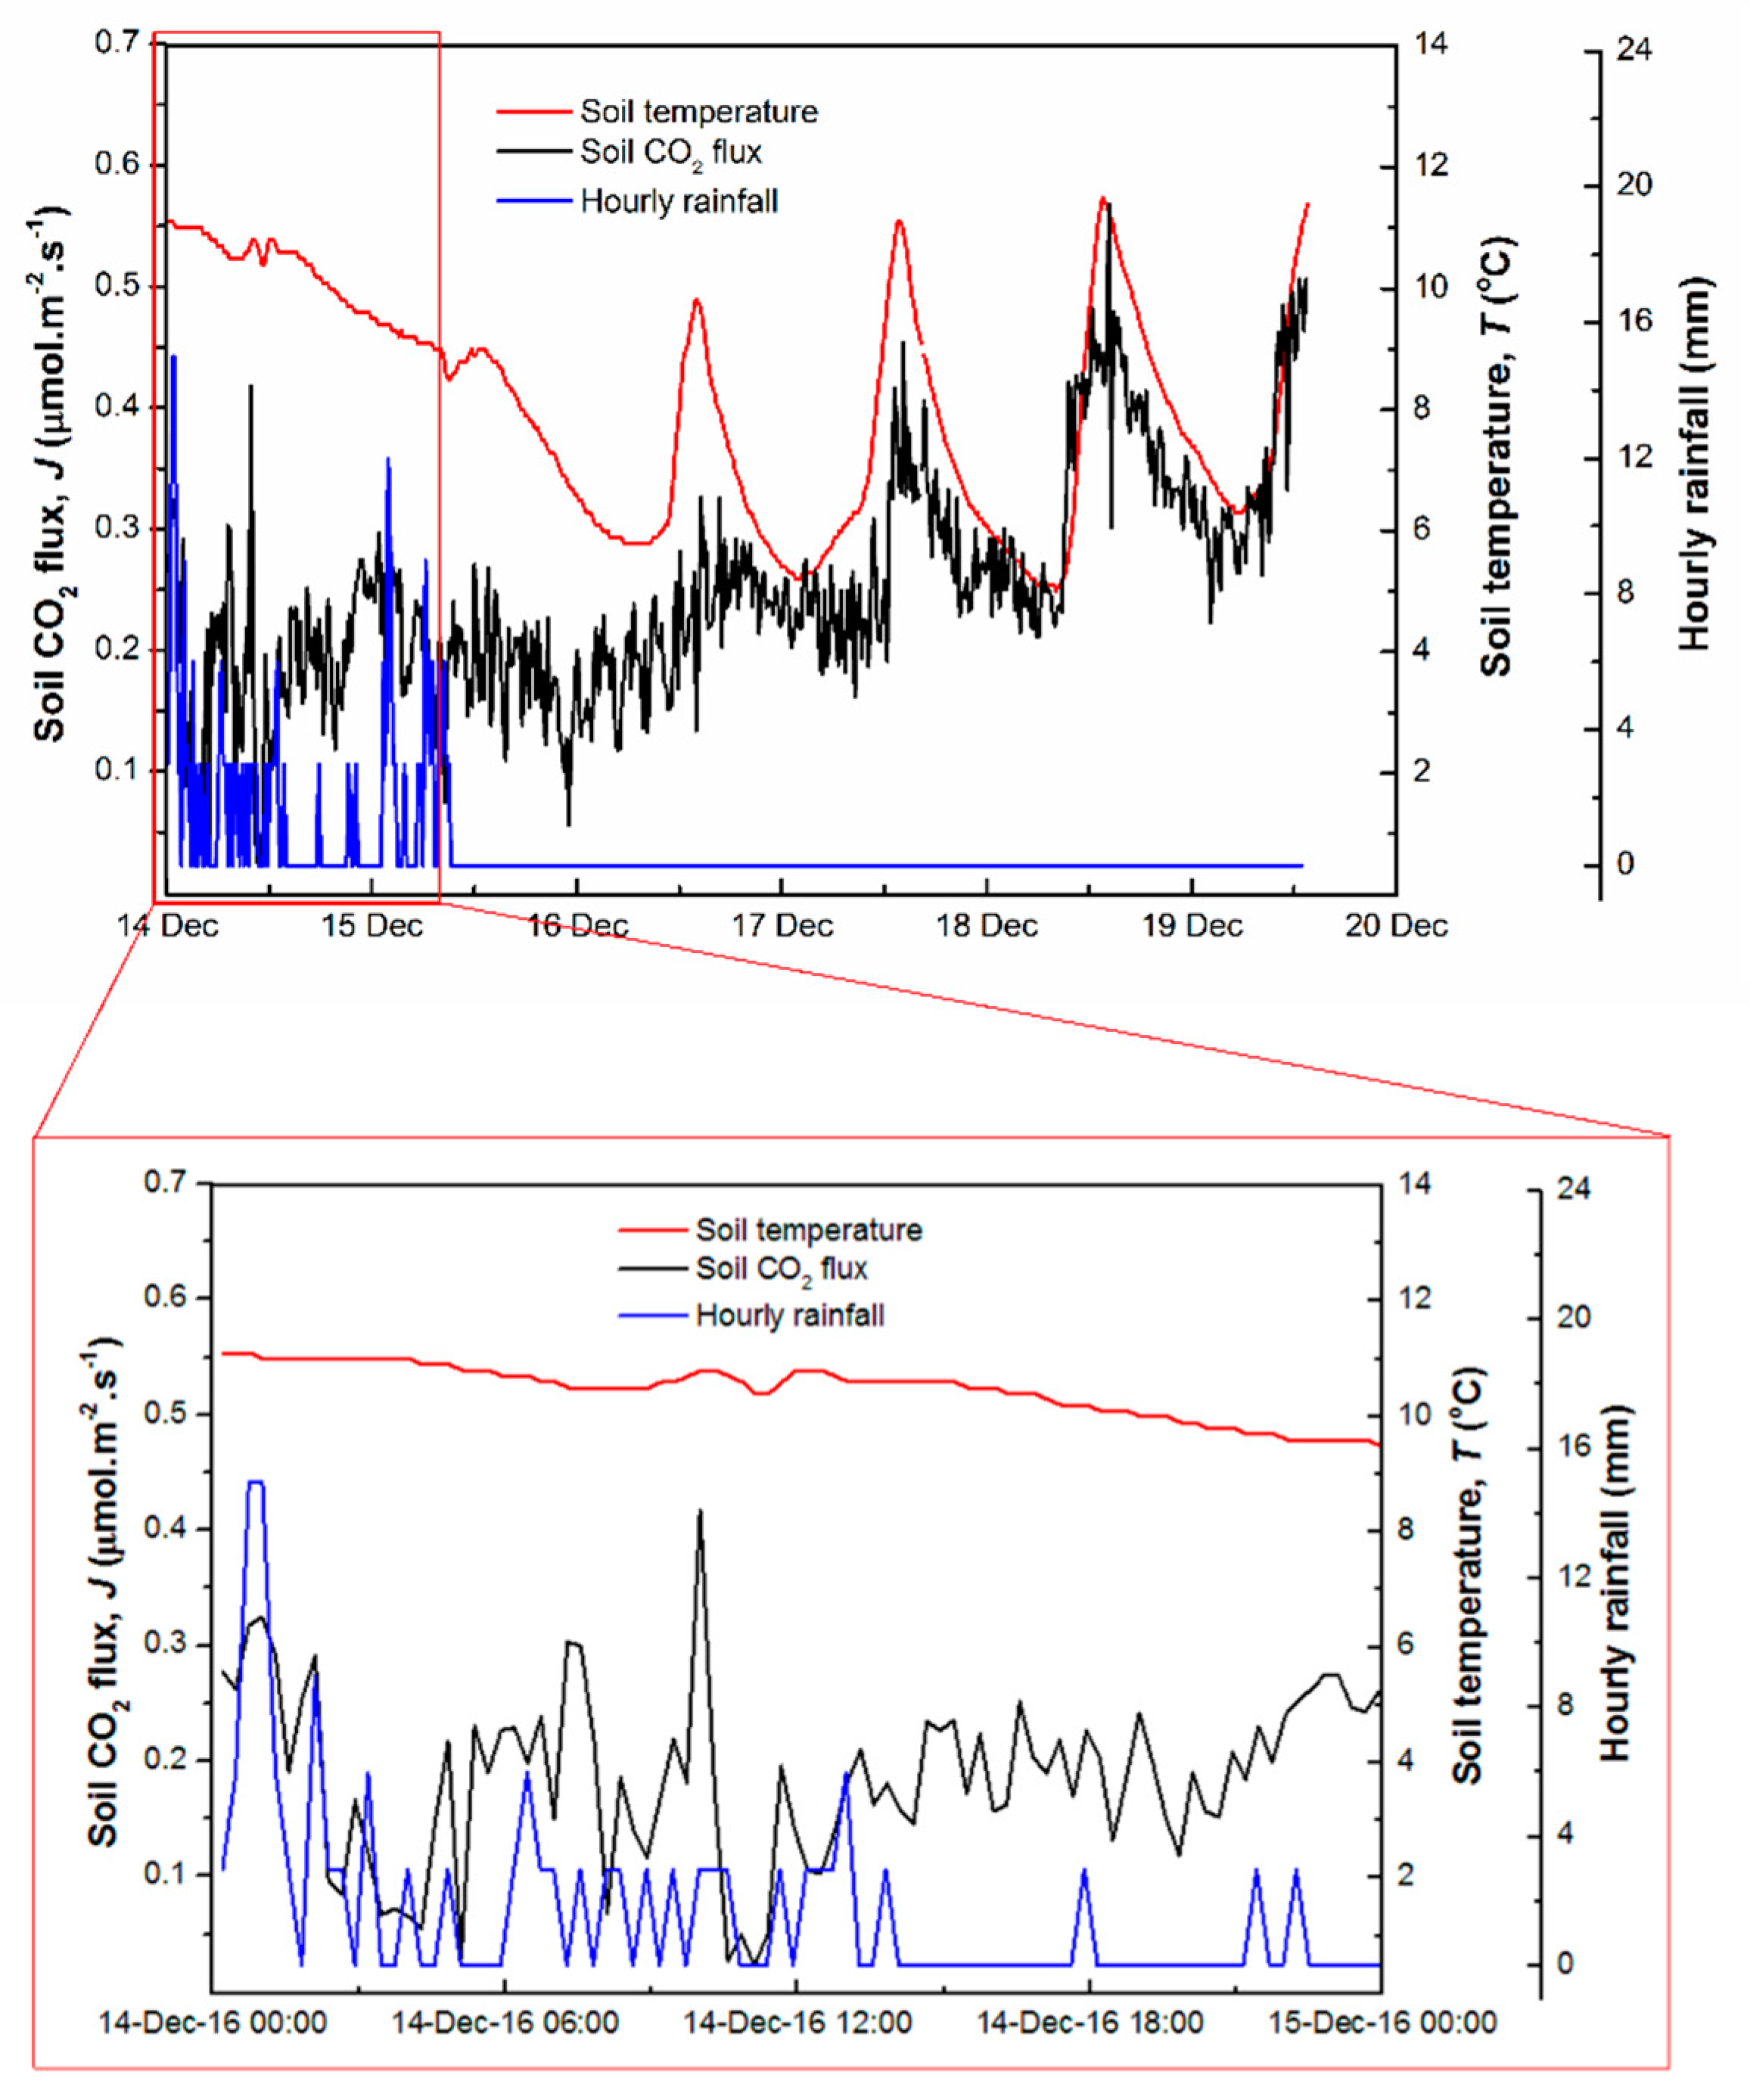
Together with the correlation between soil CO2 flux and soil temperature, we also investigated the effect of precipitation on CO2 flux. (Figure 10). Precipitation was recorded from Dec 14, 2016 (0:00 a.m.) to Dec 15, 2016 (0:00 a.m.), with no rain recorded from Dec 17, 2016 (0:00 a.m.) to Dec 19, 2016 (9:00 a.m.). Our results indicate a high correlation between CO2 flux from soil and soil temperature when precipitation was near zero (from Dec 17, 2016 (9:00 a.m.) to Dec 19, 2016 (9:00 a.m.)). On the other hand, during rainfall periods (from Dec 14, 2016 (0:00 a.m.) to Dec 15, 2016 (0:00 a.m.)), the correlation with soil temperature was unclear. We suggest that under saturated conditions, soil CO2 is partly dissolved by water and stored in the soil pores rather than being emitted to the surface. The amount of soil CO2 flux over rainy days (Dec 14–15) was substantially lower than that over dry days (Dec 17–19) by an average of 0.15 μmol·m−2·s−1. Therefore, we can conclude that precipitation caused a reduction in CO2 flux from soil.
Furthermore, soil CO2 flux levels declined not only on rainy days, but also for several days thereafter. We suggest that this occurred because soil pores were filled with water, leading to a lowering of gas diffusivity. Consequently, CO2 gas does could not diffuse into the atmosphere due to the displacement of CO2-rich soil by rainwater.
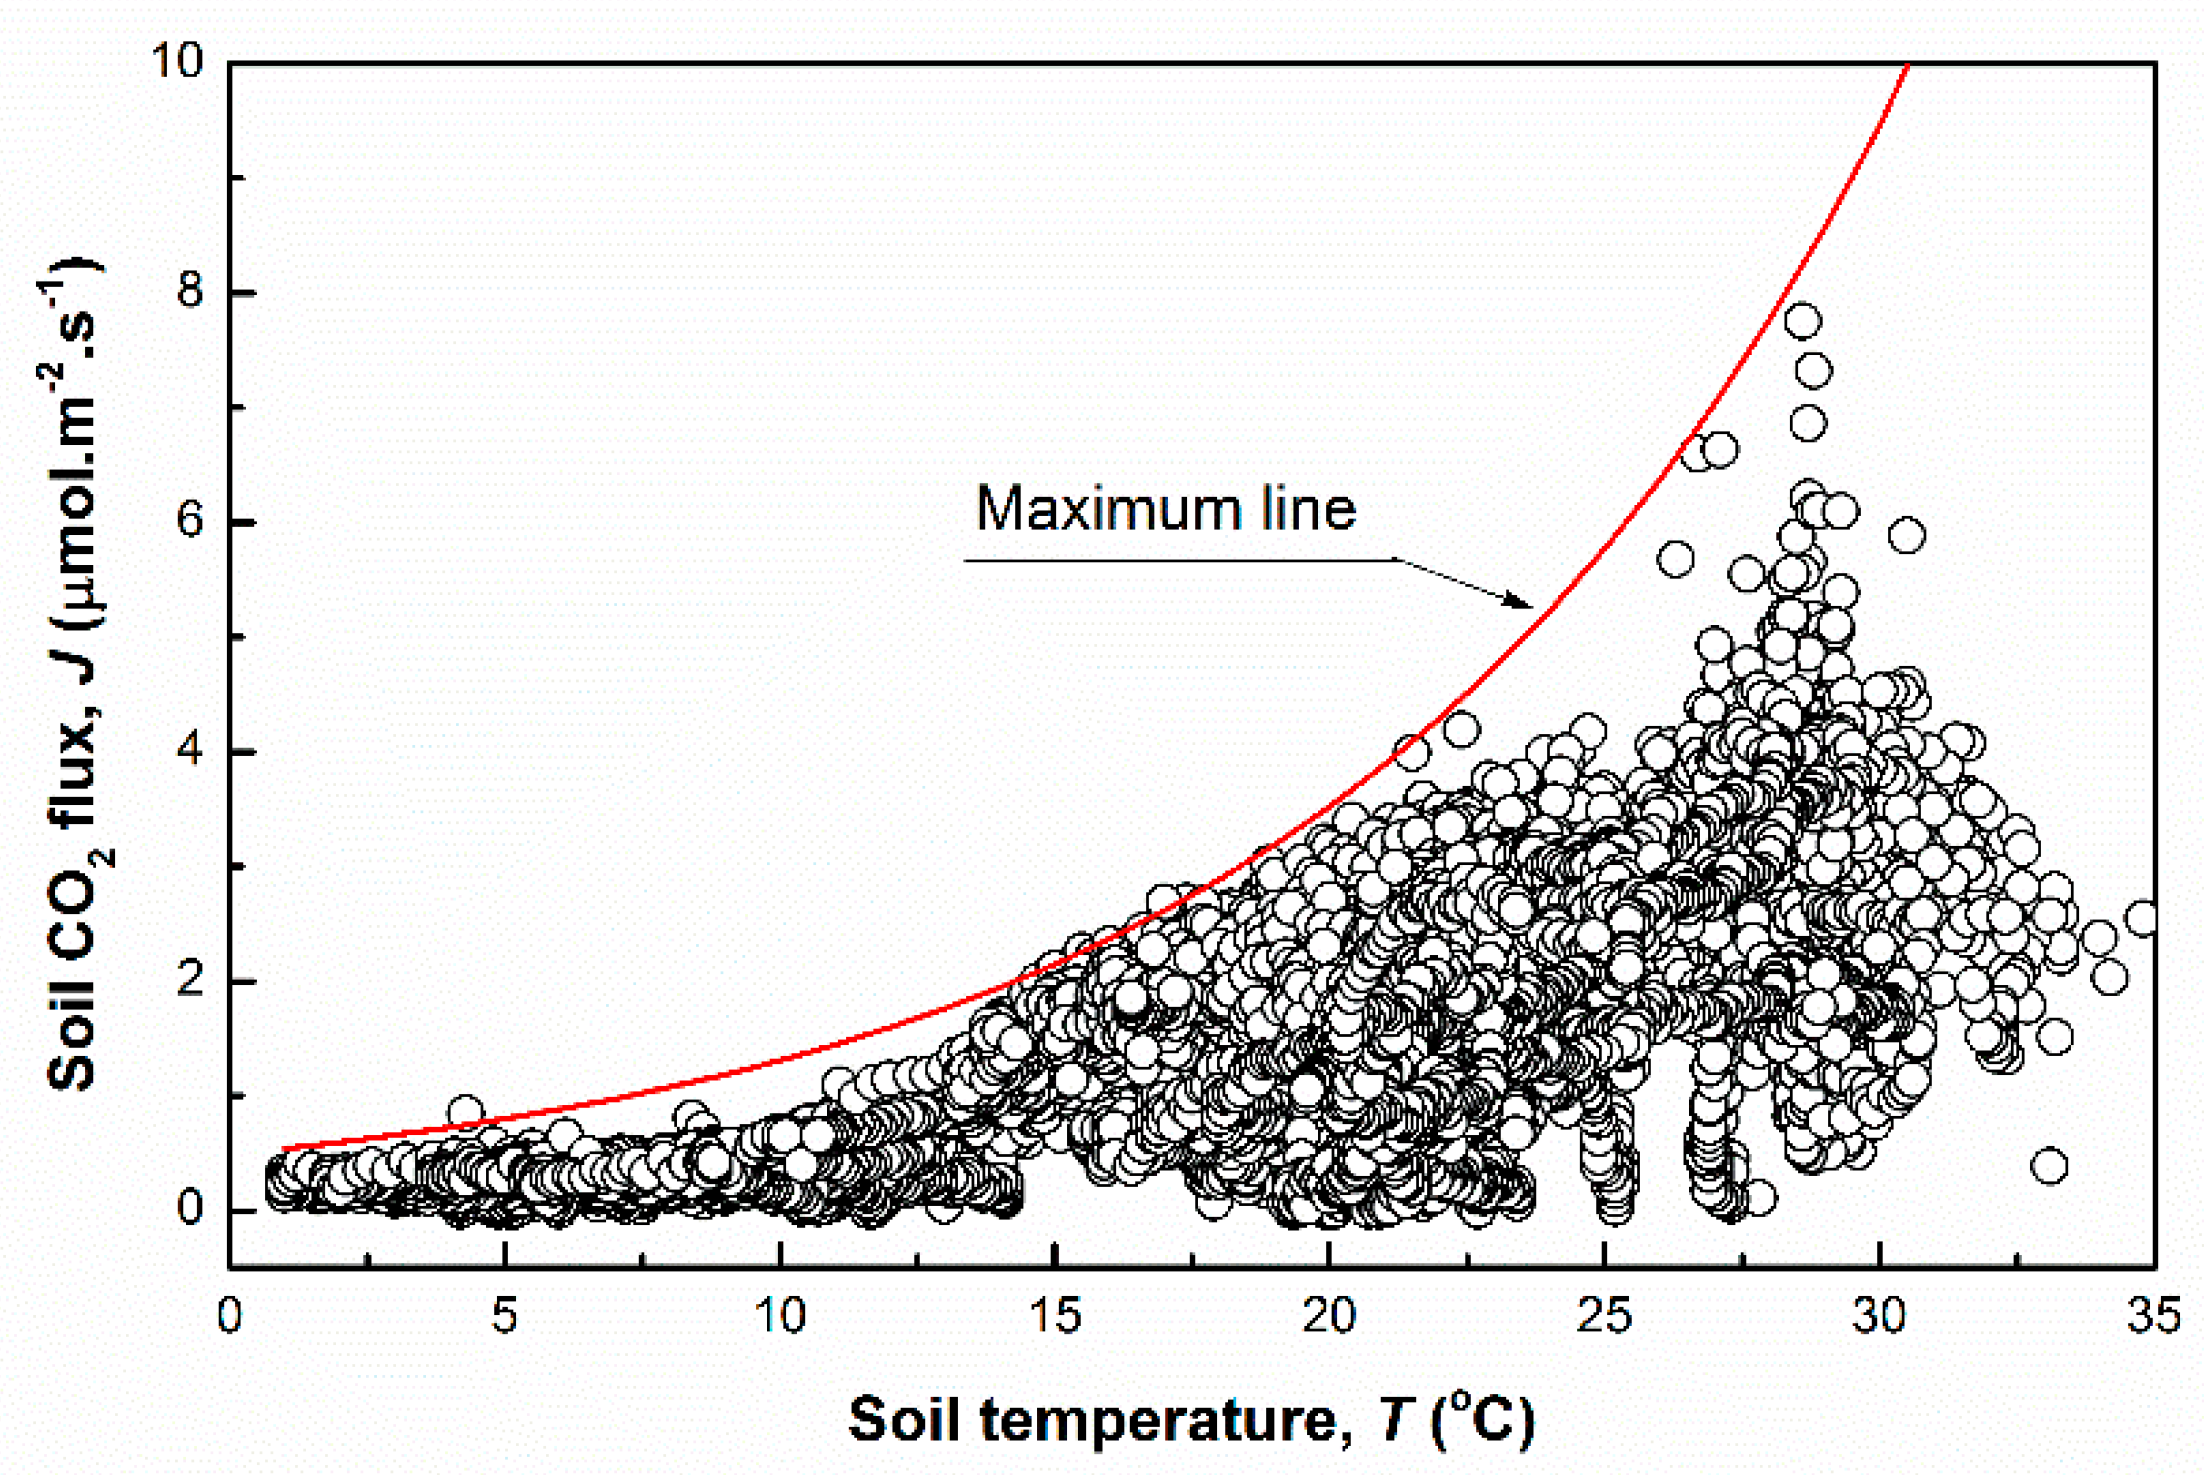
To investigate the relationship between CO2 flux from soils and soil temperature, we collected long-term monitoring data at Location A, from Dec 1, 2016 to Nov 23, 2017 (Figure 11). This figure demonstrates that soil CO2 flux (J) increased exponentially with a rise in soil temperature (T) at a range of 0 to 28 °C, with a peak of 8 μmol·m−2·s−1 (3.8 g·m−2·day−1). However, when soil temperatures were above 28 °C, soil CO2 flux decreased, specifically by 75% at 35 °C. This phenomenon can be explained by a long period of high soil temperatures (above 28 °C) with no rain for approximately two weeks in August, which resulted in a decrease in the activities of CO2-producing soil microbes. Davidson used the same method with us, he reported that the natural soil CO2 flux range from 1 to 30 g CO2·m−2·day−1 at a depth of 1 to 100 m [29]. In our study, soil CO2 flux was up to 8 μmol·m−2·s−1 or 3.8 g·m−2·day−1 at a depth of 7 cm.
Our results are consistent with those of Allison [30] that indicate that a warming soil could reduce carbon-use efficiency and reduce carbon decomposition by microbes, thereby limiting the production of CO2. Furthermore, Tang [19] indicates root and microorganism activity to be typically low under dry conditions, resulting in a low soil CO2 flux.
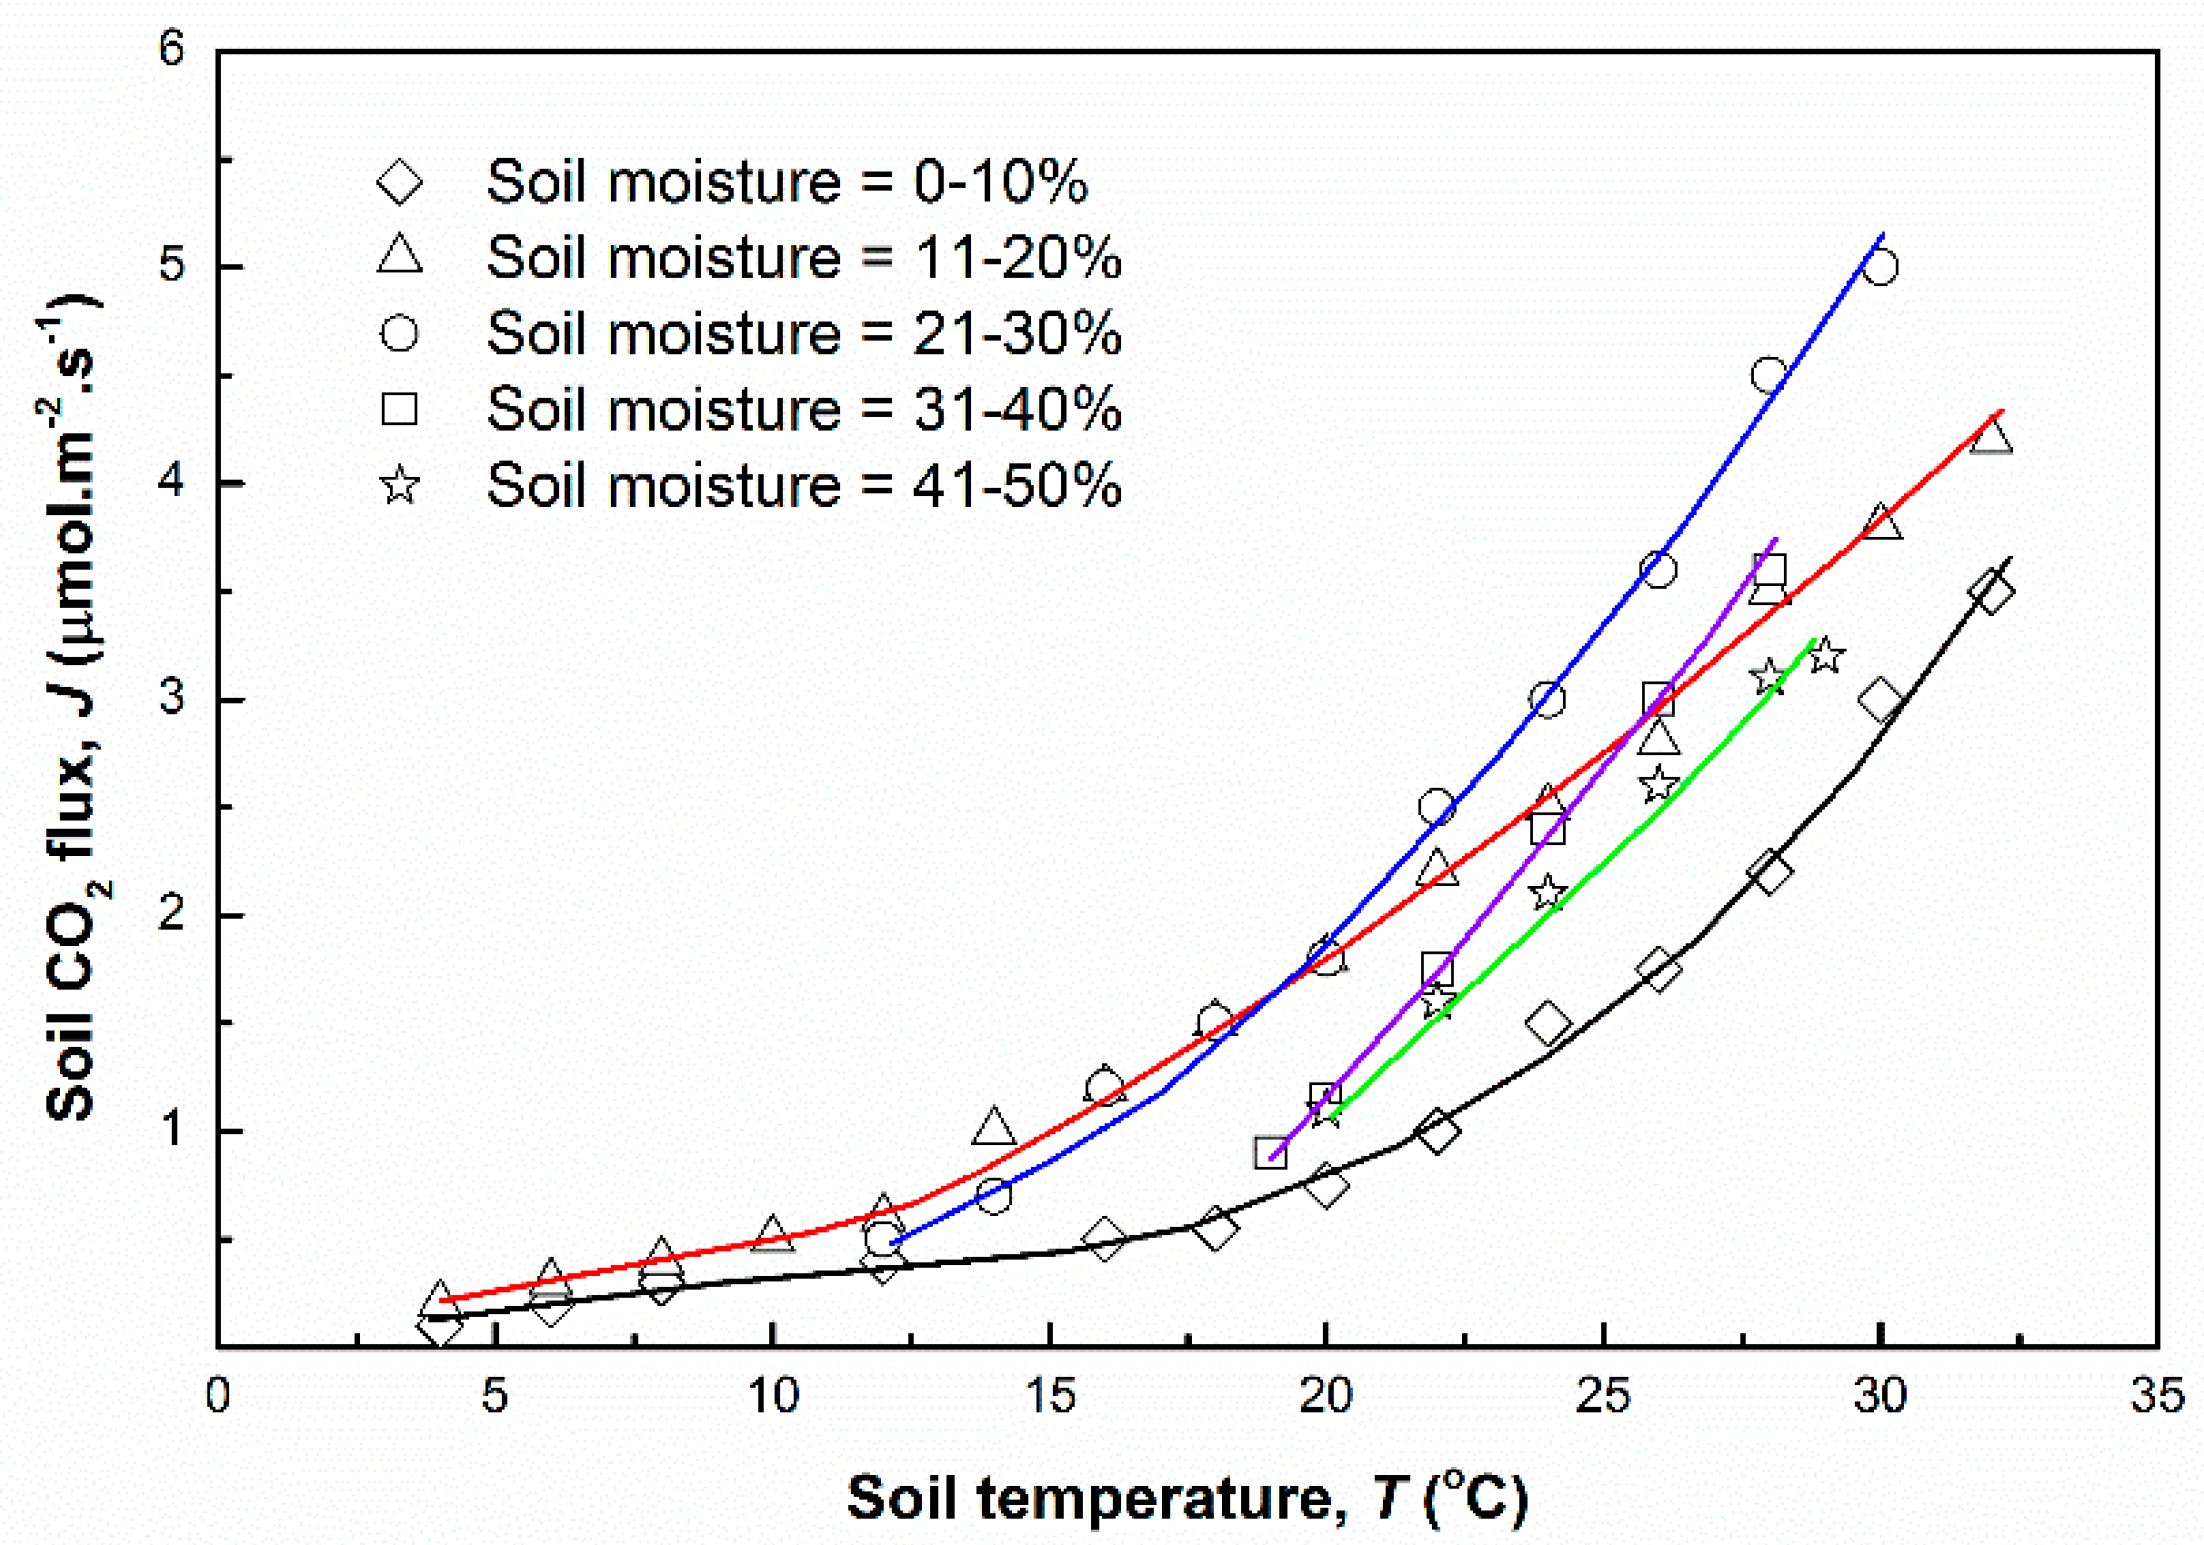
As a result, soil CO2 flux increased with soil moisture at a soil moisture range of 0 to 30%, but substantially decreased at soil moisture levels of above 30% (Figure 12). This, again, highlights the reduction in CO2 flux from soils at high moisture levels due to soil pores filling with water and consequently, lowering gas diffusivity from the soil to the atmosphere. Although an increase in soil moisture generally increases bio-activity in the soil, under very high soil moisture conditions, total soil CO2 flux is reduced due to the limited diffusion of oxygen and subsequent reduction in CO2 emissions [20].
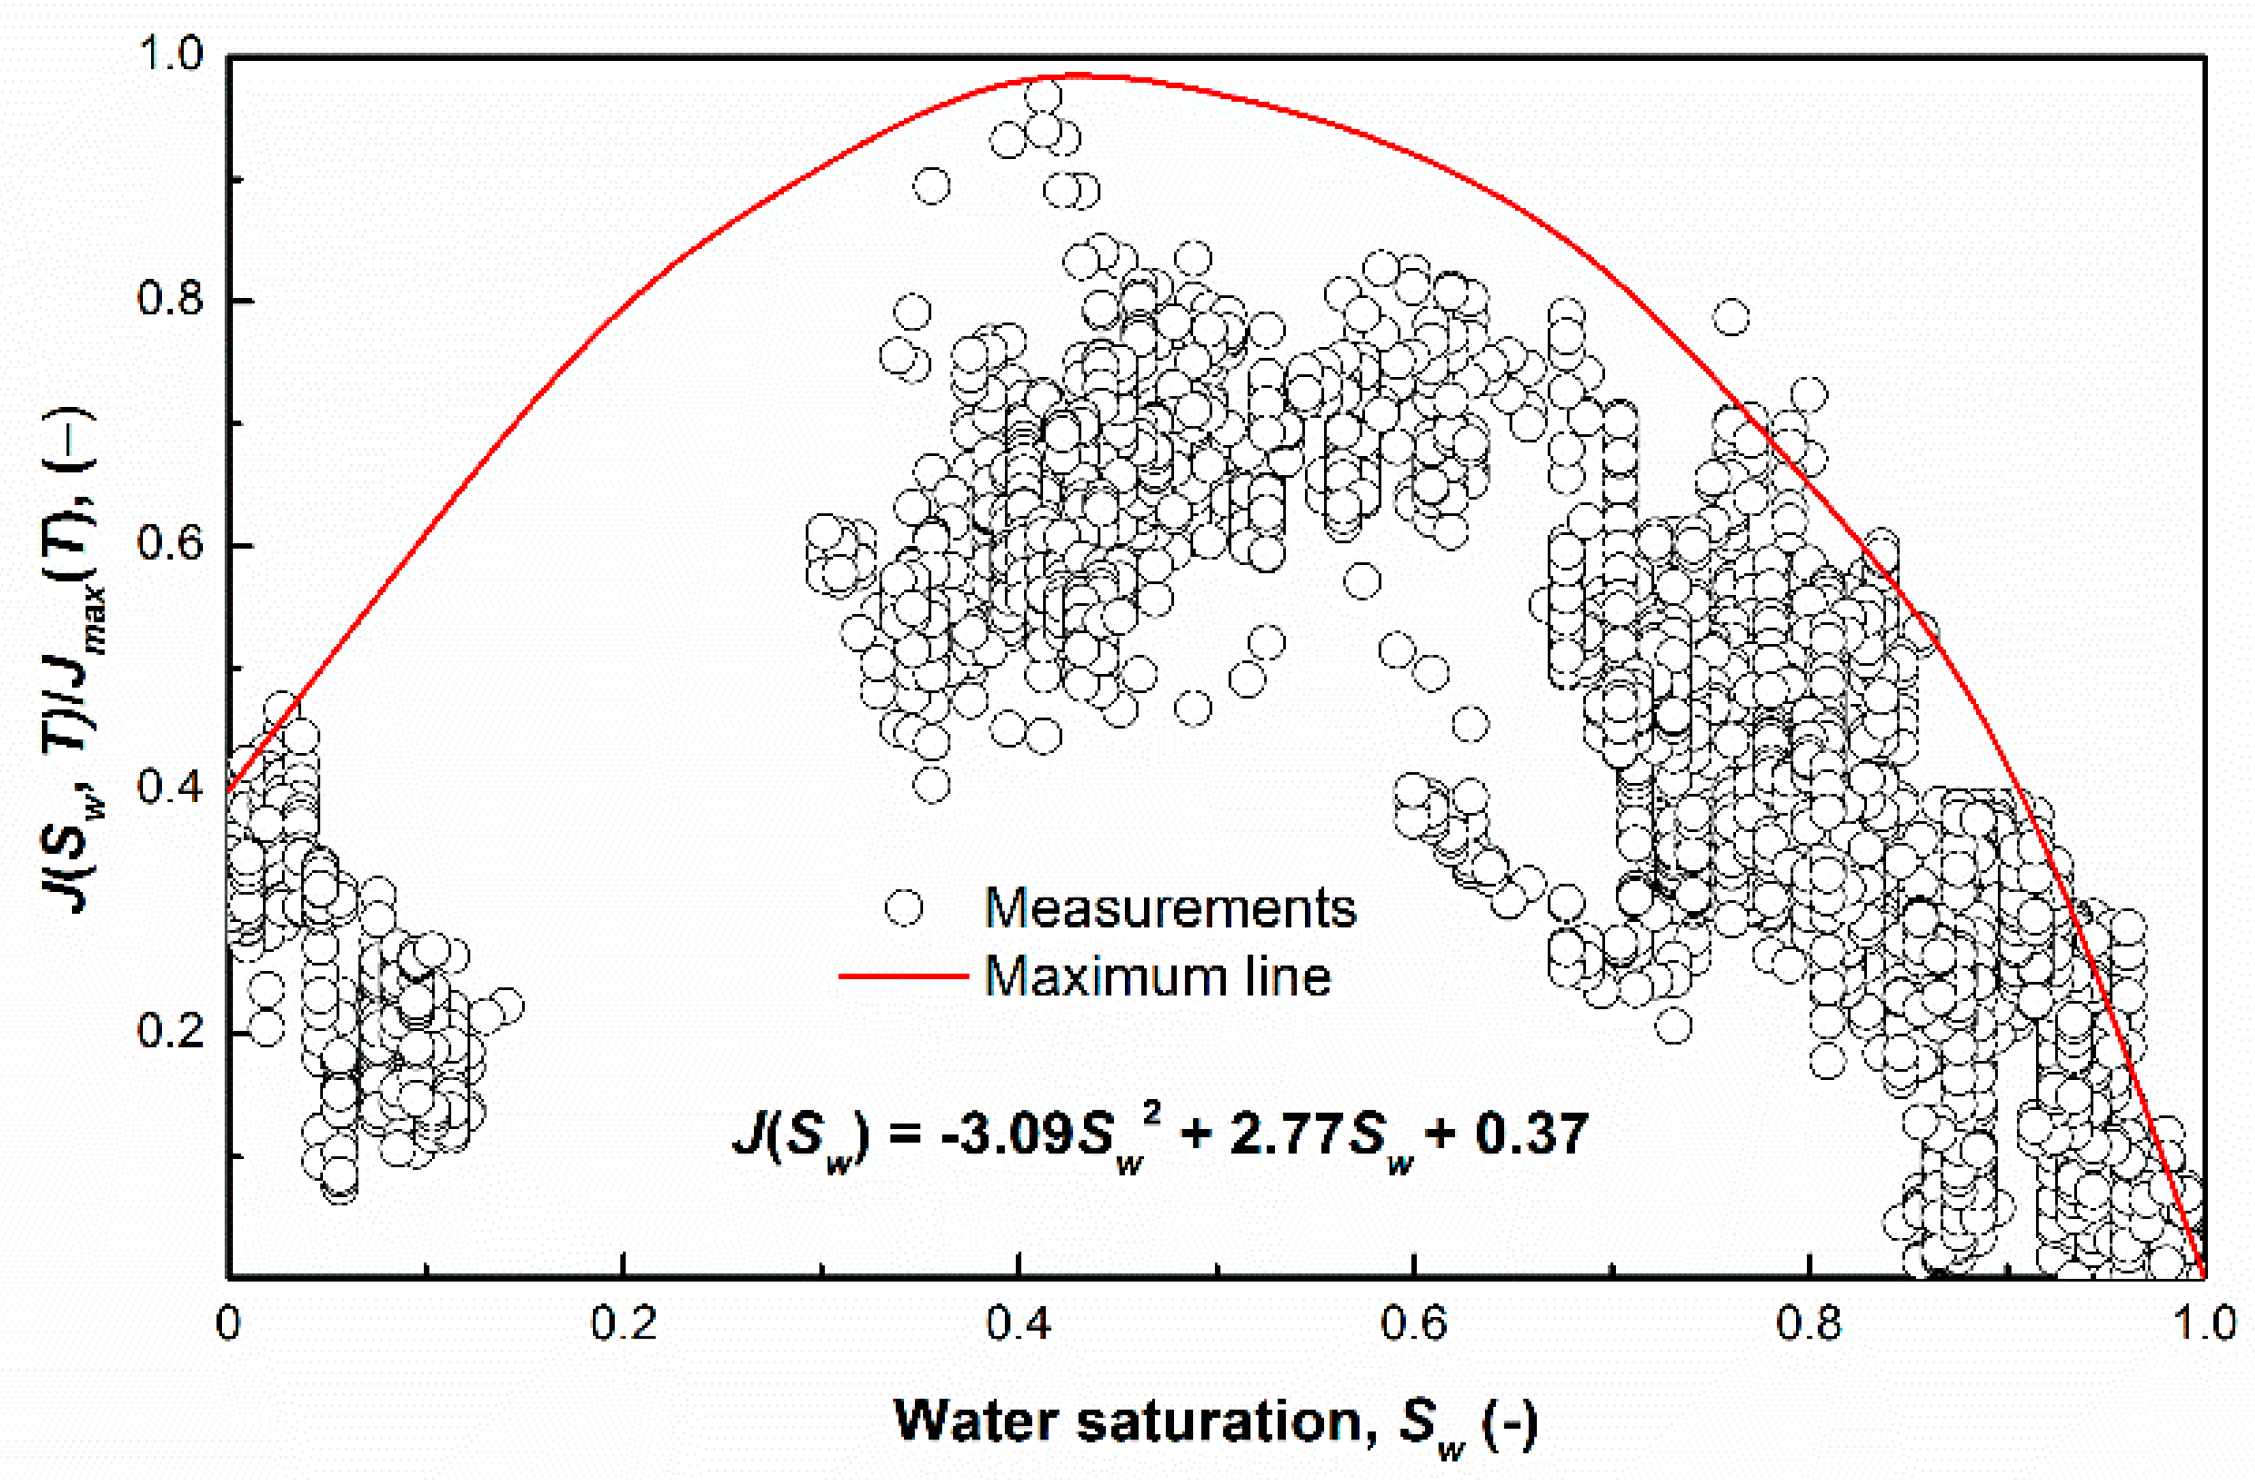
Results from soil CO2 flux data across various water saturation levels at Location A show the reduction in soil CO2 flux not only during rain hours, but also for a specific post-rain period (Figure 10). This indicates that CO2 flux was directly affected by precipitation. More specifically, precipitation firstly increased the water saturation in soil porosity and secondly, increased the soil moisture content. Furthermore, our results indicate that the CO2 flux reached a peak at Sw = 0.4 (Figure 13). Several studies have presented a similar quadratic correlation between soil CO2 flux and soil water content, with soil CO2 flux reaching a peak at a certain soil water level [24,31].
Under conditions where Sw > 0.4, the exchange of CO2 and oxygen molecules via gaseous diffusion is reduced due to reduced porosity in the soil [32]. In addition, the diffusion of CO2 in the soil matrix is limited due to pores being filled with water [33].
The correlation between soil CO2 flux and water saturation is expressed in Equation (10).
However, under low water saturation levels (Sw < 0.4), CO2 gas generated by decomposing carbon from roots and plants is accelerated by moisture under sufficient oxygen molecules diffused from the surface. Overall, it can be concluded that when Sw = 0.4, soil CO2 flux (J) reaches a peak by satisfying oxygen diffusion and enhancing carbon decomposition by microorganisms in the soil. Therefore, both extreme dry and wet conditions result in reduced CO2 gas flux from the soil to the surface.
3.3. Soil CO2 Flux at Different Locations
To investigate the influence of different soil characteristics and environmental factors on soil CO2 flux, we compared data collected from three study locations, namely Location A (Dec 1, 2016 to Nov 26, 2017), B (Nov 1 to Dec 19, 2018), and C (Oct 25 to Nov 1, 2018).
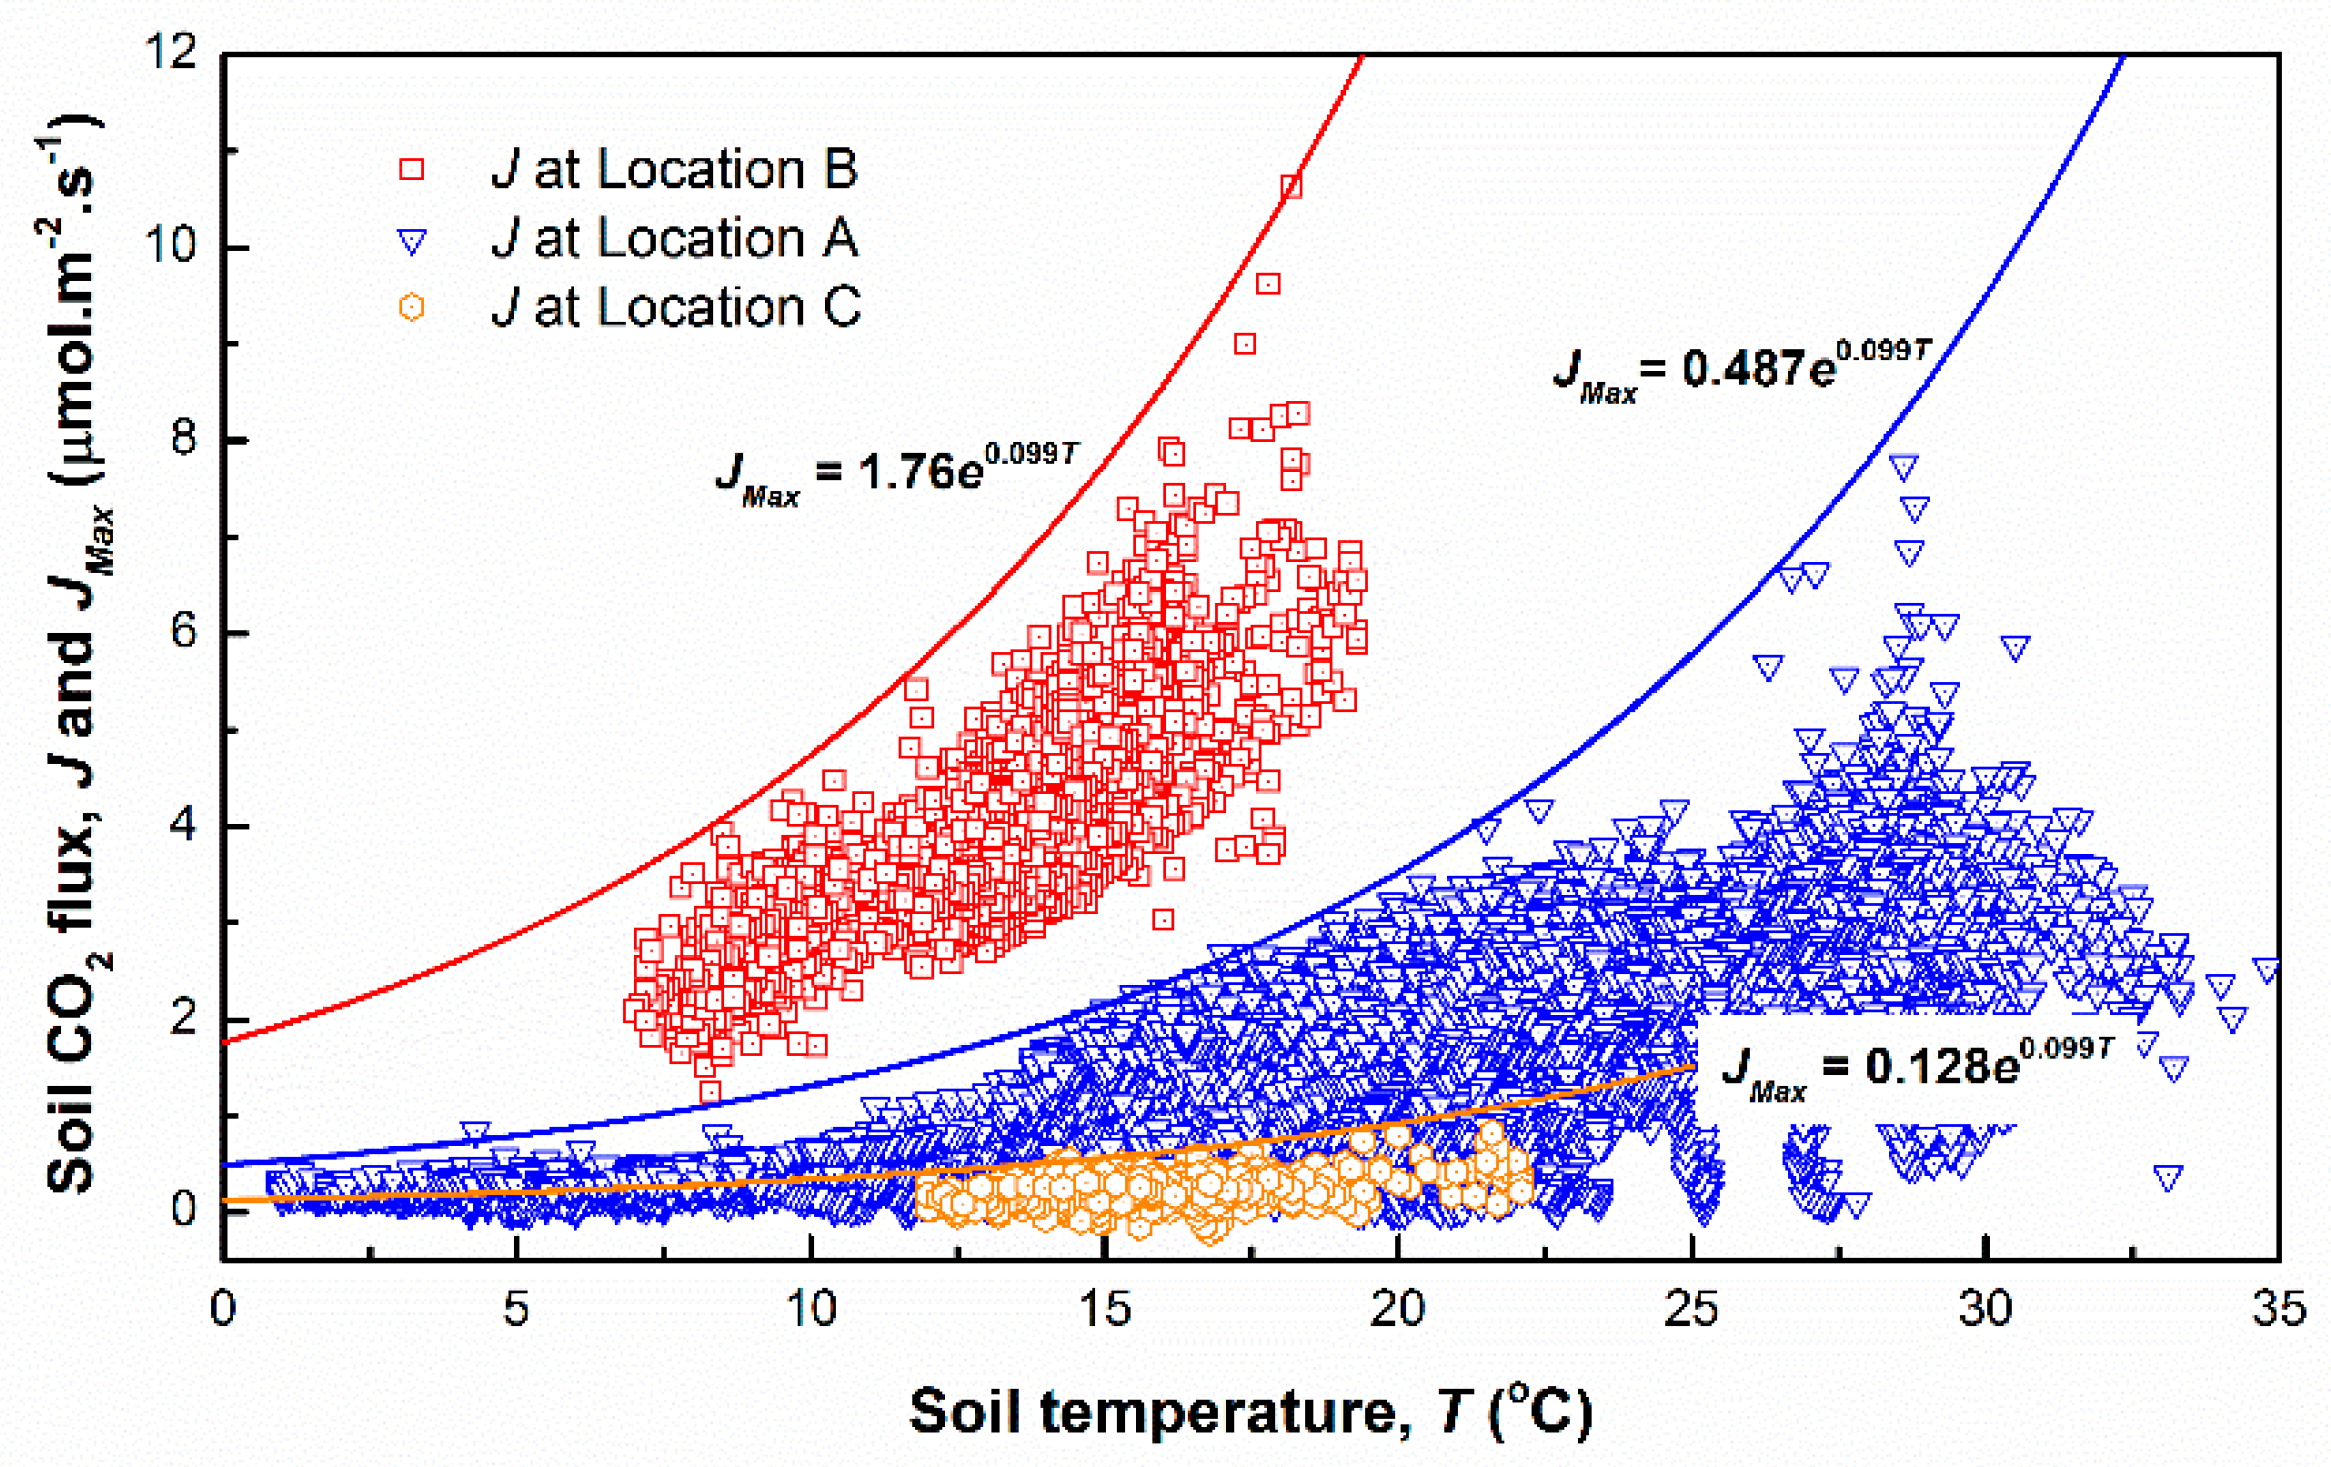
Data on the relationship between soil CO2 flux and soil temperature at the three study locations indicate that the soil CO2 flux at Location A increased exponentially with increasing soil temperature (Figure 14). A similar trend was also recorded at Location B with a substantially higher amount of soil CO2 flux than at Location A. On the contrary, only a minimal amount of the soil CO2 flux was recorded at Location C.
Based on the results from Figure 14, the following three equations were obtained:
where JMax (μmol·m−2·s−1) is the soil CO2 flux from the soil surface, and T (°C) represents soil temperature.
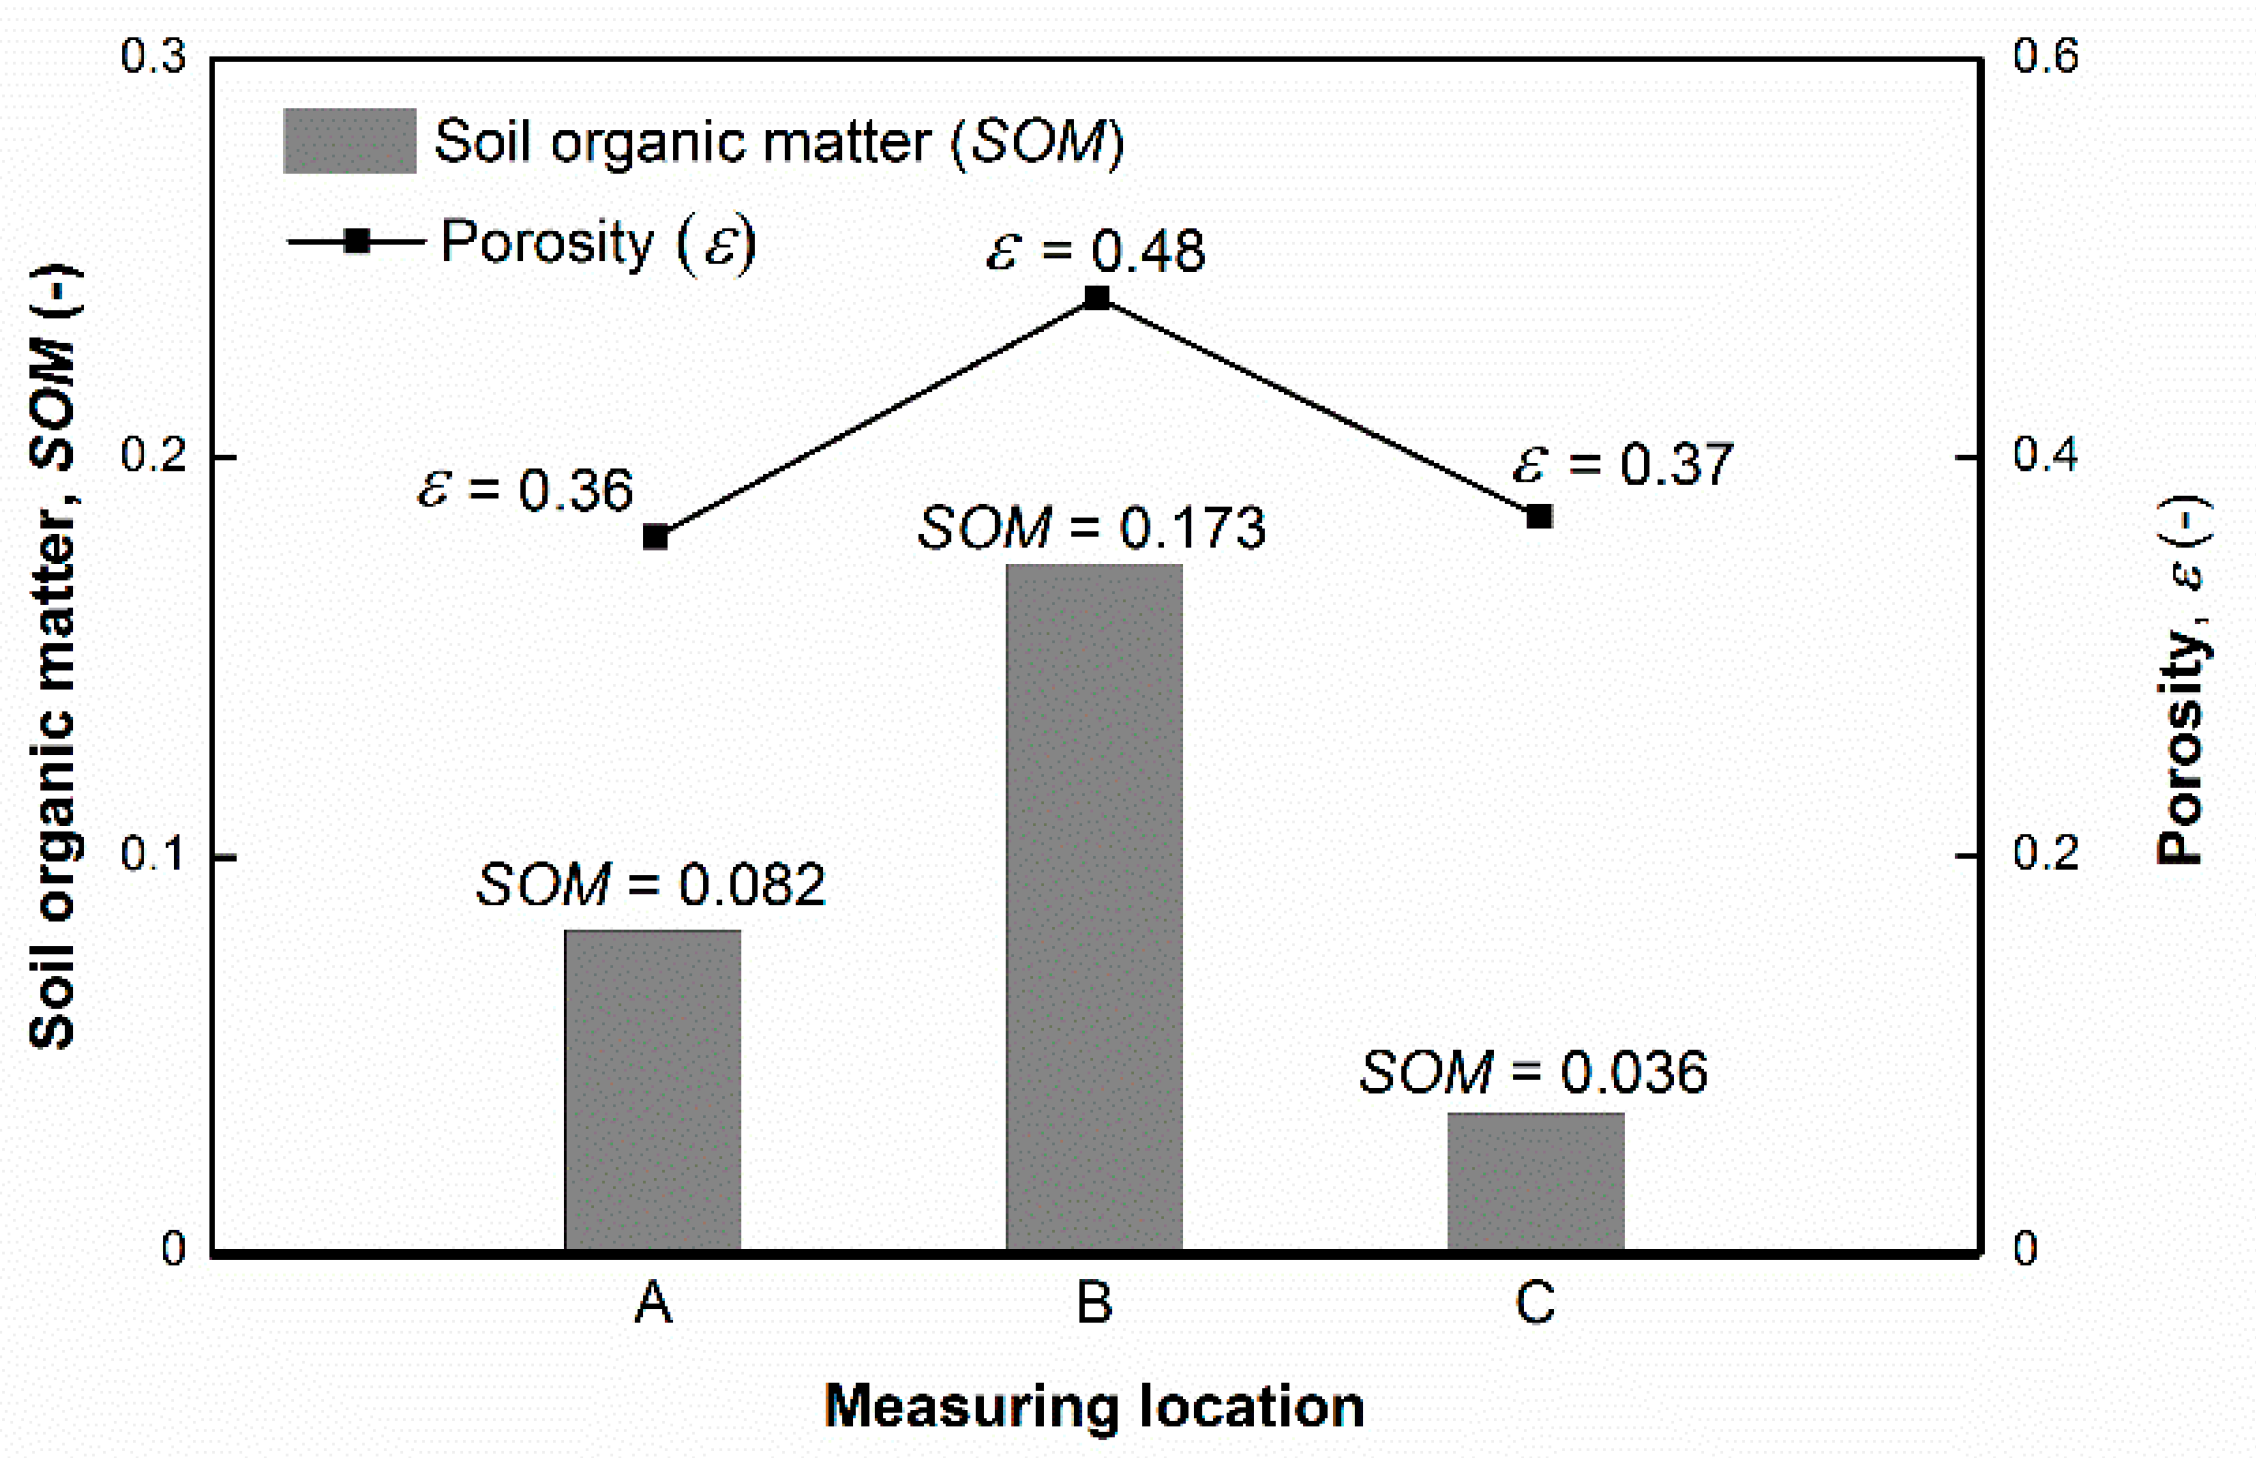
To investigate the difference in soil CO2 flux between the three study area locations, porosity and SOM were examined as characteristics related to soil CO2 flux (Figure 15). Our results indicate that Location B, covered with living grasses, had the highest SOM value of 0.173, while a SOM of 0.082 was measured at Location A, and the lowest SOM value of 0.036 was measured at Location C, which was covered with pebbles.
Furthermore, the larger the SOM, the larger the fluctuation range of soil CO2 flux at the same soil temperature. For example, at a temperature of 16 °C, the soil CO2 flux ranged from 0.910 to 2.583 μmol·m−2·s−1 and from 3.833 to 6.695 μmol·m−2·s−1 at Locations A and B, respectively, while less than 0.311 μmol·m−2·s−1 at Location C (Figure 14). Overall, soil CO2 flux was significantly affected by the SOM of each soil location and the presence of plant roots and microorganisms.
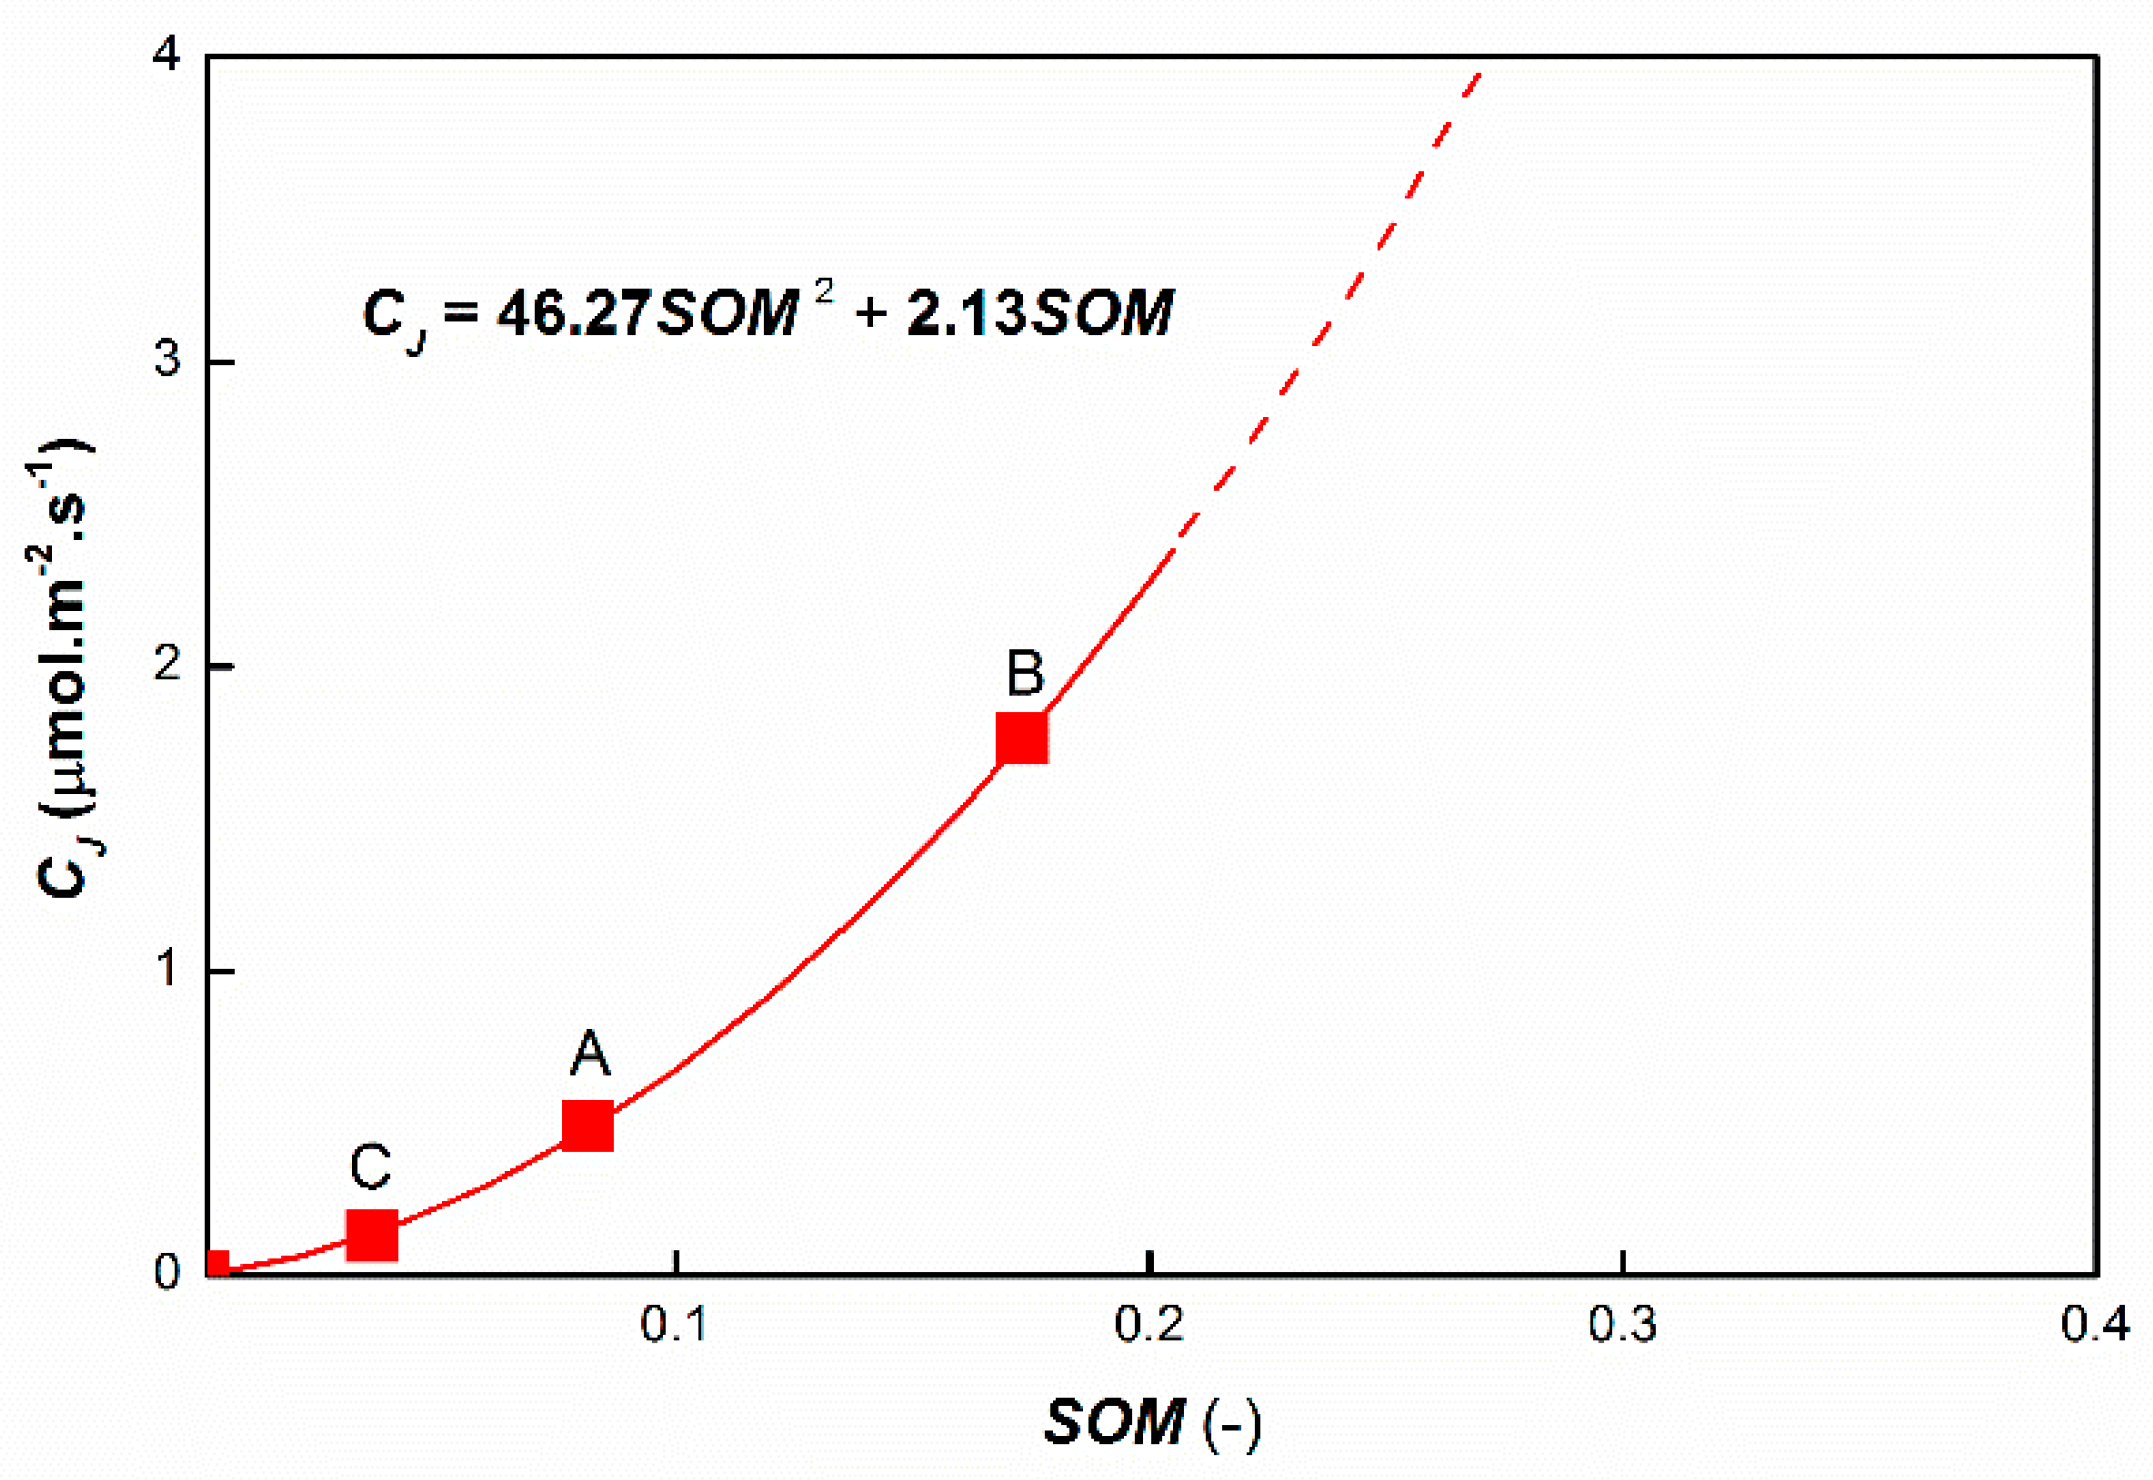
Soil CO2 flux measurements at 0 °C (CJ) across different SOM values indicate that soil CO2 flux increased exponentially with an increase in SOM (Figure 16). For example, the soil CO2 flux was 0.128 μmol·m−2·s−1 at a SOM of 0.036 at Location C, but showed an approximately four-fold increase at Location A and an almost fourteen-fold increase at Location B with values of 0.082 and 0.173, respectively. Overall, the larger the amount of SOM in the soil, the larger the soil CO2 flux.
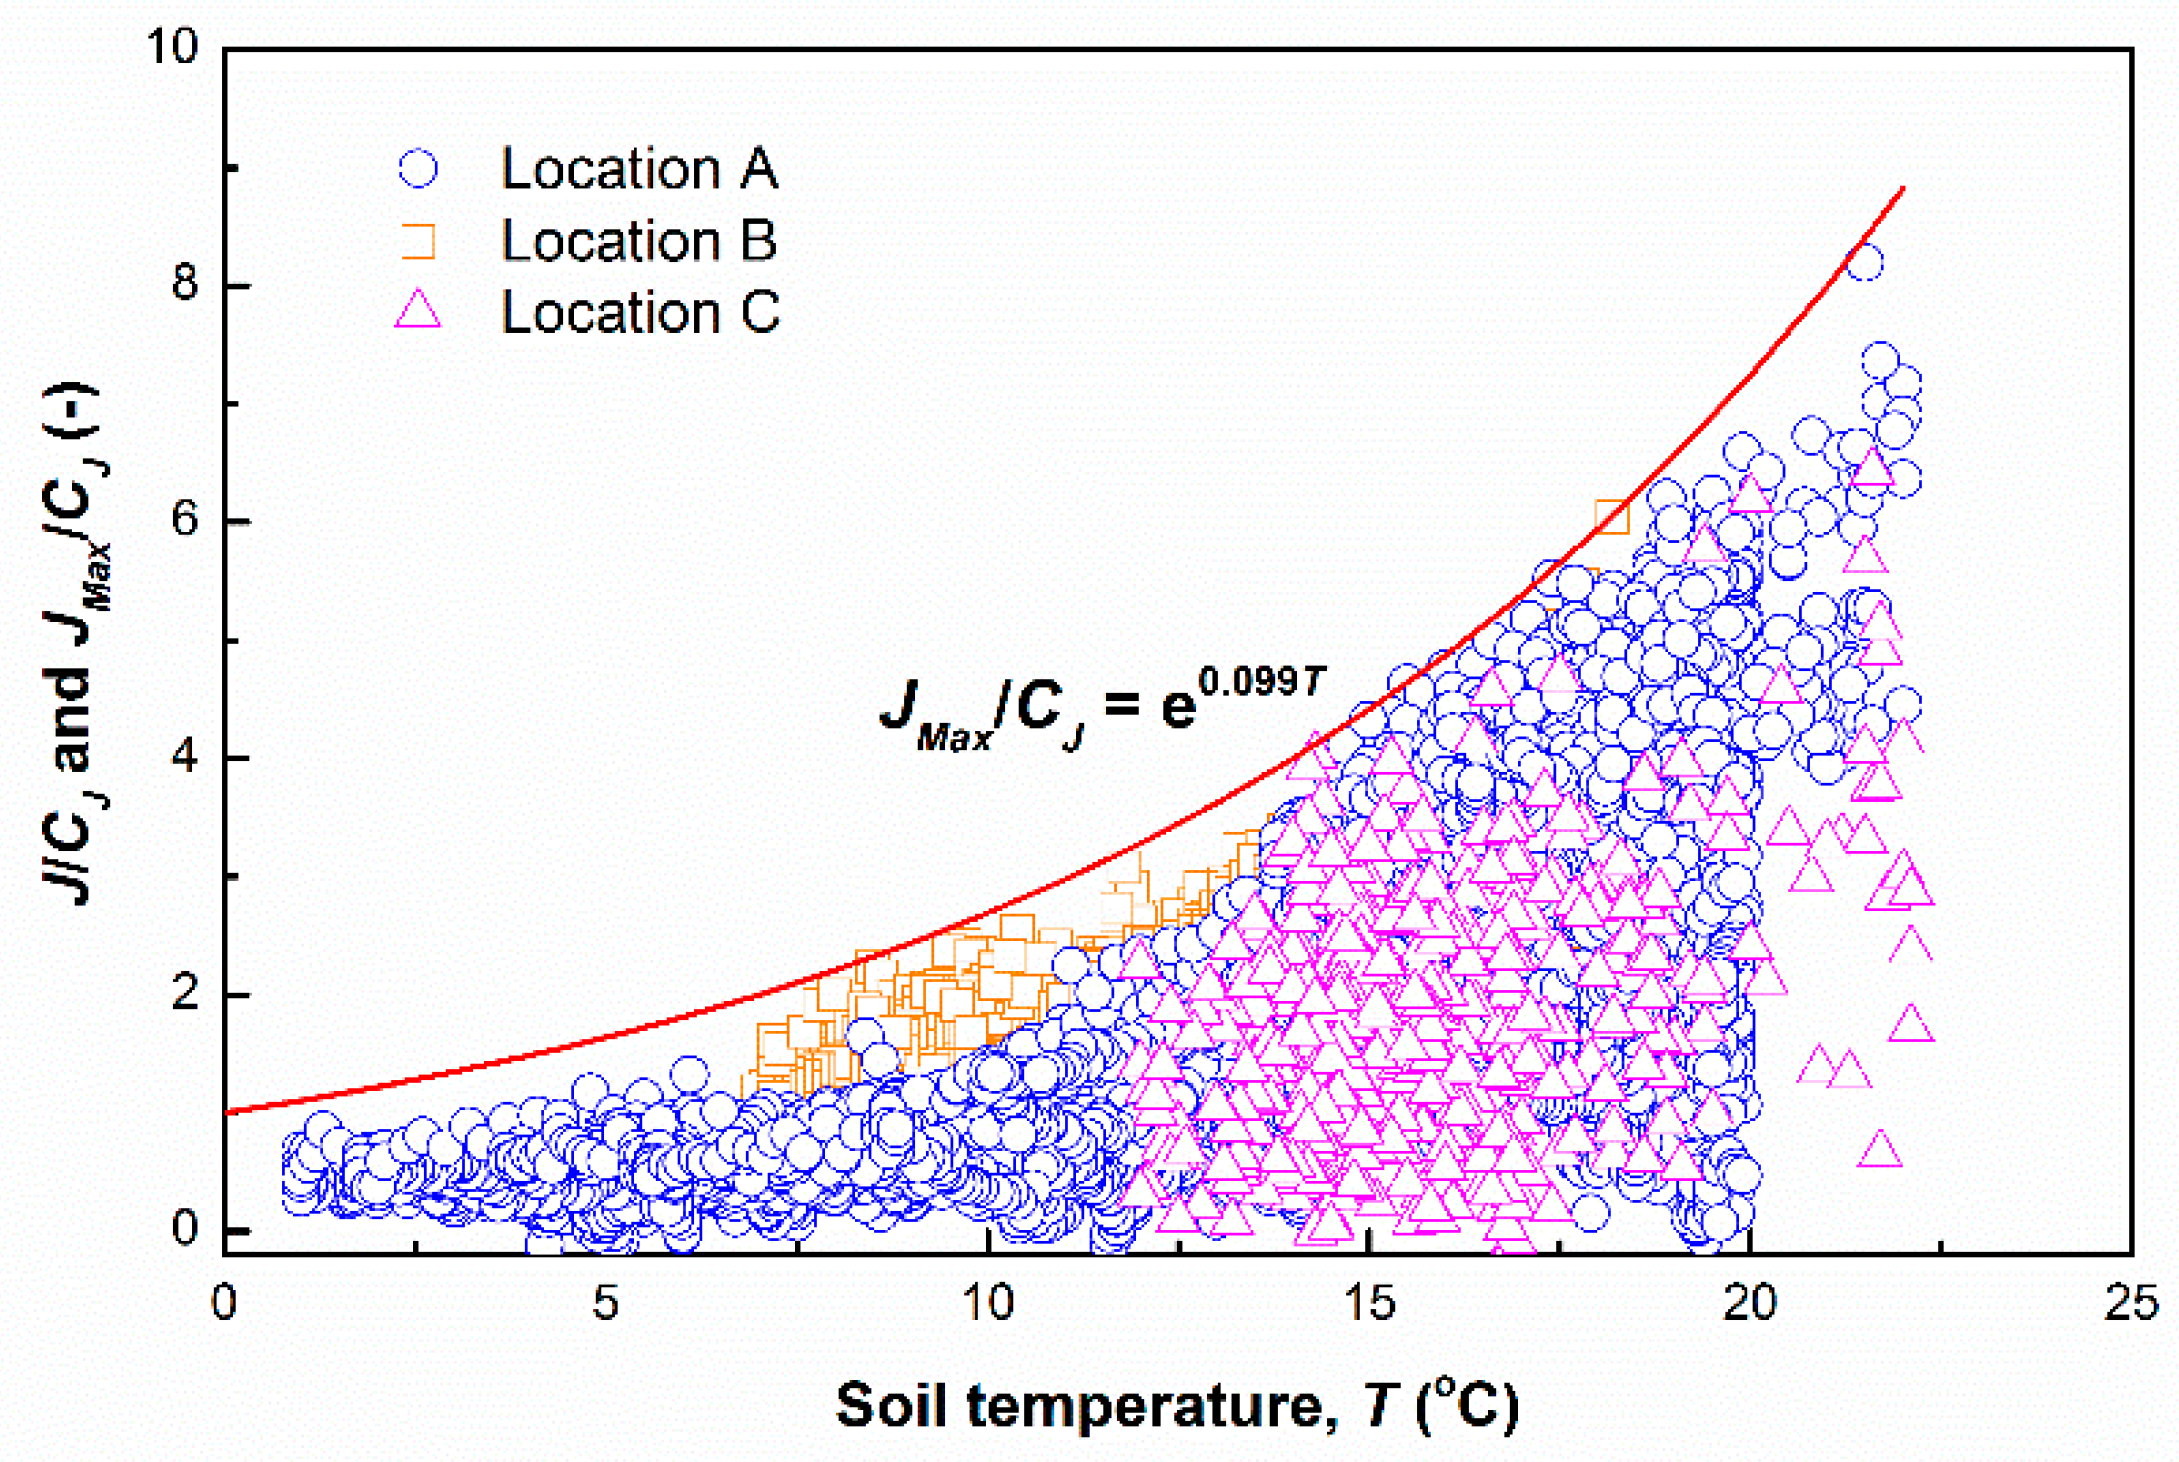
The correlation between soil CO2 flux and related factors can be expressed by the following equation:
where CJ is correlation coefficient related to SOM, Cs is the correlation coefficient related to water saturation, T represents soil temperature, β is the attenuation of soil CO2 flux, and β = 0.099 for all measuring locations.
The relationship between CJ and SOM can be demonstrated by Equation (15).
while the relationship between Cs and Sw is expressed in Equation (16).
Based on Equations (14)–(16), the following comprehensive equation was developed, which includes soil temperature, water saturation, and SOM:
This equation represents the maximum baseline for soil CO2 flux (JMax), determined from the data collected at the INAS test field site (Figure 17). This data can be used to identify CO2 gas leakages from CCS onshore sites. The threshold line represents the soil CO2 flux across different soil temperatures under normal conditions for the INAS field site. Hence, a CO2 flux value above the limit determined from the threshold line indicates that a CO2 leakage has occurred through natural fractures or tectonic faults and wide-range monitoring should be implemented to localize leakage areas on the soil surface.
4. Conclusions
Our investigations and field measurements at the INAS test field, Kyushu University (Japan) have been carried out. To summarize our results, we highlight the following significant points:
The threshold line for geologic CO2 storage site is estimated and expressed by the following equation:
Soil CO2 flux is tightly correlated to soil temperature, soil water, and SOM. Therefore, these parameters must be considered before setting out the alert condition at CO2 storage sites.
The threshold line can be used for the early detection of CO2 leakage from the CO2 storage sites based on the proposed equation for the INAS field. Once abnormal CO2 flux from soil surface is detected, it is necessary to take remedial action in the case that leakage occurs.
We suggest that future work focuses on the construction of a robust and reliable soil CO2 flux monitoring system using an independent power supply such as solar or wind energy. By using this system, soil CO2 flux can be monitored at all sites, regardless of local conditions.
Author Contributions
Conceptualization, K.S., P.Q.H. and T.K.; methodology, K.S. and S.S.; validation, K.S., S.S. and P.Q.H.; formal analysis, T.K.; investigation, T.K.; resources, T.K.; data curation, P.Q.H.; writing—original draft preparation, P.Q.H.; writing—review and editing, K.S., P.Q.H.; visualization, P.Q.H.; supervision, K.S.; funding acquisition, K.S. All authors have read and agreed to the published version of the manuscript.
Funding
This research was partly funded by JSPS KAKENHI, grant number 20H02684.
Conflicts of Interest
The authors declare no conflict of interest.
References
- IPCC. Summary for Policymakers. In Global Warming of 1.5 °C. An IPCC Special Report on the Impacts of Global Warming of 1.5 °C above Pre-industrial Levels and Related Global Greenhouse Gas Emission Pathways, in the Context of Strengthening the Global Response to the Threat of Climate Change, Sustainable Development, and Efforts to Eradicate Poverty; Pörtner, H.O., Roberts, D., Skea, J., Shukla, P.R., Pirani, A., Moufouma-Okia, W., Péan, C., Pidcock, R., Connors, S., Matthews, J.B.R., et al., Eds.; World Meteorological Organization: Geneva, Switzerland, 2018; 32p, Available online: https://www.ipcc.ch/sr15/chapter/spm/ (accessed on 26 March 2021).
- Leung, D.Y.C.; Caramanna, G.; Maroto-Valer, M.M. An overview of current status of carbon dioxide capture and storage technologies. Renew. Sustain. Energy Rev. 2014, 39, 426–443. [Google Scholar] [CrossRef] [Green Version]
- Global CCS Institute, The Global Status of CCS. 2020. Available online: https://www.globalccsinstitute.com/resources/global-status-report/ (accessed on 26 March 2021).
- Schroder, I.F.; Zhang, H.; Zhang, C.; Feitz, A.J. The role of soil flux and soil gas monitoring in the characterisation of a CO2 surface leak: A case study in Qinghai, China. Int. J. Greenh. Gas. Control. 2016, 54, 84–95. [Google Scholar] [CrossRef] [Green Version]
- Salmawati, S.; Sasaki, K.; Sugai, Y.; Yousefi-Sahzabi, A. Estimating a baseline of soil CO2 flux at CO2 geological storage sites. Environ. Monit. Assess. 2019, 191, 563. [Google Scholar] [CrossRef]
- Bond-Lamberty, B.; Christianson, D.S.; Malhotra, A.; Pennington, S.C.; Sihi, D.; AghaKouchak, A.; Anjileli, H.; Arain, M.A.; Armesto, J.J.; Ashraf, S.; et al. COSORE: A community database for continuous soil respiration and other soil-atmosphere greenhouse gas flux data. Glob. Chang. Biol. 2020, 26, 7268–7283. [Google Scholar] [CrossRef] [PubMed]
- Kim, H.; Han, S.H.; Kim, S.; Ko, D.; Yun, S.; Son, Y. Real-time monitoring of carbon dioxide emissions from a shallow carbon dioxide release experiment. Vadose Zone J. 2020, 19, 20051. [Google Scholar] [CrossRef]
- Roberts, J.J.; Stalker, L. What have we learnt about CO2 leakage from CO2 release field experiments, and what are the gaps for the future? Earth-Sci. Rev. 2020, 209, 102939. [Google Scholar] [CrossRef]
- Shin, W.-J.; Ryu, J.-S.; Choi, H.-B.; Yun, S.-T.; Lee, K.-S. Monitoring the movement of artificially injected CO2 at a shallow experimental site in Korea using carbon isotopes. J. Environ. Manag. 2020, 258, 110030. [Google Scholar] [CrossRef]
- Ma, X.; Zhang, X.; Tian, D. Farmland degradation caused by radial diffusion of CO2 leakage from carbon capture and storage. J. Clean. Prod. 2020, 255, 120059. [Google Scholar] [CrossRef]
- Turnbull, J.; Keller, E.; Norris, M.; Wiltshire, R. Atmospheric monitoring of carbon capture and storage leakage using radiocarbon. Int. J. Greenh. Gas. Control. 2017, 56, 93–101. [Google Scholar] [CrossRef]
- Jarvis, S. Landmark Papers: No. 3. Eur. J. Soil Sci. 2014, 65, 1. [Google Scholar] [CrossRef] [Green Version]
- Raich, J.W.; Potter, C.S. Global patterns of carbon dioxide emissions from soils. Glob. Biogeochem. Cycles 1995, 9, 23–36. [Google Scholar] [CrossRef] [Green Version]
- Bahn, M.; Reichstein, M.; Davidson, E.A.; Grünzweig, J.; Jung, M.; Carbone, M.S.; Epron, D.; Misson, L.; Nouvellon, Y.; Roupsard, O.; et al. Soil respiration at mean annual temperature predicts annual total across vegetation types and biomes. Biogeosciences 2010, 7, 2147–2157. [Google Scholar] [CrossRef] [PubMed] [Green Version]
- Pumpanen, J.; Kulmala, L.; Lindén, A.; Kolari, P.; Nikinmaa, E.; Hari, P. Seasonal dynamics of autotrophic respiration in boreal forest soil estimated by continuous chamber measurements. Boreal Environ. Res. 2015, 20, 637–650. [Google Scholar]
- Lloyd, J.; Taylor, J.A. On the Temperature Dependence of Soil Respiration. Funct. Ecol. 1994, 8, 315. [Google Scholar] [CrossRef]
- Jassal, R.; Black, T.; Drewitt, G.; Novak, M.; Gaumont-Guay, D.; Nesic, Z. A model of the production and transport of CO2 in soil: Predicting soil CO2 concentrations and CO2 efflux from a forest floor. Agric. For. Meteorol. 2004, 124, 219–236. [Google Scholar] [CrossRef]
- Epron, D.; Farque, L.; Lucot, E.; Badot, P.-M. Soil CO2 efflux in a beech forest: Dependence on soil temperature and soil water content. Ann. Sci. For. 1999, 56, 221–226. [Google Scholar] [CrossRef] [Green Version]
- Jiang, H.; Deng, Q.; Zhou, G.; Hui, D.; Zhang, D.; Liu, S.; Chu, G.; Li, J. Responses of soil respiration and its temperature/moisture sensitivity to precipitation in three subtropical forests in southern China. Biogeosciences 2013, 10, 3963–3982. [Google Scholar] [CrossRef] [Green Version]
- Tang, J.; Baldocchi, D.D.; Qi, Y.; Xu, L. Assessing soil CO2 efflux using continuous measurements of CO2 profiles in soils with small solid-state sensors. Agric. For. Meteorol. 2003, 118, 207–220. [Google Scholar] [CrossRef]
- Moncrieff, J.B.; Fang, C. A model for soil CO2 production and transport 2: Application to a florida Pinus elliotte plantation. Agric. For. Meteorol. 1999, 95, 237–256. [Google Scholar] [CrossRef]
- Fang, C.; Moncrieff, J. The dependence of soil CO2 efflux on temperature. Soil Biol. Biochem. 2001, 33, 155–165. [Google Scholar] [CrossRef]
- Hashimoto, S.; Komatsu, H. Relationships between soil CO2 concentration and CO2 production, temperature, water content, and gas diffusivity: Implications for field studies through sensitivity analyses. J. For. Res. 2006, 11, 41–50. [Google Scholar] [CrossRef]
- Davidson, E.C.A.; Belk, E.; Boone, R.D. Soil water content and temperature as independent or confounded factors controlling soil respiration in a temperate mixed hardwood forest. Glob. Chang. Biol. 1998, 4, 217–227. [Google Scholar] [CrossRef] [Green Version]
- Voroney, P. Soils for Horse Pasture Management. Horse Pasture Manag. 2019, 65–79. [Google Scholar] [CrossRef]
- Kruczek, B. Carman–Kozeny Equation. Encycl. Membr. 2014, 1–3. [Google Scholar] [CrossRef]
- Perrier, E.R.; Salkini, A.B. Darcy Equation; Ebook, Springer: Berlin/Heidelberg, Germany, 1991; pp. 117–121. [Google Scholar]
- Pavelka, M.; Acosta, M.; Marek, M.V.; Kutsch, W.; Janouš, D. Dependence of the Q10 values on the depth of the soil temperature measuring point. Plant. Soil 2007, 292, 171–179. [Google Scholar] [CrossRef]
- Davidson, E.; Savage, K.; Verchot, L.; Navarro, R. Minimizing artifacts and biases in chamber-based measurements of soil respiration. Agric. For. Meteorol. 2002, 113, 21–37. [Google Scholar] [CrossRef]
- Allison, S.D.; Wallenstein, M.D.; Bradford, M.A. Soil-carbon response to warming dependent on microbial physiology. Nat. Geosci. 2010, 3, 336–340. [Google Scholar] [CrossRef]
- Howard, D.; Howard, P. Relationships between co2 evolution, moisture content and temperature for a range of soil types. Soil Biol. Biochem. 1993, 25, 1537–1546. [Google Scholar] [CrossRef]
- Caquet, B.; De Grandcourt, A.; M’bou, A.T.; Epron, D.; Kinana, A.; Saint Andre, L.; Nouvellon, Y. Soil carbon balance in a tropical grassland: Estimation of soil respiration and its partitioning using a semi-empirical model. Agric. For. Meteorol. 2012, 158, 71–79. [Google Scholar]
- Jassal, R.; Black, A.; Novak, M.; Morgenstern, K.; Nesic, Z.; Gaumont-Guay, D. Relationship between soil CO2 concentrations and forest-floor CO2 effluxes. Agric. For. Meteorol. 2005, 130, 176–192. [Google Scholar] [CrossRef]
Short Biography of Authors
 | Kyuro Sasaki is a professor of the Department of Earth Resources Engineering, Faculty of Engineering, Kyushu University, Japan since 2005. He had taught Akita University for 20 years and moved to Kyushu University engaging education on mining and petroleum engineering. He holds BS, MS and PhD degrees from Hokkaido University, Japan. His research interests are mineral resources production, fluid mechanics and heat & mass transfer phenomena in mining and petroleum productions. He has published papers on Mine Ventilation, Open-pit Optimization, SAGD, Methane hydrate production, Enhanced coal bed methane recovery, Enhanced oil recovery, CO2 Geological Storage, Spontaneous combustion of coal and Natural soil CO2 emission. He is recently proposing the carbon reverse engineering contributing mitigating CO2 emission by the geological CO2 storage, and CO2 and CH4 gas monitoring system to check their leakages from underground to the surface. |
 | Takashi Kuriyama has achieved BS and MS degrees in Earth Resources Engineering, Faculty of Engineering, Kyushu University, Japan.After the graduation, he joined Japan Oil, Gas and Metals National Corporation (JOGMEC) as a reservoir engineer from April, 2019. He is currently working in the Carbon Capture and Storage (CCS) department to design and research CCS, mainly focusing on CO2 migration and trap mechanisms. |
 | Salmawati Salmawati is a consultant in the fields of energy, mining and the environment. She holds a B.S and M.S from Bandung Institute of Technology, West Java, Indonesia, and PhD from Kyushu University, Fukuoka, Japan. Currently, she is working at PT Tura Consulting Indonesia, an integrated mining and energy consultant in Indonesia as mining environment and green energy specialist. She is also engaged with The World Bank Group in Jakarta, Indonesia, for the projects of Natural Resources for Sustainable Development (NR4D) and Climate Smart Mining Initiatives for preparing the Indonesia Climate Smart Mining Roadmap. |
 | Phung Quoc Huy was a research associate of the Department of Earth Resources Engineering, Faculty of Engineering, Kyushu University, Japan, until March 2021. Currently, he is working for the Asia Pacific Energy Research Center, Japan as a senior researcher. He holds B.S from Hanoi University of Mining and Geology (Vietnam), M.S and PhD from Kyushu University (Japan). He started work as a researcher at the Institute of Mining Science and Technology (Vietnam) from 1999 to 2019. He participated in various research projects related to methane gas emission, mine ventilation, coal mine gas explosion, spontaneous combustion, risk management and assessment, mine safety, CO2 emission, greenhouse gases, CO2 sequestration.He is currently interested in energy demand and supply, energy policies and Carbon Capture, Utilization and Storage technology (CCUS), CO2 emission monitoring. |
Figure 1.
Map of the INAS test field study area with three different measuring locations, A, B, and C, located at Ito campus, Kyushu University, Japan. Because specific soil characteristics could influence results, the following three locations within the INAS test field were selected for our study: Location A: covered with leaf litter and several clusters of living grasses. Location B: soft soil surface covered with living grasses. Location C: hard soil with many pebbles and no grass or leaf litter.

Figure 2.
System for measuring soil CO2 flux using a closed-chamber method including (a) schematic diagram of the system and (b) operational stages using a butterfly valve in the measurement cycle.
Figure 2.
System for measuring soil CO2 flux using a closed-chamber method including (a) schematic diagram of the system and (b) operational stages using a butterfly valve in the measurement cycle.

Figure 3.
Calibrated results of water saturation at three locations (A, B, and C) using two sensors.
Figure 3.
Calibrated results of water saturation at three locations (A, B, and C) using two sensors.

Figure 4.
Calibrated results of volumetric water content at three locations (A, B, and C) using two sensors.
Figure 4.
Calibrated results of volumetric water content at three locations (A, B, and C) using two sensors.

Figure 5.
Calibrated results of gravimetric water content at three locations (A, B, and C) using two sensors.
Figure 5.
Calibrated results of gravimetric water content at three locations (A, B, and C) using two sensors.

Figure 6.
Soil packed into an acrylic pipe for measurement of gas permeability (6.38 cm2 cross-section, 21.8 cm length).
Figure 6.
Soil packed into an acrylic pipe for measurement of gas permeability (6.38 cm2 cross-section, 21.8 cm length).

Figure 7.
Carbon dioxide (CO2) gas permeability versus water saturation (Sw) at Locations A and B.

Figure 8.
Soil temperature on the surface and at three different depths, recorded at Location A (Dec 21, 2016 to Jan 2, 2017).
Figure 8.
Soil temperature on the surface and at three different depths, recorded at Location A (Dec 21, 2016 to Jan 2, 2017).

Figure 9.
Variation trend of soil flux and soil temperature at a depth of 7 cm, as recorded at Location A (Dec 30, 2016 to Dec 31, 2016).
Figure 9.
Variation trend of soil flux and soil temperature at a depth of 7 cm, as recorded at Location A (Dec 30, 2016 to Dec 31, 2016).

Figure 10.
Correlation between CO2 flux from soils and soil temperature together with rainfall data recorded at Location A (Dec 14, 2016 to Dec 20, 2016).
Figure 10.
Correlation between CO2 flux from soils and soil temperature together with rainfall data recorded at Location A (Dec 14, 2016 to Dec 20, 2016).

Figure 11.
Long-term monitoring of soil CO2 flux and soil temperature at Location A (Dec 1, 2016 to Nov 23, 2017).
Figure 11.
Long-term monitoring of soil CO2 flux and soil temperature at Location A (Dec 1, 2016 to Nov 23, 2017).

Figure 12.
Soil CO2 flux (J) and soil temperature (T) across various soil moisture levels, recorded at Location A (Dec 5, 2016 to Oct 9, 2017).
Figure 12.
Soil CO2 flux (J) and soil temperature (T) across various soil moisture levels, recorded at Location A (Dec 5, 2016 to Oct 9, 2017).

Figure 13.
Correlation between CO2 flux from soil (J) and water saturation (Sw), recorded at Location A (Jul 31, 2017 to Oct 9, 2017).
Figure 13.
Correlation between CO2 flux from soil (J) and water saturation (Sw), recorded at Location A (Jul 31, 2017 to Oct 9, 2017).

Figure 14.
Comparison of the relationship between CO2 flux from soil (J) and soil temperature (T) at Location A (Dec 1, 2016 to Nov 26, 2017), B (Nov 1, to Dec 9, 2018), and C (Oct 25, to Nov, 2018).
Figure 14.
Comparison of the relationship between CO2 flux from soil (J) and soil temperature (T) at Location A (Dec 1, 2016 to Nov 26, 2017), B (Nov 1, to Dec 9, 2018), and C (Oct 25, to Nov, 2018).

Figure 15.
Soil organic matter (SOM) and porosity at three study locations (A, B, and C).

Figure 16.
Correlation between CJ and soil organic matter (SOM) at locations A, B, and C.

Figure 17.
Plots of soil CO2 flux measured at Locations A, B, and C.

Publisher’s Note: MDPI stays neutral with regard to jurisdictional claims in published maps and institutional affiliations. |
© 2021 by the authors. Licensee MDPI, Basel, Switzerland. This article is an open access article distributed under the terms and conditions of the Creative Commons Attribution (CC BY) license (http://creativecommons.org/licenses/by/4.0/).
Share and Cite
MDPI and ACS Style
Kuriyama, T.; Quoc Huy, P.; Salmawati, S.; Sasaki, K. A Threshold Line for Safe Geologic CO2 Storage Based on Field Measurement of Soil CO2 Flux. C 2021, 7, 34. https://0-doi-org.brum.beds.ac.uk/10.3390/c7020034
AMA Style
Kuriyama T, Quoc Huy P, Salmawati S, Sasaki K. A Threshold Line for Safe Geologic CO2 Storage Based on Field Measurement of Soil CO2 Flux. C. 2021; 7(2):34. https://0-doi-org.brum.beds.ac.uk/10.3390/c7020034
Chicago/Turabian StyleKuriyama, Takashi, Phung Quoc Huy, Salmawati Salmawati, and Kyuro Sasaki. 2021. "A Threshold Line for Safe Geologic CO2 Storage Based on Field Measurement of Soil CO2 Flux" C 7, no. 2: 34. https://0-doi-org.brum.beds.ac.uk/10.3390/c7020034
Note that from the first issue of 2016, this journal uses article numbers instead of page numbers. See further details here.