
Comments on the XPS Analysis of Carbon Materials


1
Cardiff Catalysis Institute, School of Chemistry, Cardiff University, Park Place, Cardiff CF10 3AT, UK
2
HarwellXPS: ESPRC National Facility for X-ray Photoelectron Spectroscopy, Research Campus at Harwell (RCaH), Didcot OX11 0FA, UK
C 2021, 7(3), 51; https://0-doi-org.brum.beds.ac.uk/10.3390/c7030051
Submission received: 21 June 2021
/
Revised: 4 July 2021
/
Accepted: 5 July 2021
/
Published: 6 July 2021
(This article belongs to the Collection Nanocarbon-Based Composites and Their Thermal, Electrical, and Mechanical Properties)
Abstract
:The surface chemistry of carbon materials is predominantly explored using x-ray photoelectron spectroscopy (XPS). However, many published papers have critical failures in the published analysis, stemming from an ill-informed approach to analyzing the spectroscopic data. Herein, a discussion on lineshapes and changes in the spectral envelope of predominantly graphitic materials are explored, together with the use of the D-parameter, to ascertain graphitic content, using this information to highlight a simple and logical approach to strengthen confidence in the functionalization derived from the carbon core-level spectra.
1. Introduction
The chemistry of carbon materials is extremely important in fields such as catalysis, energy storage, composite materials, and sensor technology to name but a few examples [1]. In the analysis of such materials, to obtain an understanding of the surface properties the use of x-ray photoelectron spectroscopy (XPS) has been ubiquitous due to its inherent surface sensitivity. Given the truly heterogenous nature of most carbons, with their bonds to hetero atoms, different chemical species, and varying amounts of sp2 and sp3 carbon, the carbon spectral envelope can become quite convoluted.
Many researchers approach the analysis of carbon from a single point of view, specifically analysis of solely the C (1s) region. Complementary analysis of the corresponding heteroatom spectral regions (e.g., O (1s), S (2p), and N (1s)) is required to support the conclusions drawn by the C (1s) analysis [2,3,4,5].
Erroneous analysis also stems from failure to apply an asymmetric shape to graphitic carbon, which arises from final-state effects due to the photoelectron ejection [6,7,8,9], while a failure to consider the presence of defects or changes in the electronic structure of the carbon can also lead to mistaken assignments of peaks in a fitting model.
This paper reviews and addresses some of the key points that are commonly made in error in the published literature, including photoemission line shapes, the use of the carbon Auger and simple checks a researcher can perform to move towards a better understanding of their carbon material and have confidence in their chemical state assignments from peak fitting.
2. Experimental
Original data presented in this paper were collected on one of two XPS systems. The first is a Thermo Scientific K-Alpha+ photoelectron spectrometer which utilizes micro-focused monochromatic Alkα radiation over typically a 400 × 600 µm elliptical analysis area (400-micron spot mode). Data were collected at a pass energy of 40 eV with a step size of 0.1 eV.
The second system is a Kratos Axis Ultra DLD photoelectron spectrometer, again utilizing monochromatic Alkα radiation but operating in its hybrid spectroscopy mode, with the slot aperture giving a rectangular analysis area of 700 × 300 µm. Unless otherwise stated the pass energy was 20 eV for all high-resolution data collected with a step size of 0.1 eV.
Highly-oriented pyrolytic graphite (HOPG) samples were of ZYH quality, measuring 10 × 10 mm and acquired from Scanwel (Gwynedd, UK). All HOPG samples were cleaved using adhesive tape in the entry lock of the spectrometer.
All graphitic samples, including HOPG, are taken to have the C (1s) peak for sp2 carbon at a binding energy of 284.5 eV, while sp3 samples were taken to have a C (1s) energy of 285 eV. All data were processed using CasaXPS v2.3.24 [10].
3. Results
3.1. The C (1s) Spectrum of Diamond, HOPG and Graphitic Carbons
This paper will not consider the fitting of adventitious or polymeric carbon species but will focus on predominantly graphitic and diamond-like materials. For discussion on the former, the reader is directed to [11].
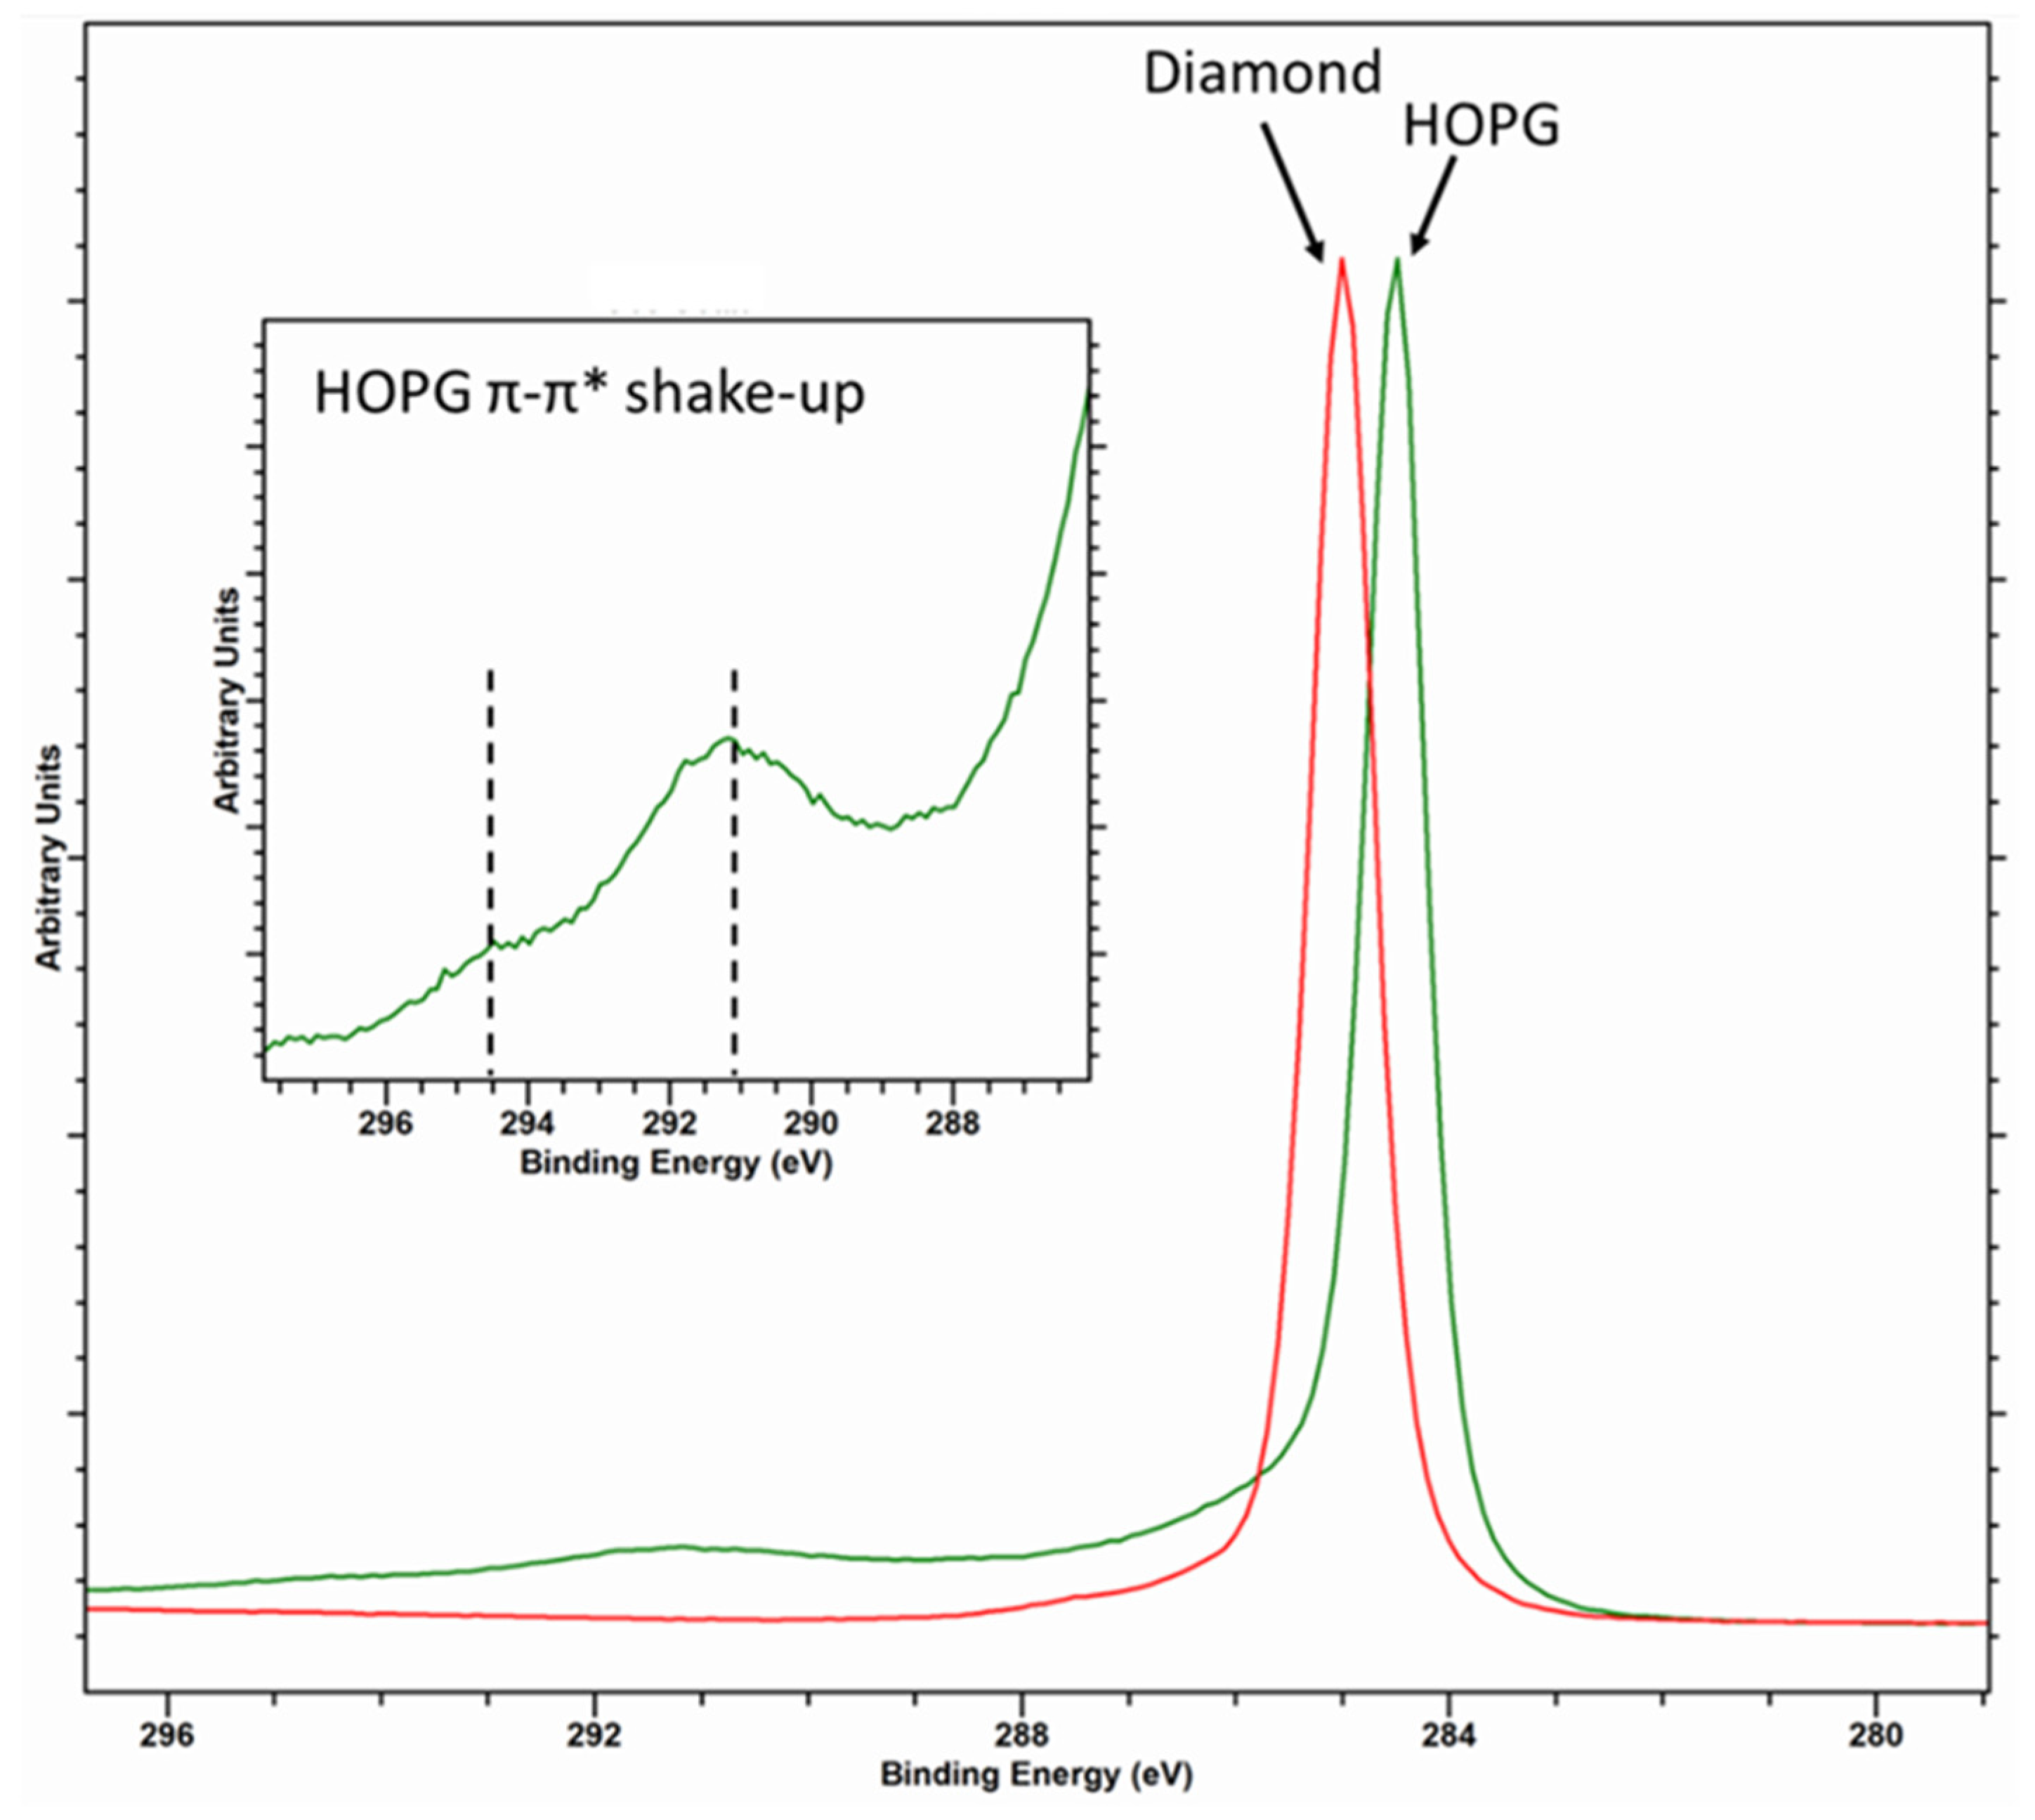
Diamond, with its sp3 hybridization, typically exhibits a Voigt-like peak shape and is taken to have a binding energy of 285 eV [12,13]. The C (1s) core-level spectrum of graphitic carbon, such as that of HOPG, is characterized by an asymmetric peak shape with a binding energy typically reported as 284.5 eV (although values between 284.3 and 284.6 eV have been reported [12,14]) and a characteristic π-π* shake-up structure with structure centered around 291 and 294.5 eV (Figure 1).
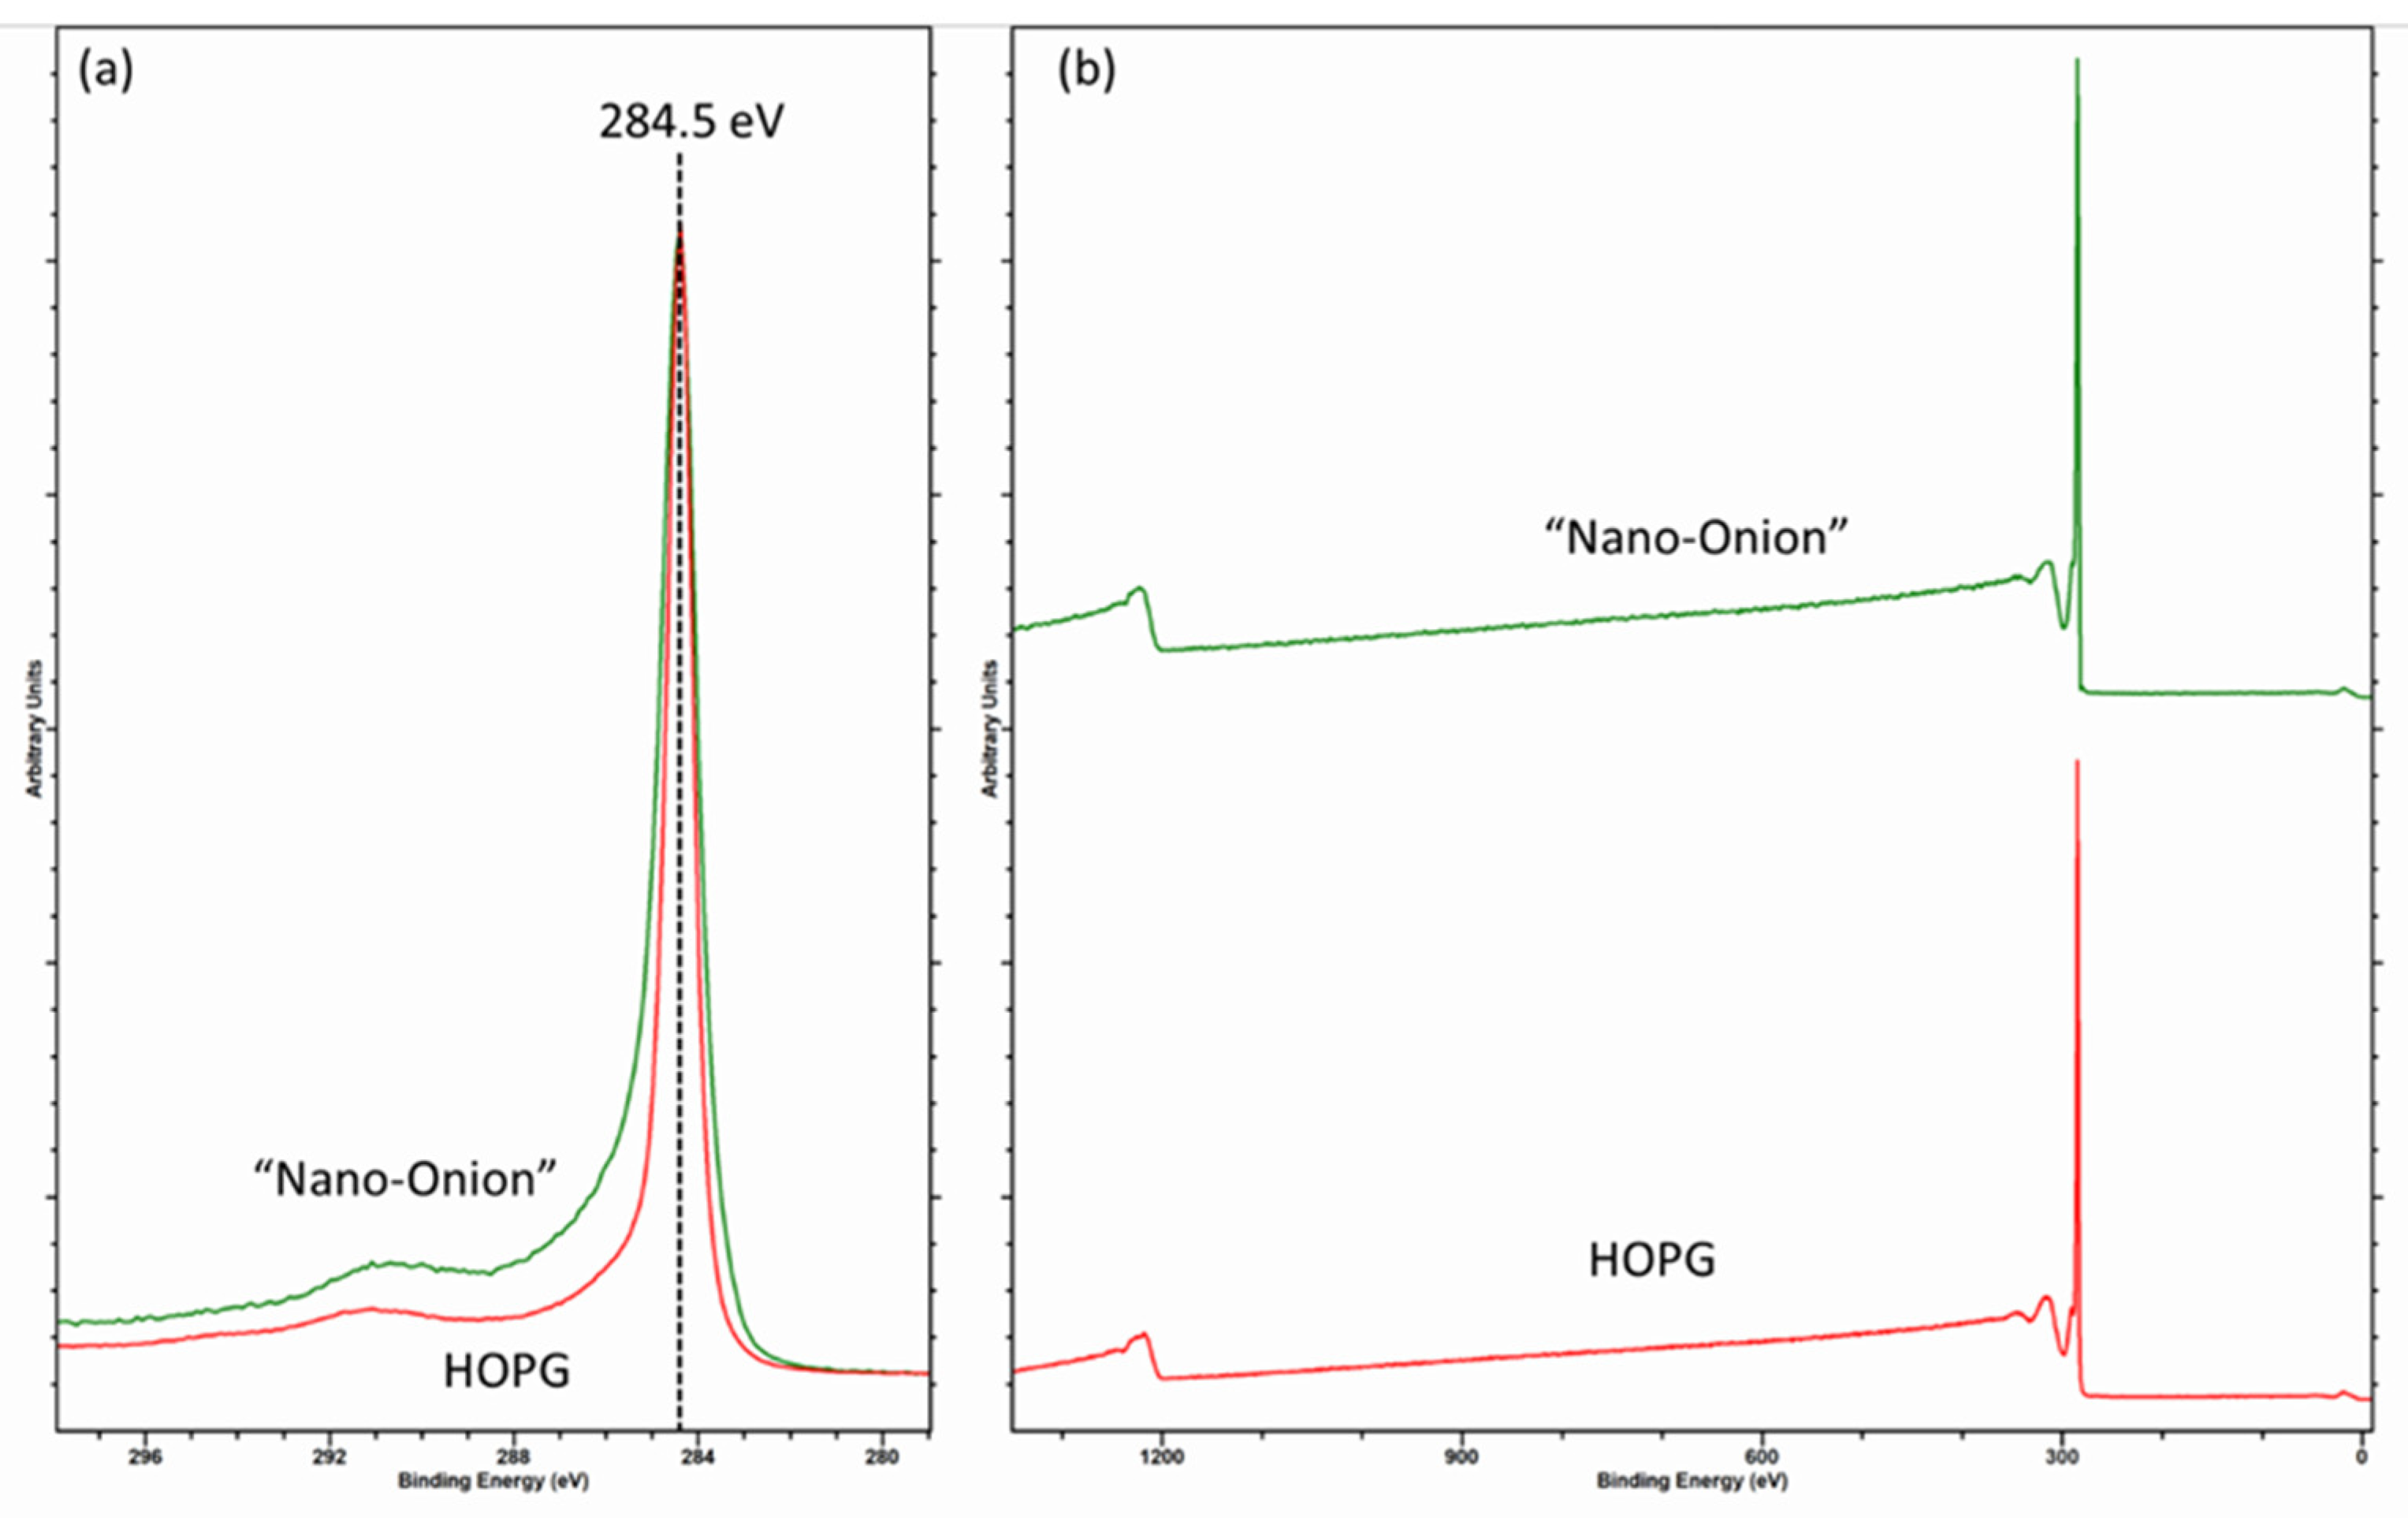
The fitting of the graphitic C (1s) envelope is one of the most common errors encountered in the literature [15], and the asymmetric shape is something commonly ignored in may published papers. Recently, Linford et al. [11] reported a method for fitting the C (1s) envelope of graphitic carbon materials, using a reference spectrum of clean graphite/HOPG as a model for the graphitic backbone. This method is useful and is indeed a method the current author has used for many years. However, as shown in Figure 2, an apparently pure sp2 graphitic carbon (here a “nano-onion” [3]) cannot be fitted with the parameters taken from HOPG and likely stems from a combination of hydrogenation and the curvature of the carbon surface [14].
Hydrogenation undoubtedly introduces some sp3 character given the broadening around 285 eV and accompanied by a reduction in the D-parameter (discussed in the following section) to 20.5. However, note the broadening with respect to the narrow HOPG spectrum, taking the difference spectra (not shown) shows some perturbation of the π-π* shake-up, which may be expected if there is a lattice disruption, accompanied with some broadening centered at 284.8 and 284 eV and are values consistent with Blume et al. [14] and assigned as disordered (thought to be due to random orientations of dangling bonds with respect to the carbon atoms) and defective carbon, respectively. Such defective induced broadening will cause a change in the main peak asymmetry due to screening of localized areas of charge and the need to adjust any asymmetric fitting parameters for the graphitic peak.
As will be shown in the following sections, analysis, especially fitting, of the C (1s) envelope for graphitic materials is complex and should not be fitted unless a rigorous and self-consistent model is used.
3.2. The C (KVV) Auger Peak and the D-Parameter
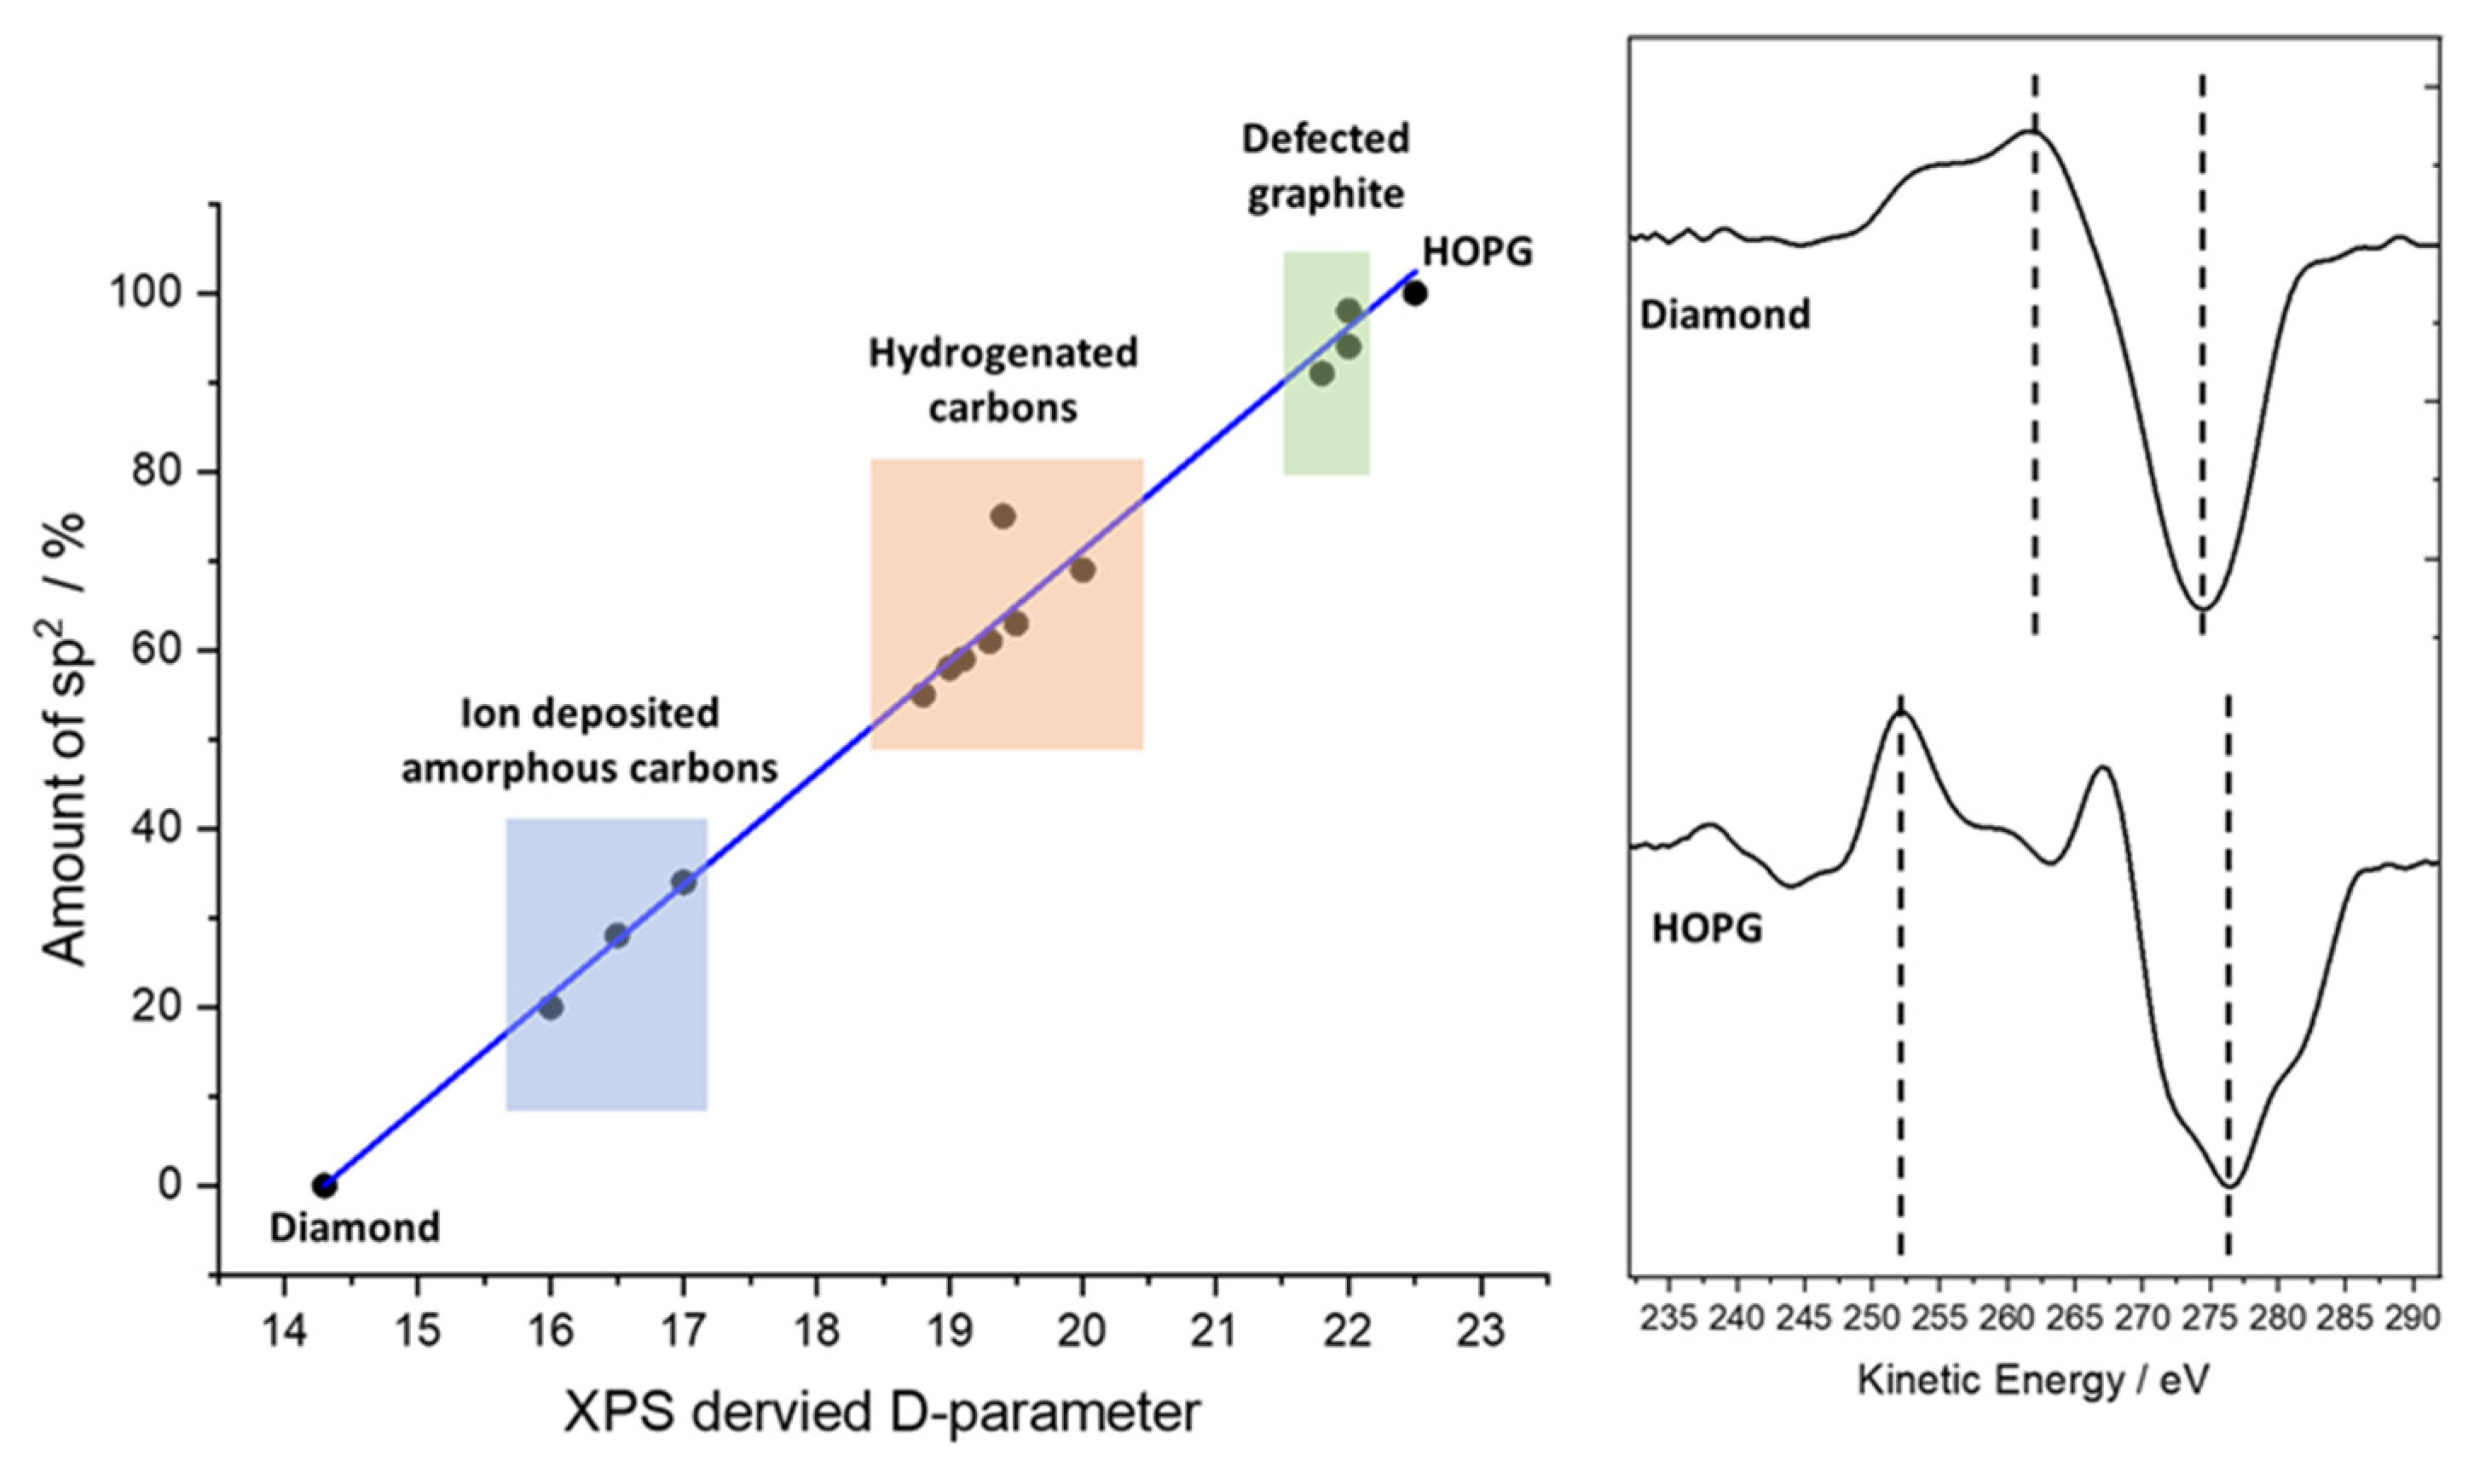
Not to be confused with the D-band in Raman spectroscopy of carbon materials, which is a measure of disorder of the graphitic material [16,17,18], use of the XPS-derived D-parameter to discriminate carbon states was demonstrated by Lascovich and co-workers [19,20,21,22], who showed a linear relationship existed between the extremes of pure sp2 and sp3 carbons by taking the first differential of the carbon Auger peak, where depending upon the relative concentrations of sp2 and sp3 carbon, the separation (D, hence D-parameter) of the differential maxima and minima differ greatly. Figure 3 shows a plot of the values of Lascovich et al. together with the first differential of the Auger peaks for diamond and HOPG. This approach has successfully been used to distinguish sp2 and sp3 rich carbon rich domains through XPS mapping experiments [23,24].
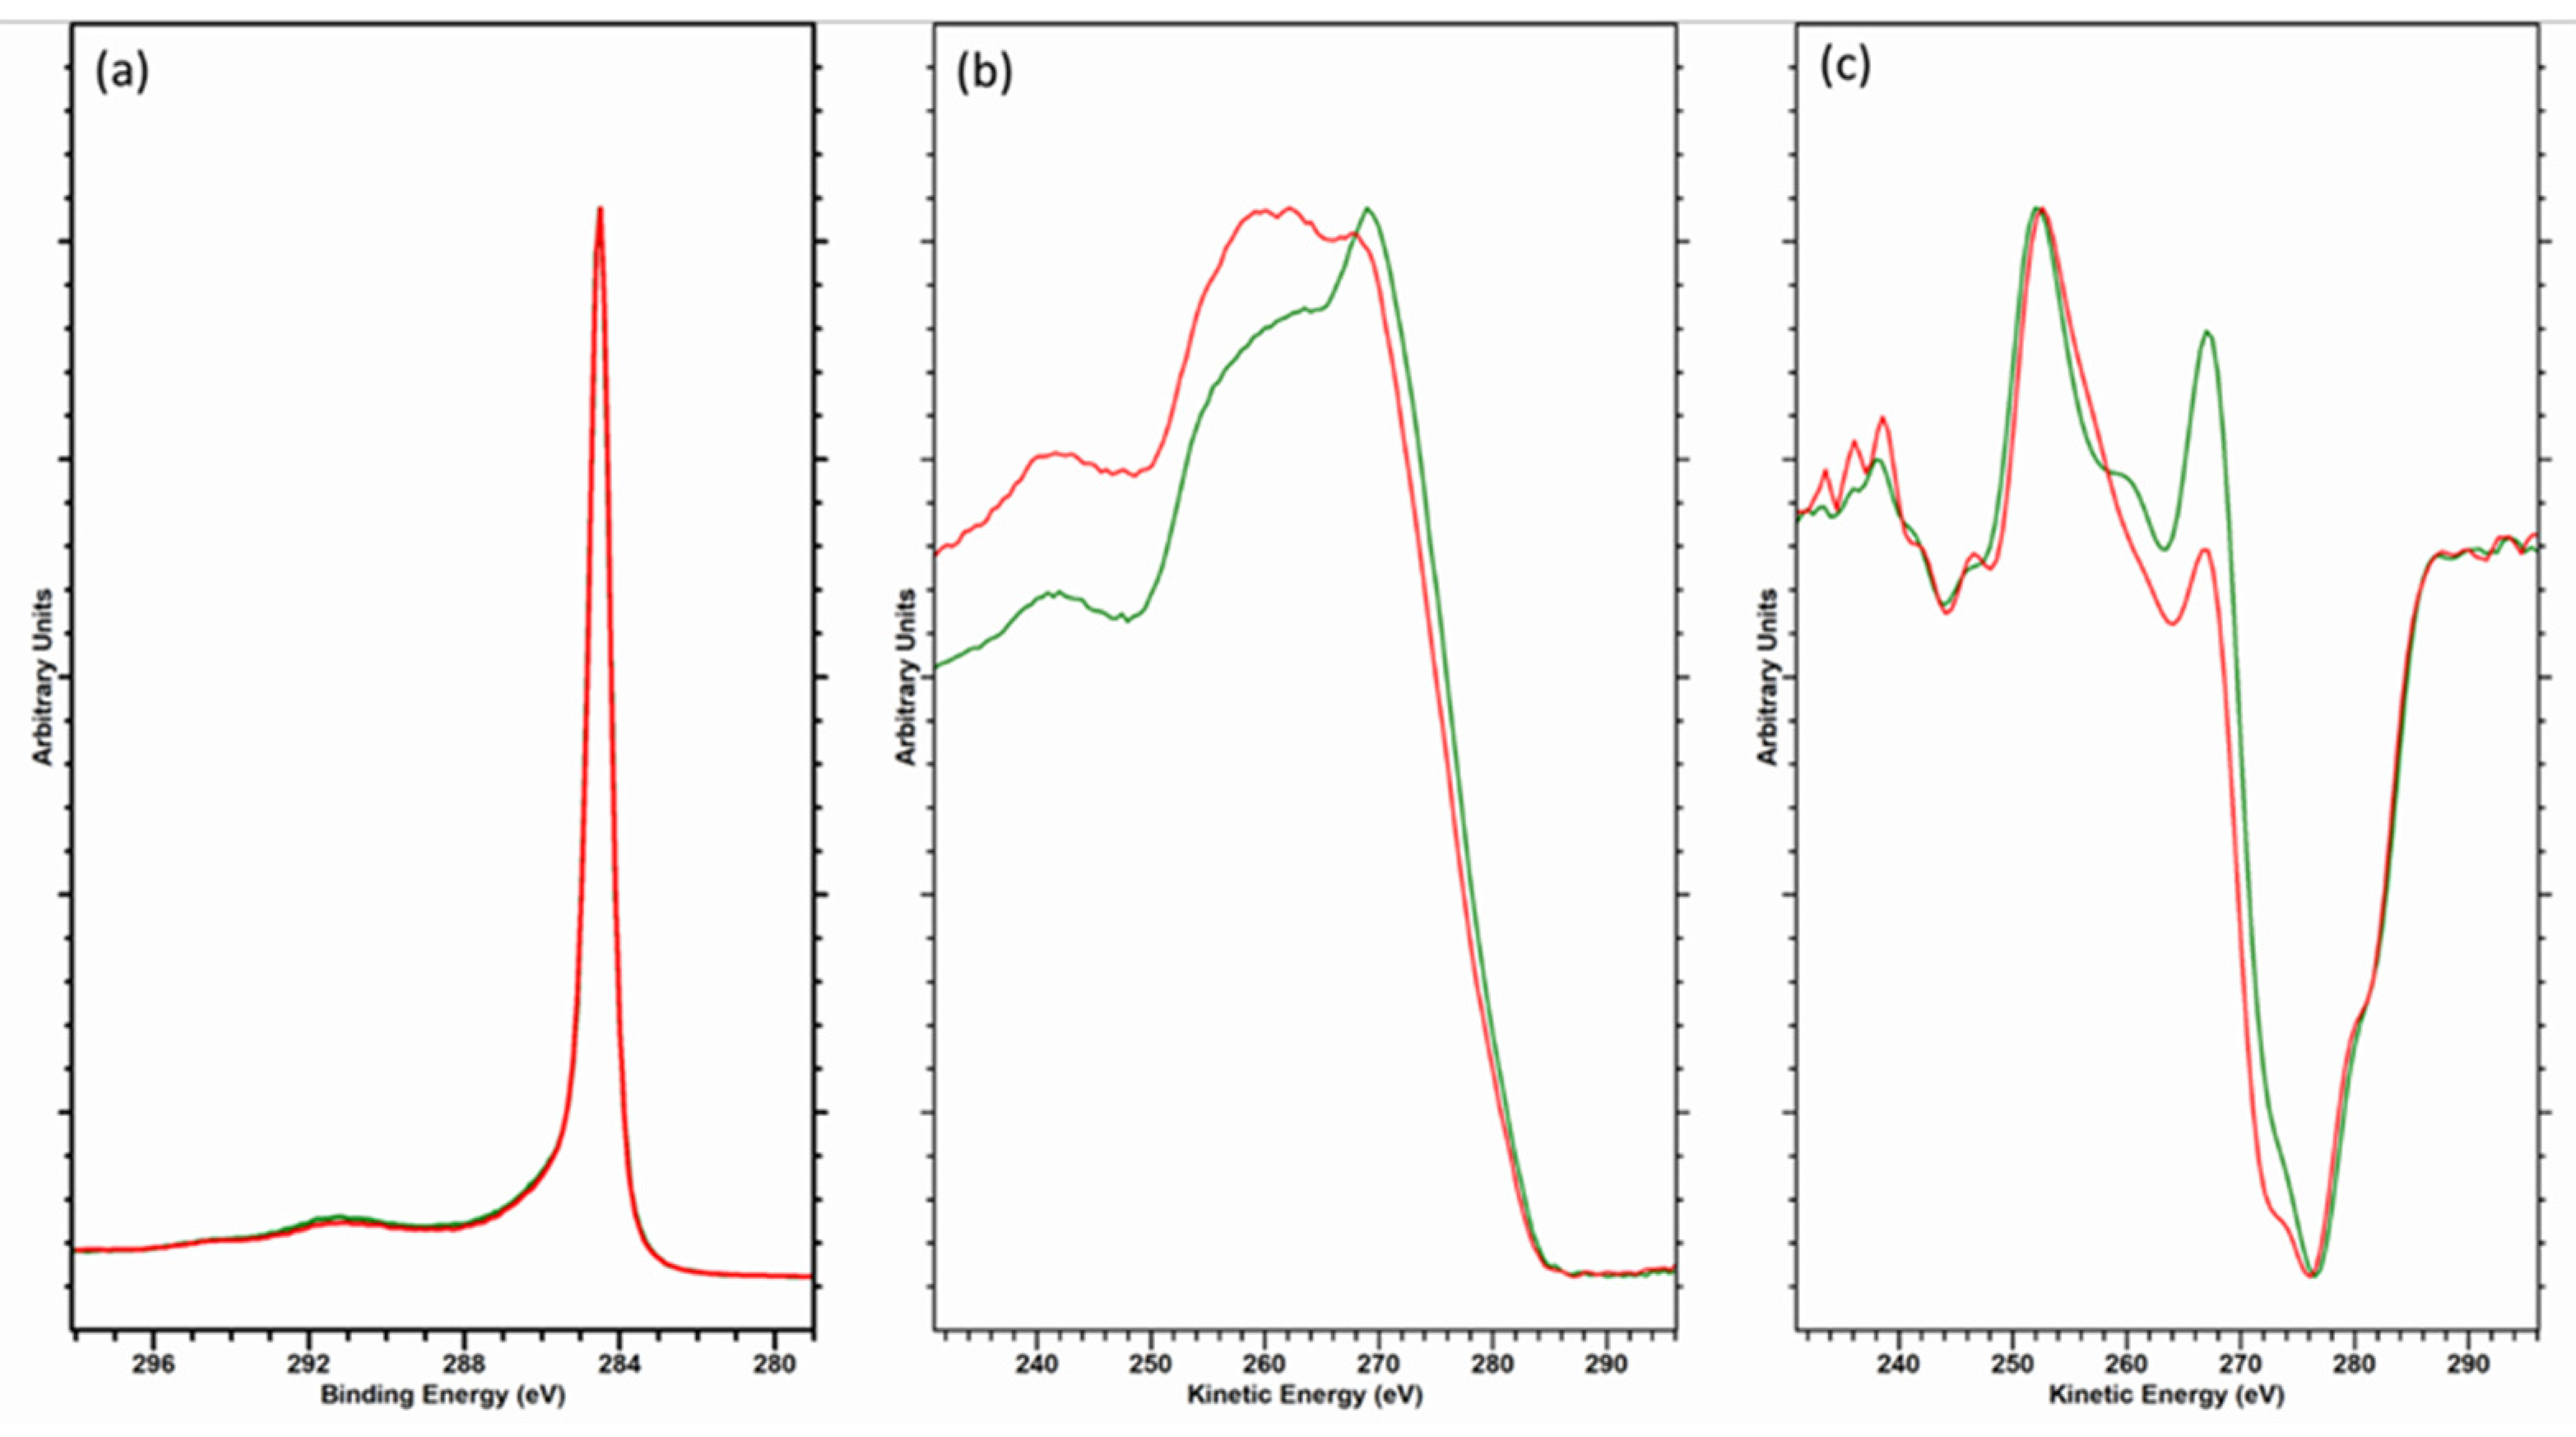
Consideration should be given in taking the D-parameter as an exact value, however. The electron kinetic energy of the Auger peak is lower than that of the C (1s) photoelectron kinetic energy (ca. 260 and 1200 eV, respectively), yielding an electron inelastic mean free path (IMFP) of 3.3 nm for the core-level photoelectron and 1.1 nm for the Auger electron—a threefold difference in electron depth and therefore a similar magnitude of difference in the XPS information depth [25]. The Auger electrons are more surface sensitive, hence sensitive to contamination. This is demonstrated by the data in Figure 4, where a freshly cleaved HOPG sample has been analyzed and then gently cleaned using an argon cluster source (operating at 4 kV, 2000 atoms); note how the C (1s) data are almost indistinguishable, while the Auger peaks differ significantly. The D-parameters here are 22 eV (cleaved) and 23.5 eV (cluster cleaned [26]), the latter being higher than that previously reported, while the former is in the range typically reported for graphite [12,13,19,20,21,23,27]; note none of these references mention in situ cleaning.
Irrespective of these values, there will be an uncertainty in the determination of the D-parameter depending on the method and parameters used. Table 1 shows calculated values of the D-parameter from two common XPS analysis software packages using the default available options illustrating how, depending on the method used, the D-parameter can vary by as much as 1.5 eV, corresponding to a variance of ca. 20% sp2 content using the data plotted in Figure 3.
It is worth noting the C (KVV) Auger is typically recorded at a high pass energy, a step size of 0.5 eV and sufficient scans for a good signal-to-noise ratio (typically at least ×50) [28].
3.3. Complementary Use of the C (1s) and O (1s) Spectra
The presence of oxygen functionalities on the carbon surface is expected to have a notable influence on the shape of the C (1s) spectra due to the formation of different carbon–oxygen bonds. However, these changes are not always clear, especially if the moieties are in low concentration or poorly dispersed. The C-O signals themselves are generally found between ca. 285 and 290 eV, i.e., between the C-C peak and the satellite structure for graphitic carbon, and are fitted with the assumption that each C-O species will have equal FWHMs. Table 2 gives some typical ranges for carbon species relative to graphitic carbon; note how some fall in the region of the carbon satellite structure.
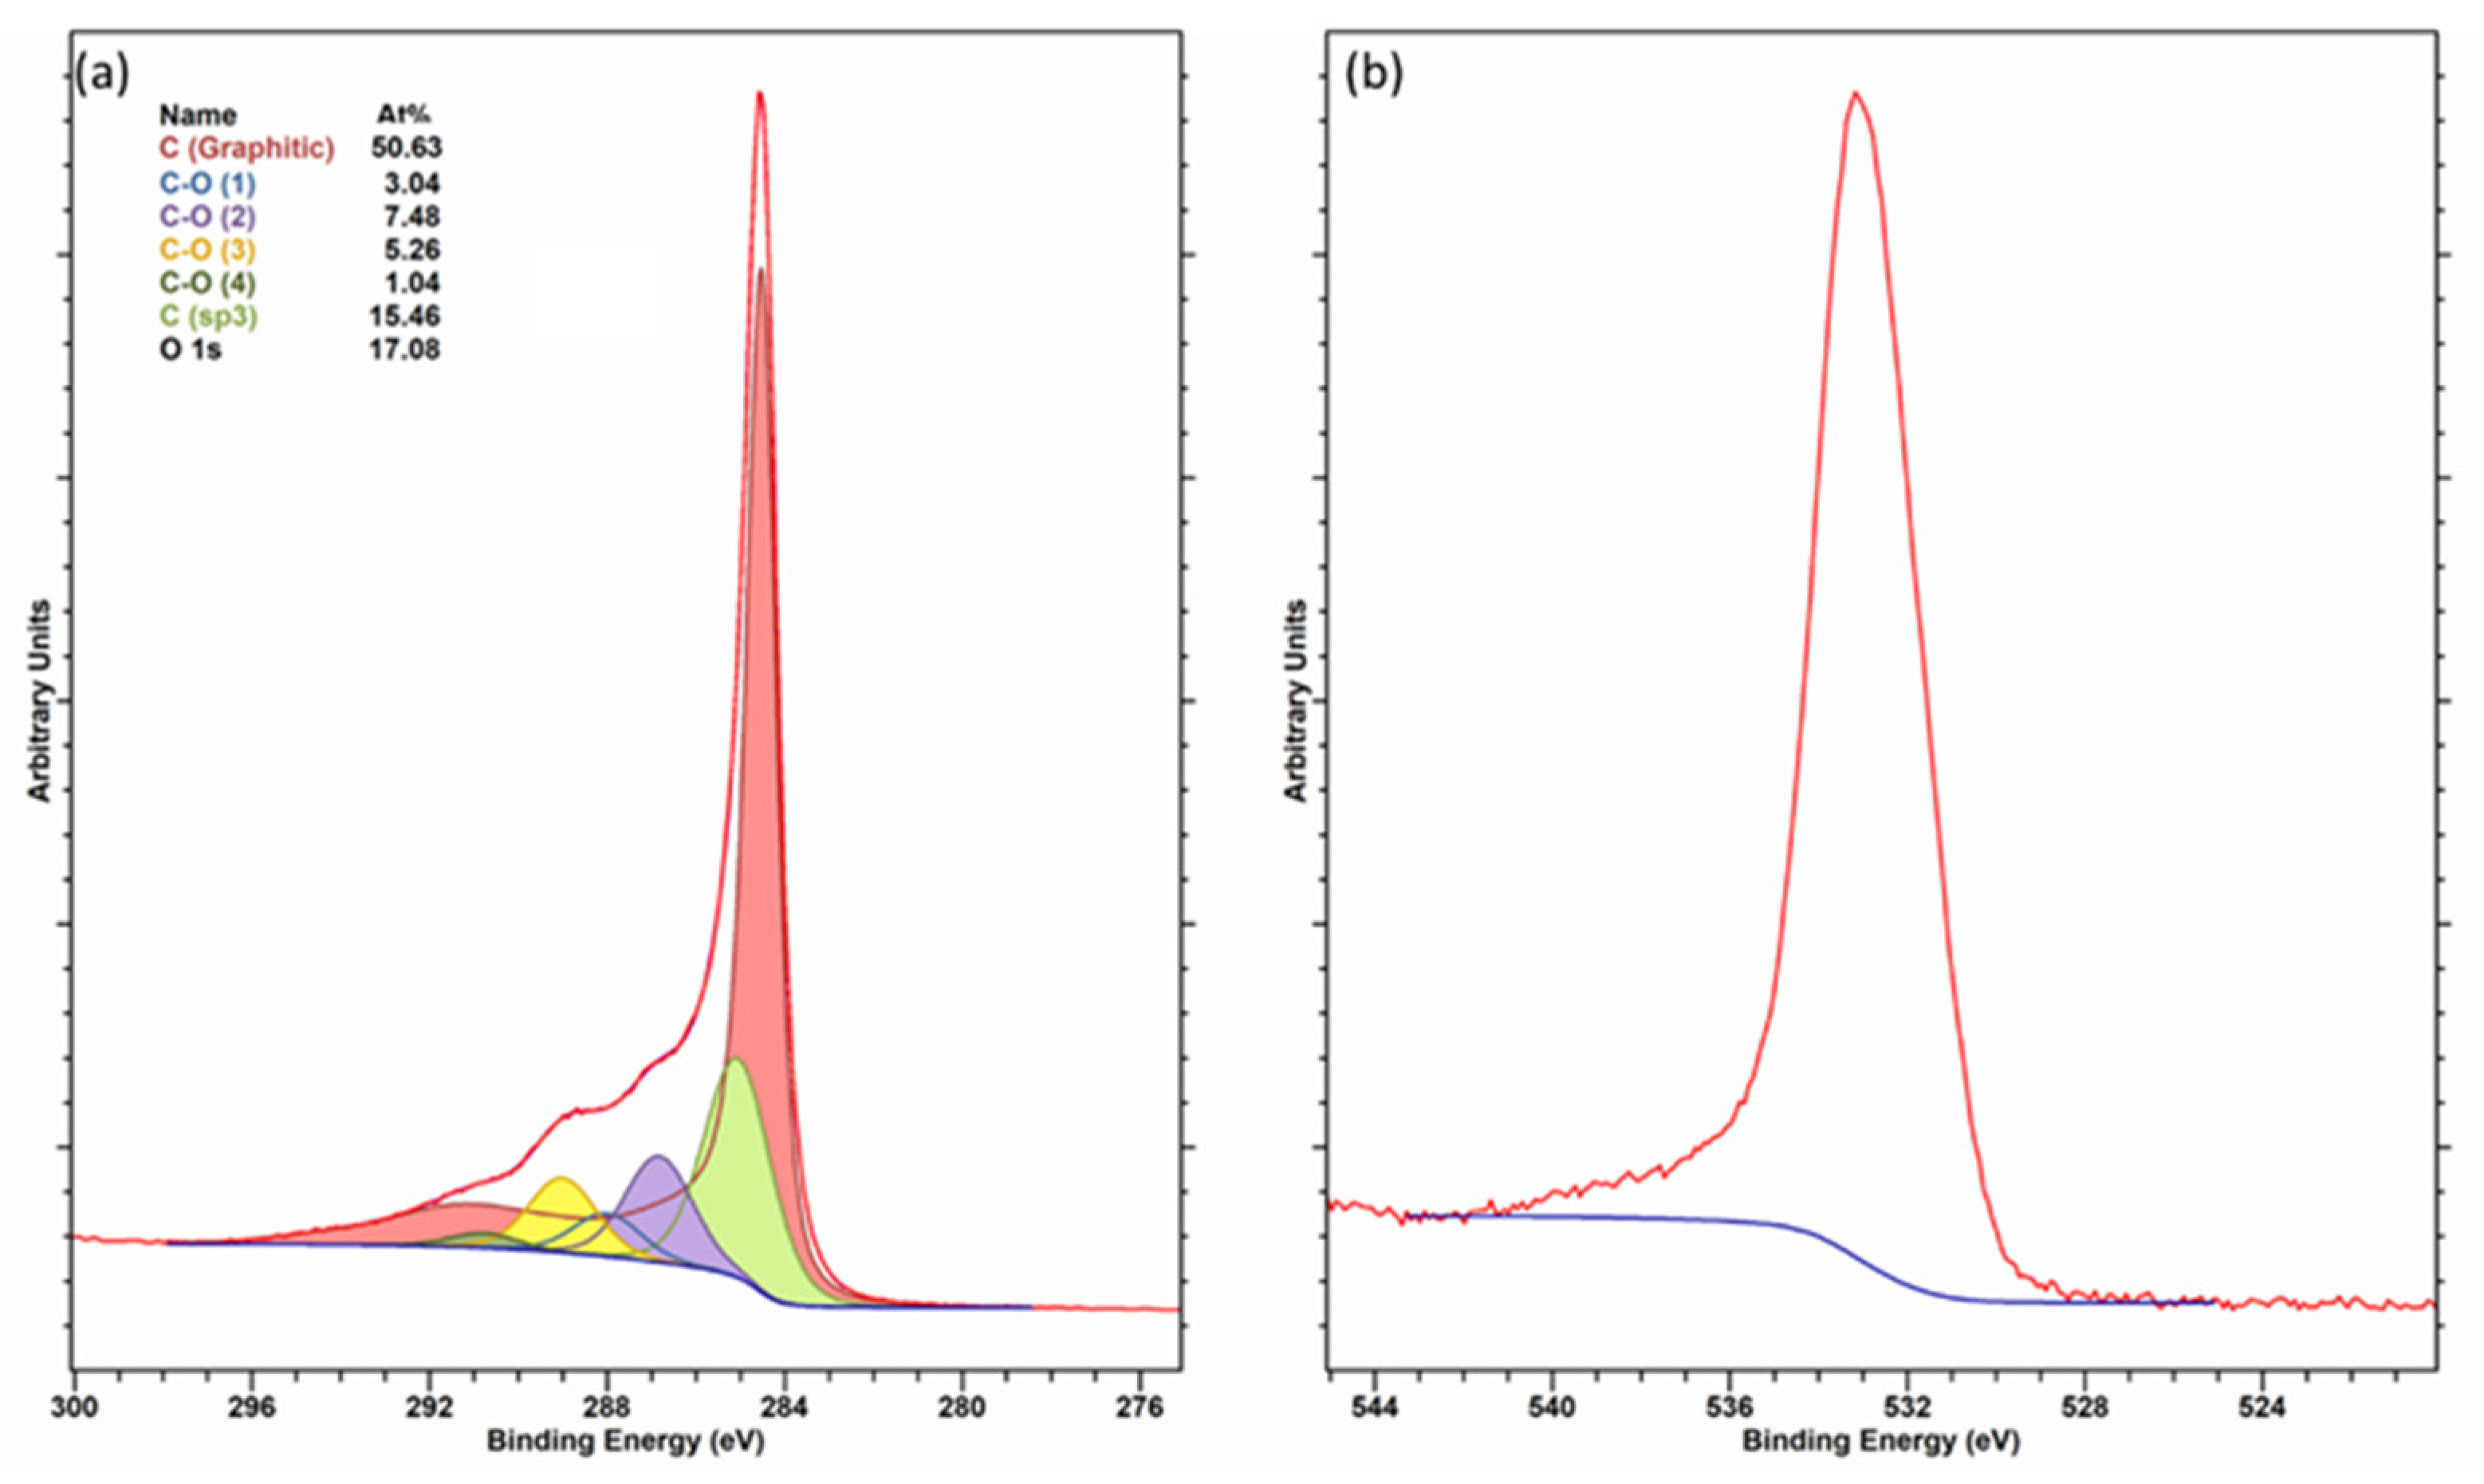
A meaningful fit can only be made by appreciation of the asymmetric tail of the sp2 carbon which forms a pseudo-background on which these signals are superimposed. A simple check of the fit can be made by comparing the corrected integrated photoelectron peak areas of the C-O-containing functions (while ignoring any C-C and π-π* structure) with that of the total oxygen content. Ideally, these should be equal but given uncertainty in fitting given appropriate line shape selection, etc., then a small mismatch in the range of ca. 1 at % can be considered good. An example of this approach is shown in Figure 5, the data are of a commercially available plasma-oxidized few-layer graphene sample, where the total oxygen content (ca. 17 at%) is approximately equal with all four oxygen-containing functionalities; the difference being <0.3 at%.
Note that in this example, the O (1s) has not been fitted, but by having increased confidence in our C (1s) fit, we could now begin to assign chemistry to the O (1s) region, but this is not always necessary, nor easy, especially as some functionalities can have very similar binding energies [29]. The oxygen region can also be used diagnostically, with the tail to higher binding energy indicating the satellite structure of carbonyl-containing fragments and should be used to inform the fit of the C (1s) envelope.
Using this informed approach, the fit yields a sp3 carbon content of ca. 15.5%, in excellent agreement with the measured D-parameter of this sample (value 21 (±0.5 eV), which is ca. 15% sp3 based on data in Figure 3), whereas significant deviation is found when fitting the C (1s) spectrum alone, leading to some larger disparity between the sp3 content derived from the D-parameter and peak fit [30].
Of course, the data in Figure 5 are a well-defined case, but serve to illustrate that appreciation of these spectra features can influence our fitting and understanding of the C (1s) spectrum, especially if the C (1s) spectra is not as clearly oxidized as that shown.
Such assignments can be confirmed by chemical derivatization [31,32] using fluorine- or nitrogen-containing reagents with emphasis on changes observed in the O(1s) region. For example, Burgess et al. have shown for acid-treated HOPG, alcohol, ketone and ether functions can be selectively reacted and identified; -COOH functionalities can also be derivatized, but no evidence of these were found in that work [33]. Unpublished work from the same laboratory shows such derivatization also works for carbon powders.
4. Conclusions
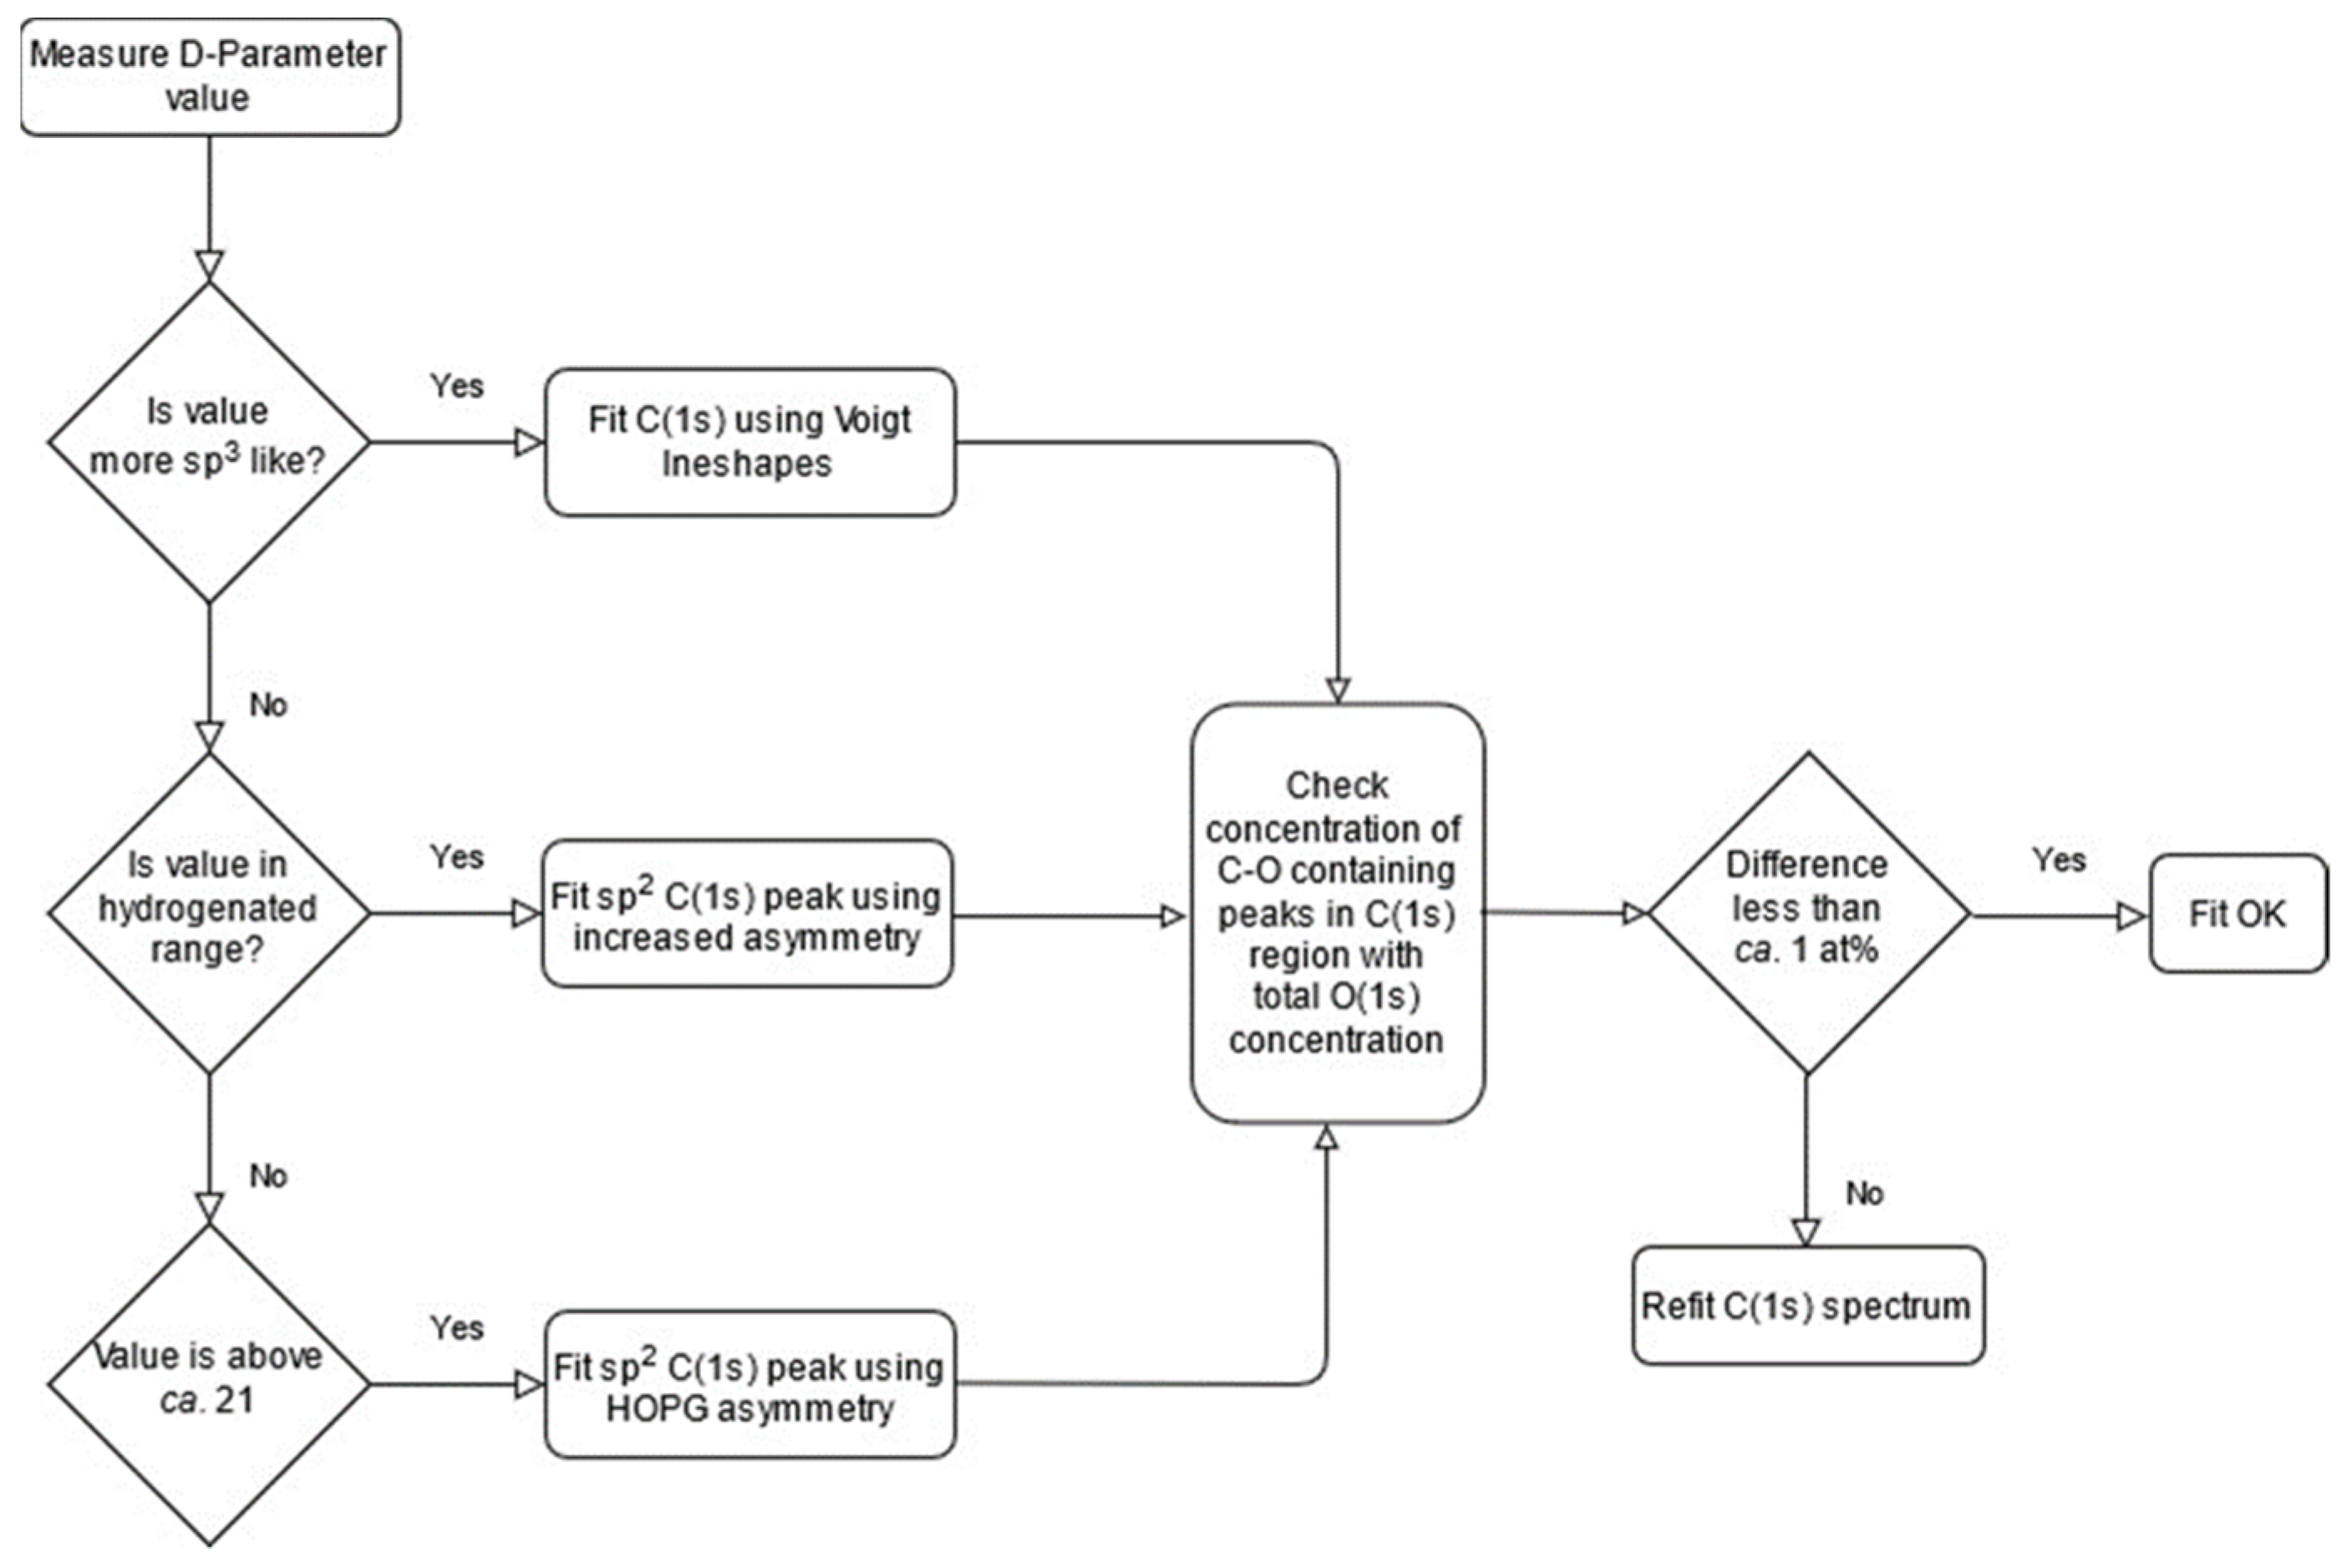
A brief overview has been presented on a systematic approach to extracting chemical information for the functionalities on graphitic carbons. Using the logical approach and, where applicable, parameters discussed herein, using the O (1s) spectrum in a complimentary manner, then an algorithmicized approach to fitting, such as that shown in Figure 6, will lead to more reliable and meaningful chemical speciation being extracted from the C (1s) spectrum of the carbon material for functionalized carbon such as graphitic and fullerene materials [34,35].
Funding
The EPSRC is acknowledged for funding the National Facility for XPS (HarwellXPS), operated by Cardiff University and UCL, under contract number PR16195.
Institutional Review Board Statement
Not applicable.
Data Availability Statement
Data sharing is not applicable to this article as no new data were created or analyzed in this study.
Conflicts of Interest
The author declares no conflict of interest.
References
- Cazorla-Amorós, D. Grand challenges in carbon-based materials research. Front. Mater. 2014, 1. [Google Scholar] [CrossRef] [Green Version]
- Blanchard, N.P.; Hatton, R.A.; Silva, S.R.P. Tuning the work function of surface oxidised multi-wall carbon nanotubes via cation exchange. Chem. Phys. Lett. 2007, 434, 92–95. [Google Scholar] [CrossRef]
- Butenko, Y.V.; Krishnamurthy, S.; Chakraborty, A.K.; Kuznetsov, V.L.; Dhanak, V.R.; Hunt, M.R.C.; Šiller, L. Photoemission study of onionlike carbons produced by annealing nanodiamonds. Phys. Rev. BCondens. Matter Mater. Phys. 2005, 71. [Google Scholar] [CrossRef] [Green Version]
- Raffa, V.; Ciofani, G.; Nitodas, S.; Karachalios, T.; D’Alessandro, D.; Masini, M.; Cuschieri, A. Can the properties of carbon nanotubes influence their internalization by living cells? Carbon 2008, 46, 1600–1610. [Google Scholar] [CrossRef]
- Jeong, H.K.; Yun, P.L.; Lahaye, R.J.W.E.; Park, M.H.; Kay, H.A.; Ick, J.K.; Yang, C.W.; Chong, Y.P.; Ruoff, R.S.; Young, H.L. Evidence of graphitic AB stacking order of graphite oxides. J. Am. Chem. Soc. 2008, 130, 1362–1366. [Google Scholar] [CrossRef]
- An, K.H.; Yang, C.M.; Seo, K.; Park, K.A.; Lee, Y.H. A diameter-dependent separation of semiconducting from metallic single-wall carbon nanotubes by using nitronium ions. Curr. Appl. Phys. 2006, 6. [Google Scholar] [CrossRef]
- Cheung, T.T.P. X-ray photoemission of carbon: Lineshape analysis and application to studies of coals. J. Appl. Phys. 1982, 53, 6857–6862. [Google Scholar] [CrossRef]
- Ouyang, Y.; Peng, J.C.; Wang, H.; Peng, Z.H. The rehybridization of electronic orbitals in carbon nanotubes. Chinese Phys. B 2008, 17, 3123–3129. [Google Scholar] [CrossRef]
- Chen, X.; Wang, X.; Fang, D. A review on C1s XPS-spectra for some kinds of carbon materials. Full- Nanotub. Carbon Nanostructures 2020, 28, 1048–1058. [Google Scholar] [CrossRef]
- Fairley, N.; Fernandez, V.; Richard-Plouet, M.; Guillot-Deudon, C.; Walton, J.; Smith, E.; Flahaut, D.; Greiner, M.; Biesinger, M.; Tougaard, S.; et al. Systematic and collaborative approach to problem solving using X-ray photoelectron spectroscopy. Appl. Surf. Sci. Adv. 2021, 5, 100112. [Google Scholar] [CrossRef]
- Gengenbach, T.R.; Major, G.H.; Linford, M.R.; Easton, C.D. Practical guides for x-ray photoelectron spectroscopy (XPS): Interpreting the carbon 1s spectrum. J. Vac. Sci. Technol. A 2021, 39, 013204. [Google Scholar] [CrossRef]
- Kaciulis, S. Spectroscopy of carbon: From diamond to nitride films. Surf. Interface Anal. 2012, 44, 1155–1161. [Google Scholar] [CrossRef]
- Kaciulis, S.; Mezzi, A.; Calvani, P.; Trucchi, D.M. Electron spectroscopy of the main allotropes of carbon. Surf. Interface Anal. 2014, 46, 966–969. [Google Scholar] [CrossRef]
- Blume, R.; Rosenthal, D.; Tessonnier, J.P.; Li, H.; Knop-Gericke, A.; Schlögl, R. Characterizing Graphitic Carbon with X-ray Photoelectron Spectroscopy: A Step-by-Step Approach. Chem Cat Chem 2015, 7, 2871–2881. [Google Scholar] [CrossRef] [Green Version]
- Major, G.H.; Avval, T.G.; Moeini, B.; Pinto, G.; Shah, D.; Jain, V.; Carver, V.; Skinner, W.; Gengenbach, T.R.; Easton, C.D.; et al. Assessment of the frequency and nature of erroneous x-ray photoelectron spectroscopy analyses in the scientific literature. J. Vac. Sci. Technol. A 2020, 38, 061204. [Google Scholar] [CrossRef]
- Merlen, A.; Buijnsters, J.G.; Pardanaud, C. A guide to and review of the use of multiwavelength Raman spectroscopy for characterizing defective aromatic carbon solids: From graphene to amorphous carbons. Coatings 2017, 7, 153. [Google Scholar] [CrossRef]
- Wu, J.B.; Lin, M.L.; Cong, X.; Liu, H.N.; Tan, P.H. Raman spectroscopy of graphene-based materials and its applications in related devices. Chem. Soc. Rev. 2018, 47, 1822–1873. [Google Scholar] [CrossRef] [Green Version]
- Ferrari, A.C.; Robertson, J. Raman spectroscopy of amorphous, nanostructured, diamond-like carbon, and nanodiamond. Philos. Trans. R. Soc. A Math. Phys. Eng. Sci. 2004, 362, 2477–2512. [Google Scholar] [CrossRef]
- Lascovich, J.C.; Scaglione, S. Comparison among XAES, PELS and XPS techniques for evaluation of Sp2 percentage in a-C:H. Appl. Surf. Sci. 1994, 78, 17–23. [Google Scholar] [CrossRef]
- Lascovich, J.C.; Giorgi, R.; Scaglione, S. Evaluation of the sp2/sp3 ratio in amorphous carbon structure by XPS and XAES. Appl. Surf. Sci. 1991, 47, 17–21. [Google Scholar] [CrossRef]
- Lascovich, J.C.; Santoni, A. Study of the occupied electronic density of states of carbon samples by using second derivative carbon KVV Auger spectra. Appl. Surf. Sci. 1996, 103, 245–253. [Google Scholar] [CrossRef]
- Lascovich, J.C.; Rosato, V. Analysis of the electronic structure of hydrogenated amorphous carbon via Auger spectroscopy. Appl. Surf. Sci. 1999, 152, 10–18. [Google Scholar] [CrossRef]
- Barlow, A.J.; Scott, O.; Sano, N.; Cumpson, P.J. Multivariate auger feature imaging (MAFI): A new approach towards chemical state identification of novel carbons in XPS imaging. Surf. Interface Anal. 2015, 47, 173–175. [Google Scholar] [CrossRef]
- Barlow, A.J.; Popescu, S.; Artyushkova, K.; Scott, O.; Sano, N.; Hedley, J.; Cumpson, P.J. Chemically specific identification of carbon in XPS imaging using Multivariate Auger Feature Imaging (MAFI). Carbon 2016, 107, 190–197. [Google Scholar] [CrossRef] [Green Version]
- Tanuma, S.; Powell, C.J.; Penn, D.R. Calculations of electron inelastic mean free paths. V. Data for 14 organic compounds over the 50–2000 eV range. Surf. Interface Anal. 1994, 21, 165–176. [Google Scholar] [CrossRef]
- Morgan, D.J. Cluster cleaned HOPG by XPS. Surf. Sci. Spectra 2017, 24, 024003. [Google Scholar] [CrossRef]
- Lesiak, B.; Kövér, L.; Tóth, J.; Zemek, J.; Jiricek, P.; Kromka, A.; Rangam, N. C sp2 /sp3 hybridisations in carbon nanomaterials—XPS and (X)AES study. Appl. Surf. Sci. 2018, 452, 223–231. [Google Scholar] [CrossRef]
- Xpssimplified. Available online: https://xpssimplified.com/elements/carbon.php (accessed on 21 June 2021).
- Beamson, G.; Briggs, D. (Eds.) High Resolution XPS of Organic Polymers: The Scienta ESCA300 Database; Wiley & Sons: Chichester, UK, 1992; p. 267. [Google Scholar]
- Theodosiou, A.; Spencer, B.F.; Counsell, J.; Jones, A.N. An XPS/UPS study of the surface/near-surface bonding in nuclear grade graphites: A comparison of monatomic and cluster depth-profiling techniques. Appl. Surf. Sci. 2020, 508. [Google Scholar] [CrossRef]
- Malitesta, C.; Losito, I.; Sabbatini, L.; Zambonin, P.G. Applicability of chemical derivatization—X-ray photoelectron spectroscopy (CD-XPS) to the characterization of complex matrices: Case of electrosynthesized polypyrroles. J. Electron Spectros. Relat. Phenom. 1998, 97, 199–208. [Google Scholar] [CrossRef]
- Pippig, F.; Sarghini, S.; Holländer, A.; Paulussen, S.; Terrvn, H. TFAA chemical derivatization and XPS. Analysis of OH and NHx polymers. Surf. Interface Anal. 2009, 41, 421–429. [Google Scholar] [CrossRef]
- Burgess, R.; Buono, C.; Davies, P.R.; Davies, R.J.; Legge, T.; Lai, A.; Lewis, R.; Morgan, D.J.; Robinson, N.; Willock, D.J. The functionalisation of graphite surfaces with nitric acid: Identification of functional groups and their effects on gold deposition. J. Catal. 2015, 323, 10–18. [Google Scholar] [CrossRef] [Green Version]
- Fortner, J.D.; Kim, D.I.; Boyd, A.M.; Falkner, J.C.; Moran, S.; Colvin, V.L.; Hughes, J.B.; Kim, J.H. Reaction of water-stable C60 aggregates with ozone. Environ. Sci. Technol. 2007, 41, 7497–7502. [Google Scholar] [CrossRef] [PubMed]
- Weippert, J.; Ulas, S.; Waldt, E.; Amati, M.; Gregoratti, L.; Kiskinova, M.; Böttcher, A. C 68: A non-IPR fullerene capable of binding extraordinary amounts of Cs atoms. Fuller. Nanotub. Carbon Nanostructures 2019, 27, 206–214. [Google Scholar] [CrossRef]
Figure 1.
Overlayed C (1s) core level for diamond (red spectra) and HOPG (green spectra) with inset of the graphitic satellite structure.
Figure 1.
Overlayed C (1s) core level for diamond (red spectra) and HOPG (green spectra) with inset of the graphitic satellite structure.

Figure 2.
(a) C (1s) core-level and (b) survey spectra for HOPG, and hydrogenated “nano-onion” carbons illustrating the influence of hydrogenation on the C (1s) spectra.
Figure 2.
(a) C (1s) core-level and (b) survey spectra for HOPG, and hydrogenated “nano-onion” carbons illustrating the influence of hydrogenation on the C (1s) spectra.

Figure 3.
Plot of XPS-derived D-parameter (values taken from [19,20,21,22]) and the first differential of the C (KVV) Auger for diamond and clean HOPG indicating the XPS-derived D-parameter.

Figure 4.
Overlayed data for (a) C (1s) core-level, (b) C (KVV) Auger and (c) first derivative C (KVV) spectra for freshly cleaved (red) and argon cluster cleaned (green) HOPG.
Figure 4.
Overlayed data for (a) C (1s) core-level, (b) C (KVV) Auger and (c) first derivative C (KVV) spectra for freshly cleaved (red) and argon cluster cleaned (green) HOPG.

Figure 5.
Fitted (a) C(1s) and unfitted (b) O (1s) spectra for an oxidized graphitic carbon.

Figure 6.
Methodology for the fitting of carbon materials described as a flowchart.


Table 1.
D-parameter values for cluster cleaned HOPG determined by different software and methods.
| Software | Method | Parameters Used | D-Parameter/eV |
|---|---|---|---|
| Thermo Scientific Avantage v5.9925 | D-parameter in-built routine | Gaussian, Smooth width 2, Differentiation width 1 | 24.0 |
| Savitsky–Golay, Smooth width 2, Differentiation width 1 | 24.0 | ||
| Moving Average, Smooth width 2, Differentiation width 1 | 24.0 | ||
| Wiener, Smooth width 2, Differentiation width 1 | 22.5 | ||
| Gaussian, Smooth width 2, Differentiation width 1, Quartic Fit | 23.5 | ||
| Savitsky–Golay, Smooth width 2, Differentiation width 1, Quartic Fit | 23.5 | ||
| Moving Average, Smooth width 2, Differentiation width 1, Quartic Fit | 23.5 | ||
| Wiener, Smooth width 2, Differentiation width 1, Quartic Fit | 23.0 | ||
| CasaXPS v2.3.24 | Polynomial regression followed by “SP” background type | “PR” background with value of 35, Differentiation of synthetic envelope | 24.5 |
| “PR” background with value of 32, Differentiation of synthetic envelope | 24.0 | ||
| Differentiation followed by “SP” background type | Savitsky–Golay Quadratic smoothing width 5 | 24.5 | |
| Savitsky–Golay Quadratic smoothing width 7 | 24.0 | ||
| Savitsky–Golay Quadratic smoothing width 9 | 23.5 | ||
| Savitsky–Golay Quadratic smoothing width 15 | 23.5 |
Table 2.
Typical ranges for C (1s) species relative to graphitic carbon at 284.5 eV [29].
Table 2.
Typical ranges for C (1s) species relative to graphitic carbon at 284.5 eV [29].
| Speciation | Binding Energy Range Relative to 284.5 eV |
|---|---|
| C-C/C-H | 284.8–285.5 |
| C-O-C/C-OH | 286.0–287.0 |
| R-C = O/O-C-O | 287.5–288.5 |
| O-C = O/CO3 | 288.5–289.0 |
| R-(CO)-O-(CO)-R | 289.0–290.0 |
| R-O-(CO)-O-R | 290.0–295.5 |
| CF/Cl | 286.5–287.5 |
| CF2 | 290.0–291.0 |
| CF3 | 291.0–292.0 |
Publisher’s Note: MDPI stays neutral with regard to jurisdictional claims in published maps and institutional affiliations. |
© 2021 by the author. Licensee MDPI, Basel, Switzerland. This article is an open access article distributed under the terms and conditions of the Creative Commons Attribution (CC BY) license (https://creativecommons.org/licenses/by/4.0/).
Share and Cite
MDPI and ACS Style
Morgan, D.J. Comments on the XPS Analysis of Carbon Materials. C 2021, 7, 51. https://0-doi-org.brum.beds.ac.uk/10.3390/c7030051
AMA Style
Morgan DJ. Comments on the XPS Analysis of Carbon Materials. C. 2021; 7(3):51. https://0-doi-org.brum.beds.ac.uk/10.3390/c7030051
Chicago/Turabian StyleMorgan, David J. 2021. "Comments on the XPS Analysis of Carbon Materials" C 7, no. 3: 51. https://0-doi-org.brum.beds.ac.uk/10.3390/c7030051
Note that from the first issue of 2016, this journal uses article numbers instead of page numbers. See further details here.