
Ab Initio Study of Porous Graphene–CNT Silicon Composite for Li-Ion and Na-Ion Batteries


1
Institute of Physics, Saratov State University, Astrakhanskaya Street 83, 410012 Saratov, Russia
2
Laboratory of Biomedical Nanotechnology, I.M. Sechenov First Moscow State Medical University, Trubetskaya Street 8-2, 119991 Moscow, Russia
*
Author to whom correspondence should be addressed.
C 2021, 7(3), 57; https://0-doi-org.brum.beds.ac.uk/10.3390/c7030057
Submission received: 30 June 2021
/
Revised: 23 July 2021
/
Accepted: 27 July 2021
/
Published: 29 July 2021
(This article belongs to the Collection Nanoporous Carbon Materials for Advanced Technological Applications)
Abstract
:In this work, we investigated composite materials based on graphene and carbon nanotubes with a silicon cluster from the standpoint of using them as Li-ion battery (LIB) and Na-ion battery (NIB) anodes. For our study, we used the density functional theory method, taking into account the van der Waals interaction. The cavities of the composite were filled with lithium and sodium, and the energy characteristics of the structure were calculated through SIESTA molecular dynamics. The calculations showed the negative energy of adsorption for lithium and sodium and the negative value of the heat of formation of the composites. The introduction of a silicon cluster led to an increase in the specific capacity by 22.2% for the sodium and 37% for the lithium in comparison with the pure composite. The calculation of the transmission function showed a decrease in the resistance of the composite when a silicon cluster was added to the composite. We predict that the application of the considered composite will increase the efficiency of existing lithium-ion and sodium-ion batteries.
1. Introduction
At the moment, there are a lot of studies on Li-ion batteries (LIBs) with graphene-based anodes [1,2,3,4]. The theoretical capacity of a graphite anode is 372 mAh/g (LiC6). At the same time, graphene is one of the graphite layers, and its theoretical capacity is 1116 mAh/g [5]. The outstanding properties of graphene in terms of mechanical strength and electrical conductivity are some of the key factors when choosing this material for application in LIBs. In this case, the battery’s resistance to high charging and discharging currents will increase, and the number of charge-discharge cycles will also increase. Furthermore, there will be a significant increase in the capacity. Aside from Li, Na is a promising candidate for graphene-based metal-ion batteries. Since Na is located below Li in the first group of the periodic table, these two chemical elements show similar properties, and they have one valence electron. The use of graphite as an anode material for Na-ion batteries (NIBs) is impractical. Since the capacity of the anode is extremely low and amounts to approximately 35 mAh/g, there are 64 carbon atoms per Na ion (NaC64) [6]. There is an opinion that Na ions cannot fit between the layers of graphite, which leads to a low capacity. However, potassium ions have a larger ion radius (1.38 Å) than Na (1.02 Å) and can intercalate into graphite as freely as Li (0.76 Å). This contradictory phenomenon is explained [7] by the fact that the attractive interaction between Na ions and graphite layers is very weak, and there is not enough energy to produce intercalation [8]. In addition, on the basis of the density functional theory (DFT) while taking into account the van der Waals interaction, it was found that for the compounds NaC6 or NaC8, the heat of formation was positive, but it was negative for the compound LiC6 [9]. This proves that the formation of NaC6 or NaC8 compounds in graphite layers is energetically unfavorable, but they are beneficial for LiC6, as can be observed in experiments, whereas due to the limited resources of Li in nature [10,11], NIBs can act as an inexpensive and effective replacement for LIBs. In some cases, Na exceeds Li in its electrochemical properties. For example, it was shown that the diffusion energy barriers for the elements Li and Na on silicene are 0.21 and 0.12 eV, respectively [12]. Additionally, the energy barriers to diffusion for the Na atom in the zigzag and armchair directions of single-layer black phosphorene are 0.04 and 0.38 eV, respectively, while the corresponding energy diffusion barriers for a Li atom in the zigzag and armchair directions are 0.08 and 0.68 eV, respectively [13,14]. In [15], using 2D materials as electrodes, NIBs showed a higher charge-discharge rate than LIBs. Nevertheless, Li surpasses Na in terms of cell voltage and power density [16]. Researchers are paying increased attention to silicon-based anodes in addition to the promising applications of graphene in LIBs and NIBs. The maximum possible theoretical capacity of Si-Li intermetallic states is 4200 mAh/g (Li4.4Si). However, this capacity is accompanied by a colossal increase in the volume of the original pure silicon, which rapidly destroys the silicon anode [17]. The solution to this problem is to contain the volume of the silicon during lithiation and delithiation (charge and discharge) in such conductive frames as carbon nanotubes (CNTs) and graphene. In [18], the process of silicon being kept inside CNTs and twisted graphene sheets was considered by the molecular dynamics of Lammps [19]. The authors reported an obtained capacity above 1300 mAh/g and the significant stabilizing role of the carbon structures in such systems. In addition, in [20], the researchers prepared real samples of a carbon–silicon composite based on single-layer pillared graphene and silicon by the method of one-stage chemical vapor deposition (CVD) with the intercalation of a mixture of precursor gases (H2, C2H4). A layer of amorphous silicon was added to the already grown 3D carbon nanostructure by sputtering and evaporation.
Thus, the synergy of silicon and carbon for LIB and NIB anodes requires a theoretical study of its parameters, such as stability, energy efficiency, specific capacity and electrical conductivity. This work studies the process of intercalation of Li and Na into the CNT–graphene–silicon composite and estimates the energy stability and conductivity of the obtained composites through the density functional theory of the SIESTA method.
2. Materials and Methods
The search for a ground state as well as calculations of the total energy, density of states and conducting properties were performed by the density functional theory method using SIESTA 4.1.5 software [21,22], with application of the basis set with double ζ+ polarization (DZP). The Berland and Hildgaard exchange functional vdW-DF-cx [23] was used to describe the exchange-correlation energy between the interacting electrons and take into account the van der Waals interaction. This exchange functional has shown good accuracy for a wide range of materials [24]. Molecular dynamics SIESTA was started with temperature control using a Nose thermostat with an initial temperature of 500 K and a final temperature of 300 K. The total energy was minimized using a modified Broyden algorithm [25] and Pulay-type corrections. The optimization process was completed when the force acting on each atom became less than 0.04 eV/Å. The Monkhorst–Pack method with a 3 × 3 × 1 grid was used to sample k points in the Brillouin zone and plot the density of the electronic states. To calculate the transmission function, the ab initio method of nonequilibrium Green’s functions (NEGF) TranSiesta [26] was used. The calculation of the transport properties took place in three stages, during which the surface Green’s functions of the unbound semi-infinite left and right electrodes were obtained, and then the Green’s function of the “device” (the considered structure) was obtained from the effective Hamiltonian of the scattering region. The electrodes presented the same atomic supercells as the structure of the “device”. In calculating the transmission function, we used the SZ basis, since this calculation required a threefold increase in the number of atoms in the system (left and right electrodes) as well as the scattering region. In our case, calculating the transport properties took into account the van der Waals interaction, and the number of atoms reached 1200. All that greatly complicated the calculations even in the SZP basis, so calculation in the DZP basis with the Monkhorst–Pack 3 × 1 × 3 grid was even more complicated. Using a smaller basis would undoubtedly affect the accuracy of the calculations, but it would be possible to evaluate the results qualitatively. Our self-consistent calculations used a grid cut-off of 350 Ry. The cell length including the two electrodes was 63.9 Å in the z-direction. We used 121 k-points in the X-direction (i.e., perpendicular to the current transfer).
3. Results and Discussion
3.1. Atomistic Models
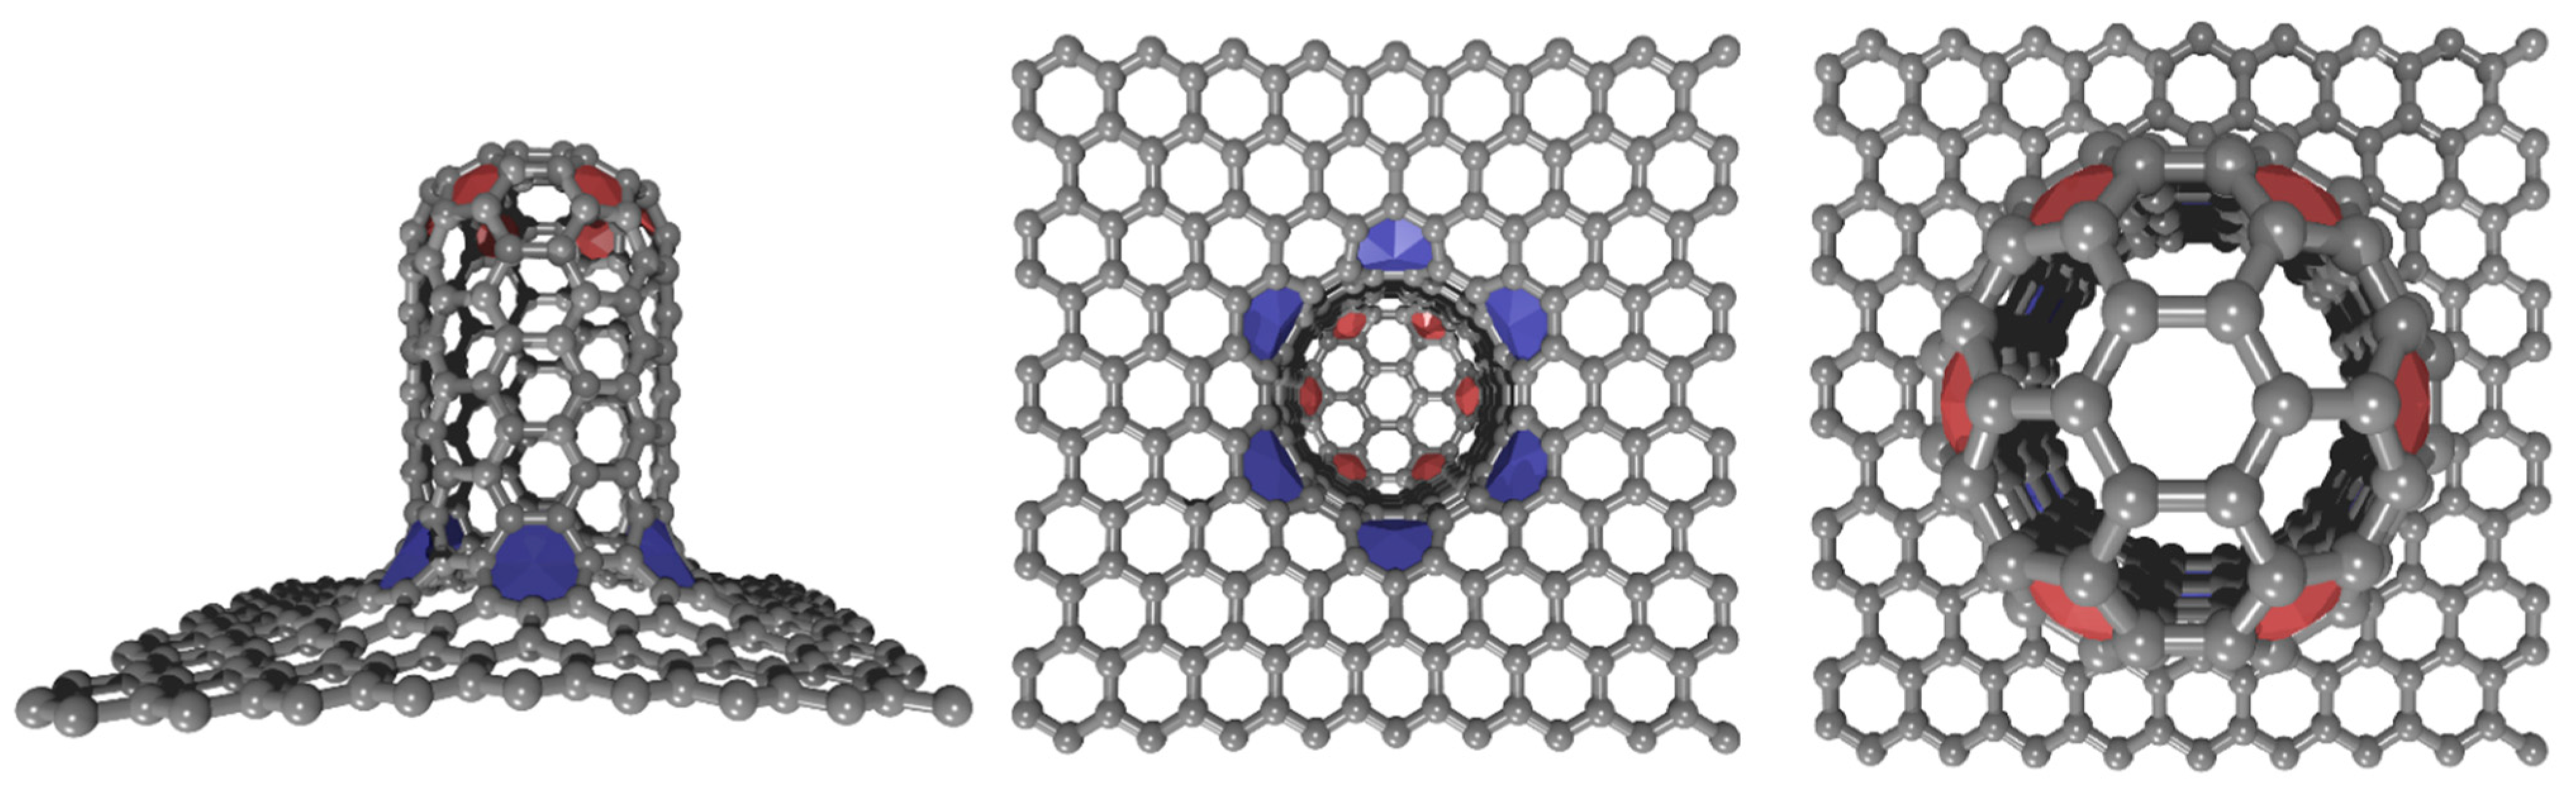
Figure 1 shows the supercell of a graphene-based composite with a closed vertically oriented CNT (6,6). The translation vectors of the supercell were 22.14 Å and 21.30 Å, and the number of atoms was 288. There were six octagons (blue areas) and six pentagons (red areas) near the place of contact between the graphene and the CNTs. The supercell was obtained by first cutting a hole in the graphene along the CNT diameter. Then, after optimization, the CNT and graphene formed chemical bonds at the place of contact. The graphene sheet contained 156 atoms, and the CNT contained 132 atoms. The heat of the supercells’ formation was calculated by Equation (1):
where is the total energy of the supercell and and are the total energy of the graphene (with a hole) and closed CNTs (6,6), respectively.
The heat of formation of the supercell was negative and amounted to −0.2241 eV/atom. Closed tubes (6,6) were obtained [27] earlier in the experimental work which proved its energy stability. In this regard, the choice of CNTs with chirality (6,6) was determined.
Figure 2 shows the charge distribution in the considered supercell. As can be seen in the regions of defects and curvature of the atomic structure, there was charge redistribution over the atoms, and this distribution is the most noticeable in the area of contact between the graphene and the CNTs. The graphene sheet and the first row of CNT atoms (orange) reported 0.162 electrons to the far layers of the tube. Thus, the graphene sheet and the first row of CNT atoms lacked 0.162 electrons.
3.2. MD and Geometry Relaxation
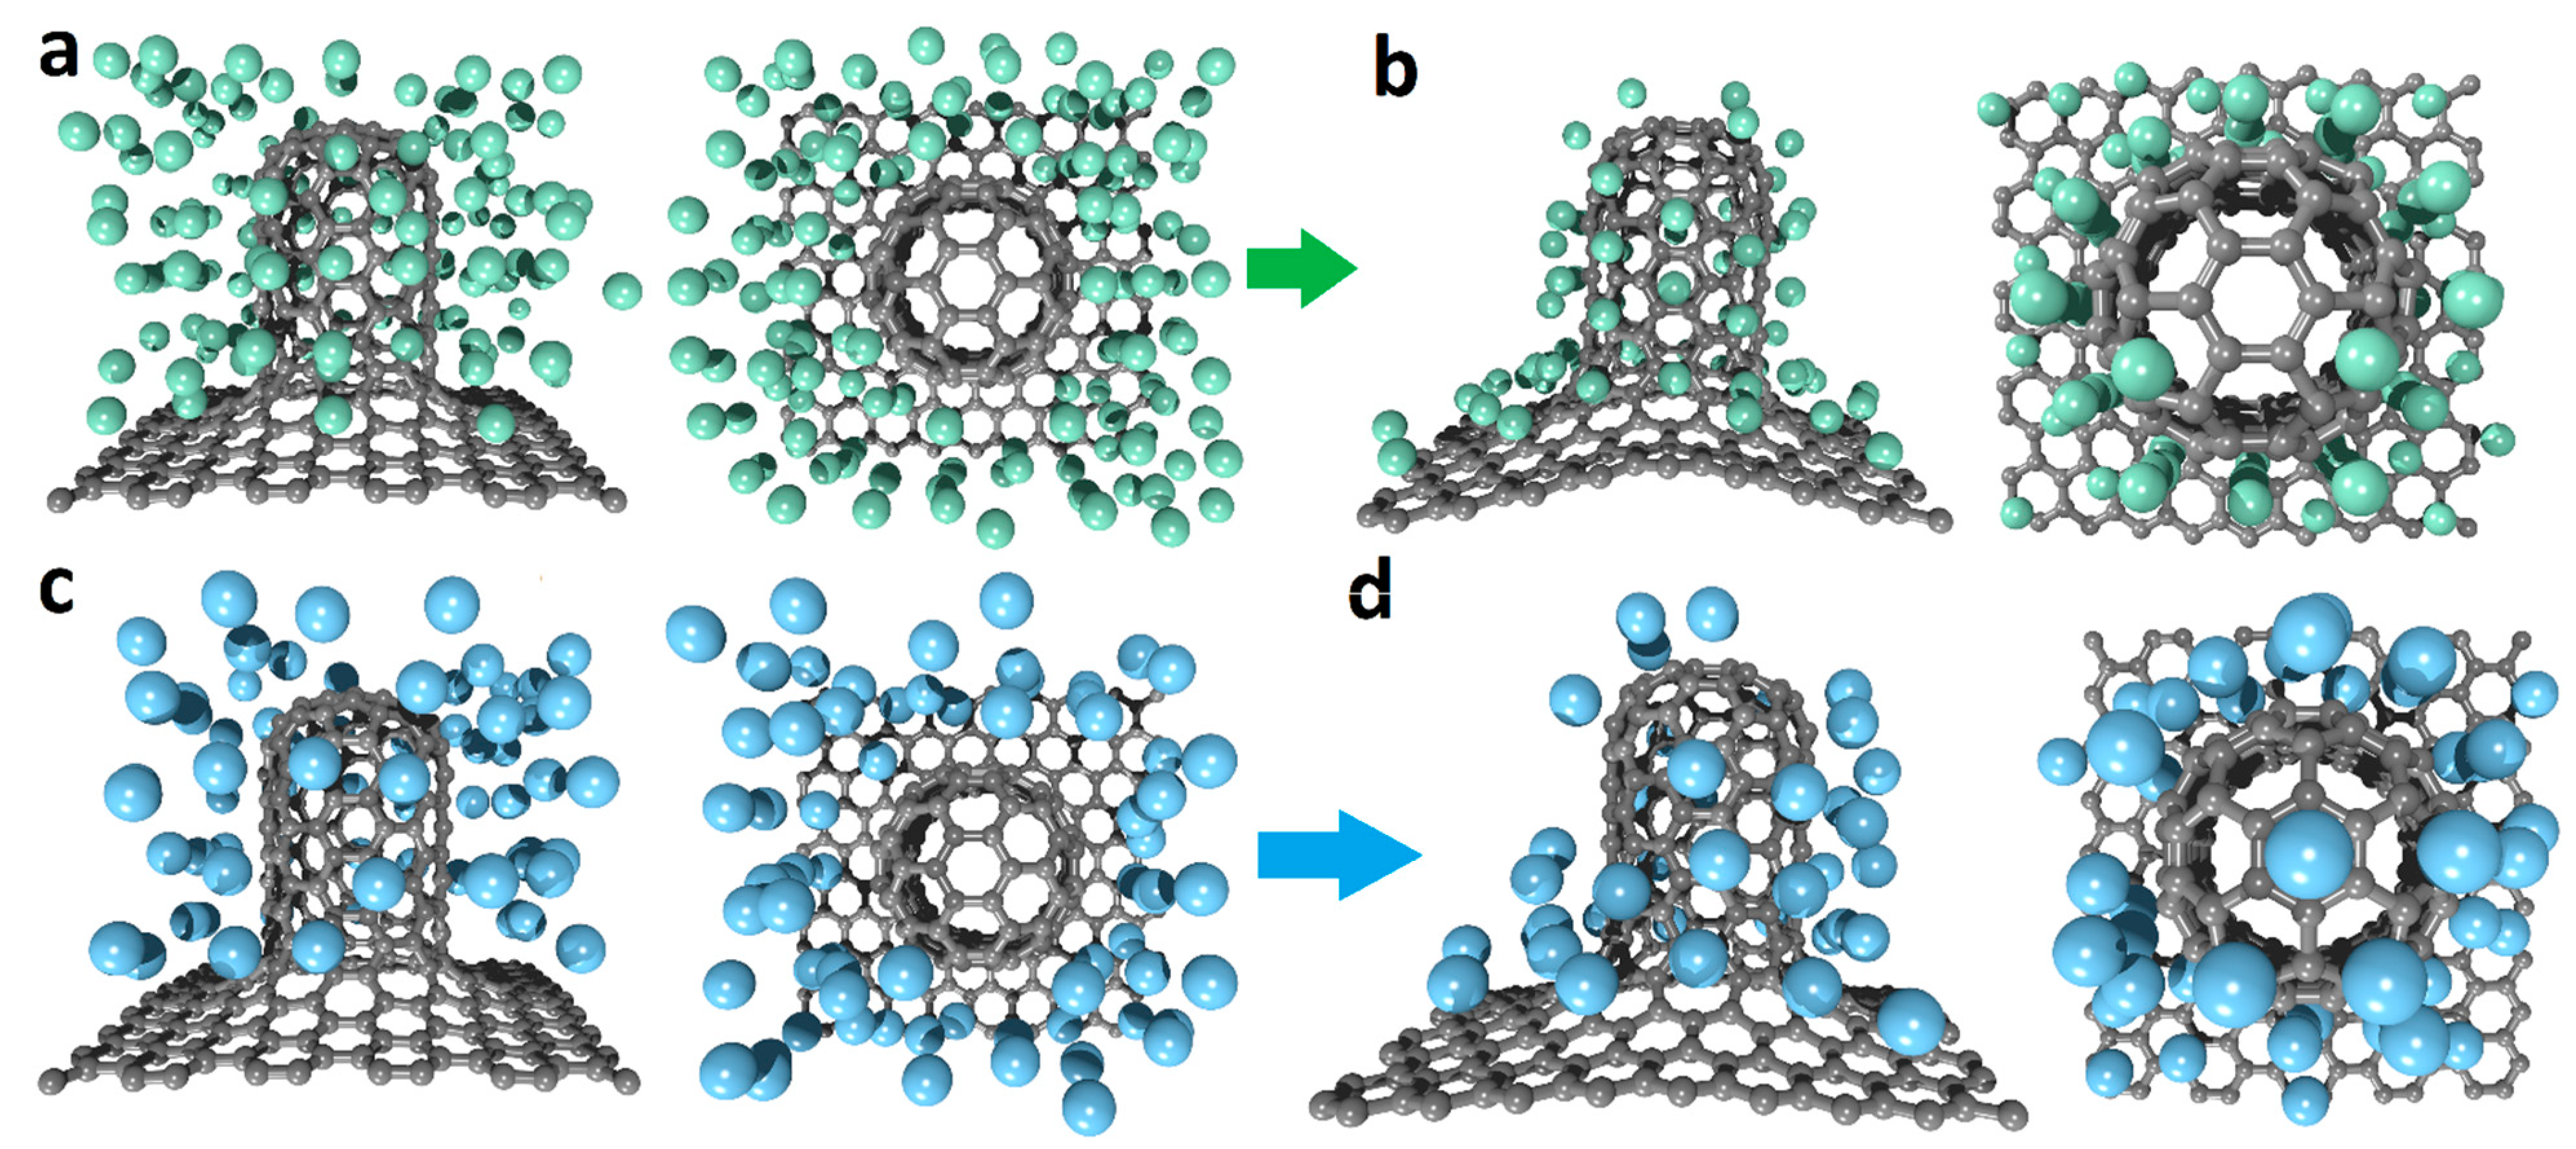
In order to fill the supercells with Li and Na, we used an algorithm to fill the free space of the supercell with atoms and clusters of various elements at a strictly defined distance, taking into account the translation vectors. After the MD process, the Li and Na atoms which did not form a bond with the carbon were removed from the system. At the next stage, the process of geometric relaxation of the obtained structures with searching for the minimum of the system’s total energy was held. Figure 3 shows the process of composite filling with Li (green) and Na (blue) and its equilibrium structures. The amount of Li in the cell in Figure 3b is 62 atoms, while the amount of Na in Figure 3d is 42 atoms. To reveal the stability of the structures, we calculated the adsorption energies of Li and Na [28]:
where is the total energy of the supercell, is the total energy of a pure graphene–CNT composite, is the energy of isolated Li or Na and n is the amount of Li or Na.
The results of the adsorption energy of Li were −1.216 eV/atom, while for Na it was −1.090 eV/atom. As can be seen from the results, the adsorption energy had a negative value, which is quite expected for Li since graphene (graphite) layers are widely used in LIBs. The negative value of the Na adsorption mentions the energy stability of such composite structures in NIBs, which is difficult to obtain using graphite. Therefore, this value gives hope for the efficiency of such anodes in real NIBs.
Furthermore, we estimated the specific capacity of the obtained structures using the formula for calculating the Faraday capacity [7]:
where n is the number of transferred electrons, F is the Faraday constant (96,485 C/mol) and M is the molecular mass of the active material. This was 484.4 mAh/g for the structure with Li, and it was 325.3 mAh/g for the Na structure. For the composites with Li and Na, the obtained capacities were higher than the capacities of graphite. Moreover, the result was 30% higher for the structure with Li and even substantially higher for the structure with Na.
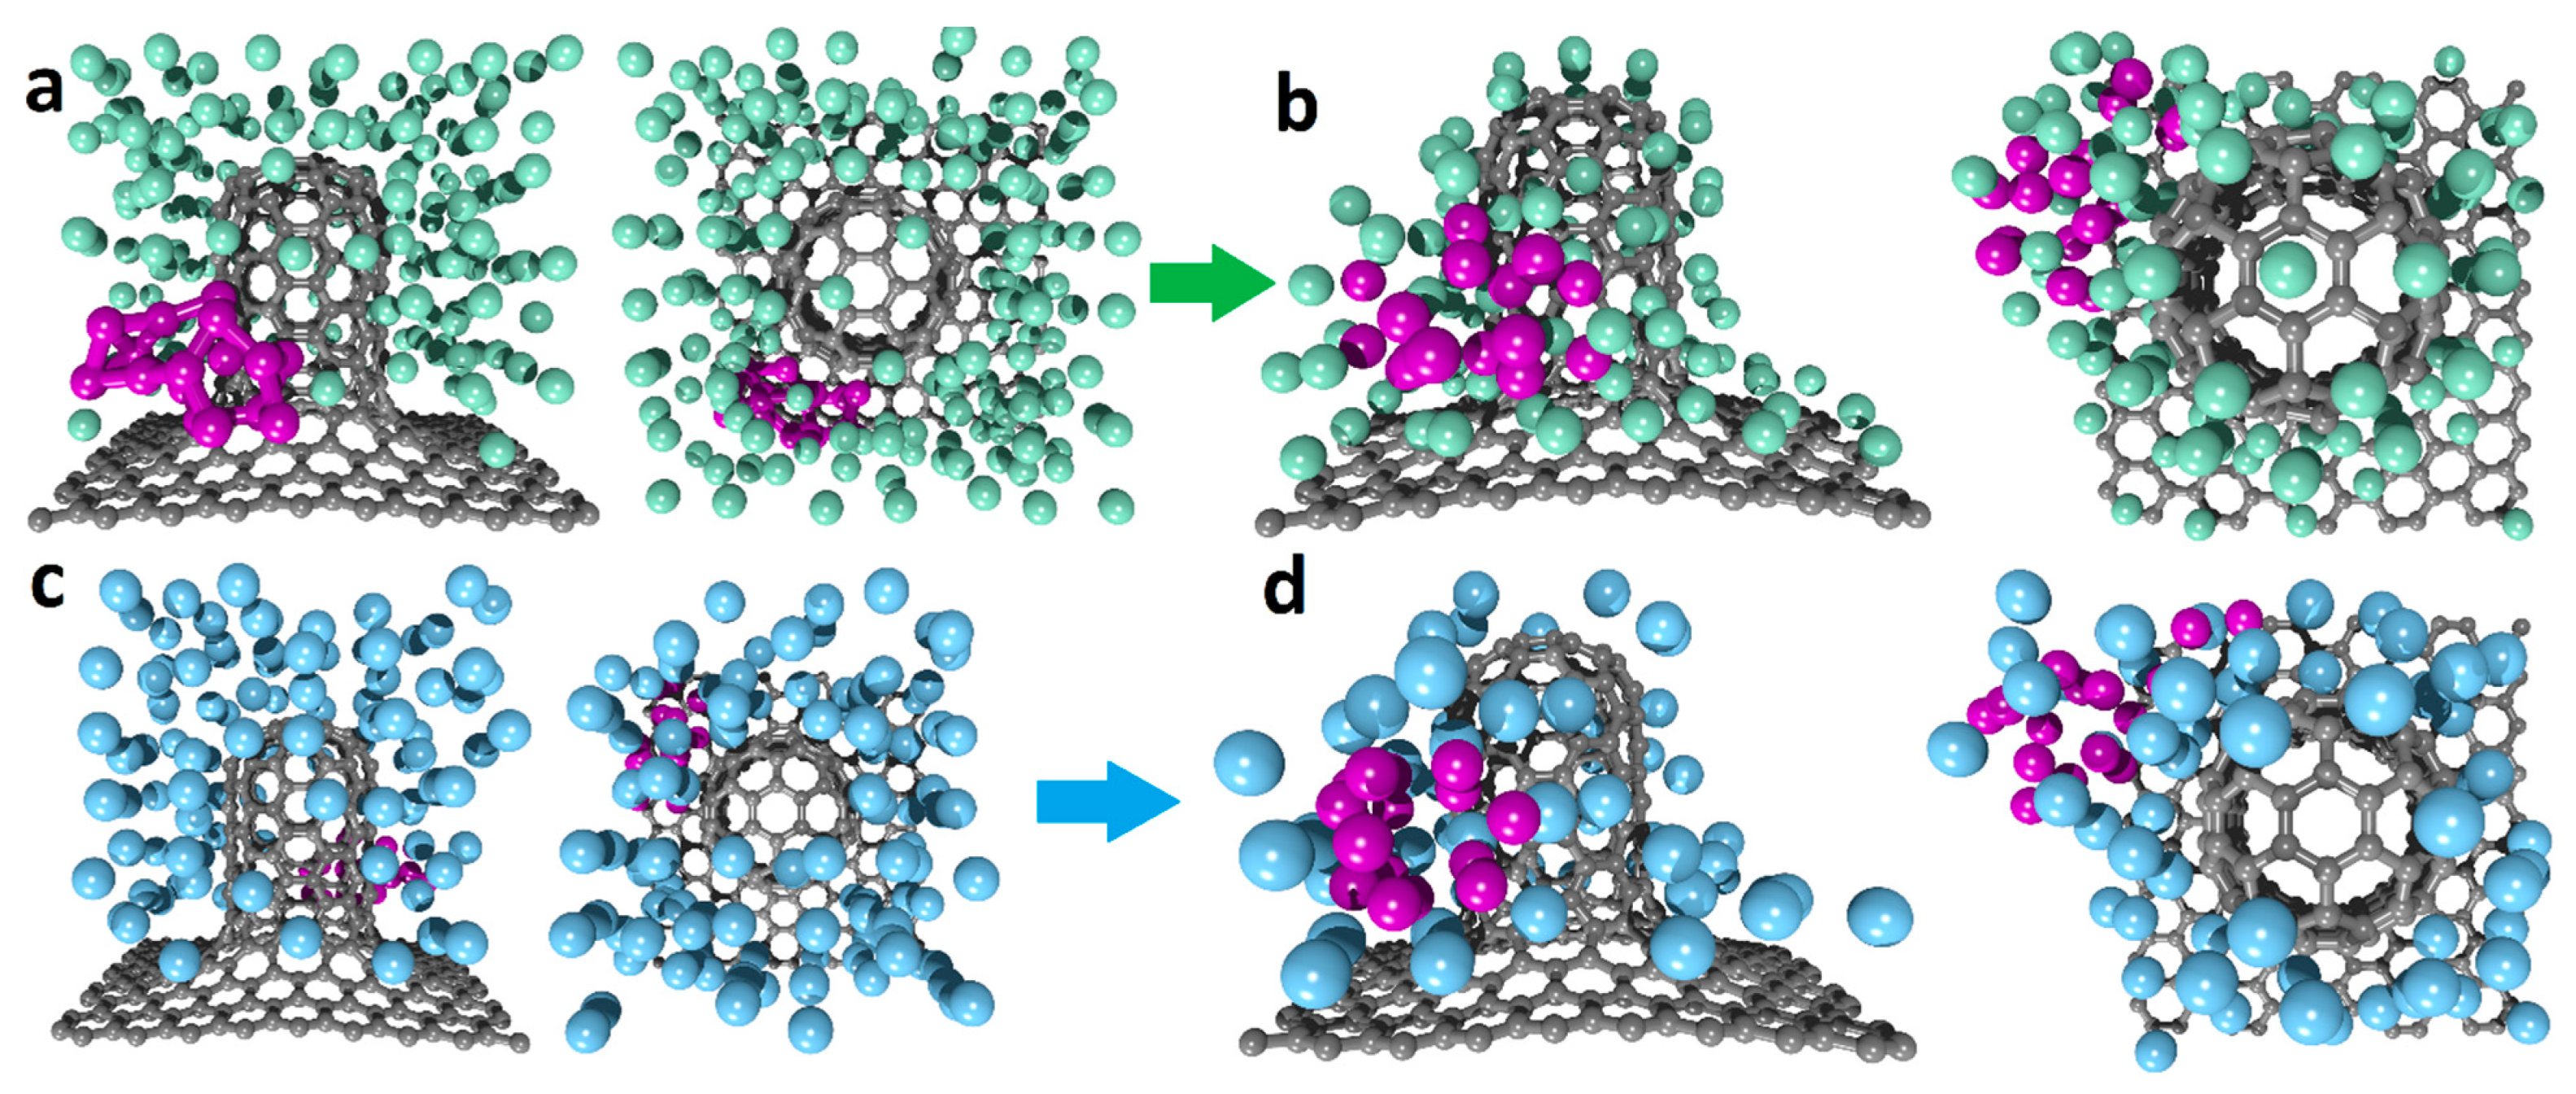
In order to increase the specific capacity, we used a silicon cluster Si16 placed in the cavity of the composite. As follows from [29,30], the Si16 clusters were the most stable, and therefore they were used in this work. After optimization of the graphene–CNT composite with the silicon cluster, the heat of formation of the structure was calculated and amounted to −0.0972 eV/atom. Figure 4 shows a composite with a silicon cluster filled with Li and Na.
The adsorption energy for these structures was already −1.68 eV/atom for Li and −1.33 eV/atom for Na. The specific capacity also increased; it was 658.3 mAh/g for Li and 397.7 mAh/g for Na. Figure 4b,d shows that Li and Na penetrated into the structure of the silicon cluster and changed its original shape, thereby acquiring additional capacity. The negative value of the adsorption energy also had a positive effect on the characteristics of the composite, and this energy was lower than that of the composite without a silicon cluster.
3.3. Electronic and Transport Properties
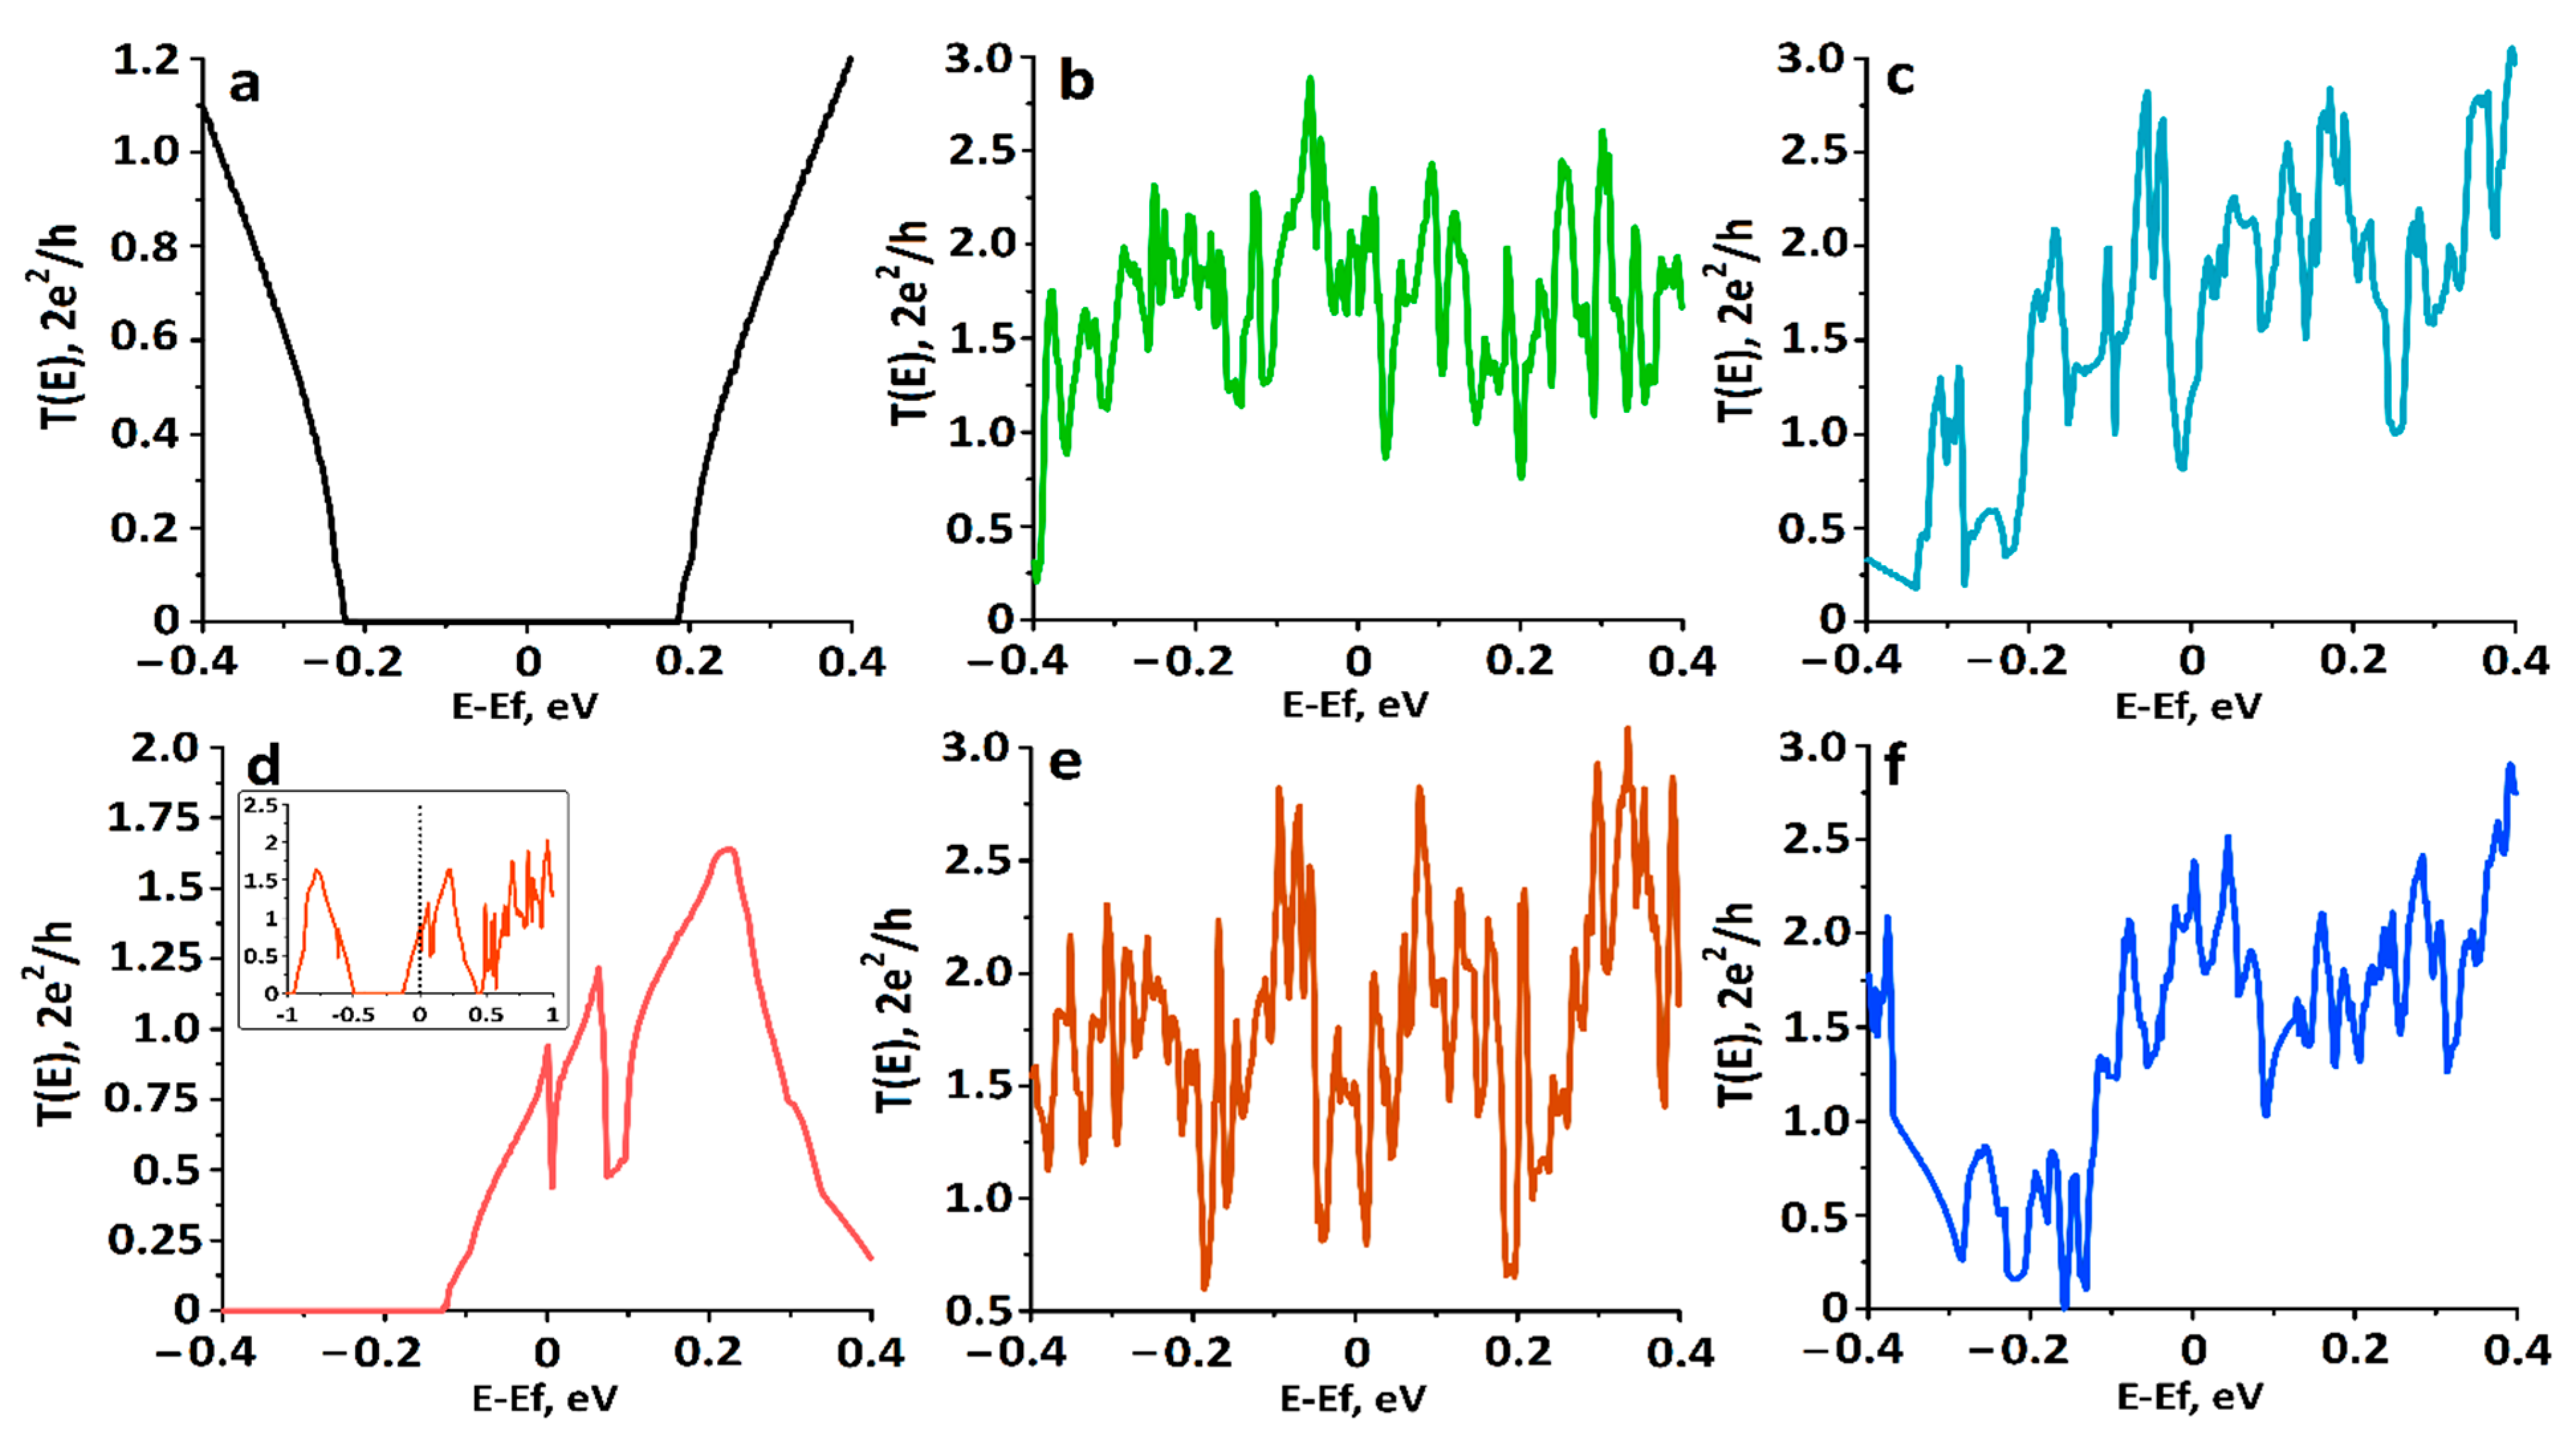
In addition to high capacity and energy stability, the LIB and NIB anode must also have good electrical conductivity; otherwise, it is impossible to pass large charge-discharge currents through such an anode. In order to identify the nature of the transport properties, we built DOS and transmission function graphs. We used the Eig2DOS program supplied with SIESTA for building this. The expanding sigma in Eig2DOS was set to 0.2, since with the basic settings, individual peaks were blurred and averaged. Figure 5 shows the DOS graphs for all cases considered.
The Fermi level in Figure 5 was shifted to zero. The graph in Figure 5a shows that the graphene–CNT composite had a band gap at the Fermi level. In this case, the structure had semiconducting properties. This behavior can be explained by going back to Figure 2 with the charge distribution. As mentioned above, the graphene sheet gave up 0.162 electrons to the CNT, and since the current flowed along the graphene sheet, the absence of 0.162 electrons affected the energy levels of the structure and caused an increase in resistance relative to an ideal graphene sheet. Figure 5d shows the DOS for the composite doped with a silicon cluster. In this case, the gap became less noticeable, and additional levels appeared in the vicinity of the Fermi level. The curves in Figure 5b,c,e,f describe the DOS for Li and Na with and without silicon. Here, the cells had additional levels near the Fermi level and showed the absence of a band gap even despite the semiconducting properties of a pure composite. The presence of a silicon cluster also affected the DOS distribution. For example, in Figure 5b, for lithium at the Fermi level, the DOS was 35 states/eV, but in the presence of silicon, it was already 52 states/eV (Figure 5e). The situation was similar with sodium. On the one hand, in the absence of silicon at the Fermi level, the DOS was 22 states/eV, with bandgap regions in the valence region at energies of −0.5 eV, −0.37 eV and −0.23 eV. With the addition of silicon (Figure 5f), the band gaps at these energies disappeared, but at the Fermi level, the DOS decreased and was 20 states/eV. For a correct assessment of the obtained composites’ conductivity, the transmission functions were calculated (Figure 6).
In Figure 6a,d, the positive effect of the silicon cluster on the graphene–CNT composite is noticeable. The cluster shifted the Fermi level of the pure composite toward the conduction band. It can be seen from the inset in Figure 6d that the energy gap remained practically unchanged. In electron transport, the levels near the Fermi level play a key role; the shift of this level to the region of the presence of conduction channels significantly reduces the resistance of the composite. In the presence of Li and Na, the picture is similar to the DOS; the abundance of conduction channels and the absence of energy gaps at the Fermi level lead to a decrease in resistance. It is already clearly seen here that the silicon cluster significantly changed the transmission function of the composite with lithium and sodium. Moreover, for lithium, it led to the appearance of conductivity dips near the Fermi level (Figure 6e), while for sodium, on the contrary, it led to an increase in conductivity (Figure 6f). A quantitative estimate of the resistance together with the main parameters of the considered composites is shown in Table 1 below.
4. Conclusions
In this work, the objects of study were the composite materials based on graphene and CNTs with the silicon cluster. On the basis of the DFT method with the exchange function of Berland and Hildgaard vdW-DF-cx in the SIESTA program, the energy stability of the composite, both pure and decorated with silicon, was calculated. The stability assessment of the composite showed negative values for the heat of formation at the level of −0.2241 eV/atom for the bonding of graphene and CNTs and −0.0972 eV/atom with the addition of a silicon cluster. The calculated adsorption energies of Li and Na showed an equilibrium state with energies of −1.216 eV/atom for Li, −1.090 eV/atom for Na without adding a silicon cluster to the composite and −1.68 eV/atom for Li and −1.33 eV/atom for Na with the addition of a silicon cluster in the composite. Decorating a graphene–CNT composite with a silicon cluster had a positive effect on the specific capacity of the supercells. For a cell with Li, silicon increased the specific capacity by 37%, and for Na, it was increased by 22.2%. Additionally, a silicon cluster significantly reduced the resistance of a pure graphene–CNT composite by two orders of magnitude. It is especially important to note the supercells with Na and their specific capacity. In comparison with the specific capacity of graphite, the obtained structures demonstrated a tenfold increase in the specific capacity and could already compete with Li. Since the considered composite models were already being synthesized, this work could help researchers to improve the existing LIB and NIB anodes and raise their characteristics to a new level.
Author Contributions
Conceptualization, O.E.G. and D.A.K.; methodology, O.E.G. and D.A.K.; investigation, O.E.G. and D.A.K.; writing—original draft preparation, D.A.K.; writing—review and editing, O.E.G.; supervision, O.E.G.; funding acquisition, D.A.K. All authors have read and agreed to the published version of the manuscript.
Funding
The optimization of atomic structures and the calculation of DOS were carried out with the support of the Ministry of Education and Science of the Russian Federation within the framework of the state assignment (project No. FSRR-2020-0004). The calculations of the specific capacity and transmission function were carried out with the financial support of the RFBR, Grant No. 19-32-90160.
Institutional Review Board Statement
Not applicable.
Informed Consent Statement
Not applicable.
Data Availability Statement
Not applicable.
Conflicts of Interest
The authors declare no conflict of interest.
References
- Wang, G.; Xu, B.; Shi, J.; Wu, M.; Su, H.; Ouyang, C. New insights into Li diffusion in Li-Si alloys for Si anode materials: Role of Si microstructure. Nanoscale 2019, 11, 14042–14049. [Google Scholar] [CrossRef] [PubMed]
- Dash, R.; Pannala, S. RETRACTED ARTICLE: Theoretical Limits of Energy Density in Silicon-Carbon Composite Anode Based Lithium Ion Batteries. Sci. Rep. 2016, 6, 27449. [Google Scholar] [CrossRef] [PubMed]
- Zheng, Y.; Kong, X.; Usman, I.; Xie, X.; Liang, S.; Cao, G.; Pan, A. Rational design of the Pea-pod structure of SiOx/C in nanofibers as high-performance anode for lithium ion batteries. Inorg. Chem. Front. 2020, 7, 1762–1769. [Google Scholar] [CrossRef]
- Zhang, W.; Fang, S.; Wang, N.; Zhang, J.; Shi, B.; Yu, Z.; Yang, J. A compact silicon–carbon composite with an embedded structure for high cycling coulombic efficiency anode materials in lithium-ion batteries. Inorg. Chem. Front. 2020, 7, 2487–2496. [Google Scholar] [CrossRef]
- Tritsaris, G.A.; Kaxiras, E.; Meng, S.; Wang, E. Adsorption and Diffusion of Lithium on Layered Silicon for Li-Ion Storage. Nano Lett. 2013, 13, 2258–2263. [Google Scholar] [CrossRef] [PubMed]
- Zhang, W.; Zhang, F.; Ming, F.; Alshareef, H.N. Sodium-Ion Battery Anodes: Status and Future Trends. EnergyChem 2019, 1, 100012. [Google Scholar] [CrossRef]
- Xie, F.; Xu, Z.; Guo, Z.; Titirici, M.-M. Hard carbons for sodium-ion batteries and beyond. Prog. Energy 2020, 2, 042002. [Google Scholar] [CrossRef]
- Divincenzo, D.P.; Mele, E.J. Cohesion and structure in stage-1 graphite intercalation compounds. Phys. Rev. B 1985, 32, 2538–2553. [Google Scholar] [CrossRef]
- Wang, Z.; Selbach, S.M.; Grande, T. Van der Waals density functional study of the energetics of alkali metal intercalation in graphite. RSC Adv. 2014, 4, 4069–4079. [Google Scholar] [CrossRef] [Green Version]
- Tarascon, J.M. Is lithium the new gold? Nat. Chem. 2010, 2, 510. [Google Scholar] [CrossRef] [PubMed]
- Yaksic, A.; Tilton, J.E. Using the cumulative availability curve to assess the threat of mineral depletion: The case of lithium. Resour. Policy 2009, 34, 185–194. [Google Scholar] [CrossRef]
- Kulish, V.V.; Malyi, O.I.; Ng, M.F.; Chen, Z.; Manzhos, S.; Wu, P. Controlling Na diffusion by rational design of Si-based layered architectures. Phys. Chem. Chem. Phys. 2014, 16, 4260–4267. [Google Scholar] [CrossRef] [PubMed]
- Kulish, V.V.; Malyi, O.I.; Persson, C.; Wu, P. Phosphorene as an anode material for Na-ion batteries: A first-principles study. Phys. Chem. Chem. Phys. 2015, 17, 13921–13928. [Google Scholar] [CrossRef]
- Li, W.; Yang, Y.; Zhang, G.; Zhang, Y.W. Ultrafast and directional diffusion of lithium in phosphorene for high-performance lithium-ion battery. Nano Lett. 2015, 15, 1691–1697. [Google Scholar] [CrossRef]
- Ong, S.P.; Chevrier, V.L.; Hautier, G.; Jain, A.; Moore, C.; Kim, S.; Ma, X.; Ceder, G. Voltage, stability and diffusion barrier differences between sodium-ion and lithium-ion intercalation materials. Energy Environ. Sci. 2011, 4, 3680–3688. [Google Scholar] [CrossRef] [Green Version]
- Hong, S.Y.; Kim, Y.; Park, Y.; Choi, A.; Choi, N.-S.; Lee, K.T. Charge carriers in rechargeable batteries: Na ions vs. Li ions. Energy Environ. Sci. 2013, 6, 2067–2081. [Google Scholar] [CrossRef]
- Dimov, N.; Fukuda, K.; Umeno, T.; Kugino, S.; Yoshio, M. Characterization of carbon-coated silicon: Structural evolution and possible limitations. J. Power Sources 2003, 114, 88–95. [Google Scholar] [CrossRef]
- Yeo, B.C.; Jung, H.; Lee, H.W.; Yun, K.-S.; Kim, H.; Lee, K.-R.; Han, S.S. Atomistic Simulation Protocol for Improved Design of Si–O–C Hybrid Nanostructures as Li-Ion Battery Anodes: ReaxFF Reactive Force Field. J. Phys. Chem. C 2017, 121, 23268–23275. [Google Scholar] [CrossRef]
- Plimpton, S. Fast Parallel Algorithms for Short-Range Molecular Dynamics. J. Comput. Phys. 1995, 117, 1–19. [Google Scholar] [CrossRef] [Green Version]
- Zhu, Y.; Li, L.; Zhang, C.; Casillas, G.; Sun, Z.; Yan, Z.; Ruan, G.; Peng, Z.; Raji, A.R.O.; Kittrell, C.; et al. A seamless three dimensional carbon nanotube graphene hybrid material. Nat. Commun. 2012, 3, 1–7. [Google Scholar] [CrossRef]
- Ordejón, P.; Artacho, E.; Soler, J.M. Self-consistent order-N density-functional calculations for very large systems. Phys. Rev. B 1996, 53, R10441. [Google Scholar] [CrossRef] [Green Version]
- Soler, J.M.; Artacho, E.; Gale, J.D.; García, A.; Junquera, J.; Ordejón, P.; Sánchez-Portal, D. The SIESTA method for ab initio order-N materials simulation. J. Phys. Condens. Matter 2002, 14, 2745–2779. [Google Scholar] [CrossRef] [Green Version]
- Berland, K.; Hyldgaard, P. Exchange functional that tests the robustness of the plasmon description of the van der Waals density functional. Phys. Rev. B 2014, 89, 035412. [Google Scholar] [CrossRef] [Green Version]
- Berland, K.; Arter, C.A.; Cooper, V.R.; Lee, K.; Lundqvist, B.I.; Schroder, E.; Thonhauser, T.; Hyldgaard, P. Van der Waals density functionals built upon the electron-gas tradition: Facing the challenge of competing interactions. J. Chem. Phys. 2014, 140, 18A539. [Google Scholar] [CrossRef] [PubMed] [Green Version]
- Johnson, D.D. Modified Broyden’s method for accelerating convergence in self-consistent calculations. Phys. Rev. B 1988, 38, 12807. [Google Scholar] [CrossRef]
- Brandbyge, M.; Mozos, J.L.; Ordejon, P.; Taylor, J.; Stokbro, K. Density-functional method for nonequilibrium electron transport. Phys. Rev. B 2002, 65, 165401. [Google Scholar] [CrossRef] [Green Version]
- Abdurakhmanova, N.; Mueller, A.; Stepanow, S.; Rauschenbach, S.; Jansen, M.; Kern, K.; Amsharov, K.Y. Bottom up fabrication of (9, 0) zigzag and (6, 6) armchair carbon nanotube end-caps on the Rh(1 1 1) surface. Carbon 2015, 84, 444–447. [Google Scholar] [CrossRef]
- Sun, X.; Wang, Z.; Fu, Y.Q. Adsorption and diffusion of sodium on graphene with grain boundaries. Carbon 2017, 116, 415–421. [Google Scholar] [CrossRef]
- Mahtout, S.; Belkhir, M.A. Structural, magnetic and electronic properties of Fe encapsulated by silicon clusters. Phys. Lett. A 2006, 360, 384–389. [Google Scholar] [CrossRef]
- Mahtout, S. Effect of Iron Atoms on the Properties of Silicon Cage Clusters. Acta Phys. Pol. A 2013, 124, 688–694. [Google Scholar] [CrossRef]
Figure 1.
Atomic structure of the graphene–CNT (6,6) composite after optimization in SIESTA. Heptagons are shown in blue colors, while pentagons are shown in red.
Figure 1.
Atomic structure of the graphene–CNT (6,6) composite after optimization in SIESTA. Heptagons are shown in blue colors, while pentagons are shown in red.

Figure 2.
The charge distribution of the graphene–CNT (6,6) composite after optimization in SIESTA. The lack of charge is shown in red, while the excess is shown in blue.
Figure 2.
The charge distribution of the graphene–CNT (6,6) composite after optimization in SIESTA. The lack of charge is shown in red, while the excess is shown in blue.

Figure 3.
The process of filling the graphene–CNT composite with Li or Na atoms (a,b) and its ground state atomic structures (c,d).
Figure 3.
The process of filling the graphene–CNT composite with Li or Na atoms (a,b) and its ground state atomic structures (c,d).

Figure 4.
Composite with a silicon cluster, showing the Li or Na filling process (a,b) and the result of atomic structure relaxation (c,d).
Figure 4.
Composite with a silicon cluster, showing the Li or Na filling process (a,b) and the result of atomic structure relaxation (c,d).

Figure 5.
DOS curves of the considered structures: (a) pure graphene–CNT composite; (b) composite filled with Li; (c) composite filled with Na; (d) composite with Si; (e) composite filled with Si–Li; and (f) composite filled with Si–Na.
Figure 5.
DOS curves of the considered structures: (a) pure graphene–CNT composite; (b) composite filled with Li; (c) composite filled with Na; (d) composite with Si; (e) composite filled with Si–Li; and (f) composite filled with Si–Na.

Figure 6.
Transmission functions for (a) pure graphene–CNT composite; (b) composite filled with Li; (c) composite filled with Na; (d) composite filled with Si; (e) composite filled with Si–Li; and (f) composite filled with Si–Na.
Figure 6.
Transmission functions for (a) pure graphene–CNT composite; (b) composite filled with Li; (c) composite filled with Na; (d) composite filled with Si; (e) composite filled with Si–Li; and (f) composite filled with Si–Na.


Table 1.
Basic parameters.
| Structure | Number of Atoms | Fermi Energy (eV) | Resistance (kOhm) | Capacity (mAh/g) |
|---|---|---|---|---|
| Clean composite | 288 | −4.869 | 5134.0 | - |
| Composite and Li | 350 | −3.639 | 6.878 | 480.4 |
| Composite and Na | 330 | −3.321 | 7.551 | 325.4 |
| Composite and Si | 304 | −4.908 | 17.2 | - |
| Composite and Si–Li | 400 | −3.859 | 8.245 | 658.3 |
| Composite and Si–Na | 362 | −3.596 | 6.817 | 397.7 |
Publisher’s Note: MDPI stays neutral with regard to jurisdictional claims in published maps and institutional affiliations. |
© 2021 by the authors. Licensee MDPI, Basel, Switzerland. This article is an open access article distributed under the terms and conditions of the Creative Commons Attribution (CC BY) license (https://creativecommons.org/licenses/by/4.0/).
Share and Cite
MDPI and ACS Style
Kolosov, D.A.; Glukhova, O.E. Ab Initio Study of Porous Graphene–CNT Silicon Composite for Li-Ion and Na-Ion Batteries. C 2021, 7, 57. https://0-doi-org.brum.beds.ac.uk/10.3390/c7030057
AMA Style
Kolosov DA, Glukhova OE. Ab Initio Study of Porous Graphene–CNT Silicon Composite for Li-Ion and Na-Ion Batteries. C. 2021; 7(3):57. https://0-doi-org.brum.beds.ac.uk/10.3390/c7030057
Chicago/Turabian StyleKolosov, Dmitry A., and Olga E. Glukhova. 2021. "Ab Initio Study of Porous Graphene–CNT Silicon Composite for Li-Ion and Na-Ion Batteries" C 7, no. 3: 57. https://0-doi-org.brum.beds.ac.uk/10.3390/c7030057
Note that from the first issue of 2016, this journal uses article numbers instead of page numbers. See further details here.