
Experimental Volumetric Hydrogen Uptake Determination at 77 K of Commercially Available Metal-Organic Framework Materials


Department Process Analytical Technology, Federal Institute for Materials Research and Testing (BAM), 12489 Berlin, Germany
C 2022, 8(1), 5; https://0-doi-org.brum.beds.ac.uk/10.3390/c8010005
Submission received: 16 December 2021
/
Revised: 30 December 2021
/
Accepted: 31 December 2021
/
Published: 5 January 2022
(This article belongs to the Special Issue Carbon Materials for Physical and Chemical Hydrogen Storage)
Abstract
:Storage is still limiting the implementation of hydrogen as an energy carrier to integrate the intermittent operation of renewable energy sources. Among different solutions to the currently used compressed or liquified hydrogen systems, physical adsorption at cryogenic temperature in porous materials is an attractive alternative due to its fast and reversible operation and the resulting reduction in storage pressure. The feasibility of cryoadsorption for hydrogen storage depends mainly on the performance of the used materials for the specific application, where metal-organic frameworks or MOFs are remarkable candidates. In this work, gravimetric and volumetric hydrogen uptakes at 77 K and up to 100 bar of commercially available MOFs were measured since these materials are made from relatively cheap and accessible building blocks. These materials also show relatively high porous properties and are currently near to large-scale production. The measuring device was calibrated at different room temperatures to calculate an average correction factor and standard deviation so that the correction deviation is included in the measurement error for better comparability with different measurements. The influence of measurement conditions was also studied, concluding that the available adsorbing area of material and the occupied volume of the sample are the most critical factors for a reproducible measurement, apart from the samples’ preparation before measurement. Finally, the actual volumetric storage density of the used powders was calculated by directly measuring their volume in the analysis cell, comparing that value with the maximum volumetric uptake considering the measured density of crystals. From this selection of commercial MOFs, the materials HKUST-1, PCN-250(Fe), MOF-177, and MOF-5 show true potential to fulfill a volumetric requirement of 40 g·L−1 on a material basis for hydrogen storage systems without further packing of the powders.
1. Introduction
Storage is still a limiting factor in implementing the large-scale use of hydrogen as an energy carrier to assist the world in the transition to using 100% green energy [1]. Despite the acceptance and use of compressed gas and the liquified state for hydrogen storage and transportation, more energetically efficient and operationally safe solutions will be requested. These solutions would preferably need milder temperature and pressure conditions, although still involving fast loading and release kinetics similar to the compressed gas [2]. Among the different suggested mechanisms as alternative solutions for hydrogen storage, physical adsorption or physisorption can be advantageous because of its almost complete reversibility, fast adsorption/desorption kinetics, relatively high storage density [3,4], and lower pressure or higher temperature than those involved during compression or liquefaction of hydrogen, respectively, for a similar storage density [1,5].
The uptake of hydrogen by physisorption was measured for a wide range of porous materials like zeolites [6,7], with a high affinity but a usually limited capacity because of their low porosity, and carbon-based materials [4,8], with a relatively high adsorption uptake at room temperature because of the combination of microporous structures and relatively high surface areas. Molecular framework materials like metal-organic frameworks (MOF) [9] and covalent-organic frameworks (COF) [10] surpass the uptake values for other porous materials due to their larger surface areas and pore volumes [6]. Compared to COFs, there are more examples of MOF structures exhibiting tridimensionally connected microporous structures, which is an advantageous feature for hydrogen adsorption. Since the material’s walls surround gas molecules in all directions, the resulting nanoconfinement effect increases the solid-adsorbate interaction energy and, finally, the storage density [11,12]. Furthermore, MOFs contain metallic nodes, which often act as preferential hydrogen adsorption sites [13,14].
Physical adsorption is an exothermic process where hydrogen weakly interacts with sorbents [12], needing cryogenic temperatures like that for liquid nitrogen to reach a significant volumetric gain over the compressed gas at the same pressure and temperature. Nevertheless, cryogenic operation, impractical for implementing this technology in vehicles, could be a feasible solution for stationary applications where weight is not as limiting; the unitary cost is lower because of the higher amount of stored hydrogen, and heat transference is slower due to the resulting reduction of the surface-to-volume ratio for big storage vessels. Besides, liquid nitrogen as a cooling agent is inexpensive and non-toxic and, if produced from renewable electricity, could act as an additional energy carrier. With an energy cost starting from 5 kWh·Kg−1 of stored hydrogen, cryoadsorption could be close to the round-trip energetic efficiency requirement of 80% for storage systems [1].
The gravimetric hydrogen uptake of MOFs has been increased by developing materials with larger surface areas, generally obtaining new structures with larger cavities or higher void fraction by, for example, employing expanded organic linkers with a given topology [15,16]. However, this approach also reduces the density of the resulting crystals, negatively affecting the volumetric storage capacity [17], which is a more relevant parameter for a stationary hydrogen storage application. Therefore, ultra-high porosity of structures with low density is not mandatory and could even be detrimental to the volumetric storage goals. Indeed, the actual volumetric uptake of the storage system is more related to the bed or packing density, which can be enhanced to some extent by packing powders into pellets or monoliths so that the final bed density will depend on other non-structural variables like particle size, crystal shape, and mechanical properties [18,19].
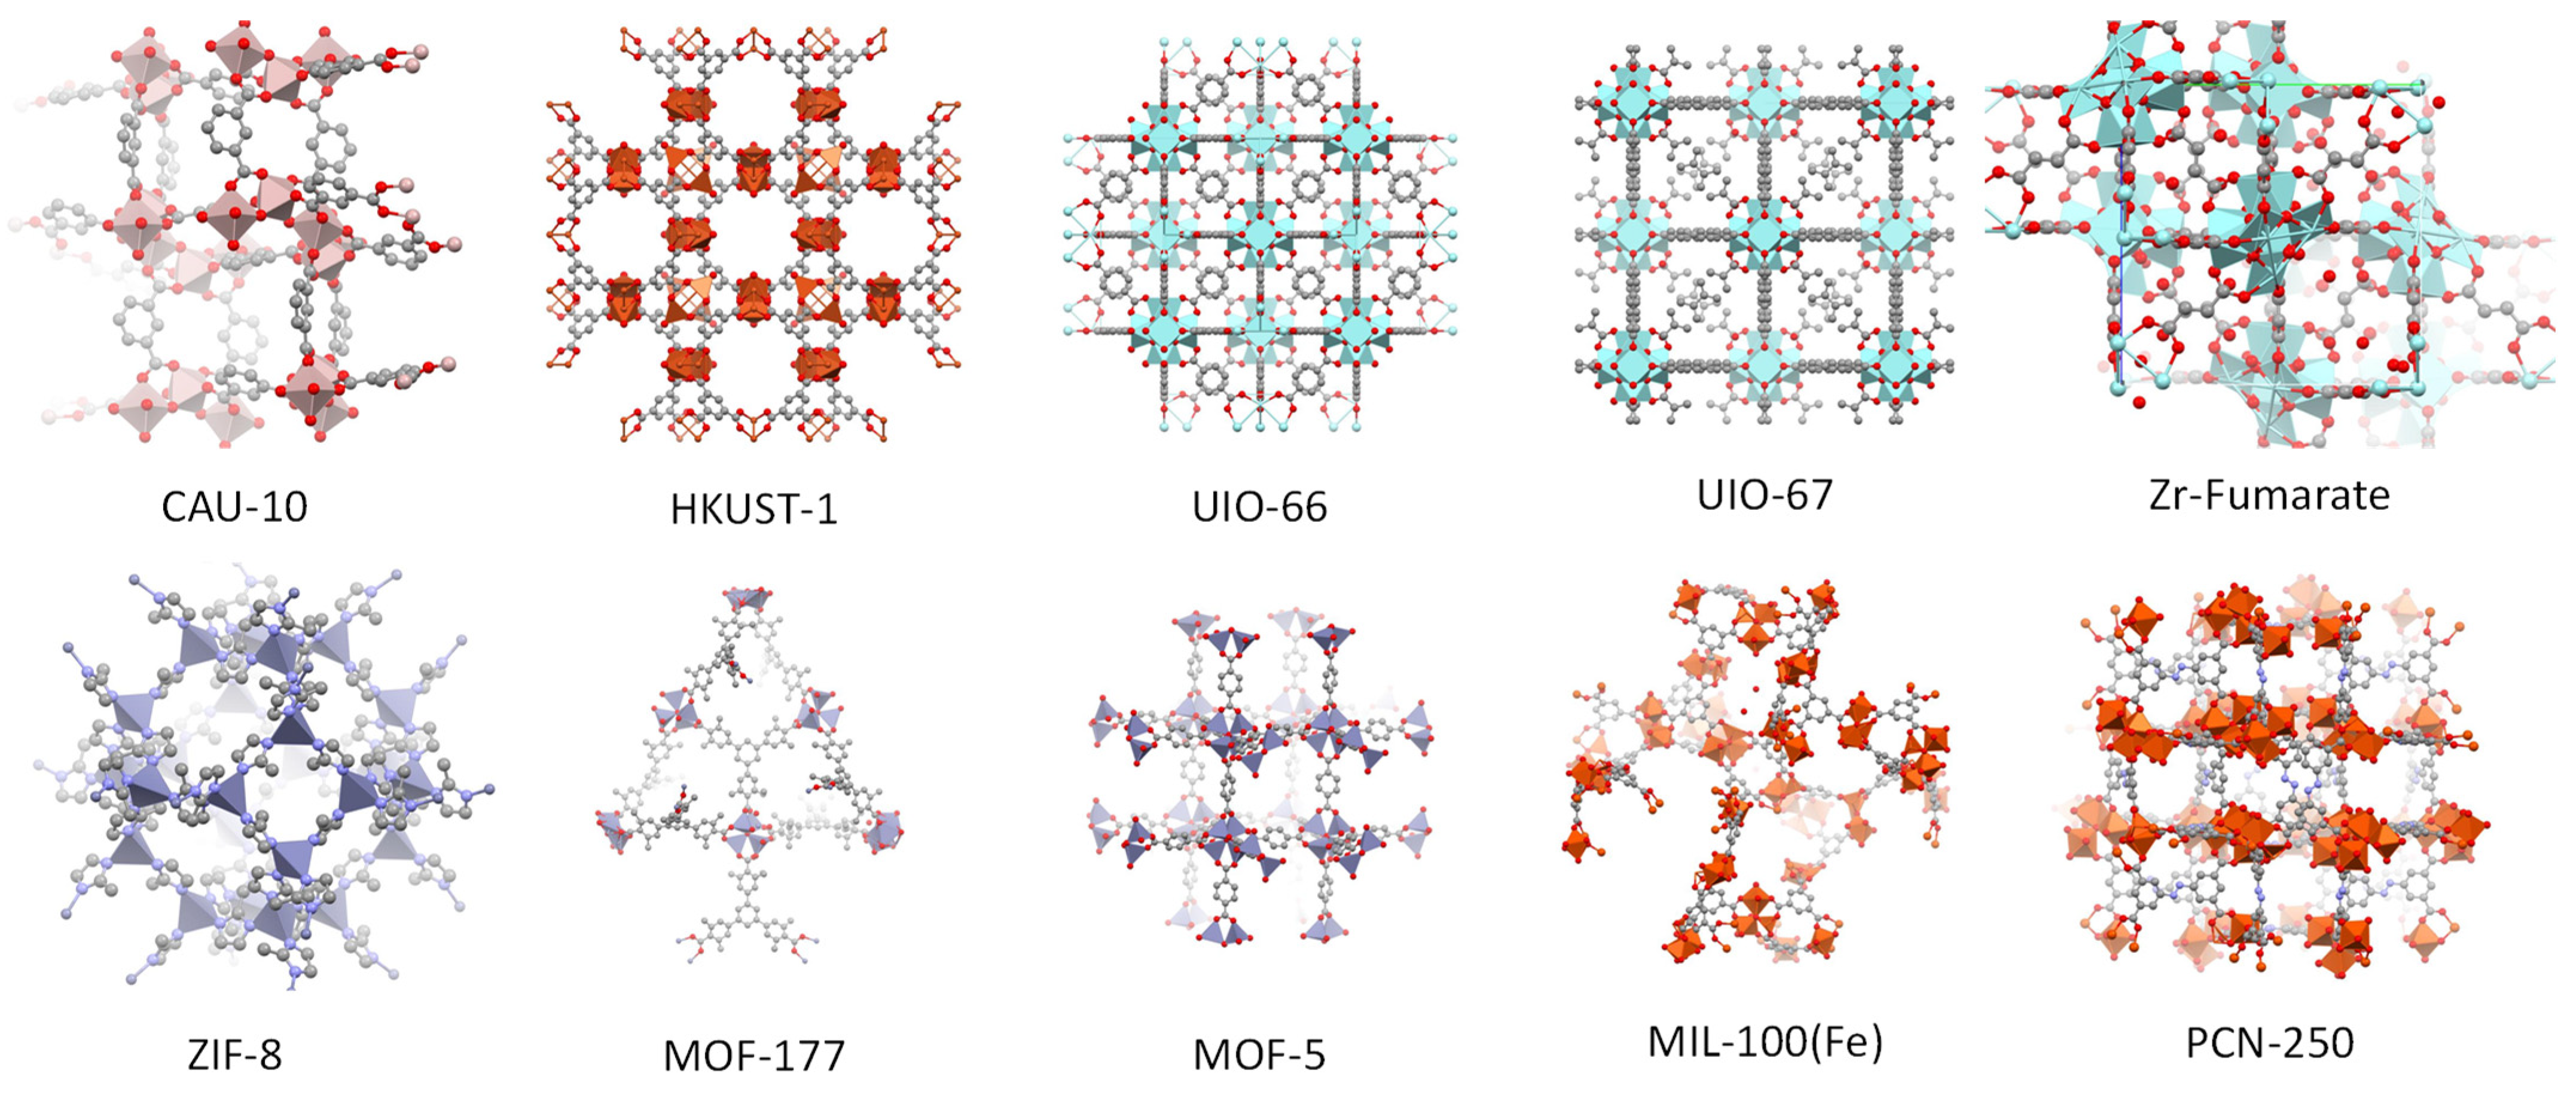
On the other hand, large-scale production of adsorbent materials will be requested for such a massive application as hydrogen storage, while MOFs’ still high cost hinders this possibility. The selection of cheap and benign building blocks and the development of MOF commercialization will significantly impact the final cost of materials [20]. For this reason, only commercially available materials (see Figure 1) were studied in this work because, in principle, these materials are closer to industrial production. For all the materials, the hydrogen uptake at 77 K and up to 100 bar were measured during several repetitions using different amounts of material, and the most relevant parameters for accurate measurements of hydrogen cryoadsorption uptake were studied, according to recent recommendations to reduce the adsorption measurement irreproducibility [21]. The volumetric uptake was estimated considering the calculated density of the involved crystals, and this value was compared to the corresponding storage density of the directly measured packing density of the adsorption bed.
2. Materials and Methods
Materials MOF-177 (Basolite Z377 from BASF), ZIF-8 (Basolite Z1200 from BASF), HKUST-1 (Basolite C300 from BASF), MIL-100(Fe) (KRICT-F100 from Strem), PCN-205(Fe) (Airsorb F250 from Strem), CAU-10 (Strem), UIO-66 (Strem), UIO-67 (Strem), and Zr-Fumarate (Zr-FA or UIO-66FA from Strem) were purchased from their commercial suppliers. Material MOF-5 was synthesized by a published room-temperature procedure consisting in dropping and stirring a solution of the metal precursor in N,N-dimethylformamide over another solution of the linker in the same solvent [22]. Due to reported instability to ambient moisture [23,24], the preparation of materials MOF-5 and MOF-177 before hydrogen adsorption experiments was performed in a globe-bag filled with N2 containing the balance. Materials UIO-66, Zr-FA, UIO-67, and CAU-10 were washed with methanol before their activation prior to gas adsorption experiments in order to exchange the remaining solvent molecules from synthesis with a volatile solvent, reducing the activation time and temperature [25].
PXRD patterns were collected with Cu-Kα radiation (λ = 1.50406 nm) on a D8 Advanced diffractometer (Bruker AXS, Germany) equipped with a Lynxeye detector. Samples were measured in reflection geometry in a 2Θ range from 3° to 50° with a step size of 0.009°. N2 adsorption/desorption isotherms were measured at 77 K on a volumetric ASAP 2020 device (Micromeritics) in the range of relative pressures p/p0 from 10−7 to 0.996. For analysis, 0.2–0.3 g of each material were loaded in the analysis probe, followed by thermal activation (see Table 1 for activation temperature) under dynamic vacuum to reach a pressure value below 10−6 mbar. The warm and cold free spaces were calculated by He expansion on the activated sample after the N2 experiment. The BET area (ABET) was calculated by following Rouquerol and Llewellyns’ rule to select the optimal BET range [26]. The total pore volume (Vp) was calculated from the N2 uptake at p/p0 ≈ 0.99, and the micropore volume (Vµp) from the corresponding N2 uptake at p/p0 value immediately before the mesoporous or the interparticle condensation, when the slope in the adsorption plateau increases. Microscopy images were taken with a Leica TL5000 optic microscope coupled to a Leica DMC5400 camera.
Hydrogen adsorption experiments were performed in a HPVA II (high-pressure volumetric analyzer) from Micromeritics. For a typical experiment, 0.3–0.9 g of material were loaded in the sample tube. Activation was performed in the HPVA in the same conditions that those used for N2 adsorption/desorption experiments. Densities for He and hydrogen gases were calculated from p and T values by MBWR EOS of McCarty and Arp and Helmholtz EOS, respectively, as recommended by NIST [27,28]. The controlled room temperature is stable within ±1 °C, and the manifold temperature is kept at 32–33 °C. The device uses two pressure transducers for reading manifold’s pressure up to 1000 mbar (accuracy 0.15% of the reading) and up to 200 bar (accuracy 0.04% of the full-scale). The figure of merit is always more than 100% during a measurement compared to the accuracy limit [29]. The experiments were performed without a liquid nitrogen level control, and the sample tube was covered by a cryojacket which kept the cryogenic liquid level approximately constant during the experiment. Adsorption equilibration was assured by using 20 min of equilibration time in all the adsorption steps. The reported excess uptake was averaged from different measurements with an intermediate evacuation for at least six hours at room temperature. All the isotherms are plotted from Figures S5–S15 in Supplementary Materials. More details about raw data correction and calibration are provided in Appendix A. The apparent or skeleton volume of materials was measured in the HPVA by subtracting the free space of the sample tube occupied with materials to the free space of the empty tube, averaged from 100 He-expansion measurements at different room temperatures. Finally, the skeleton density ( was calculated by dividing the measured mass of outgassed material by the measured sample’s volume. The crystal density of each MOF () was calculated from Equation (1) from and the pore volume (corresponding to micropores or total pore volume). The bed density () was calculated from the dry mass of material and the measured sample’s volume using the shown tool in Figure S17 in Supplementary Materials and Equation (2) [30]. The total gravimetric uptake of materials was calculated from the measured excess uptake, the pore volume, and the gas density at the specific pressure and temperature by Equation (3). The volumetric uptake of MOFs was calculated by multiplying the gravimetric total uptake times the corresponding density value.
3. Results
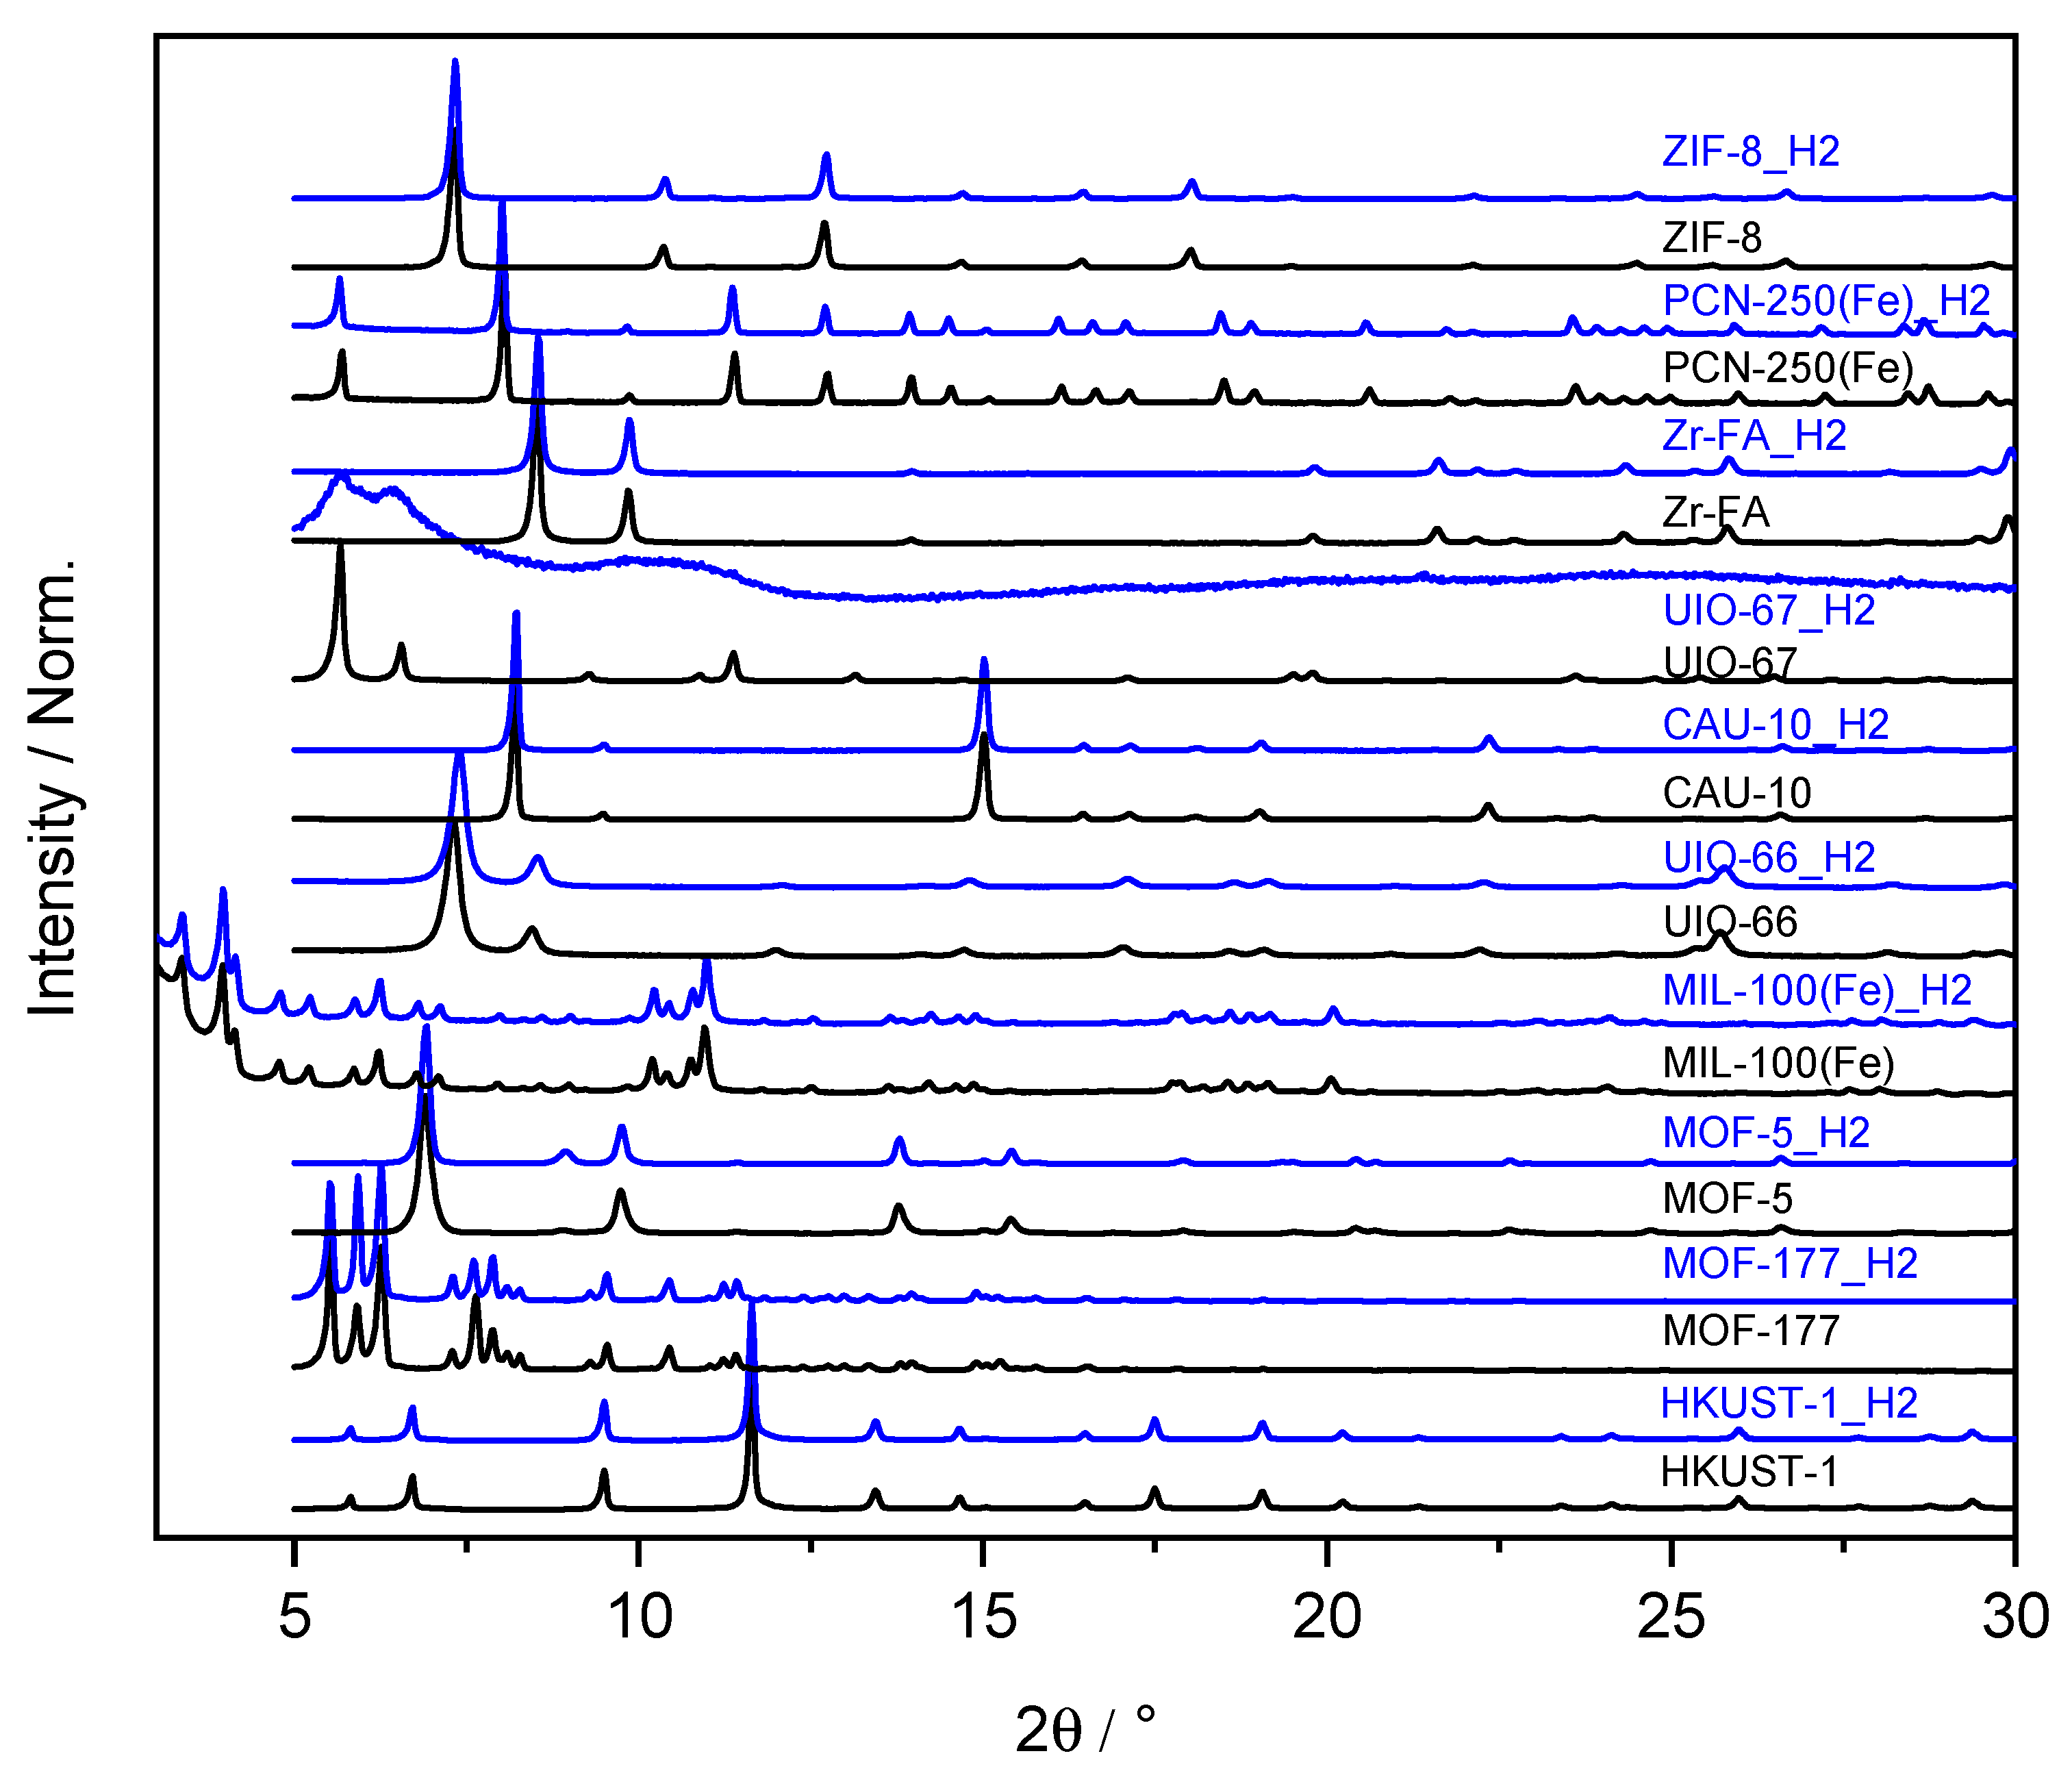
The crystalline phase of all materials is stable after their preparation and hydrogen adsorption experiments (Figure 2 and Figure S1 in Supplementary Materials), except material UIO-67, which loses the crystalline phase after hydrogen adsorption experiments despite its previously reported thermal and chemical stability [31]. However, a slight reduction in the pore volume after methanol and ethanol adsorption experiments previously indicated some instability issues [32]. Since the sample’s volume contracted in the sample holder during waiting for the PXRD analysis, material UIO-67 probably lost the crystal phase between the adsorption analysis and the PXRD measurement due to contact with ambient, similar to the behavior of other MOF compounds [33]. An evolving diffraction signal at 8.94° after hydrogen adsorption in material MOF-5 is not present in the simulated pattern, indicating structural changes because of the known material’s instability to moisture [24]. Material MOF-177 is also unstable to ambient moisture, but there is no difference in the PXRD pattern after hydrogen adsorption experiments and X-ray measurements, indicating higher stability to ambient moisture than MOF-5. The PXRD pattern for material MIL-100(Fe) starts at a lower diffraction angle of 2θ because this structure’s most relevant diffraction signals appear at 2–3° as a consequence of its mesoporous cavities.
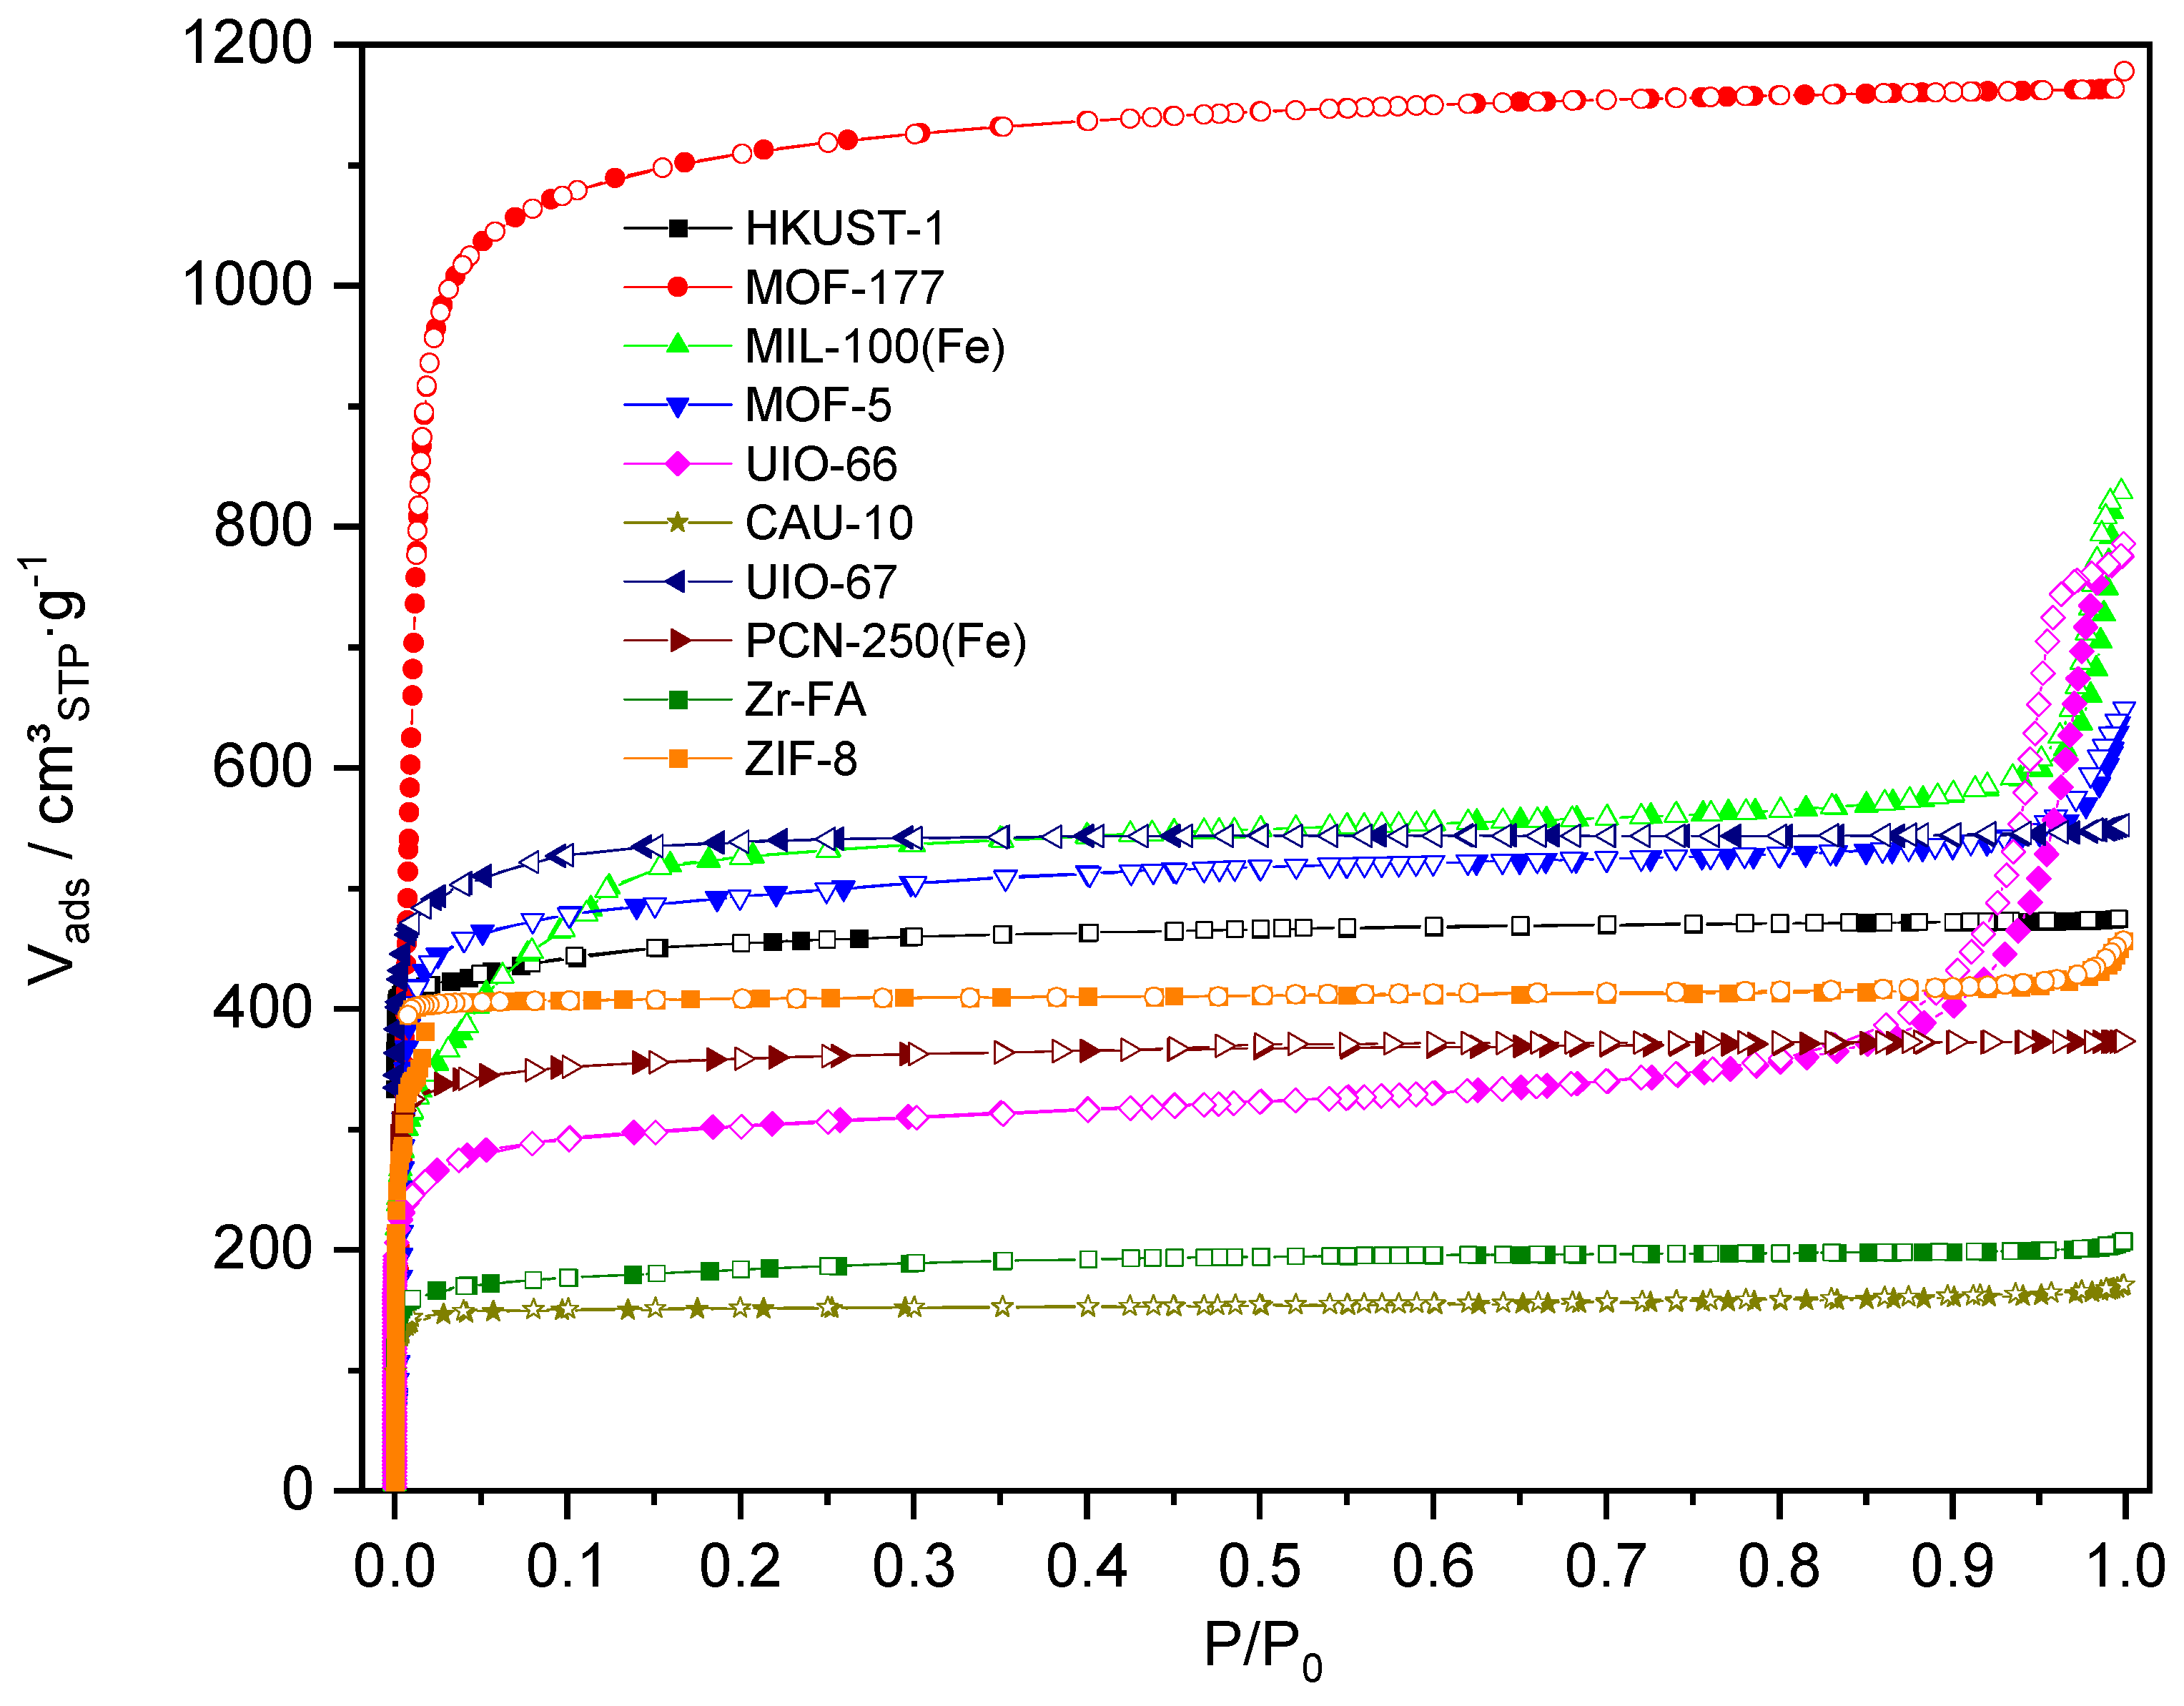
Studied materials show type I N2 adsorption/desorption isotherms at 77 K, according to the IUPAC classification, corresponding to microporous materials (Figure 3) [26,34]. MOF-177 shows the highest N2 uptake and a calculated BET area of 4449 m²·g−1, with a pore volume of 1.80 cm³·g−1. MOF-5 shows a lower surface area than expected from previous measurements, around 3500–3600 m²·g−1 [16]. A N2 adsorption/desorption experiment of this material performed in the hydrogen analyzer gave a value ca. 3100 m²·g−1 of BET area, indicating that some structural damage could be produced during the transference of material from hydrogen to nitrogen experiments, as PXRD suggested. The BET area of material MIL-100(Fe) is ca. 200 m²·g−1 higher than that for PCN-250 despite being made out of the same trinuclear iron oxide SBU. The first uses tritopic trimesic acid as linker, while the latest uses tetratopic 3,3’,5,5’-azobenzenetetracarboxylic acid yielding a structure with lower pore volume and higher crystal density. Besides, material MIL-100(Fe) reaches the adsorption plateau at higher p/p0 as a consequence of its larger cavities size in the range of mesopores (24–29 Å) [35,36]. Materials UIO-66, MOF-5, MIL-100(Fe), ZIF-8, and, slightly, MOF-177 show an increase in the adsorption uptake at high p/p0 values, indicating interparticle condensation [26]. The more important this contribution is, the more significant is the difference between total pore volume and micropore volume (Table 1). For UIO-66, this adsorption step starts at lower p/p0 than in the other MOFs, near 0.9, resulting in a type IV isotherm corresponding to mesoporous materials despite the microporous structure of UIO-66 [37]. This isotherm also shows an H3 hysteresis loop between sorption and desorption, indicating slit-like mesopores, probably between UIO-66 crystals, similar to previous reported UIO-66 samples [38]. Material UIO-66 was not distributed as a powder but as big blocks which needed to be ground before characterization (see fragments in Figure S2 in Supplementary Materials). These slit-like mesopores might be space between the intergrown microporous crystals of the MOF. The framework of UIO-67 is isorreticular to UIO-66 but uses a larger linker, 4,4’-biphenyldicarboxylic acid, instead of terephthalic acid, which expands the pore and increases both pore volume and surface area. The calculated BET area of this material is similar to that previously measured [31] and that calculated by simulation [39] since there was no contact with ambient moisture during the material’s pre-treatment to the adsorption analysis. Materials Zr-FA (UIO-66FA) and CAU-10 use fumaric acid as linker, showing the lowest surface areas.
Table 2 shows the measured density values for the MOFs, including the theoretical crystal density, calculated from their crystallographic information and collected in the CoRE MOF (Computationally-Ready Experimental MOFs) database [39]. Measured and calculated crystal densities are reasonably similar considering the measurement limitations in the skeleton density and the pore volume. The most significant differences appear for materials UIO-66, Zr-FA, and CAU-10, for which the measured density values are lower than the theoretical ones. A lower density could indicate an overestimation of the pore volume or even a low efficiency in removing solvent molecules during outgassing. For material CAU-10, the difference between measured and theoretical density is big enough to consider this last as overestimated. Indeed, the measured BET area herein is almost three times higher than the collected value in the CoRE MOF database. The deviation for material MIL-100(Fe) could be due to a wrong calculation of the micropore volume since it is a mesoporous structure. Indeed, the theoretical density value is among calculated crystal and bed densities.
Unlike nitrogen adsorption, there are neither standard procedures nor reference materials to set a comparison basis for hydrogen cryoadsorption measurements, and it is possible to find irreproducible reported hydrogen uptakes in the literature [40,41] unless special considerations and good experimental practices are adequately observed. Most concerning aspects to reproducibility are related to the preparation of materials before adsorption, technical specifications of analyzers, and, in most cases, calibration procedures to correct recorded data [21]. For this reason, a calibration was carried out as described in the experimental section considering multiple analysis conditions, including room temperature and analysis duration, and the carbon material NORIT RAW 0.8 mm, which took part in an interlaboratory analysis for hydrogen uptake at 77 K [42], was used to ensure comparability in the hydrogen uptake measurements (Figure S3 in Supplementary Materials).
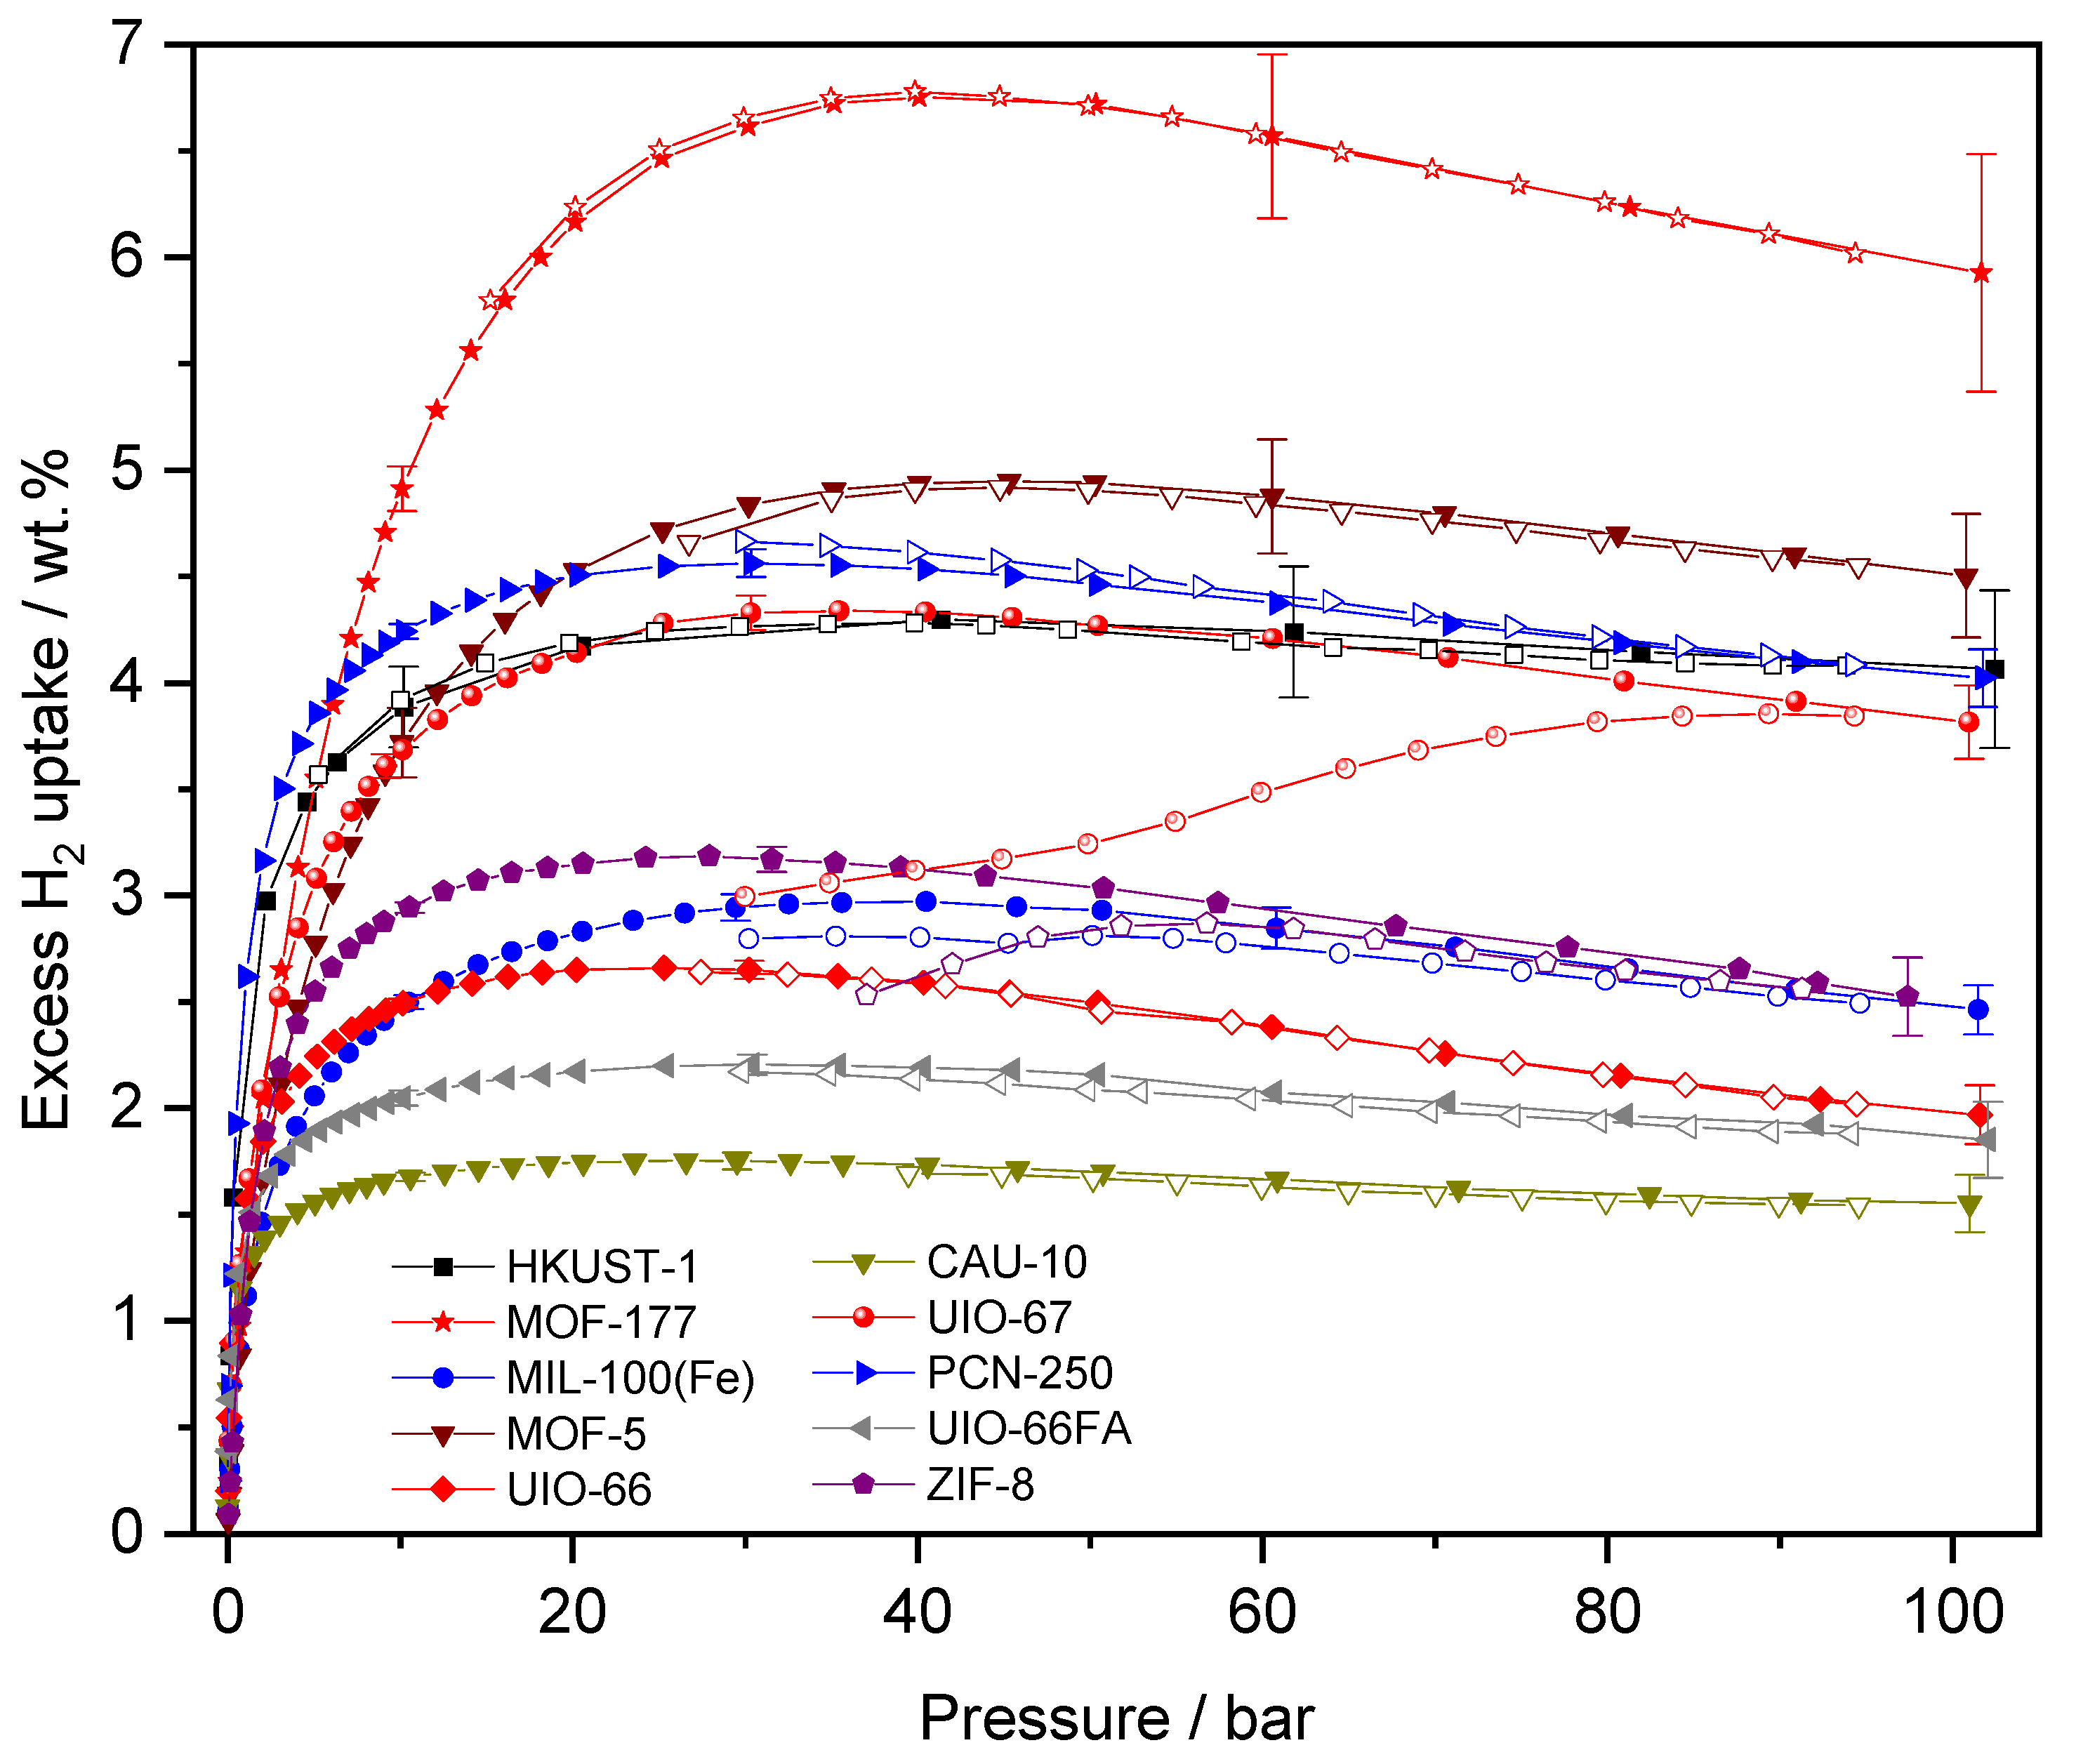
Among the analyzed commercial MOFs, material MOF-177 shows the highest hydrogen excess uptake at 77 K due to its highest surface area (see Figure 4 and Table 1). All the isotherms show a maximum in the excess uptake at a pressure value between 20 bar and 50 bar because the adsorbed phase behaves as an incompressible fluid after its superficial saturation, reducing the excess uptake for higher pressure where the gas-phase density continues increasing [12]. Generally, the maximum gravimetric excess of materials at 77 K correlates with their BET area as described by Chahine’s rule (ca. 1 wt. % of excess hydrogen each 500 m²/g of BET area) [4]. There are minor deviations to this trend due to differences in affinities to the sorbed gas, but they could also be owed to differences in the activation degree or even structure degradation before N2 or hydrogen adsorption experiments, as seems to happen in material MOF-5. Materials MOF-5 and PCN-250 (Fe) have similar surface area values but a hydrogen uptake difference of 0.5 wt. %. The necessary pressure to reach the adsorption maximum is lower for the Fe-based material since it has coordinatively unsaturated metallic sites or open metal sites (OMS), which interact more strongly with hydrogen molecules [43]. The uptake of this material is 1 wt. % higher than that predicted by Chahine’s rule, probably due to these OMS oriented to cavities [44]. Similar behavior is observed in OMS-rich material HKUST-1, with similar uptake than UIO-67 despite its lower surface area. The excess uptake of this last material is higher than that in isorreticular UIO-66 and Zr-FA materials, made out of shorter linkers and smaller cavities. Material ZIF-8, without OMS, adsorbs a higher amount of hydrogen than MIL-100(Fe) with a higher surface area and OMS [45]. The larger cavities size of structure MIL-100 could be the reason for this lower uptake, driving to a weaker interaction between gas molecules and adsorption surface due to the lower confinement effect of the gas in pores [11]. For this material, the more-separated OMS in the structure might dilute the effect of these preferential adsorption sites in increasing the superficial packing density of the adsorbed phase [44,46]. Finally, ZIF-8 and UIO-67 materials show hysteresis in desorption, which could be related, in the case of ZIF-8 material, to its previously-described gate-opening effect [47,48]. For material UIO-67, this could also indicate some flexibility in the network during desorption. The total uptake of gas adds the compressed-gas phase in the pore volume of materials to the superficial excess capacity (Equation (3)). For this reason, material MOF-177, first, and MOF-5, later, show the highest total stored amounts on a gravimetric basis (Figure S16 in Supplementary Materials) since they have the highest excess uptakes and pore volumes. The effect of a larger pore volume is evident when comparing material MIL-100(Fe) with PCN-250(Fe), UIO-67, and HKUST-1: despite the lower excess uptake of the former, the total uptakes are similar due to the larger amount of compressed gas in pores out of the excess phase. At low pressure, materials HKUST-1 and PCN-250(Fe) show higher gravimetric uptake than MOF-177, indicating that the deliverable capacity of the former material will be higher due to a smaller amount of sorbed gas at low pressure.
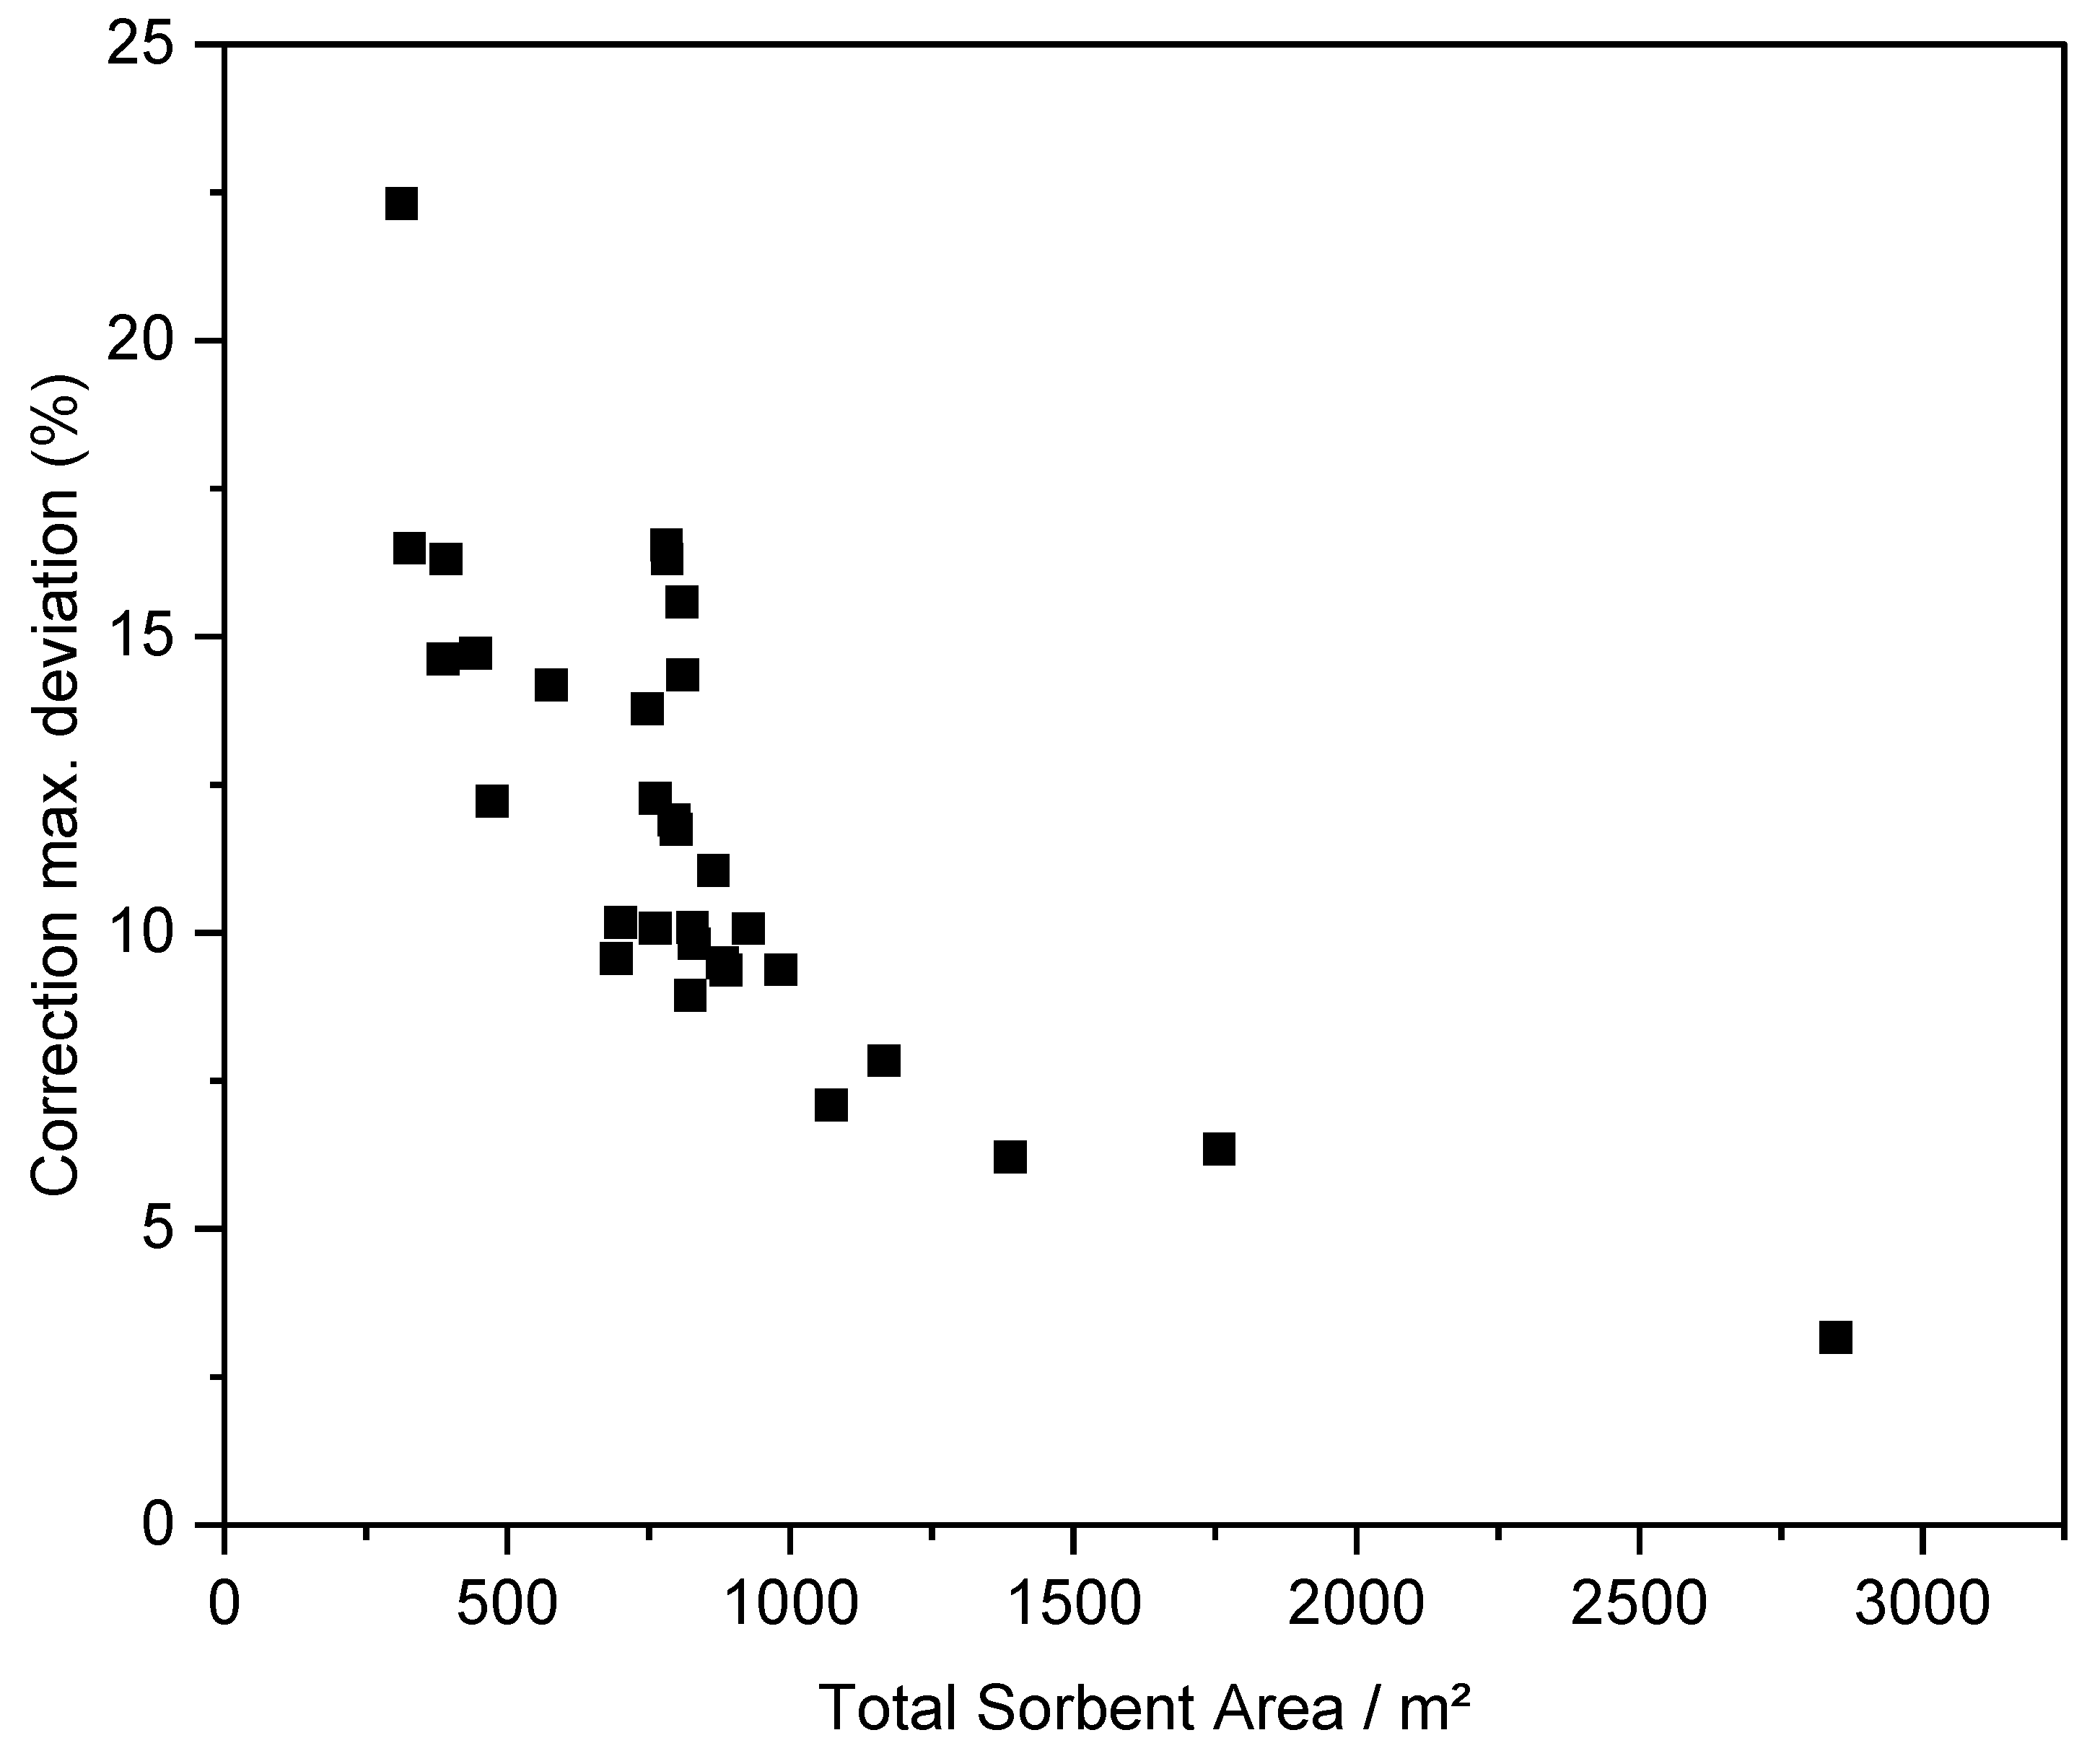
The precision of measurements is higher for materials MOF-177, MOF-5, and HKUST-1 compared to materials CAU-10, ZIF-8, and UIO-67 (see Figures S5–S15 in Supplementary Materials). In addition to the reproducibility of the adsorption itself, because of differences in the analysis temperature, the material’s activation degree between experiments, or even degradation of the adsorbent [21], the observed deviation herein is more related to the correction procedure of the raw data (see Figure S4 in Supplementary Materials). The ambient factors affecting the blank analyses are also affecting the sorption experiments. For this reason, the used correction factor was averaged for several blank analyses during a long operating time; therefore, it considers the effect of the possible room-temperature’s variation during or between experiments. Figure 5 represents the difference at 100 bar between corrected data with the highest and the lowest correction factors versus the available area of the analyzed material (ABET·mmat for each sample). The larger the available area, the smaller the correction error because of the more significant contribution of the adsorption itself. Instead of an average correction factor, a specific blank analysis reproducing the same analysis conditions and room temperature would be ideal, slowing the data acquisition down and reducing the experimental flexibility. In this experimental setup, ca. 1000 m² of total sorbent area are necessary to reduce the correction error below 10%. Nevertheless, a larger surface area available for analysis does not always lead to greater accuracy. The hydrogen uptake of material MOF-177 is lower when using a 3.6 times higher amount of adsorbent (see Figure S15 in Supplementary Materials) because the occupied volume of the sample is 2.91 cm³, which is larger than the effective cold analysis volume (2.46 ± 0.05 cm³). In this case, the fraction of material out of the temperature-controlled volume reduces the overall sample’s uptake. However, ZIF-8’s powder occupies 1.95 cm³ and adsorbs the same amount of hydrogen after a 36% packing of its volume (see Figures S9 and S10 in Supplementary Materials). Therefore, the sample’s volume must always be contained where the analysis temperature is known and controlled during the experiment.
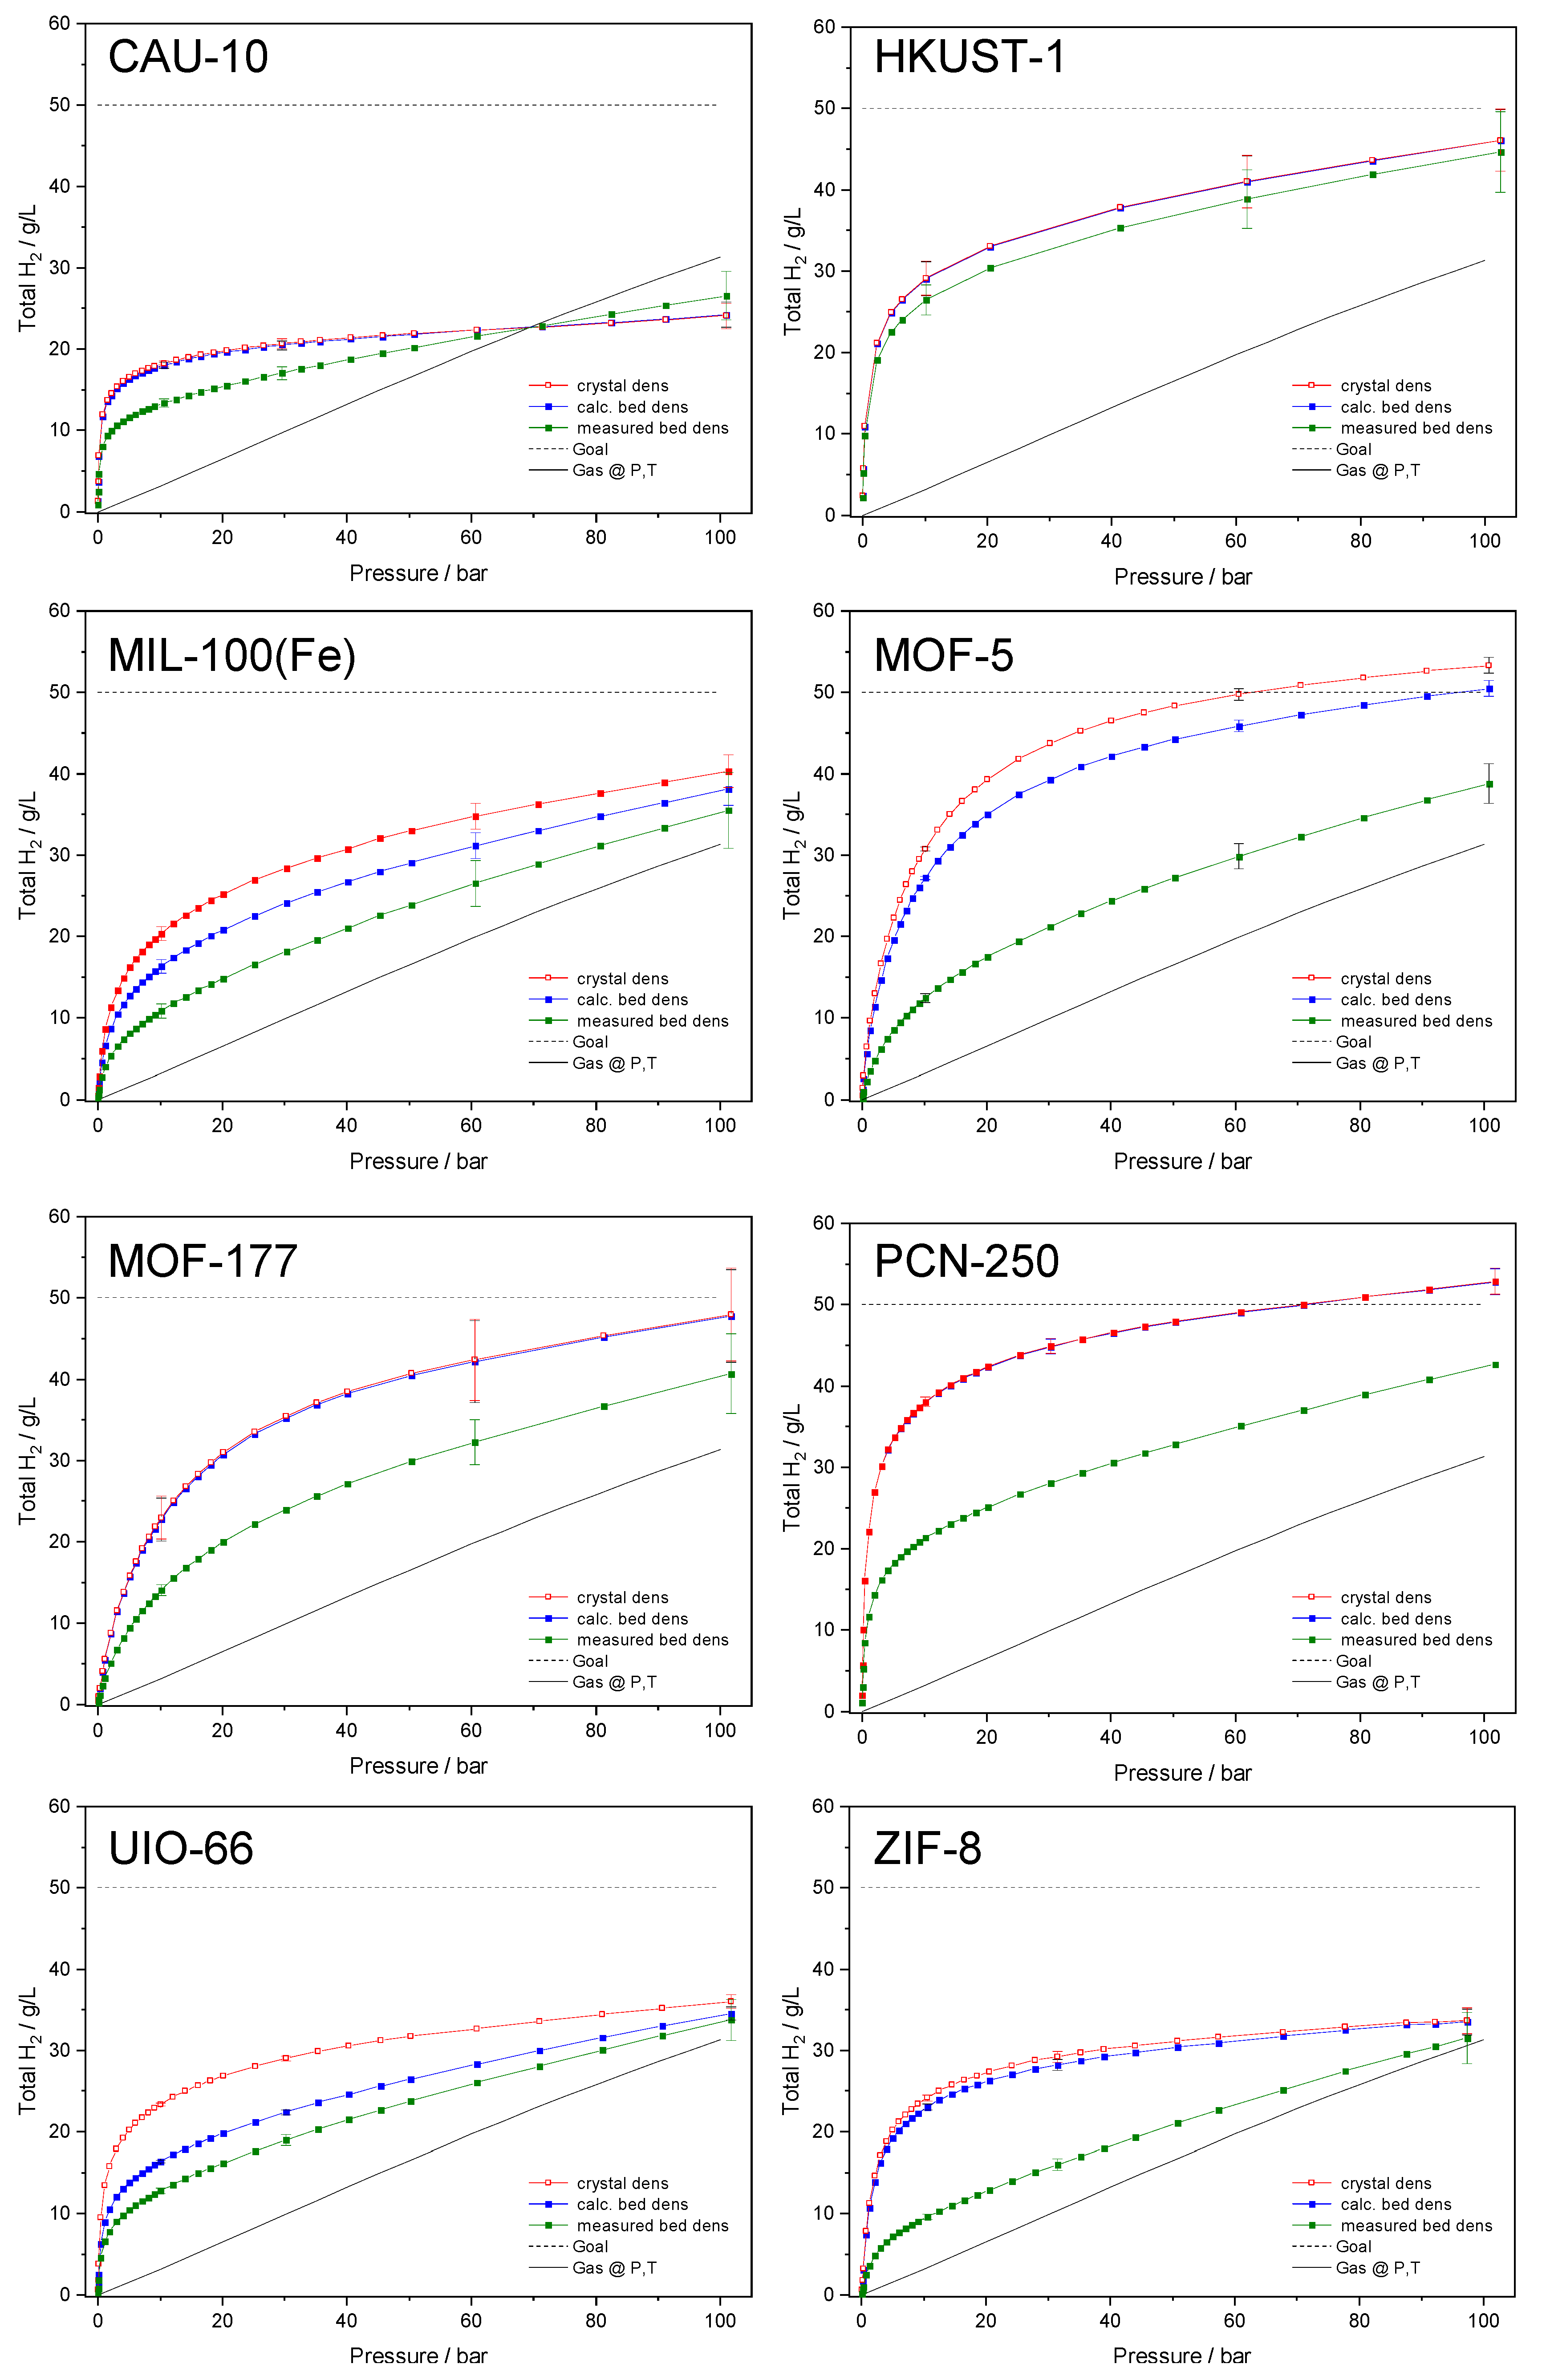
The volumetric uptake is not only proportional to the porous properties of materials but also the adsorbent density [49,50], and it represents the adsorbate packing efficiency in the occupied space by the material [51,52]. All the analyzed materials show higher volumetric storage density than the compressed gas at 77 K and the same pressure (Figure 6 and Figure S18 in Supplementary Materials) except material CAU-10. The volumetric gain of the latest is negative from 70 bar regardless of the used MOF density value. From this selection, only materials MOF-5 and PCN-250(Fe) show potential to store 50 g·L−1, the technical target from US DOE for usable hydrogen for light-duty vehicles [53], when their uptakes are calculated from the measured crystal density. The usable amount is smaller than the uptake, but these two amounts are nearer using a temperature-pressure swing adsorption system 100 bar 77 K–5 bar 160 K [54]. In comparison, the Fe-based material needs a lower pressure to reach this storage density because of the higher excess uptake at low pressure. These data indicate that the deliverable capacity of this material will be lower unless a higher desorption temperature is used to release the same amount of the stored hydrogen than in MOF-5. It will also mean higher liquid nitrogen consumption during the adsorption process to remove the resulting heat, a higher heat consumption (or lower thermal insulation) during the hydrogen release, and lower liquid nitrogen usage during long-term storage. Materials MOF-177, UIO-67, and HKUST-1 could potentially fulfill the target of 40 g·L−1 for rechargeable portable power equipment for 2025 [55]. The used value of pore volume in Equation (1) is relevant for calculating this storage density for materials MIL-100(Fe), MOF-5, ZIF-8, and, more importantly, UIO-66. For materials HKUST-1, CAU-10, MOF-177, and PCN-250, the calculated crystal and bed densities are similar because of the minor contribution of interparticle condensation in the N2-adsorption measurements to the total pore volume (see Figure 3).
The measured bed density is used to calculate the actual hydrogen uptake in the occupied volume by the powder (Figure 6). The actual uptake is always lower than that calculated by Equation (1) and needs a direct volume´s measurement for a specific powder to include micro/mesopore volumes, interparticle space, or even further dead volumes in the storage system [52]. Only the bed storage density of HKUST-1 is close to the maximum value, over 40 g·L−1, indicating a better self-packing degree, probably owed to relatively big polyhedral crystals with a regular size. Also, materials MOF-177 and PCN-250(Fe) are distributed as relatively big crystals (Figure S2 from Supplementary Materials), reaching higher volumetric uptake than 40 g·L−1. Crystals of PCN-250(Fe) are also polyhedral, but their sizes are not as homogeneous as in the HKUST-1 sample, which may increase void spaces between crystals [18,19]. Crystals of CAU-10 are tiny, with irregular shapes but similar in size. The significant difference between measured and calculated bed density can be attributed to the higher concentration of morphology defects in the tiny crystals’ external surfaces, creating more interparticle space [19]. Crystal morphology is not distinguished in MOF-5, UIO-67, ZIF-8, and Zr-FA materials, and ultrafine powders are observed instead. For this reason, their volumetric uptakes could probably be enhanced by packing since powders are easier to pack than big crystals [18,19]. Materials MOF-177 and MOF-5 show similar packing density values than previously reported ones, and it is in principle possible to further compact them up to 0.34 and 0.28 g/cm³, respectively, without reducing their porous properties and excess gravimetric hydrogen uptake [30,56], finally storing up to 41 g·L−1 for material MOF-5 and 43 g·L−1 for MOF-177.
4. Conclusions
The gravimetric and volumetric hydrogen uptake at the cryogenic temperature of 77 K was measured in commercially available MOF materials MOF-5, MOF-177, ZIF-8, HKUST-1, MIL-100(Fe), PCN-205(Fe), CAU-10, UIO-66, UIO-67, and Zr-FA. The crystal phase of all the materials is stable during the hydrogen adsorption measurement, but special care was necessary for materials MOF-5 and UIO-67 to avoid contact with moisture during preparation. All the materials show permanent porosity during adsorption measurements, and their gravimetric uptakes of hydrogen at 77 K and high pressure depend on their porous properties BET area and pore volume. The measurement accuracy depends on the total available area of analyzed materials, with at least 1000 m² of sorbent area needed to reduce the correction error below 10%. However, the sample must fit in the cold volume of the analysis cell. Material MOF-177 shows the highest gravimetric uptake at high pressure and higher deliverable capacity for isothermal operation. Materials MOF-5 and PCN-250(Fe) show the highest potential for volumetric hydrogen storage considering the measured density of the MOF crystals, over 50 g·L−1. However, the actual volumetric uptake considering the density of the powders is lower, mainly due to the presence of death volumes between MOF particles. The difference between calculated and measured density depends on the size and shape of crystals, the difference being smaller for powders made out of homogeneous and large crystals. The best crystals´ self-packing is for material HKUST-1. The powders of materials MOF-177, PCN-250(Fe), and HKUST-1 store hydrogen with densities over 40 g·L−1 without further packing. These results indicate that materials HKUST-1, PCN-250(Fe), and MOF-177 are the most promising commercially available MOFs for volumetric hydrogen storage without an intensive packing process of as-synthesized powders.
Supplementary Materials
Supplementary information is available at https://0-www-mdpi-com.brum.beds.ac.uk/article/10.3390/c8010005/s1.
Funding
This research and APC were funded by European Union’s Horizon 2020 research and innovation program and EMPIR Participating States under number 19ENG03 (MefHySto—Metrology for Advanced Hydrogen Storage Solutions).
Institutional Review Board Statement
Not applicable.
Informed Consent Statement
Not applicable.
Data Availability Statement
The data presented in this study are available on request from the corresponding author.
Acknowledgments
The author acknowledges support from the German Federal Ministry for Economic Affairs and Climate Protection and the EMPIR initiative. The author especially thanks to Carsten Prinz and Annett Zimathies from BAM for N2-adsorption measurements and Dominik Al-Sabbagh, also from BAM, for the PXRD measurements.
Conflicts of Interest
The authors declare no conflict of interest.
Appendix A
The raw adsorption data in HPVA were corrected by recalculating the cold free space of analysis considering the difference between the corrected free space of the empty sample cell (blank analyses), for which the adsorption uptake is balanced around zero-uptake, minus the free space for the analysis of the sample at room temperature. The blank analyses at 77 K were repeated several times in different seasons of the year to consider the effect of slight differences in the room temperature, involving similar duration than adsorption/desorption analyses of materials. The correction factor was averaged, and the standard deviation was used to calculate the maximum and minimum deviation due to correction. The used free space value for the volumetric analysis of a MOF sample averaged 20 He-expansion experiments in the samples tube at room temperature performed after degasification of materials and prior to the hydrogen adsorption experiment. The final measurement error considers the correction error, the experimental deviation of raw data, the number of repetitions, and the weighting error. The accuracy and linearity of the free-volume determination were checked by comparing the measured free space after filling the sample tube with different known amounts of non-porous SiO2 reference material (CRM BAM—PM—101) whose density was previously certified by BAM as 2.65 g·cm−³. The average error in the CRM’s density determination after 20 free space measurements was −2% for an occupancy of the sample tube between 5 and 70%.
References
- Andersson, J.; Gronkvist, S. Large-scale storage of hydrogen. Int. J. Hydrogen Energ. 2019, 44, 11901–11919. [Google Scholar] [CrossRef]
- Abe, J.O.; Popoola, A.P.I.; Ajenifuja, E.; Popoola, O.M. Hydrogen energy, economy and storage: Review and recommendation. Int. J. Hydrogen Energ. 2019, 44, 15072–15086. [Google Scholar] [CrossRef]
- Sun, Y.; Wang, L.; Amer, W.A.; Yu, H.; Ji, J.; Huang, L.; Shan, J.; Tong, R. Hydrogen Storage in Metal-Organic Frameworks. J. Inorg. Organomet. Polym. Mater. 2012, 23, 270–285. [Google Scholar] [CrossRef]
- Schlichtenmayer, M.; Hirscher, M. Nanosponges for hydrogen storage. J. Mater. Chem. 2012, 22, 10134–10143. [Google Scholar] [CrossRef]
- Zhou, L.; Zhou, Y.P.; Sun, Y. Enhanced storage of hydrogen at the temperature of liquid nitrogen. Int. J. Hydrogen Energ. 2004, 29, 319–322. [Google Scholar] [CrossRef]
- Chanchetti, L.F.; Leiva, D.R.; de Faria, L.I.L.; Ishikawa, T.T. A scientometric review of research in hydrogen storage materials. Int. J. Hydrogen Energ. 2020, 45, 5356–5366. [Google Scholar] [CrossRef]
- Dalebrook, A.F.; Gan, W.; Grasemann, M.; Moret, S.; Laurenczy, G. Hydrogen storage: Beyond conventional methods. Chem. Commun. 2013, 49, 8735–8751. [Google Scholar] [CrossRef]
- Aboutalebi, S.H.; Aminorroaya-Yamini, S.; Nevirkovets, I.; Konstantinov, K.; Liu, H.K. Enhanced Hydrogen Storage in Graphene Oxide-MWCNTs Composite at Room Temperature. Adv. Energy Mater. 2012, 2, 1439–1446. [Google Scholar] [CrossRef]
- Shet, S.P.; Priya, S.S.; Sudhakar, K.; Tahir, M. A review on current trends in potential use of metal-organic framework for hydrogen storage. Int. J. Hydrogen Energ. 2021, 46, 11782–11803. [Google Scholar] [CrossRef]
- Kalidindi, S.B.; Fischer, R.A. Covalent organic frameworks and their metal nanoparticle composites: Prospects for hydrogen storage. Phys. Status Solidi B Basic Solid State Phys. 2013, 250, 1119–1127. [Google Scholar] [CrossRef]
- Zhou, Z.Q.; Yu, F.; Ma, J. Nanoconfinement engineering for enchanced adsorption of carbon materials, metal-organic frameworks, mesoporous silica, MXenes and porous organic polymers: A review. Environ. Chem. Lett. 2021. [Google Scholar] [CrossRef]
- Poirier, E.; Dailly, A. On the nature of the adsorbed hydrogen phase in microporous metal-organic frameworks at supercritical temperatures. Langmuir 2009, 25, 12169–12176. [Google Scholar] [CrossRef] [Green Version]
- Nalaparaju, A.; Babarao, R.; Zhao, X.S.; Jiang, J.W. Atomistic insight into adsorption, mobility, and vibration of water in ion-exchanged zeolite-like metal-organic frameworks. ACS Nano 2009, 3, 2563–2572. [Google Scholar] [CrossRef]
- Zhou, M.; Wang, Q.; Zhang, L.; Liu, Y.C.; Kang, Y. Adsorption sites of hydrogen in zeolitic imidazolate frameworks. J. Phys. Chem. B 2009, 113, 11049–11053. [Google Scholar] [CrossRef] [PubMed]
- Gygi, D.; Bloch, E.D.; Mason, J.A.; Hudson, M.R.; Gonzalez, M.I.; Siegelman, R.L.; Darwish, T.A.; Queen, W.L.; Brown, C.M.; Long, J.R. Hydrogen storage in the expanded pore metal-organic frameworks M2 (dobpdc) (M = Mg, Mn, Fe, Co, Ni, Zn). Chem. Mater. 2016, 28, 1128–1138. [Google Scholar] [CrossRef]
- Furukawa, H.; Ko, N.; Go, Y.B.; Aratani, N.; Choi, S.B.; Choi, E.; Yazaydin, A.O.; Snurr, R.Q.; O’Keeffe, M.; Kim, J.; et al. Ultrahigh porosity in metal-organic frameworks. Science 2010, 329, 424–428. [Google Scholar] [CrossRef] [Green Version]
- Balderas-Xicohténcatl, R.; Schlichtenmayer, M.; Hirscher, M. Volumetric Hydrogen Storage Capacity in Metal-Organic Frameworks. Energy Technol. 2018, 6, 578–582. [Google Scholar] [CrossRef] [Green Version]
- Suresh, K.; Aulakh, D.; Purewal, J.; Siegel, D.J.; Veenstra, M.; Matzger, A.J. Optimizing Hydrogen Storage in MOFs through Engineering of Crystal Morphology and Control of Crystal Size. J. Am. Chem. Soc. 2021, 143, 10727–10734. [Google Scholar] [CrossRef]
- Wang, T.C.; Wright, A.M.; Hoover, W.J.; Stoffel, K.J.; Richardson, R.K.; Rodriguez, S.; Flores, R.C.; Siegfried, J.P.; Vermeulen, N.A.; Fuller, P.E.; et al. Surviving Under Pressure: The Role of Solvent, Crystal Size, and Morphology During Pelletization of Metal-Organic Frameworks. ACS Appl. Mater. Interfaces 2021, 13, 52106–52112. [Google Scholar] [CrossRef] [PubMed]
- Severino, M.I.; Gkaniatsou, E.; Nouar, F.; Pinto, M.L.; Serre, C. MOFs industrialization: A complete assessment of production costs. Faraday Discuss. 2021, 231, 326–341. [Google Scholar] [CrossRef]
- Broom, D.P.; Hirscher, M. Improving Reproducibility in Hydrogen Storage Material Research. ChemPhysChem 2021, 22, 2141–2157. [Google Scholar] [CrossRef]
- Tranchemontagne, D.J.; Hunt, J.R.; Yaghi, O.M. Room temperature synthesis of metal-organic frameworks: MOF-5, MOF-74, MOF-177, MOF-199, and IRMOF-0. Tetrahedron 2008, 64, 8553–8557. [Google Scholar] [CrossRef]
- Saha, D.; Deng, S.G. Structural Stability of Metal Organic Framework MOF-177. J. Phys. Chem. Lett. 2010, 1, 73–78. [Google Scholar] [CrossRef]
- Ming, Y.; Purewal, J.; Yang, J.; Xu, C.C.; Veenstra, M.; Gaab, M.; Muller, U.; Siegel, D.J. Stability of MOF-5 in a hydrogen gas environment containing fueling station impurities. Int. J. Hydrogen Energ. 2016, 41, 9374–9382. [Google Scholar] [CrossRef] [Green Version]
- Bae, J.; Choi, J.S.; Hwang, S.; Yun, W.S.; Song, D.; Lee, J.; Jeong, N.C. Multiple Coordination Exchanges for Room-Temperature Activation of Open-Metal Sites in Metal-Organic Frameworks. ACS Appl. Mater. Interfaces 2017, 9, 24743–24752. [Google Scholar] [CrossRef]
- Thommes, M.; Kaneko, K.; Neimark, A.V.; Olivier, J.P.; Rodriguez-Reinoso, F.; Rouquerol, J.; Sing, K.S.W. Physisorption of gases, with special reference to the evaluation of surface area and pore size distribution (IUPAC Technical Report). Pure Appl. Chem. 2015, 87, 1051–1069. [Google Scholar] [CrossRef] [Green Version]
- Leachman, J.W.; Jacobsen, R.T.; Penoncello, S.G.; Lemmon, E.W. Fundamental Equations of State for Parahydrogen, Normal Hydrogen, and Orthohydrogen. J. Phys. Chem. Ref. Data 2009, 38, 721–748. [Google Scholar] [CrossRef]
- NIST Chemistry WebBook. Available online: https://webbook.nist.gov/chemistry/fluid/ (accessed on 6 March 2020).
- Blach, T.P.; Gray, E.M. Sieverts apparatus and methodology for accurate determination of hydrogen uptake by light-atom hosts. J. Alloy. Compd. 2007, 446, 692–697. [Google Scholar] [CrossRef]
- Purewal, J.; Veenstra, M.; Tamburello, D.; Ahmed, A.; Matzger, A.J.; Wong-Foy, A.G.; Seth, S.; Liu, Y.Y.; Siegel, D.J. Estimation of system-level hydrogen storage for metal-organic frameworks with high volumetric storage density. Int. J. Hydrog. Energy 2019, 44, 15135–15145. [Google Scholar] [CrossRef]
- Chavan, S.; Vitillo, J.G.; Gianolio, D.; Zavorotynska, O.; Civalleri, B.; Jakobsen, S.; Nilsen, M.H.; Valenzano, L.; Lamberti, C.; Lillerud, K.P.; et al. H2 storage in isostructural UiO-67 and UiO-66 MOFs. Phys. Chem. Chem. Phys. 2012, 14, 1614–1626. [Google Scholar] [CrossRef] [PubMed] [Green Version]
- de Lange, M.F.; van Velzen, B.L.; Ottevanger, C.P.; Verouden, K.J.; Lin, L.C.; Vlugt, T.J.; Gascon, J.; Kapteijn, F. Metal-Organic Frameworks in Adsorption-Driven Heat Pumps: The Potential of Alcohols as Working Fluids. Langmuir 2015, 31, 12783–12796. [Google Scholar] [CrossRef]
- Yuan, S.; Feng, L.; Wang, K.; Pang, J.; Bosch, M.; Lollar, C.; Sun, Y.; Qin, J.; Yang, X.; Zhang, P.; et al. Stable Metal-Organic Frameworks: Design, Synthesis, and Applications. Adv. Mater. 2018, 30, e1704303. [Google Scholar] [CrossRef] [Green Version]
- Villajos, J.A.; Zimathies, A.; Prinz, C. A fast procedure for the estimation of the hydrogen storage capacity by cryoadsorption of metal-organic framework materials from their available porous properties. Int. J. Hydrogen Energ. 2020, 46, 29323–29331. [Google Scholar] [CrossRef]
- Horcajada, P.; Surble, S.; Serre, C.; Hong, D.Y.; Seo, Y.K.; Chang, J.S.; Greneche, J.M.; Margiolaki, I.; Ferey, G. Synthesis and catalytic properties of MIL-100(Fe), an iron(III) carboxylate with large pores. Chem. Commun. 2007, 27, 2820–2822. [Google Scholar] [CrossRef]
- Seo, Y.K.; Yoon, J.W.; Lee, J.S.; Lee, U.H.; Hwang, Y.K.; Jun, C.H.; Horcajada, P.; Serre, C.; Chang, J.S. Large scale fluorine-free synthesis of hierarchically porous iron(III) trimesate MIL-100(Fe) with a zeolite MTN topology. Microporous Mesoporous Mater. 2012, 157, 137–145. [Google Scholar] [CrossRef]
- Winarta, J.; Shan, B.; Mcintyre, S.M.; Ye, L.; Wang, C.; Liu, J.; Mu, B. A decade of UiO-66 research: A historic review of dynamic structure, synthesis mechanisms, and characterization techniques of an archetypal metal-organic framework. Cryst. Growth Des. 2019, 20, 1347–1362. [Google Scholar] [CrossRef]
- Vo, T.K.; Le, V.N.; Yoo, K.S.; Song, M.; Kim, D.; Kim, J. Facile Synthesis of UiO-66(Zr) Using a Microwave-Assisted Continuous Tubular Reactor and Its Application for Toluene Adsorption. Cryst. Growth Des. 2019, 19, 4949–4956. [Google Scholar] [CrossRef]
- Chung, Y.G.; Camp, J.; Haranczyk, M.; Sikora, B.J.; Bury, W.; Krungleviciute, V.; Yildirim, T.; Farha, O.K.; Sholl, D.S.; Snurr, R.Q. Computation-Ready, Experimental Metal-Organic Frameworks: A Tool To Enable High-Throughput Screening of Nanoporous Crystals. Chem. Mater. 2014, 26, 6185–6192. [Google Scholar] [CrossRef]
- Zlotea, C.; Moretto, P.; Steriotis, T. A Round Robin characterisation of the hydrogen sorption properties of a carbon based material. Int. J. Hydrogen Energ. 2009, 34, 3044–3057. [Google Scholar] [CrossRef]
- Broom, D.P.; Hirscher, M. Irreproducibility in hydrogen storage material research. Energy Environ. Sci. 2016, 9, 3368–3380. [Google Scholar] [CrossRef] [Green Version]
- Hurst, K.E.; Gennett, T.; Adams, J.; Allendorf, M.D.; Balderas-Xicohtencatl, R.; Bielewski, M.; Edwards, B.; Espinal, L.; Fultz, B.; Hirscher, M.; et al. An International Laboratory Comparison Study of Volumetric and Gravimetric Hydrogen Adsorption Measurements. ChemPhysChem 2019, 20, 1997–2009. [Google Scholar] [CrossRef] [PubMed] [Green Version]
- Chen, B.; Ockwig, N.W.; Millward, A.R.; Contreras, D.S.; Yaghi, O.M. High H2 adsorption in a microporous metal-organic framework with open metal sites. Angew. Chem. Int. Ed. 2005, 44, 4745–4749. [Google Scholar] [CrossRef]
- Zhou, H.-C.; Liu, D.-J. Final Project Report for DOE/EERE High-Capacity and Low-Cost Hydrogen-Storage Sorbents for Automotive Applications; Texas A & M Univ.: College Station, TX, USA, 2017. [Google Scholar]
- Yoon, J.W.; Seo, Y.K.; Hwang, Y.K.; Chang, J.S.; Leclerc, H.; Wuttke, S.; Bazin, P.; Vimont, A.; Daturi, M.; Bloch, E.; et al. Controlled reducibility of a metal-organic framework with coordinatively unsaturated sites for preferential gas sorption. Angew. Chem. Int. Ed. Engl. 2010, 49, 5949–5952. [Google Scholar] [CrossRef]
- Liu, Y.; Kabbour, H.; Brown, C.M.; Neumann, D.A.; Ahn, C.C. Increasing the density of adsorbed hydrogen with coordinatively unsaturated metal centers in metal-organic frameworks. Langmuir 2008, 24, 4772–4777. [Google Scholar] [CrossRef]
- Fairen-Jimenez, D.; Moggach, S.A.; Wharmby, M.T.; Wright, P.A.; Parsons, S.; Duren, T. Opening the gate: Framework flexibility in ZIF-8 explored by experiments and simulations. J. Am. Chem. Soc. 2011, 133, 8900–8902. [Google Scholar] [CrossRef] [PubMed] [Green Version]
- Tian, T.; Wharmby, M.T.; Parra, J.B.; Ania, C.O.; Fairen-Jimenez, D. Role of crystal size on swing-effect and adsorption induced structure transition of ZIF-8. Dalton Trans. 2016, 45, 6893–6900. [Google Scholar] [CrossRef] [Green Version]
- Broom, D.P.; Webb, C.J.; Fanourgakis, G.S.; Froudakis, G.E.; Trikalitis, P.N.; Hirscher, M. Concepts for improving hydrogen storage in nanoporous materials. Int. J. Hydrogen Energ. 2019, 44, 7768–7779. [Google Scholar] [CrossRef]
- Gomez-Gualdron, D.A.; Wang, T.C.; Garcia-Holley, P.; Sawelewa, R.M.; Argueta, E.; Snurr, R.Q.; Hupp, J.T.; Yildirim, T.; Farha, O.K. Understanding Volumetric and Gravimetric Hydrogen Adsorption Trade-off in Metal-Organic Frameworks. ACS Appl. Mater. Interfaces 2017, 9, 33419–33428. [Google Scholar] [CrossRef]
- Yan, Y.; da Silva, I.; Blake, A.J.; Dailly, A.; Manuel, P.; Yang, S.; Schroder, M. High Volumetric Hydrogen Adsorption in a Porous Anthracene-Decorated Metal-Organic Framework. Inorg. Chem. 2018, 57, 12050–12055. [Google Scholar] [CrossRef] [Green Version]
- Parilla, P.A.; Gross, K.; Hurst, K.; Gennett, T. Recommended volumetric capacity definitions and protocols for accurate, standardized and unambiguous metrics for hydrogen storage materials. Appl. Phys. A-Mater. 2016, 122, 201. [Google Scholar] [CrossRef]
- DOE Technical Targets for Onboard Hydrogen Storage for Light-Duty Vehicles. Available online: https://www.energy.gov/eere/fuelcells/doe-technical-targets-onboard-hydrogen-storage-light-duty-vehicles (accessed on 30 November 2021).
- Ahmed, A.; Seth, S.; Purewal, J.; Wong-Foy, A.G.; Veenstra, M.; Matzger, A.J.; Siegel, D.J. Exceptional hydrogen storage achieved by screening nearly half a million metal-organic frameworks. Nat. Commun. 2019, 10, 1568. [Google Scholar] [CrossRef] [Green Version]
- DOE Technical Targets for Hydrogen Storage Systems for Portable Power Equipment. Available online: https://www.energy.gov/eere/fuelcells/doe-technical-targets-hydrogen-storage-systems-portable-power-equipment (accessed on 30 November 2021).
- Collings, I.E.; Goodwin, A.L. Metal-organic frameworks under pressure. J. Appl. Phys. 2019, 126, 181101. [Google Scholar] [CrossRef] [Green Version]
Figure 1.
Used commercially available MOFs in this work. Structures from CSD deposition codes OQOCAA, LUDLED, RUBTAK, WIZMAV02, BOHJOZ, OFERUN, SUGSEU, MIBQAR, CIGXIA, XOXTOW, respectively, from top-left to down-right (hydrogen atoms were omitted for clarity).
Figure 1.
Used commercially available MOFs in this work. Structures from CSD deposition codes OQOCAA, LUDLED, RUBTAK, WIZMAV02, BOHJOZ, OFERUN, SUGSEU, MIBQAR, CIGXIA, XOXTOW, respectively, from top-left to down-right (hydrogen atoms were omitted for clarity).

Figure 2.
PXRD of MOFs before (black lines) and after (blue lines) the hydrogen adsorption experiment.
Figure 2.
PXRD of MOFs before (black lines) and after (blue lines) the hydrogen adsorption experiment.

Figure 3.
N2 adsorption/desorption isotherms at 77 K for MOFs. Open symbols are used for the desorption branch.
Figure 3.
N2 adsorption/desorption isotherms at 77 K for MOFs. Open symbols are used for the desorption branch.

Figure 4.
Excess hydrogen adsorption/desorption isotherms for MOFs at 77 K. Desorption steps were plotted as open symbols.
Figure 4.
Excess hydrogen adsorption/desorption isotherms for MOFs at 77 K. Desorption steps were plotted as open symbols.

Figure 5.
Effect of the total available area of adsorbent materials in the correction error, considering different amounts of MOFs with different specific surface areas.
Figure 5.
Effect of the total available area of adsorbent materials in the correction error, considering different amounts of MOFs with different specific surface areas.

Figure 6.
Volumetric total hydrogen adsorption isotherms for MOFs at 77 K. Comparison of storage density calculated from measured crystal density, calculated bed density, and measured bed density.
Figure 6.
Volumetric total hydrogen adsorption isotherms for MOFs at 77 K. Comparison of storage density calculated from measured crystal density, calculated bed density, and measured bed density.


Table 1.
Measured porous properties for MOFs.
| Name | ABET (m²·g−1) | Vp 1 (cm³·g−1) | Vµp 2 (cm³·g−1) | Tactivation 3 (°C) |
|---|---|---|---|---|
| MOF-177 | 4449.29 | 1.82 ± 0.01 | 1.80 ± 0.01 | 120 |
| MOF-5 | 1976.50 | 1.00 ± 0.01 | 0.80 ± 0.01 | 120 |
| UIO-67 | 2135.00 | 0.85 ± 0.01 | 0.84 ± 0.01 | 120 |
| MIL-100(Fe) | 2015.00 | 1.28 ± 0.01 | 0.88 ± 0.01 | 150 |
| PCN-250(Fe) | 1811.30 | 0.72 ± 0.01 | 0.72 ± 0.01 | 190 |
| HKUST-1 | 1800.16 | 0.73 ± 0.01 | 0.73 ± 0.01 | 200 |
| ZIF-8 | 1734.03 | 0.71 ± 0.01 | 0.63 ± 0.01 | 200 |
| UIO-66 | 1201.54 | 1.22 ± 0.01 | 0.62 ± 0.01 | 150 |
| Zr-FA | 717.91 | 0.32 ± 0.01 | 0.31 ± 0.01 | 120 |
| CAU-10 | 629.65 | 0.26 ± 0.01 | 0.25 ± 0.01 | 100 |
1 Total pore volume calculated at p/p0 = 0.98. 2 Micropore volume calculated at p/p0 before interparticle or mesoporous condensation. 3 Used temperature for materials’ activation before adsorption experiments.
Table 2.
Measured density values for MOFs.
| Name | ρsk 1 (g·cm−3) | ρcr 2 (g·cm−3) | ρbed,calc 3 (g·cm−3) | ρcr 4 (g·cm−3) | ρbed,meas 5 (g·cm−3) |
|---|---|---|---|---|---|
| MOF-177 | 1.46 ± 0.03 | 0.40 ± 0.01 | 0.40 ± 0.01 | 0.43 | 0.22 ± 0.01 |
| MOF-5 | 1.87 ± 0.04 | 0.75 ± 0.02 | 0.65 ± 0.02 | 0.60 | 0.25 ± 0.02 |
| UIO-67 | 1.70 ± 0.03 | 0.70 ± 0.02 | 0.69 ± 0.02 | 0.73 | n.a. |
| MIL-100(Fe) | 2.28 ± 0.05 | 0.77 ± 0.02 | 0.59 ± 0.02 | 0.68 | 0.34 ± 0.02 |
| PCN-250(Fe) | 1.98 ± 0.04 | 0.82 ± 0.03 | 0.81 ± 0.03 | 0.89 | 0.42 ± 0.03 |
| HKUST-1 | 1.69 ± 0.03 | 0.74 ± 0.02 | 0.74 ± 0.02 | 0.88 | 0.67 ± 0.04 |
| ZIF-8 | 1.41 ± 0.03 | 0.75 ± 0.03 | 0.71 ± 0.02 | 0.92 | 0.22 ± 0.01 |
| UIO-66 | 2.09 ± 0.04 | 0.92 ± 0.03 | 0.59 ± 0.02 | 1.20 | 0.43 ± 0.03 |
| Zr-FA | 2.12 ± 0.04 | 1.28 ± 0.07 | 1.26 ± 0.06 | 1.57 | n.a. |
| CAU-10 | 1.37 ± 0.03 | 1.02 ± 0.06 | 1.00 ± 0.06 | 3.20 | 0.68 ± 0.04 |
1 Apparent density measured by HPVA as a pycnometer. 2 Calculated density of the MOF crystals by Equation (1) from ρsk and Vp. 3 Calculated powder density by Equation (1) from ρsk and Vµp. 4 Calculated crystal density from crystallographic information. 5 Calculated bed density from the measured volume of powders.
Publisher’s Note: MDPI stays neutral with regard to jurisdictional claims in published maps and institutional affiliations. |
© 2022 by the author. Licensee MDPI, Basel, Switzerland. This article is an open access article distributed under the terms and conditions of the Creative Commons Attribution (CC BY) license (https://creativecommons.org/licenses/by/4.0/).
Share and Cite
MDPI and ACS Style
Villajos, J.A. Experimental Volumetric Hydrogen Uptake Determination at 77 K of Commercially Available Metal-Organic Framework Materials. C 2022, 8, 5. https://0-doi-org.brum.beds.ac.uk/10.3390/c8010005
AMA Style
Villajos JA. Experimental Volumetric Hydrogen Uptake Determination at 77 K of Commercially Available Metal-Organic Framework Materials. C. 2022; 8(1):5. https://0-doi-org.brum.beds.ac.uk/10.3390/c8010005
Chicago/Turabian StyleVillajos, Jose A. 2022. "Experimental Volumetric Hydrogen Uptake Determination at 77 K of Commercially Available Metal-Organic Framework Materials" C 8, no. 1: 5. https://0-doi-org.brum.beds.ac.uk/10.3390/c8010005
Note that from the first issue of 2016, this journal uses article numbers instead of page numbers. See further details here.