
Temperature Dependence of Hydrogen Adsorption on Pd-Modified Carbon Blacks and Their Enthalpy-Entropy Changes


Department of Materials and Applied Chemistry, College of Science and Technology, Nihon University, 1-8-14, Kanda-Surugadai, Chiyoda-Ku, Tokyo 101-8308, Japan
*
Author to whom correspondence should be addressed.
C 2022, 8(1), 16; https://0-doi-org.brum.beds.ac.uk/10.3390/c8010016
Submission received: 21 November 2021
/
Revised: 28 January 2022
/
Accepted: 28 January 2022
/
Published: 22 February 2022
(This article belongs to the Collection Carbon-Based Materials for Hydrogen Production, Storage and Conversion)
Abstract
:Metal-carbon composites have recently gained attention as potential hydrogen storage materials. In the present investigation, carbon blacks (CBs) with 0.6 mass %, 4.9 mass %, and 9.3 mass % of Pd were prepared to investigate the cooperative effect together with Pd and CB for hydrogen storage. The hydrogen adsorption isotherms were measured at 77 K, 98 K, 123 K, 148 K, 173 K, 223 K, and 273 K under mild pressures below 1 MPa. The lower temperature gave the higher hydrogen content. Almost all the hydrogen contents of Pd-modified CBs exceeded the sum of the adsorption contents of CB and the occluded amounts of the assumed hydride, PdH0.6. The highest hydrogen content was recorded for Pd 0.6 mass %-modified CB at 77 K. At temperatures above 77 K, CBs with the higher Pd contents adsorbed more hydrogen than Pd 0.6 mass %-modified CB, and they indicated an increase in the absolute values of adsorption enthalpy with the progress of adsorption. Pd was thought to be at first blocking deep potential sites, with accessibility to hydrogen acceptable sites gradually increasing as adsorption progressed.
1. Introduction
Rapid population growth and expanding economic activity have increased energy consumption by a significant magnitude. At the moment, fossil fuels are required for human development. Fossil fuels, account for more than 80% of total energy consumption [1,2,3]. Because of the release of greenhouse gases, the continued widespread use of fossil fuels has resulted in significant global, environmental, and climate issues, such as global warming [1,2,4,5,6,7,8]. To address these issues, today’s society must transition from a fossil-fuel-dependent framework to a sustainable approach, which necessitates the use of new energies.
Hydrogen is a potential new energy carrier because it can be produced from the electrolysis of water using renewable energy, such as hydropower and sunlight. Furthermore, by utilizing surplus power, it is possible to convert the power into hydrogen and store it for a long period. Hydrogen has two to three times the energy density of most other fuels, and roughly three times the capacity of gasoline and petroleum [2,3,4]. Hydrogen has the potential to solve a wide range of societal problems in terms of environmental load and energy density. The Department of Energy formed target values for light-duty fuel cell vehicles as an indication of the amount of hydrogen required. Targeted hydrogen contents are 4.5 mass %, 5.5 mass %, and 6.5 mass %, by 2020, by 2025, and as the ultimate goal, respectively [2,5]. These targets are system targets including the vessel and heat management system. As a result, the most meaningful target is 6.5 mass % hydrogen storage capacity [9,10,11]. Safe and efficient hydrogen storage technologies are needed to realize a sustainable hydrogen society. Currently, the primary hydrogen storage methods are compressed hydrogen gas, liquid hydrogen, and solid-state hydrogen storage with metal hydrides and adsorption materials [1,2,3,5,6,12,13,14,15,16,17,18]. Among these methods, hydrogen storage in materials appears to be promising, with adsorption materials, such as carbon-based materials, having advantages for hydrogen storage, such as fast kinetics and reversibility of hydrogen adsorption-desorption [2,5,12,14,18,19,20,21,22]. For these reasons, various types of carbon-based materials, including carbonized materials [6,7,14,20,23], carbon nanotubes [10,15,24], and carbon nanofibers [9,11,25,26], have been studied regarding their hydrogen adsorption properties.
Temperature is an important factor for hydrogen adsorption on carbon-based materials since the heat of hydrogen adsorption on most adsorbent materials is 4–7 kJ mol H2−1 [27]. Low heat values indicate that hydrogen’s interaction with the adsorption surface is weak. As a result, characteristic hydrogen adsorption at low temperatures was observed [3]. However, for the practical application of carbon materials, it is preferable to demonstrate required adsorption performance at a milder temperature while taking into consideration the temperature dependence of hydrogen adsorption. Increasing the strength of hydrogen gas-solid interactions is also important for increasing hydrogen storage capacity [21,28]. Metal modification and metal-carbon composite are promising methods for enhancing hydrogen content [29,30]. The cooperative effect, also known as the spillover phenomenon, allows for an increase in hydrogen content [17,21,31]. Hydrogen molecules are adsorbed onto the metal surface in these processes, and the adsorbed hydrogen molecules are then dissociated into atoms. Finally, on the adsorption surface, atomic hydrogen is diffused. The adsorption of atomic hydrogen increases the capacity of hydrogen storage. Pd was chosen as the modifying metal because it is a promising catalyst for promoting hydrogen adsorption [17,31]. Some papers have shown that there is no positive effect of metal modification [32,33,34]. In order to clarify and to emphasize the effect of Pd, an apparent overabundance of Pd modification was also evaluated. The first objective of this study was, thus, to investigate the effects of Pd coexistence on the temperature for hydrogen adsorption.
Regarding the adsorbent, since the potential fields of the opposite pore walls in the micropores overlap, having micropores is also important to enhance gas-solid interactions [22]. The isotherms at 77–293 K and enthalpy on hydrogen adsorption of activated carbon, AX-21, have already been reported [35]. For Ketjen Black (KB), which is a type of carbon black (CB), hydrogen adsorption at various temperatures, and enthalpy–entropy changes on hydrogen adsorption have not yet been reported. The same also applies to metal-modified KBs. Because of its commercial availability and suitable characteristics, such as large specific surface area and branched-chain structure [36], KB was selected as the carbon material. The second objective was, thus, to clarify the effects of Pd coexistence on KB for hydrogen storage through the enthalpy change and entropy change on hydrogen adsorption.
By combining a hydrogen sorption apparatus and dedicated cooling system, the temperature was able to be set to any temperature in 0.1 K steps, and the hydrogen storage characteristics were able to be measured while maintaining the temperature error within ± 0.1 K. As a result, the first step was to characterize KB and Pd-modified KBs with varying Pd contents. The hydrogen adsorption properties at arbitrary temperatures, ranging from 77–273 K, were then investigated to evaluate the temperature dependence. Finally, the enthalpy changes and entropy changes on hydrogen adsorption were calculated for each sample.
2. Materials and Methods
2.1. Materials
KB EC600JD was obtained from Lion Specialty Chemicals Co., Ltd., Tokyo, Japan. The purity of the Pd (II) acetylacetonate (Pd(acac)2, Sigma-Aldrich Co. LLC., Saint Louis, MO, USA) and methanol (Kanto Chemical Co., Inc., Tokyo, Japan) used were 99% and >99.8%, respectively.
2.2. Synthesis of Pd-Modified KBs
Pellet-like KB was powdered using a mortar. The target modification content of Pd to KB was varyingly set to 0.5 mass %, 5.0 mass %, or 10 mass %. To obtain 0.06 g of the final product, the required contents of KB and Pd(acac)2 were weighed separately. Pd(acac)2 was dissolved in 20 mL of methanol under irradiation with an ultrasonic wave of 100 kHz in a water bath to maintain the temperature. Then, KB was added to the methanol solution of Pd(acac)2 and dispersed for 30 min under the same conditions. The obtained dispersion was transferred to a Petri dish and vacuum dried. After confirming the volatilization of methanol, exhausting at 343 K was performed. Pd-modified KBs were prepared by calcining the obtained dry samples at 1073 K for 2 h in Ar-5% H2 with steam. The heating rate was 20 K min−1 and steam was introduced by bubbling water. The samples after calcination were labeled as KB_x, in which x is the Pd content in mass % determined by energy dispersive X-ray spectroscopy (EDX) analysis.
2.3. Characterization Techniques
A JEOL JEM-2000EX transmission electron microscope (TEM) was used to confirm the size and shape of the Pd particles. Using a Hitachi TM3000 scanning electron microscope, Bruker Quantax 70 EDX, the average Pd content of five places after calcination was determined. A BEL JAPAN BELSORP-mini II volumetric adsorption apparatus was used to measure nitrogen adsorption-desorption isotherms. Before measuring the nitrogen isotherms, the samples were evacuated at 403 K for 6 h. The BELMaster software was used to calculate the Brunauer–Emmett–Teller (BET) specific surface area, pore size distribution (PSD), and pore volume. The specific surface area was calculated from the nitrogen adsorption data at the relative pressure of 0.05–0.3. The micropore analysis method and Barret–Joyner–Halenda method were applied to the micropore region and mesopore region, respectively. A structural analysis was conducted using a Rigaku MultiFlex Cu Kα X-ray diffractometer (XRD) and a JASCO NRS-4100 Raman micro-spectrometer. The hydrogen sorption isotherms were measured at 77 K, 98 K, 123 K, 148 K, 173 K, 223 K, and 273 K using a Suzuki Shokan Pressure-Composition-Temperature (PCT)-4SDWIN hydrogen sorption apparatus with a cooling system. The reservoir volume provided by the maker was 27.997 cm3. The sample mass ranged between 0.0443 and 0.05 g. To fill the empty volume, a glass rod was placed in the sample cell. Prior to the PCT evaluation, an activation treatment was performed at 653 K. This treatment consisted of six cycles of 5-min evacuation and 5-min hydrogenation under 1.1 MPa of hydrogen. Finally, the samples were evacuated at 653 K for 1 h. Correction by blank measurements without samples was performed at each temperature. As an example, for the hydrogen adsorption measurements at 77 K, the corrected sample cell volume and the line volume were 2.734 cm3 and 15.831 cm3, respectively.
2.4. Enthalpy and Entropy Evaluation
The enthalpy change (ΔH) and entropy change (ΔS) on hydrogen adsorption were calculated using the van’t Hoff Equation (1), in which the pressures at 12 hydrogen adsorption points were used as the hydrogen pressure (Phyd). These points included 0.05 mass %, 0.35 mass %, and 0.1 mass % steps between 0.1 and 1.0 mass %.
where P0 is the reference pressure (0.101325 MPa), R is the gas constant (8.314 J K−1 mol−1), and T is the absolute temperature (K).
ln(Phyd/P0) = (ΔH/RT) − (ΔS/R),
3. Results and Discussion
3.1. Characterization of Samples
The Pd contents of three prepared samples were 0.6 mass %, 4.9 mass %, and 9.3 mass %. These observed values approximately match the intended values.
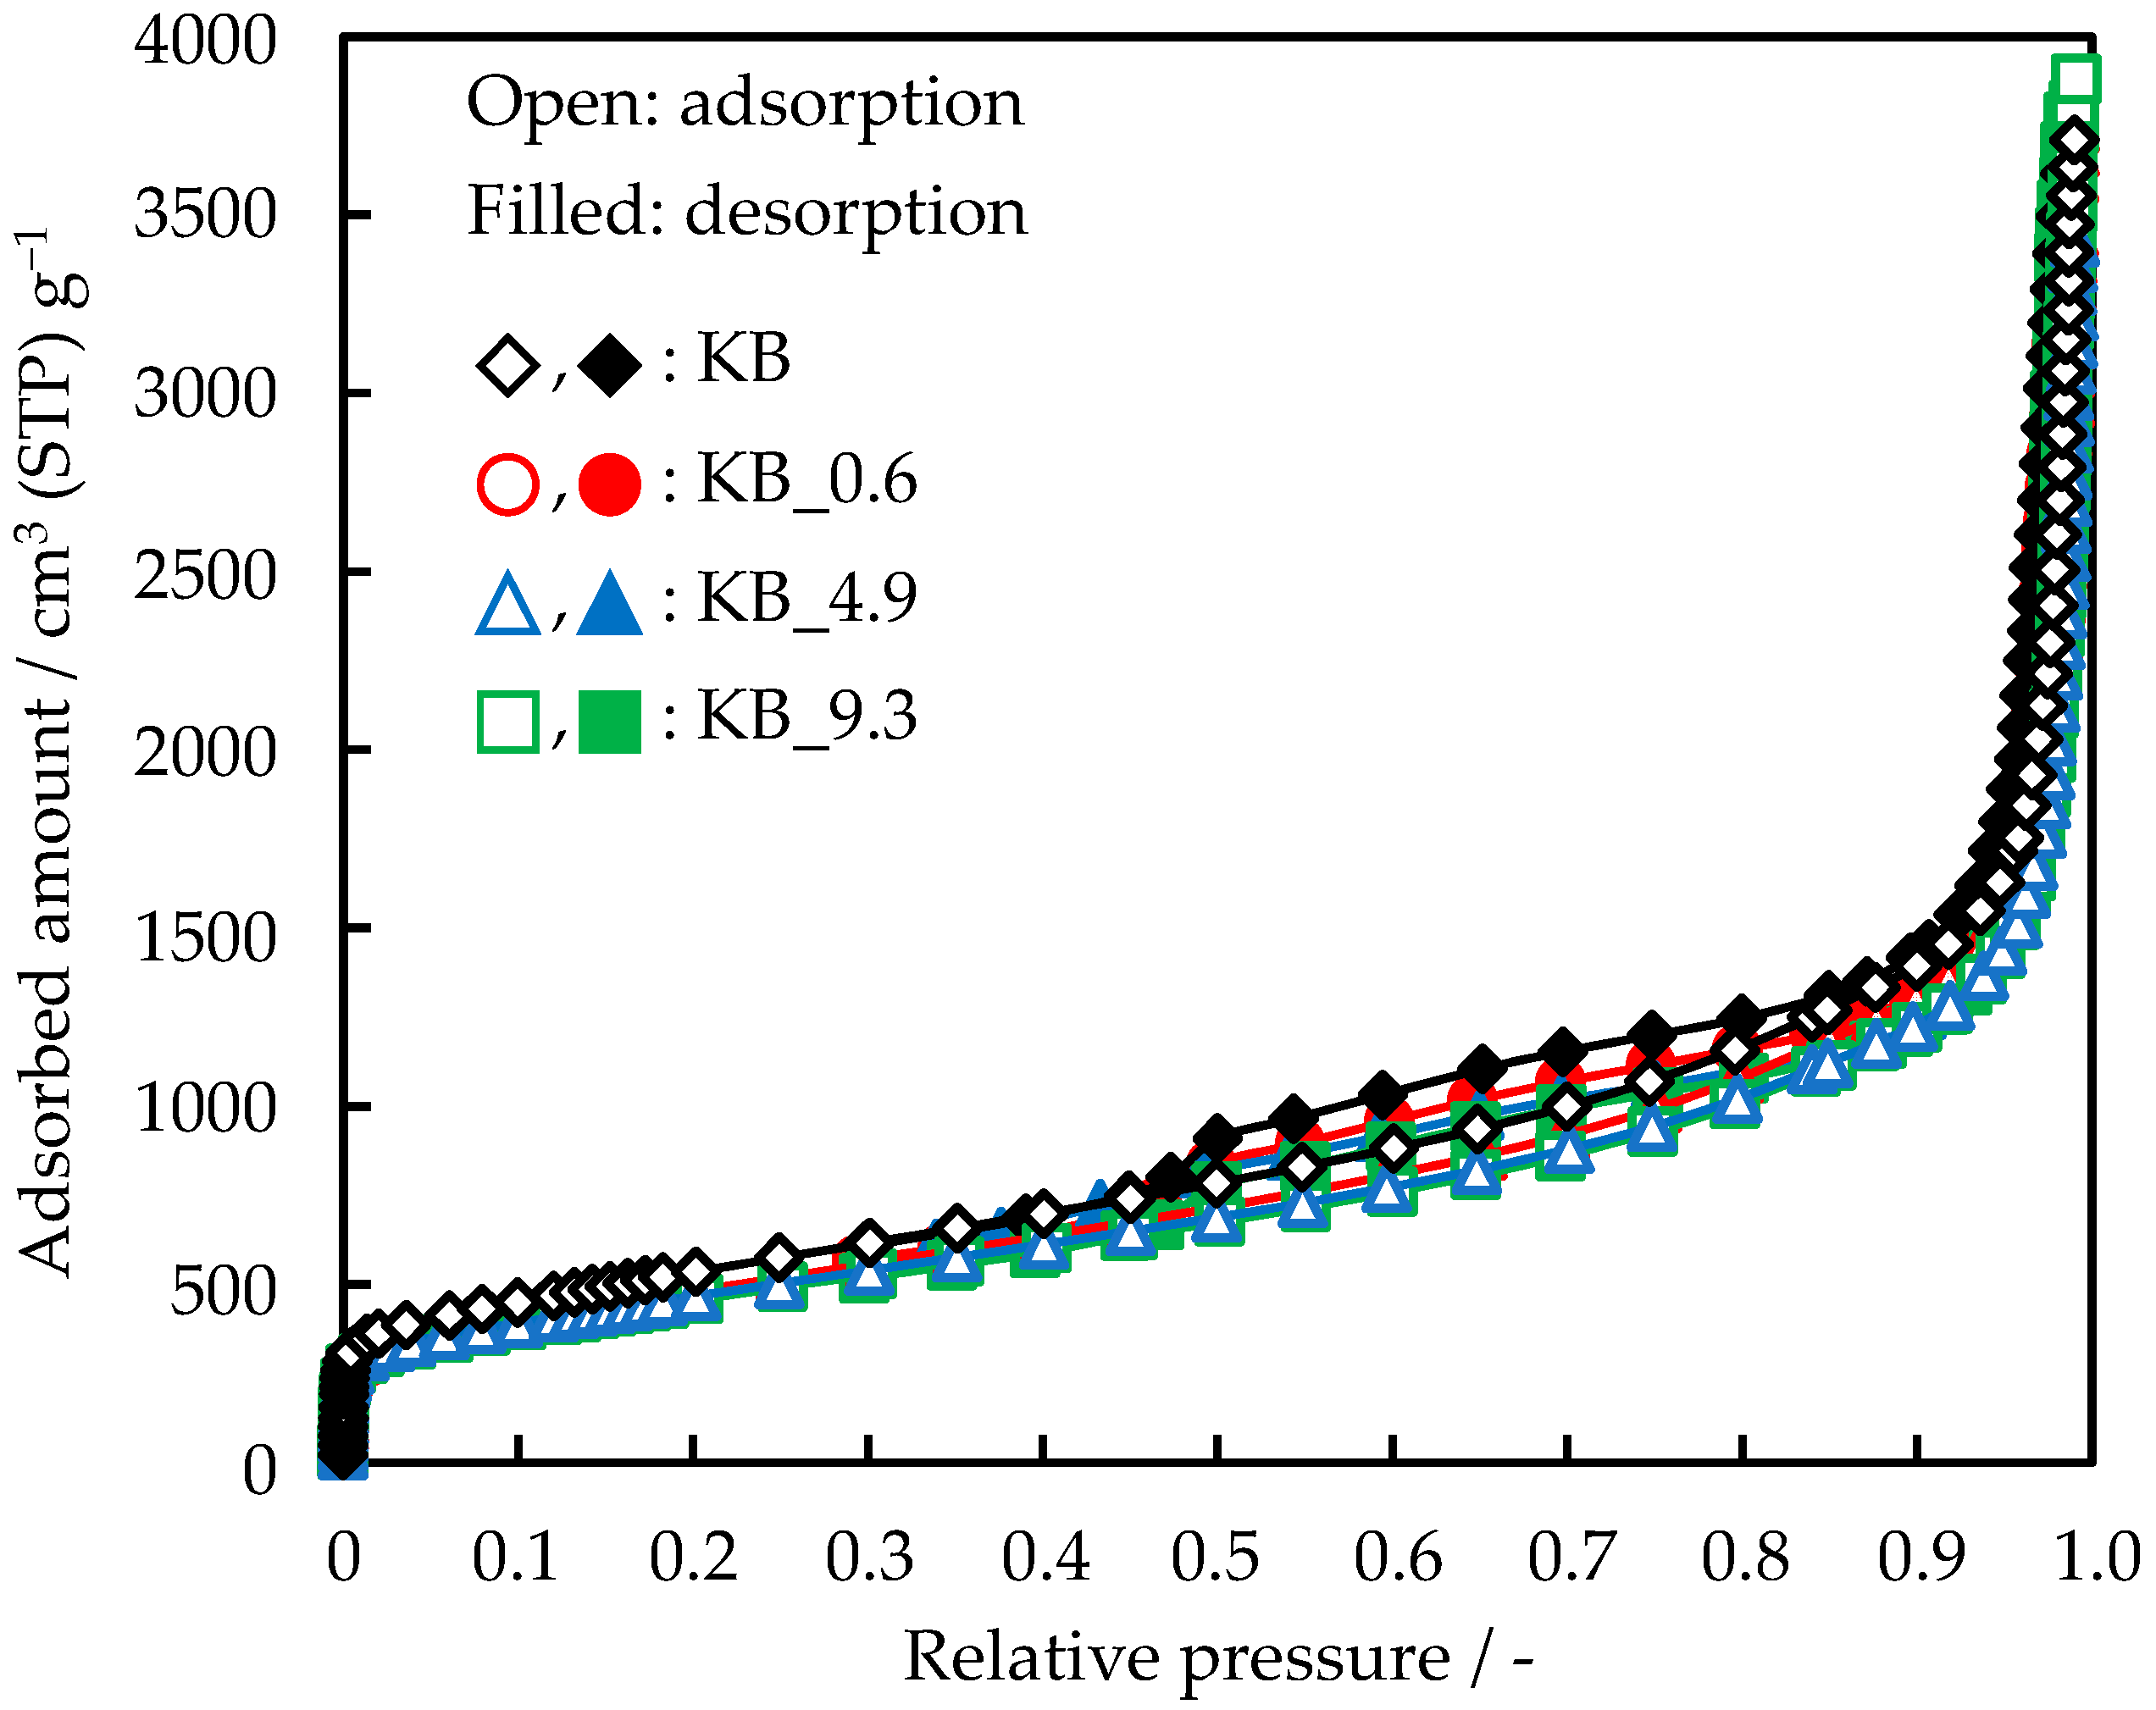
Nitrogen adsorption-desorption isotherms at 77 K for KB, KB_0.6, KB_4.9, and KB_9.3 are shown in Figure 1. Steep increases in the adsorbed amounts at very low relative pressure, P/P0 < 0.01, and hysteresis loops at the relative pressure range 0.45 < P/P0 < 0.85 were observed for all samples. According to the IUPAC classification [37], the observed isotherms consisted of type I isotherm, type IV isotherm, and type H4 hysteresis loop. These features indicated the presence of micropores (<2 nm) and mesopores (2–50 nm). The presence of mesopores was also confirmed by the hysteresis loop, which was related to capillary condensation. No isotherms reached a saturation point even though the relative pressures were close to P/P0 = 1. The phenomena were caused by macropores (<50 nm) or external surfaces [22]. The samples would have macropores.
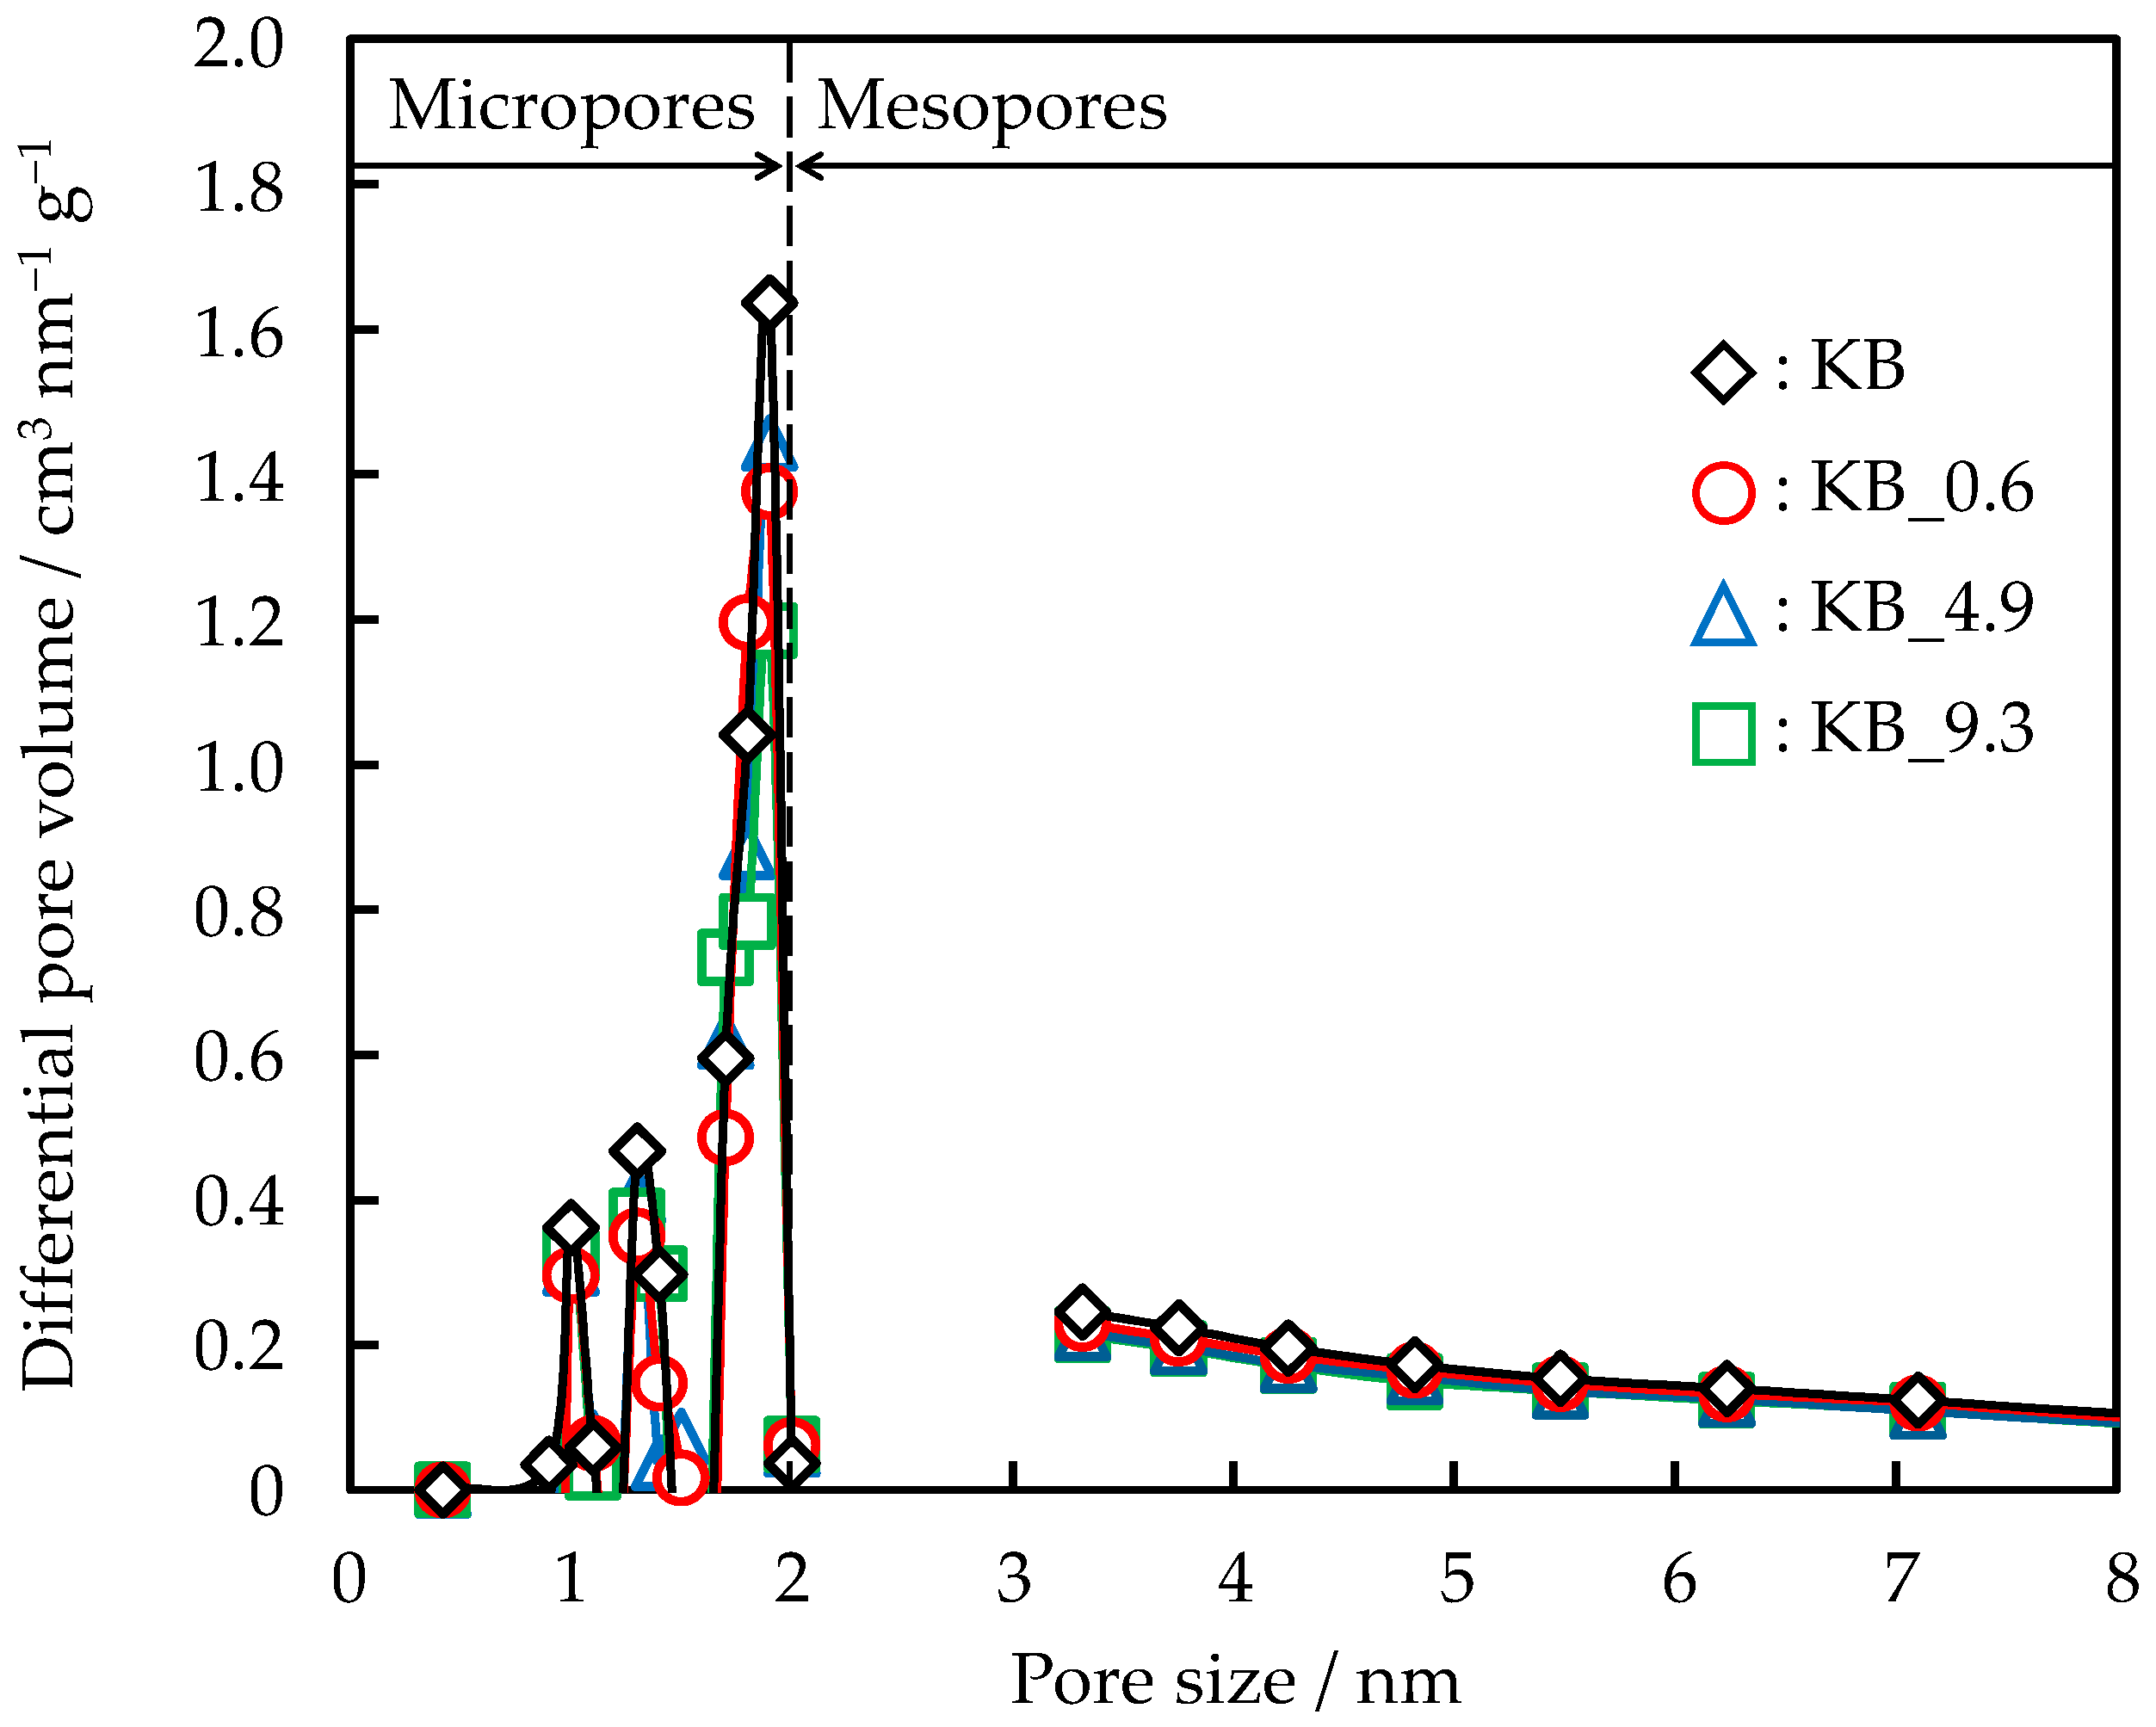
Differential PSDs for KB, KB_0.6, KB_4.9, and KB_9.3 are shown in Figure 2. In the micropore region, all samples had multiple differential PSD peaks. However, no PSD peaks were observed in the mesopore region. The KB and Pd-modified KBs would be micropore-dominant carbon materials. The PSD volumes of Pd-modified KBs were lower than those of KB. Table 1 summarizes the specific surface areas, micropore volumes, and mesopore volumes of each sample. The specific surface area, micropore volume, and mesopore volume of KB were 1925 m2 g−1, 0.290 cm3 g−1, and 2.09 cm3 g−1, respectively. The specific surface areas and pore volumes tended to decrease with increase in Pd contents. Pd modification, especially at higher concentrations, had negative effects on the porous properties. Excess Pd would most likely cover the KB surface, mechanically blocking and/or entering the pores.
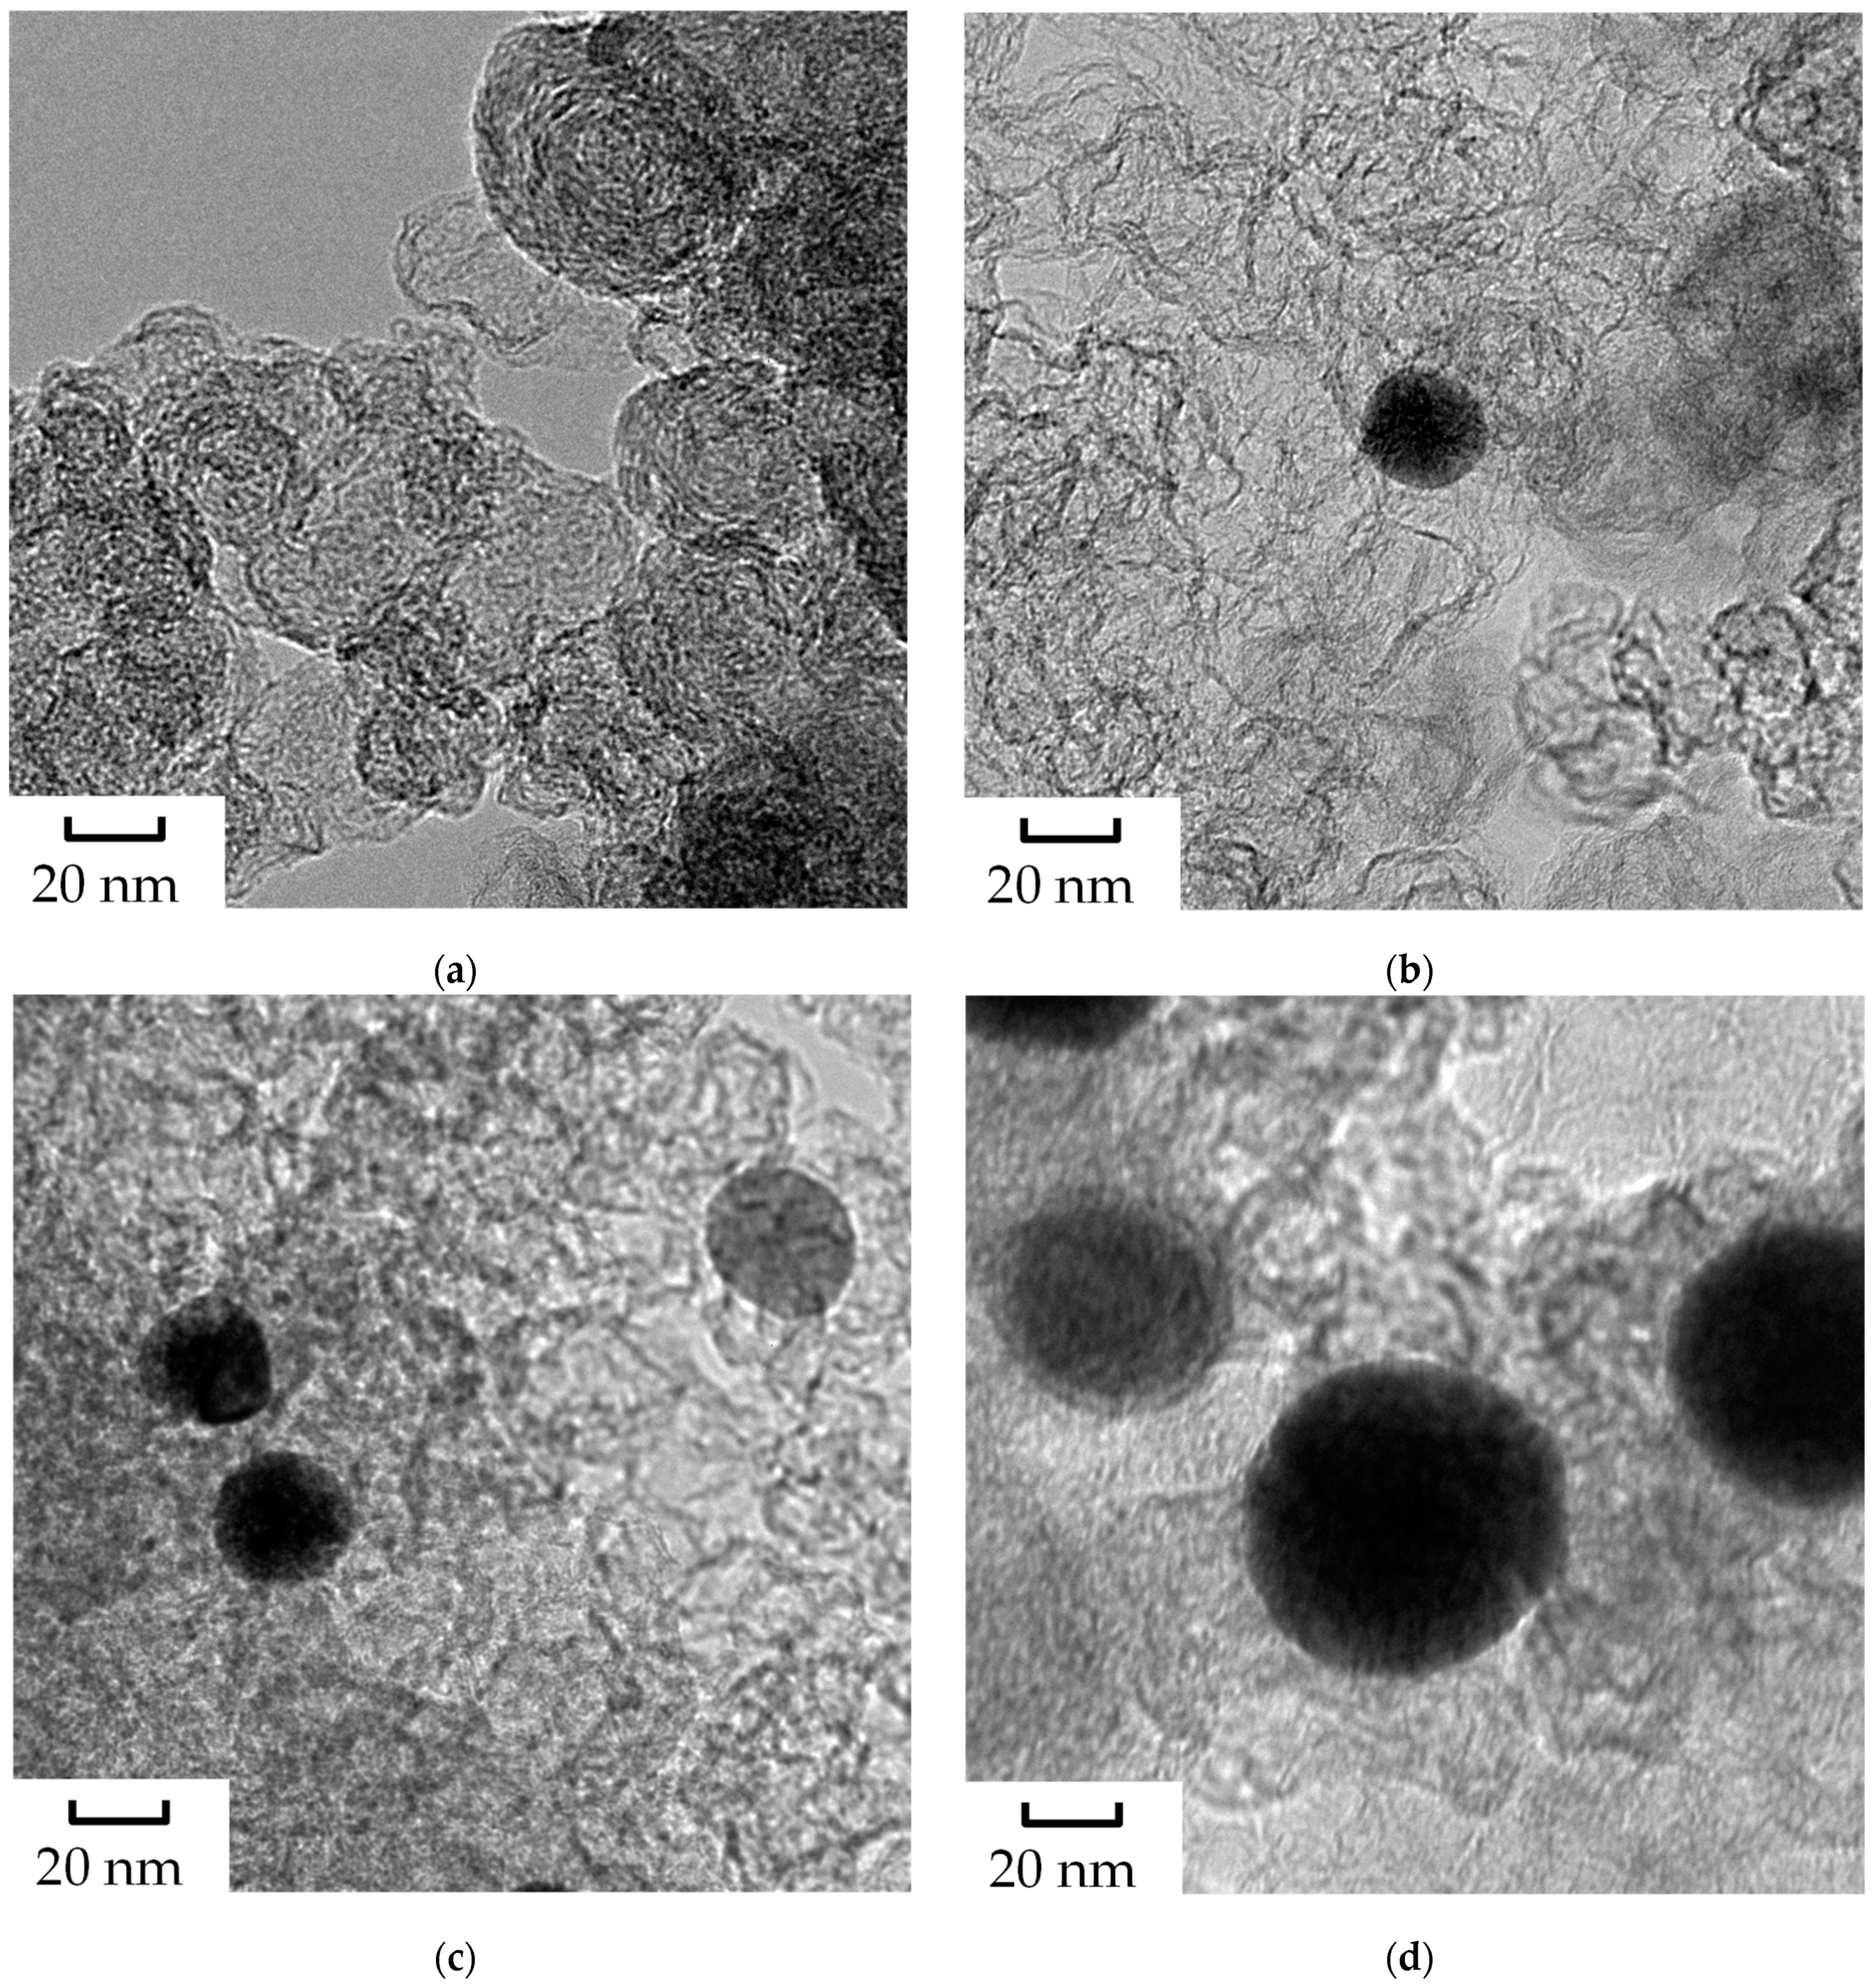
As shown in Figure 3, dispersed spherical Pd particles were observed for all Pd-modified KBs. The sizes of the Pd particles in KB_0.6 (Figure 3b) were approximately 25 nm, and those in KB_4.9 (Figure 3c) ranged approximately from 25 nm to 30 nm. Further, although the Pd content of KB_4.9 was approximately 8.2 times that of KB_0.6, the increase in the Pd content affected only the number of Pd particles. Conversely, for KB_9.3, as shown in Figure 3d, in addition to a further increase in the number of particles, the size of the Pd particles increased and became heterogeneous. The presence of these Pd particles supports the explanation for the decrease in the porous properties of the Pd-modified KBs, as summarized in Table 1.
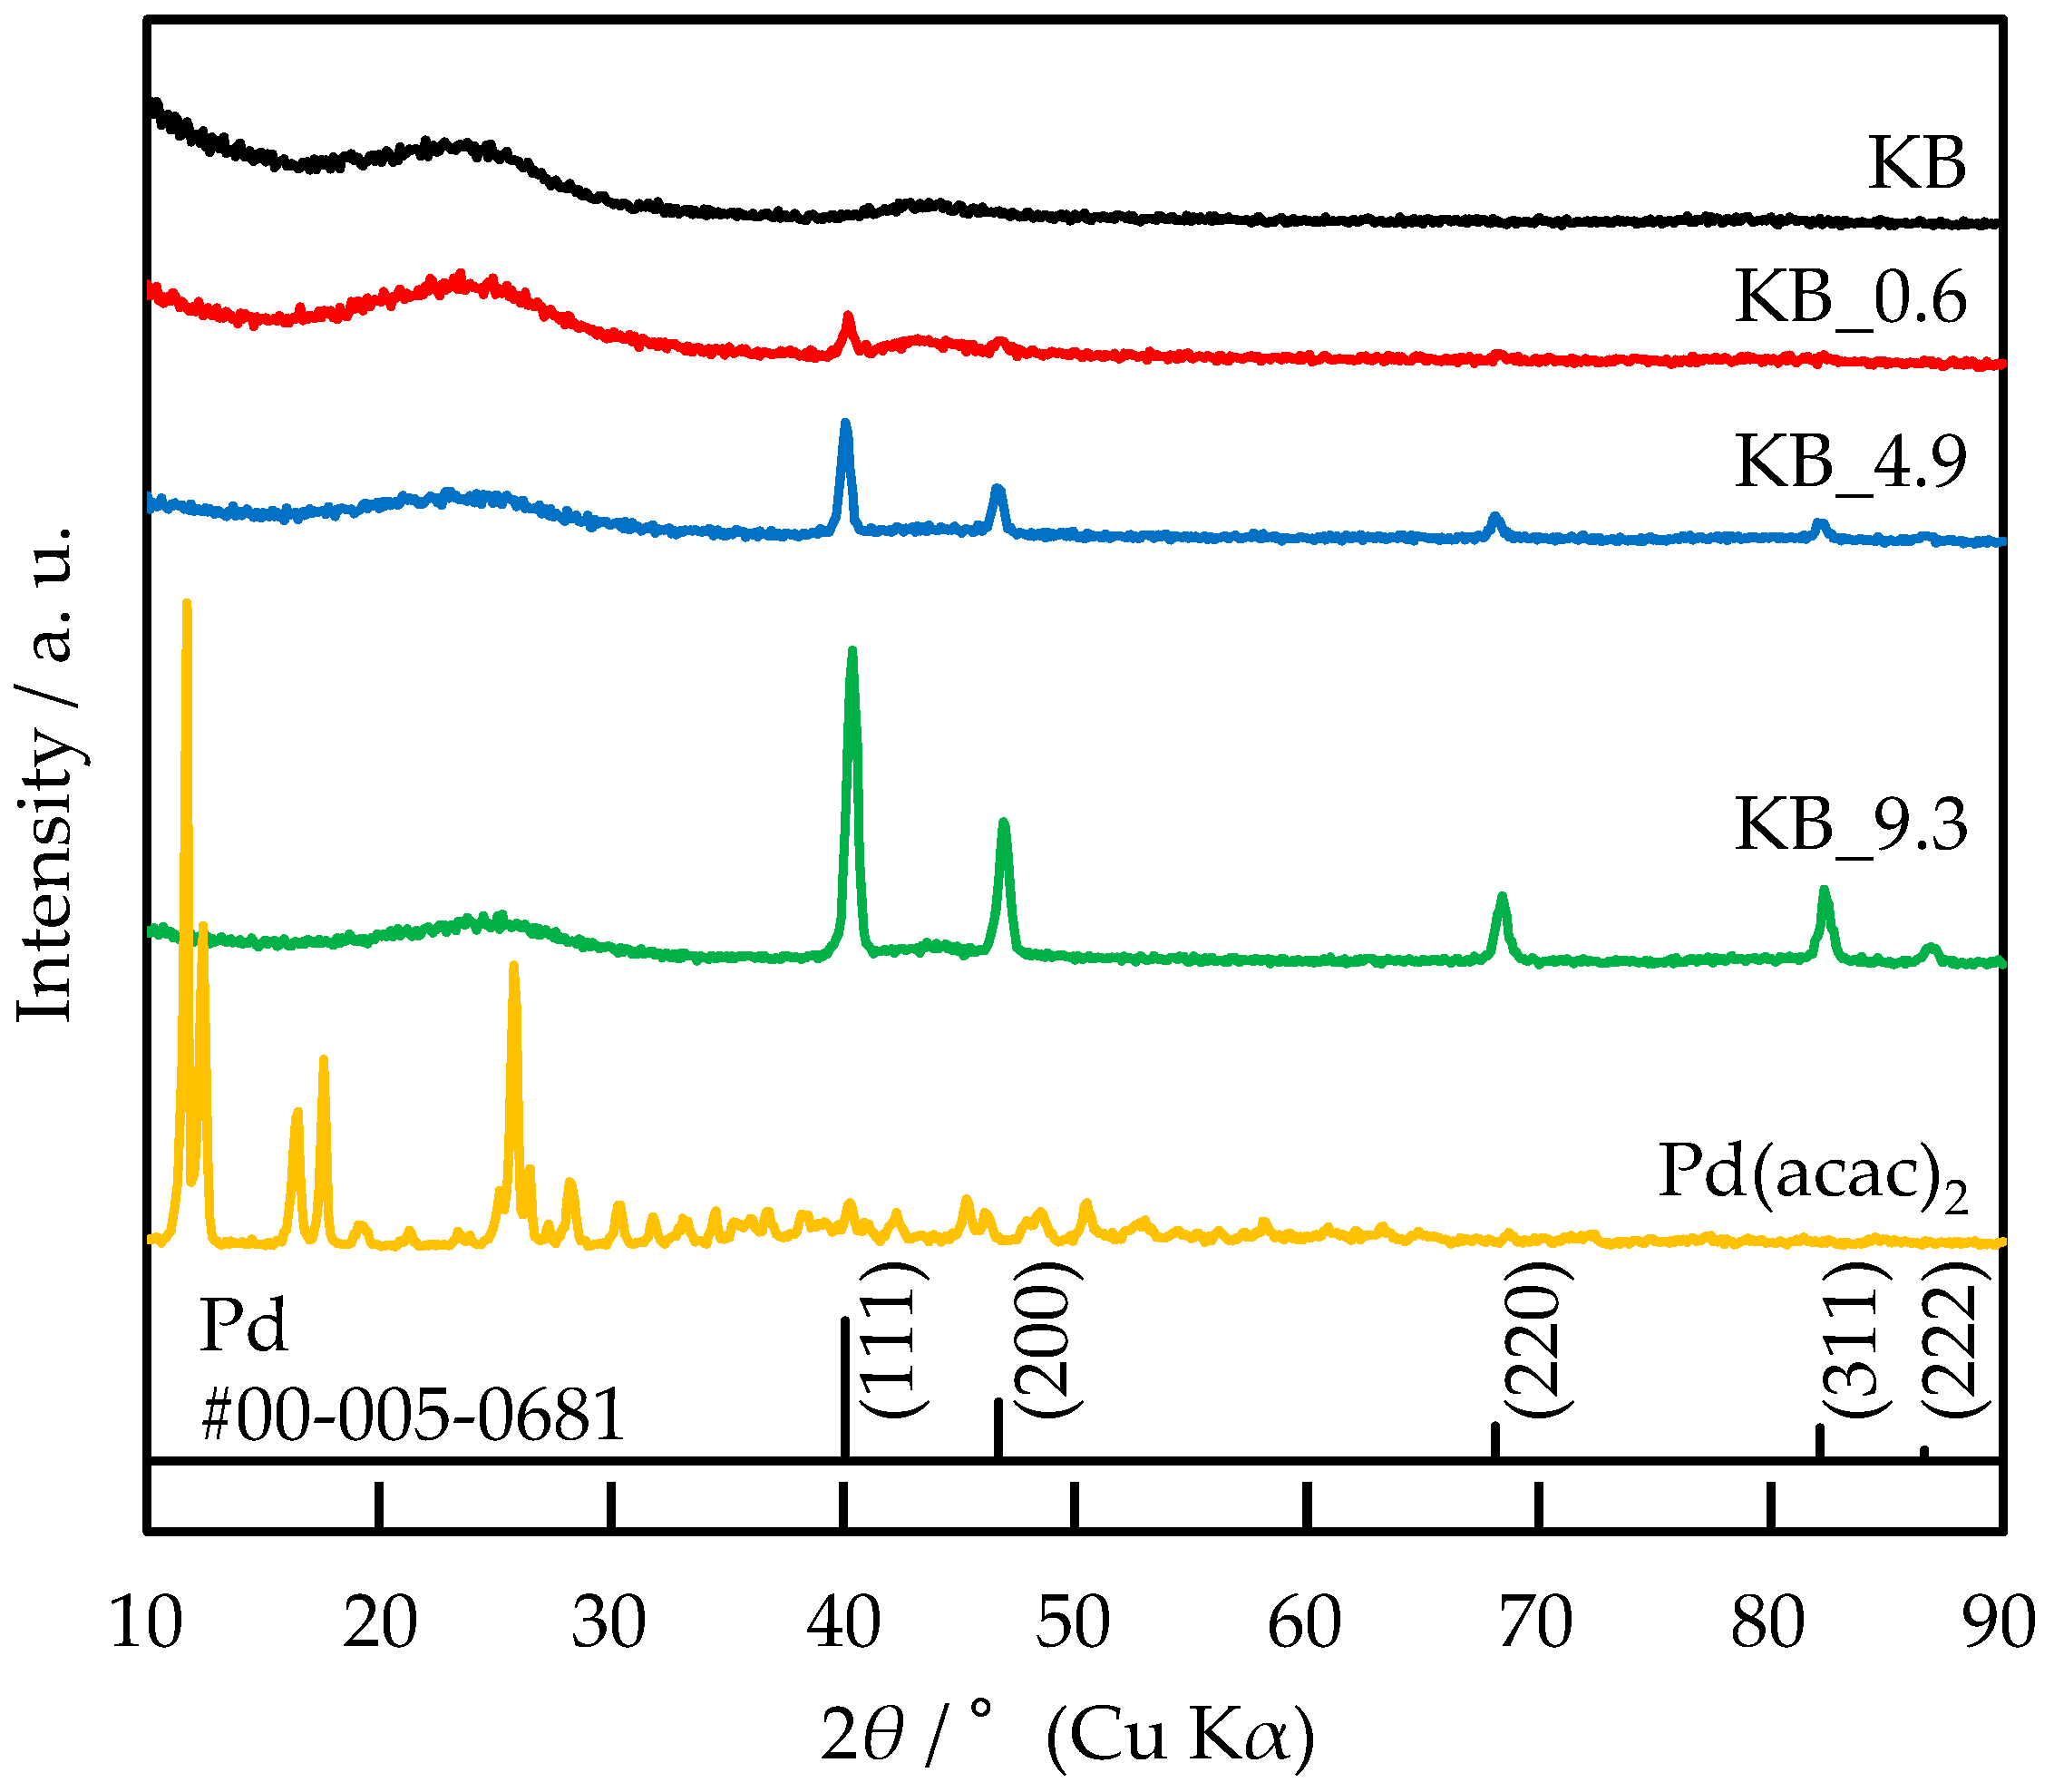
The XRD patterns of KB, KB_0.6, KB_4.9, KB_9.3, and Pd(acac)2 are shown in Figure 4. The XRD patterns of KB_9.3 showed typical XRD peaks at 2θ = 40°, 47°, 68°, 82°, and 87°. For KB_0.6 and KB_4.9, similar XRD peaks to that of KB_9.3 were observed. These peaks correspond to the peaks of Pd (JCPDS #00-005-0681), which is included at the bottom of Figure 4. Meanwhile, no peaks corresponding to Pd(acac)2 were observed for all Pd-modified KBs. Pd(acac)2 was completely pyrolyzed, and Pd was present as the metal phase. Furthermore, the intensity of the Pd peaks gradually increased with increasing Pd content. Two other broad peaks at approximately 2θ = 24° and 44° were observed for all samples. These two diffraction peaks were assigned to the (002) and (10) planes of graphite, respectively [6,7,8]. The carbon structures of the KB and Pd-modified KBs were amorphous [8] and disordered [7].
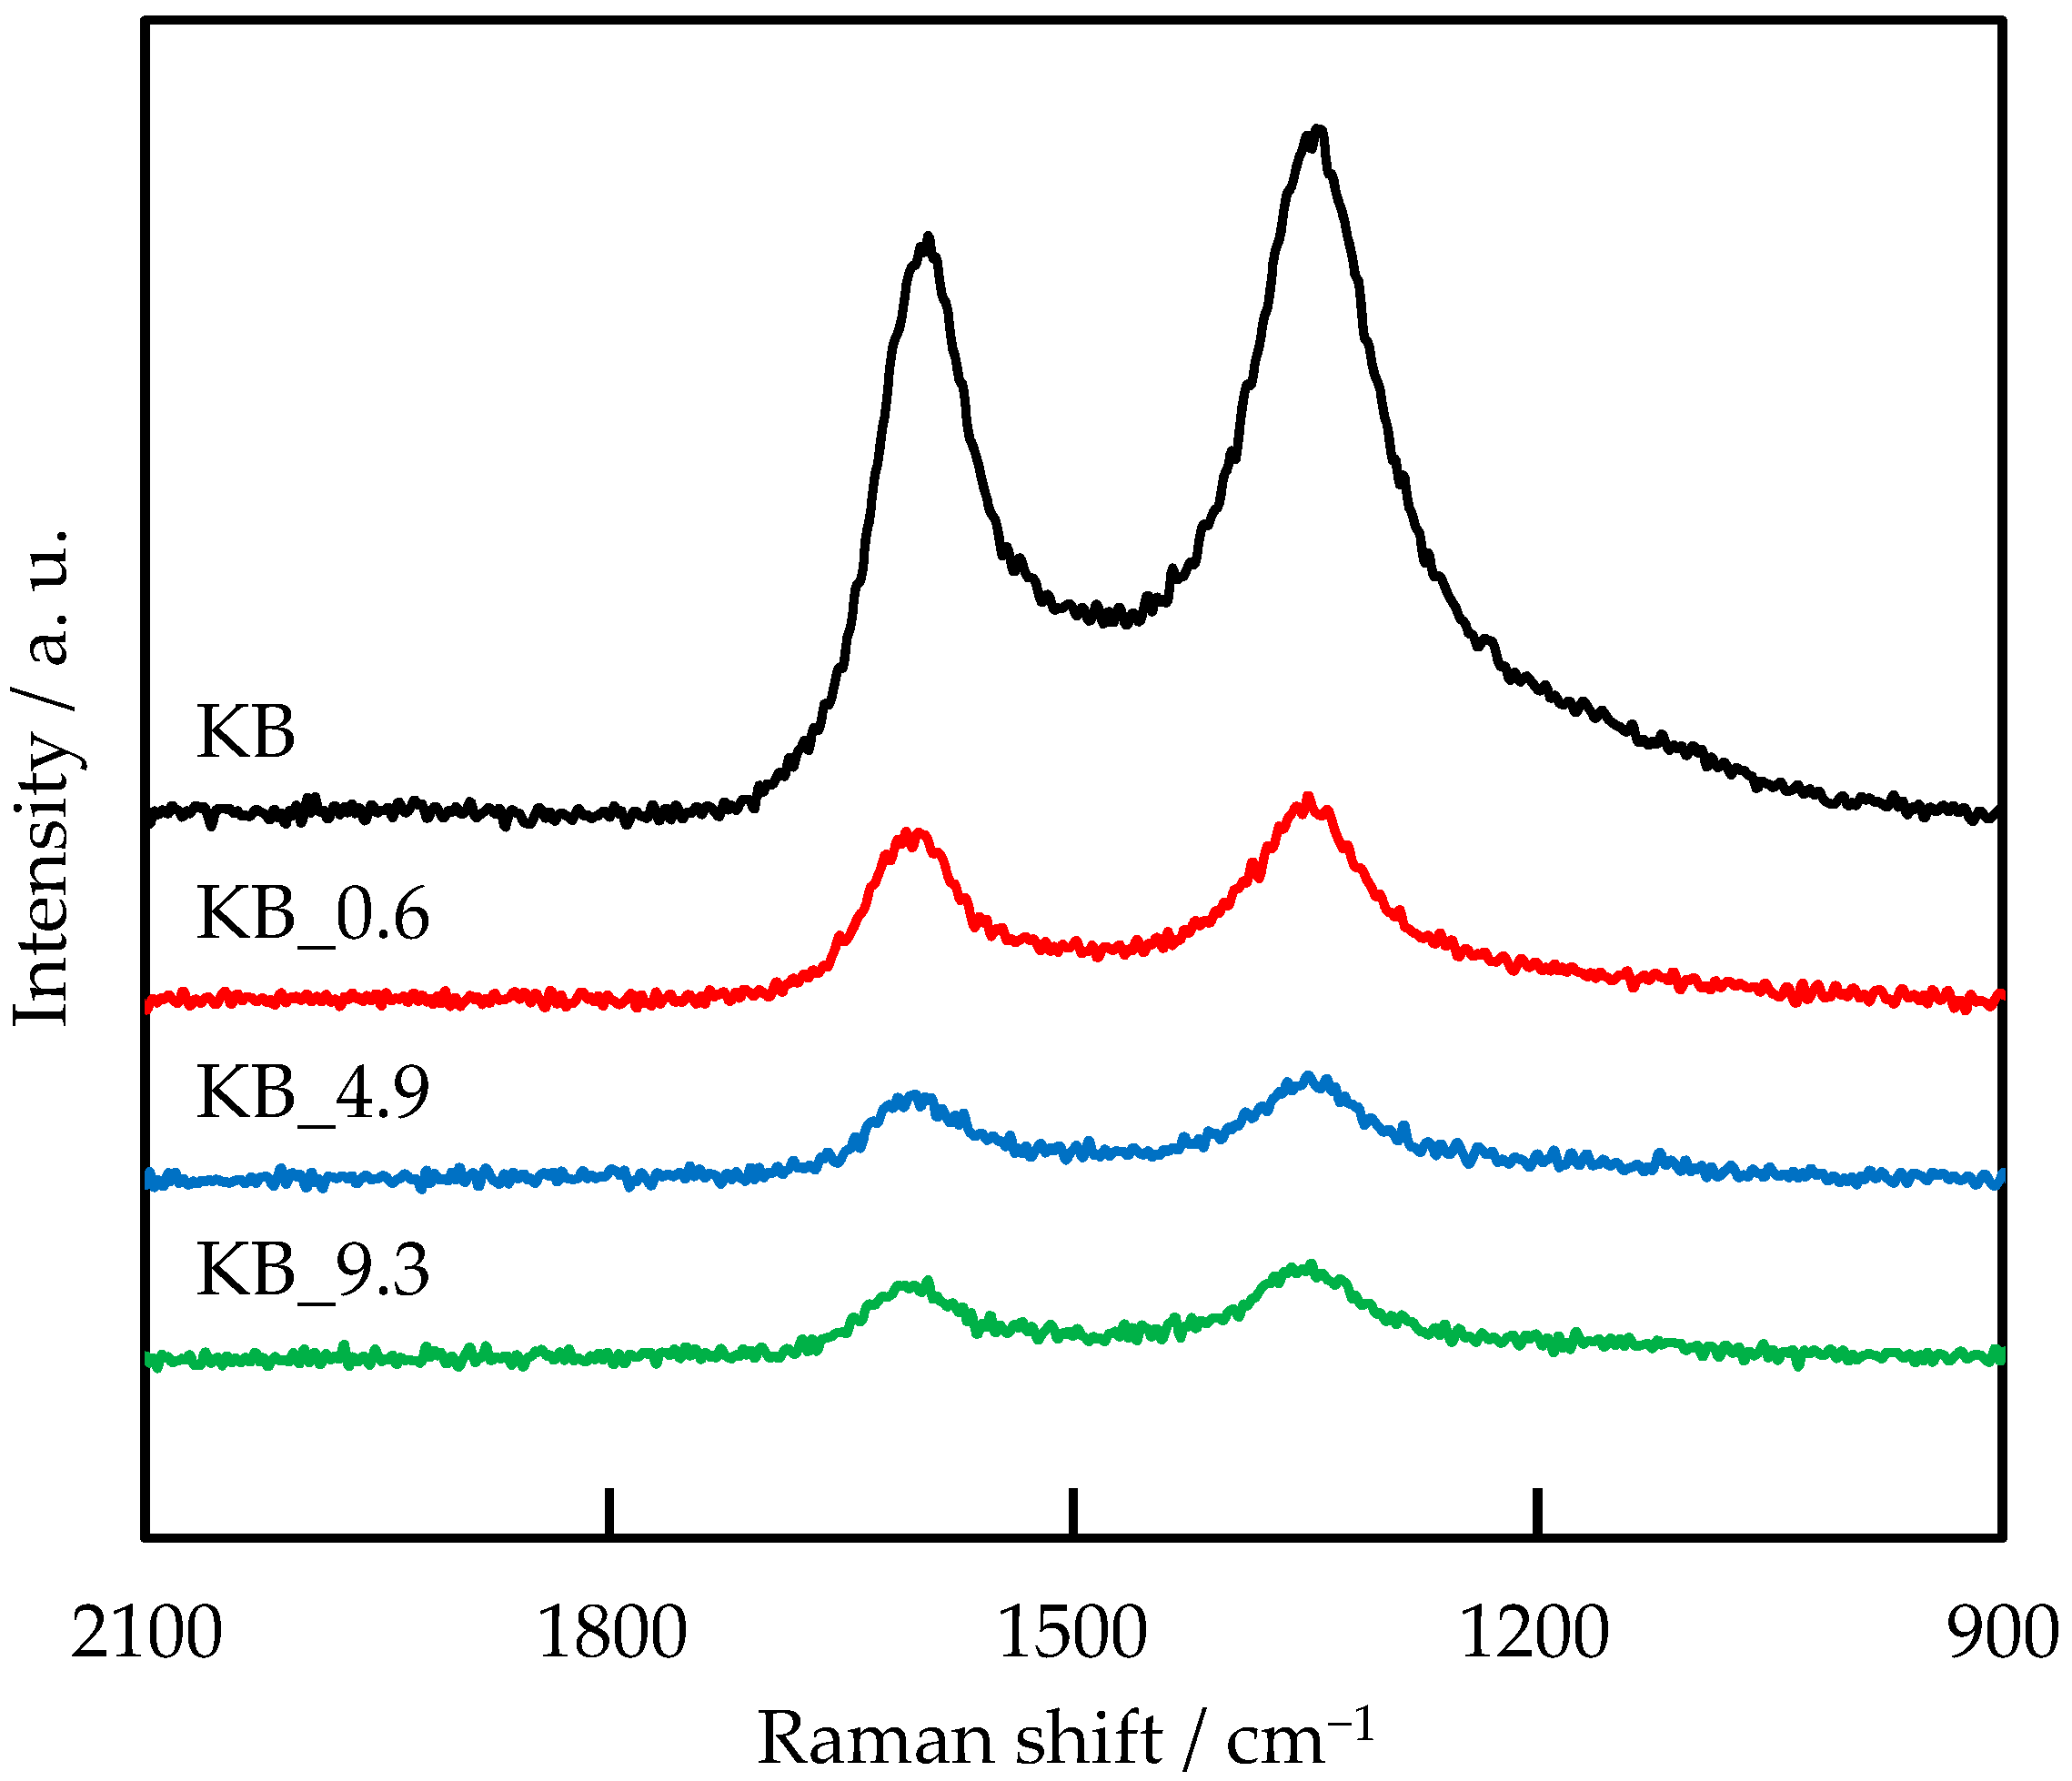
The Raman spectra of KB, KB_0.6, KB_4.9, and KB_9.3 are shown in Figure 5. All samples exhibited two clear peaks, which were classified to be in the D band at approximately 1345 cm−1 and the G band at approximately 1595 cm−1. The disordered carbons and graphitized carbons are represented by the D and G bands, respectively [7,8,31]. As a result, the intensity ratio of the D band to the G band (ID/IG) is used as a measure of the degree of disorder [7,8,31]. The ID/IG ratio of KB was 1.18, indicating that disordered carbons were present. The disorder of the KB structure was confirmed by both the XRD patterns in Figure 4 and the ID/IG ratios. The ratios of KB_0.6, KB_4.9, and KB_9.3 were 1.21, 1.25, and 1.21, respectively. The Pd modification process slightly increased the proportion of disordered carbon.
3.2. Hydrogen Adsorption
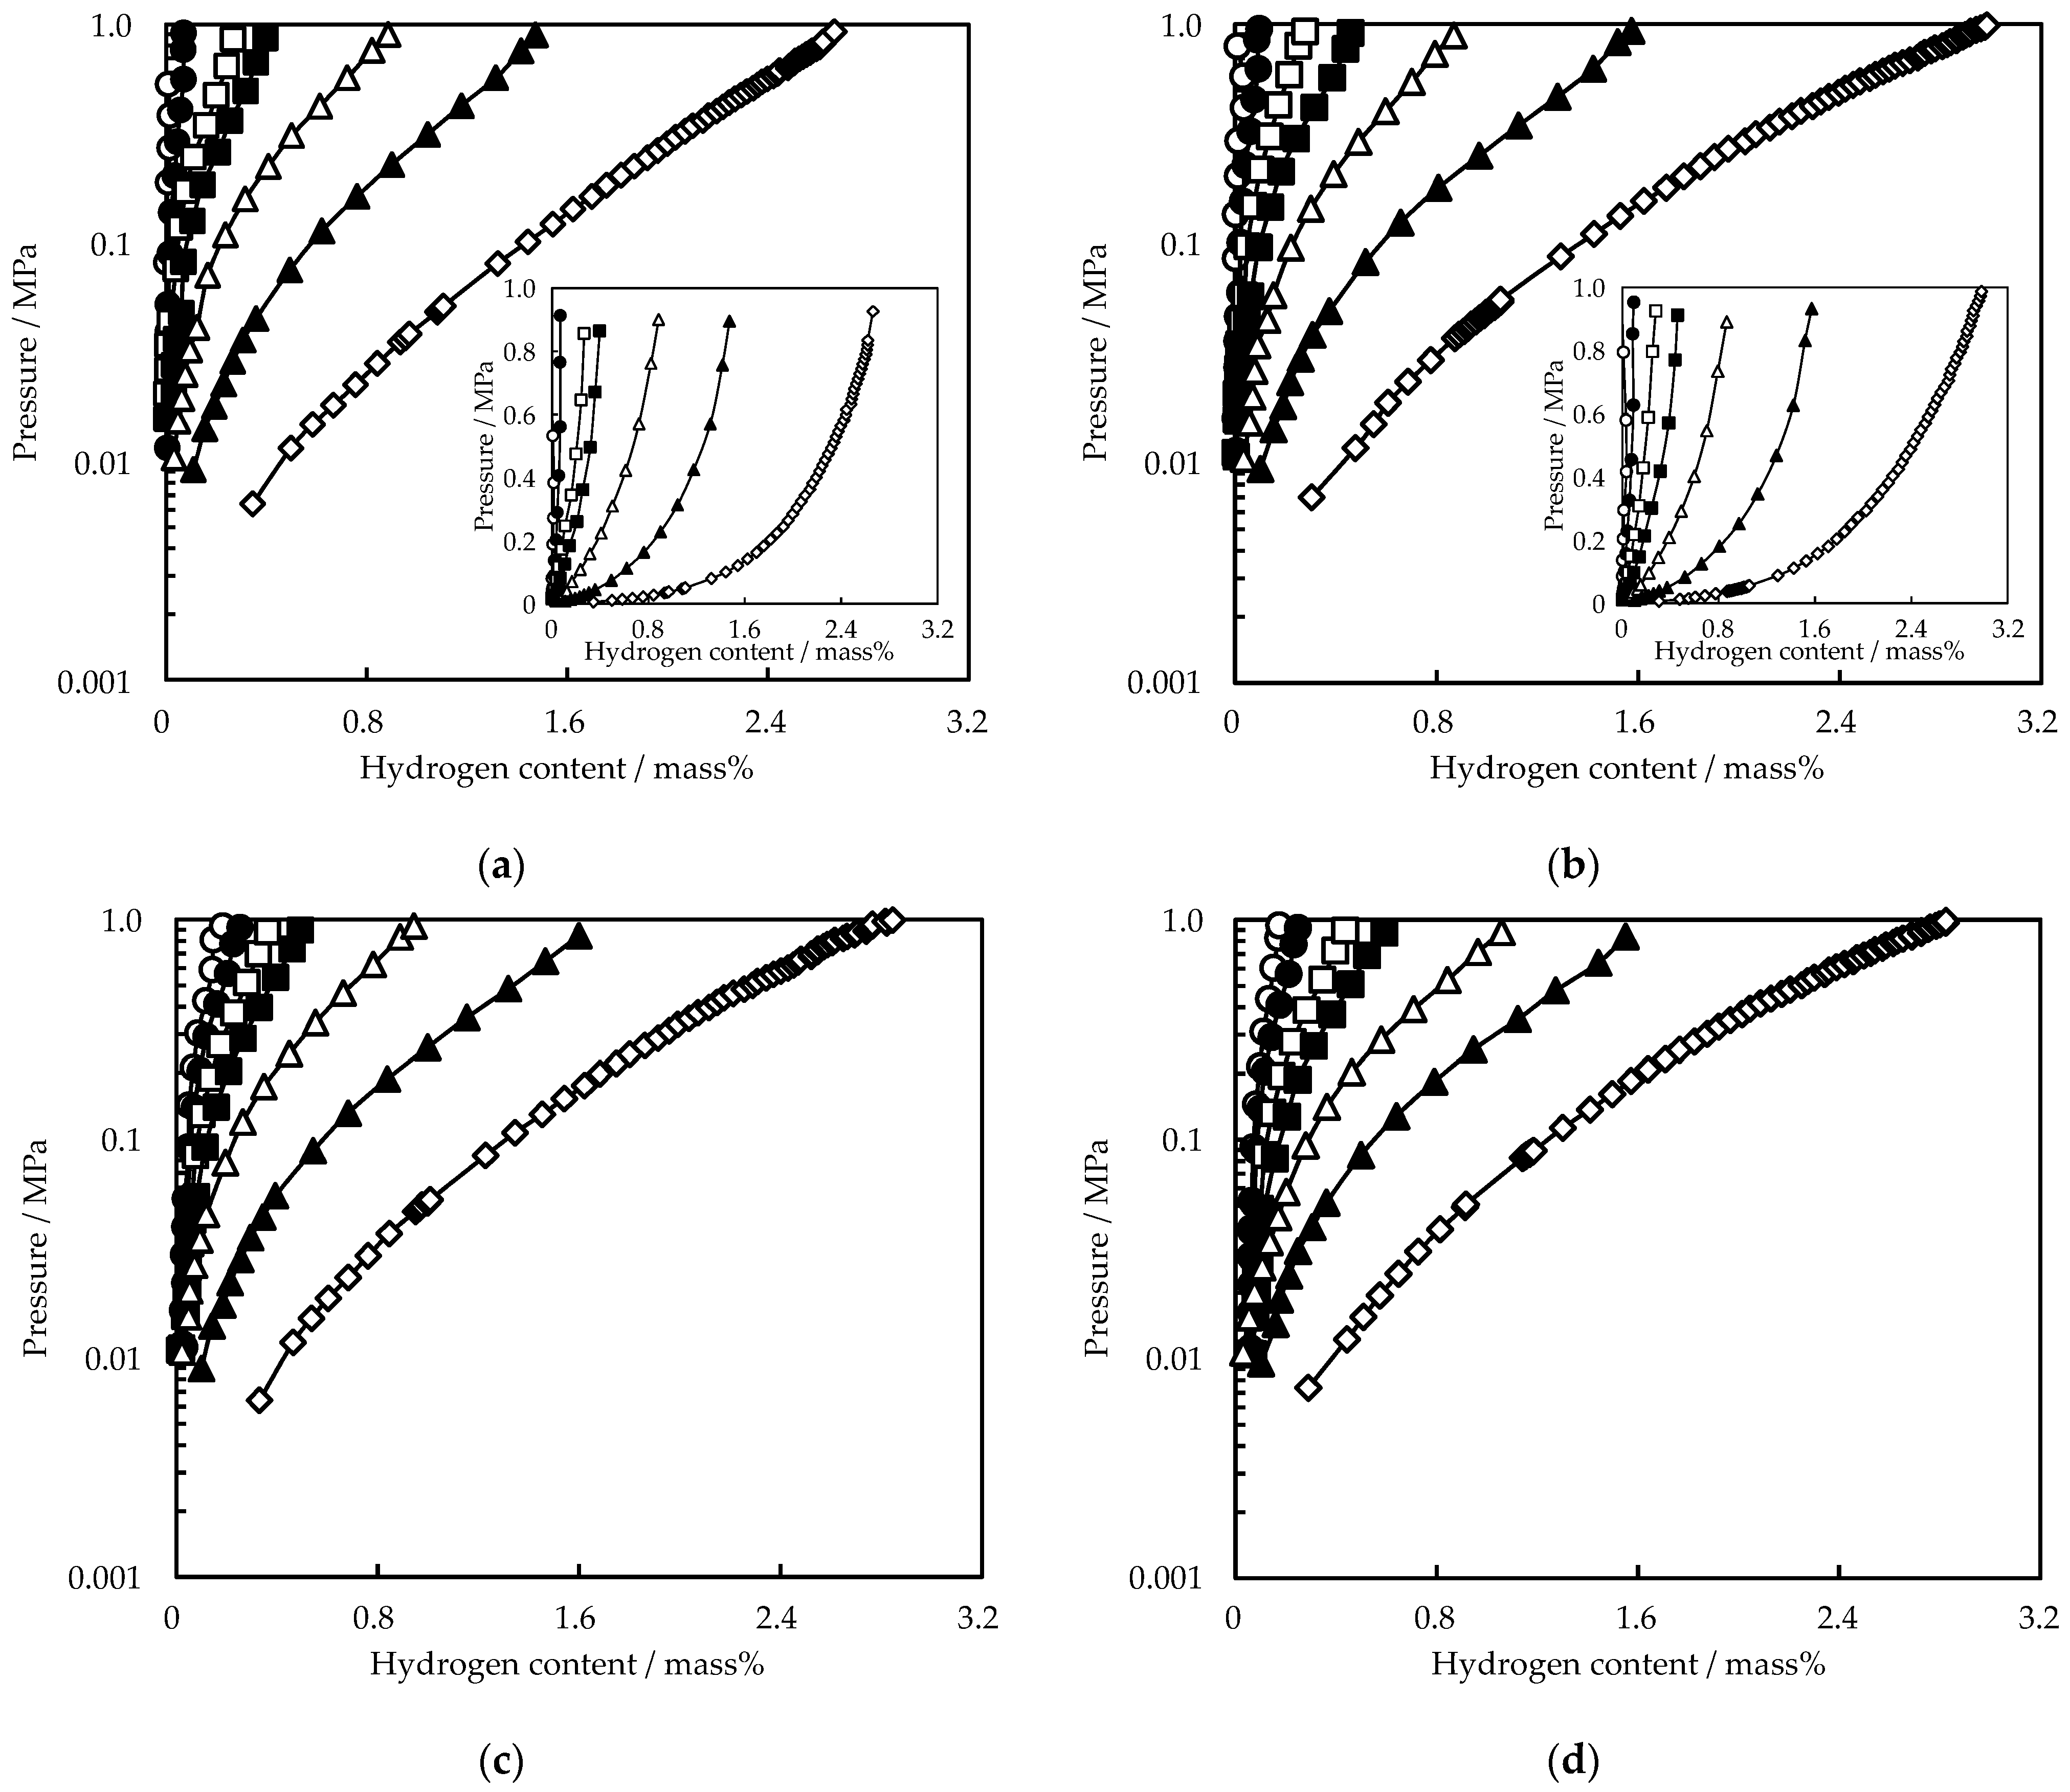
The hydrogen adsorption isotherms at 77 K, 98 K, 123 K, 148 K, 173 K, 223 K, and 273 K for KB, KB_0.6, KB_4.9, and KB_9.3 are shown in Figure 6. While the hydrogen contents of KB and KB_0.6 at 273 K reached a saturated hydrogen content below 1 MPa of hydrogen pressure, KB_4.9 and KB_9.3 exhibited increases in their hydrogen contents with the hydrogen pressure at each temperature. Regardless of the Pd content, the lower temperature gave the higher hydrogen content. The cited target of 6.5 mass % will possibly be attained under higher pressures.
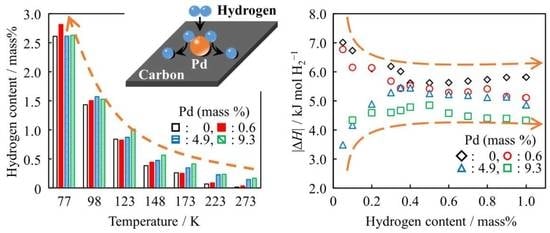
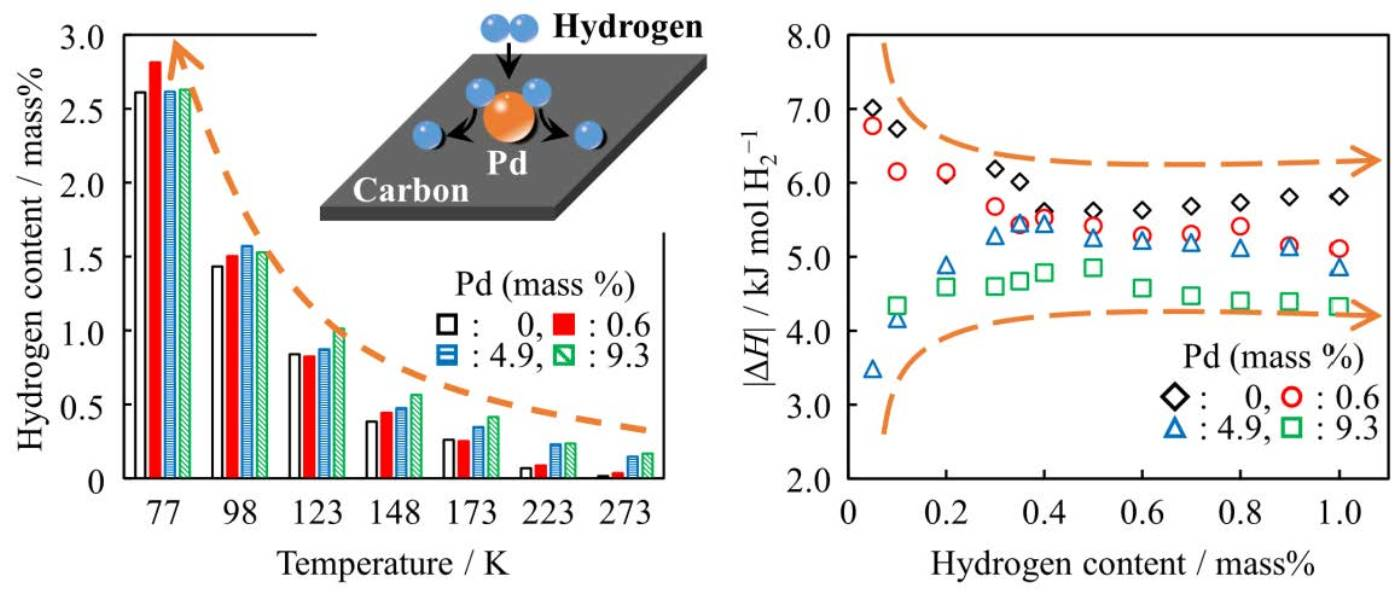
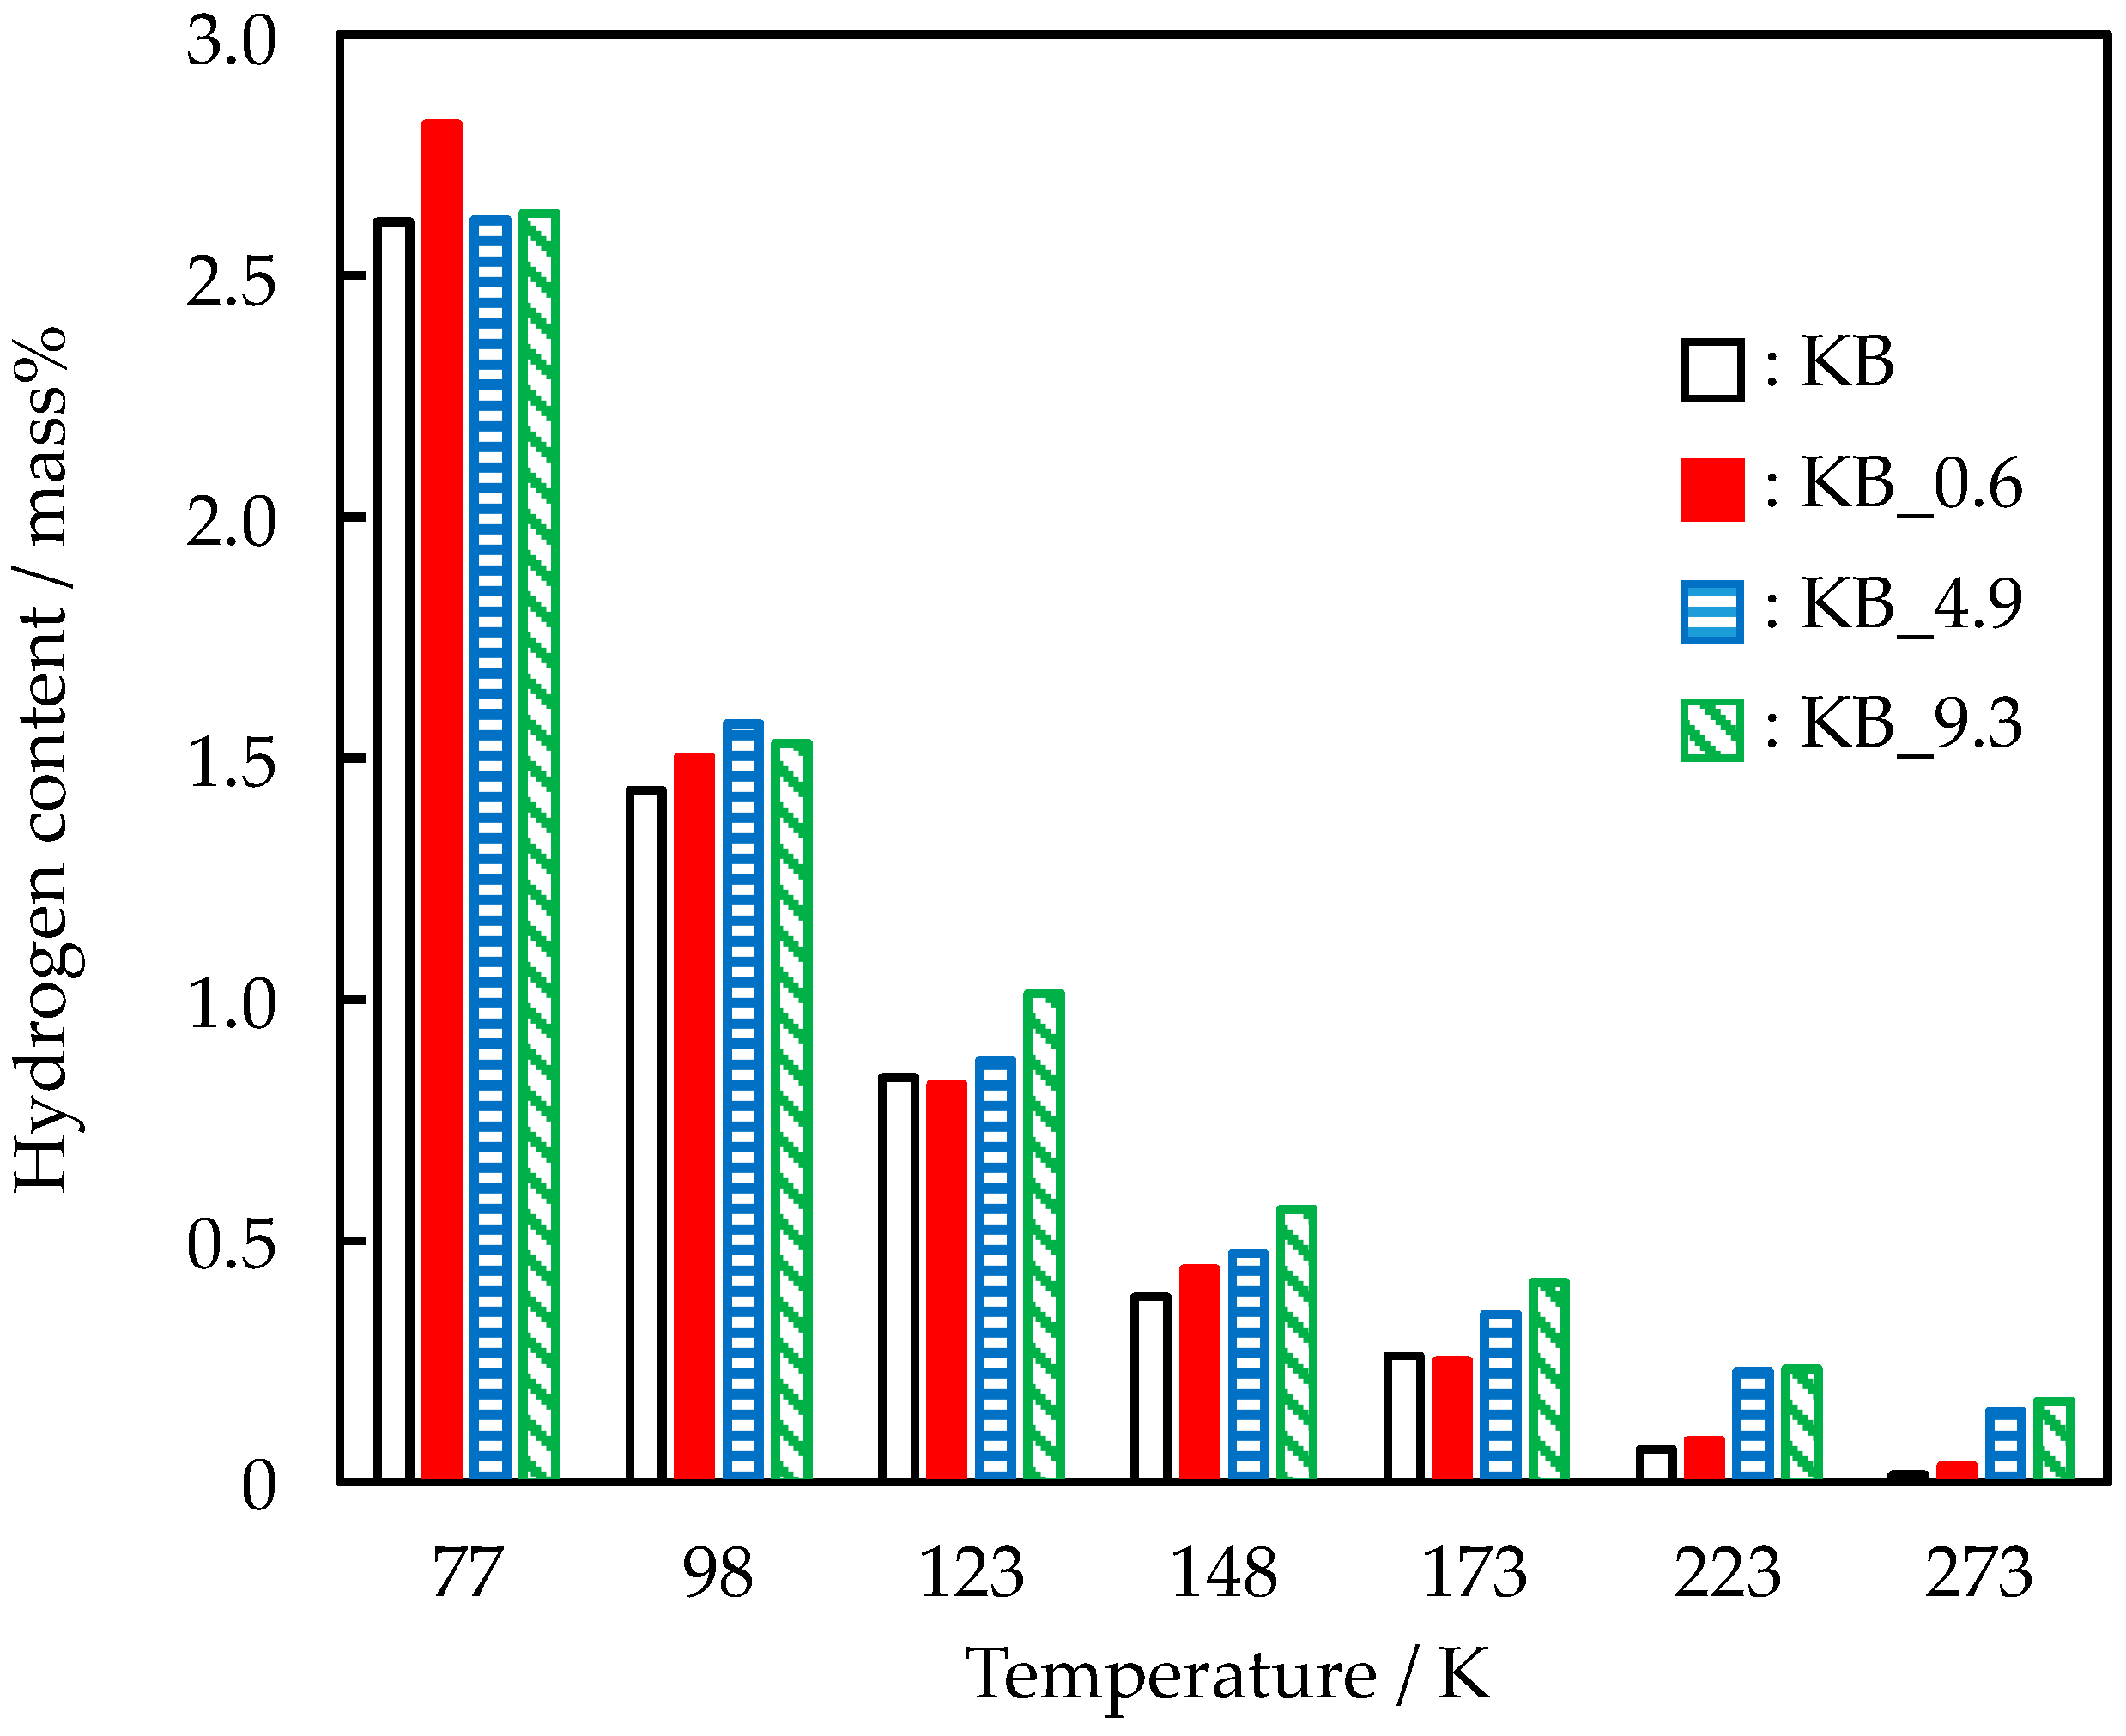
The hydrogen contents under 0.8 MPa of hydrogen of all samples at various temperatures are shown in Figure 7. The measurement accuracy based on the blank measurements at 77 K, 223 K, and 273 K were ±0.093 mass %, ±0.057 mass %, and ±0.035 mass %, respectively. The hydrogen content of KB was 2.61 mass % at 77 K. An almost continuous increase in hydrogen content caused by the Pd coexistence was observed at each temperature. At 77 K, KB_0.6 showed the maximum hydrogen content of 2.81 mass % and this is reflected in the figure. The fact that KB_0.6 had the highest hydrogen capacity at 77 K compared with other samples was confirmed by a repeated measurement giving 2.94 mass % of hydrogen content. The highest hydrogen contents at 98 K and temperatures above 98 K were observed for KB_4.9 and KB_9.3, respectively. While a difference in hydrogen content between KB and KB_0.6 could not be noticed at 223 K and 273 K, there was a distinct difference in the hydrogen content between the two groups, the KB and KB_0.6 group and the KB_4.9 and KB_9.3 group. At those temperatures, Pd contents above some threshold value seemed to be necessary to bring about notable effects of metal modification. The Pd content needs to be changed depending on the desired temperature. The hydrogen adsorption using carbon materials and carbon-dominant materials was advantageous at lower temperatures.
Figure 8 shows the excessive hydrogen contents under 0.8 MPa of hydrogen of Pd-modified KBs at various temperatures. At least three forms of hydrogen uptake mechanisms were assumed: (1) physisorption of hydrogen, (2) formation of Pd hydrides, and (3) spillover of hydrogen atoms from Pd to KB [33]. The excessive hydrogen content was calculated by subtracting the sum of the physisorption content and the occluded content to form Pd hydride from the measured hydrogen content; thus, the excessive content would be approximately equal to the spillover contribution. It is of note that the maximum temperature of the present adsorption measurement was 273 K, while Pd rapidly forms hydride at room temperature under low pressures [38]. When Pd formed a hydride, PdH0.6 [4], the hydrogen content was calculated to be 0.565 mass %. Considering the difference in the specific surface area of KB and the Pd content, the hydrogen contents of mechanisms (1) and (2) for KB_0.6 at 77 K were 2.63 mass % and 3.39 × 10⁻³ mass %, respectively. The total hydrogen content was thus calculated to be 2.63 mass %. The calculated value differed by 0.18 mass % from the measured value. The excessive hydrogen content, through the cooperative effect, also tended to be advantageous at lower temperatures. KB_0.6 showed a strong tendency in this regard. Furthermore, despite reduced surface area and pore volume, a higher Pd content was more effective. The saturated hydrogen content would be dependent on the Pd content based on the relationship between the excessive hydrogen content and the Pd content. KB_0.6 had the maximum hydrogen content at 77 K, as shown in Figure 6 and Figure 7. An appropriate combination of atomic hydrogen production and adsorption is expected to further increase the hydrogen content.
3.3. Enthalpy and Entropy Change
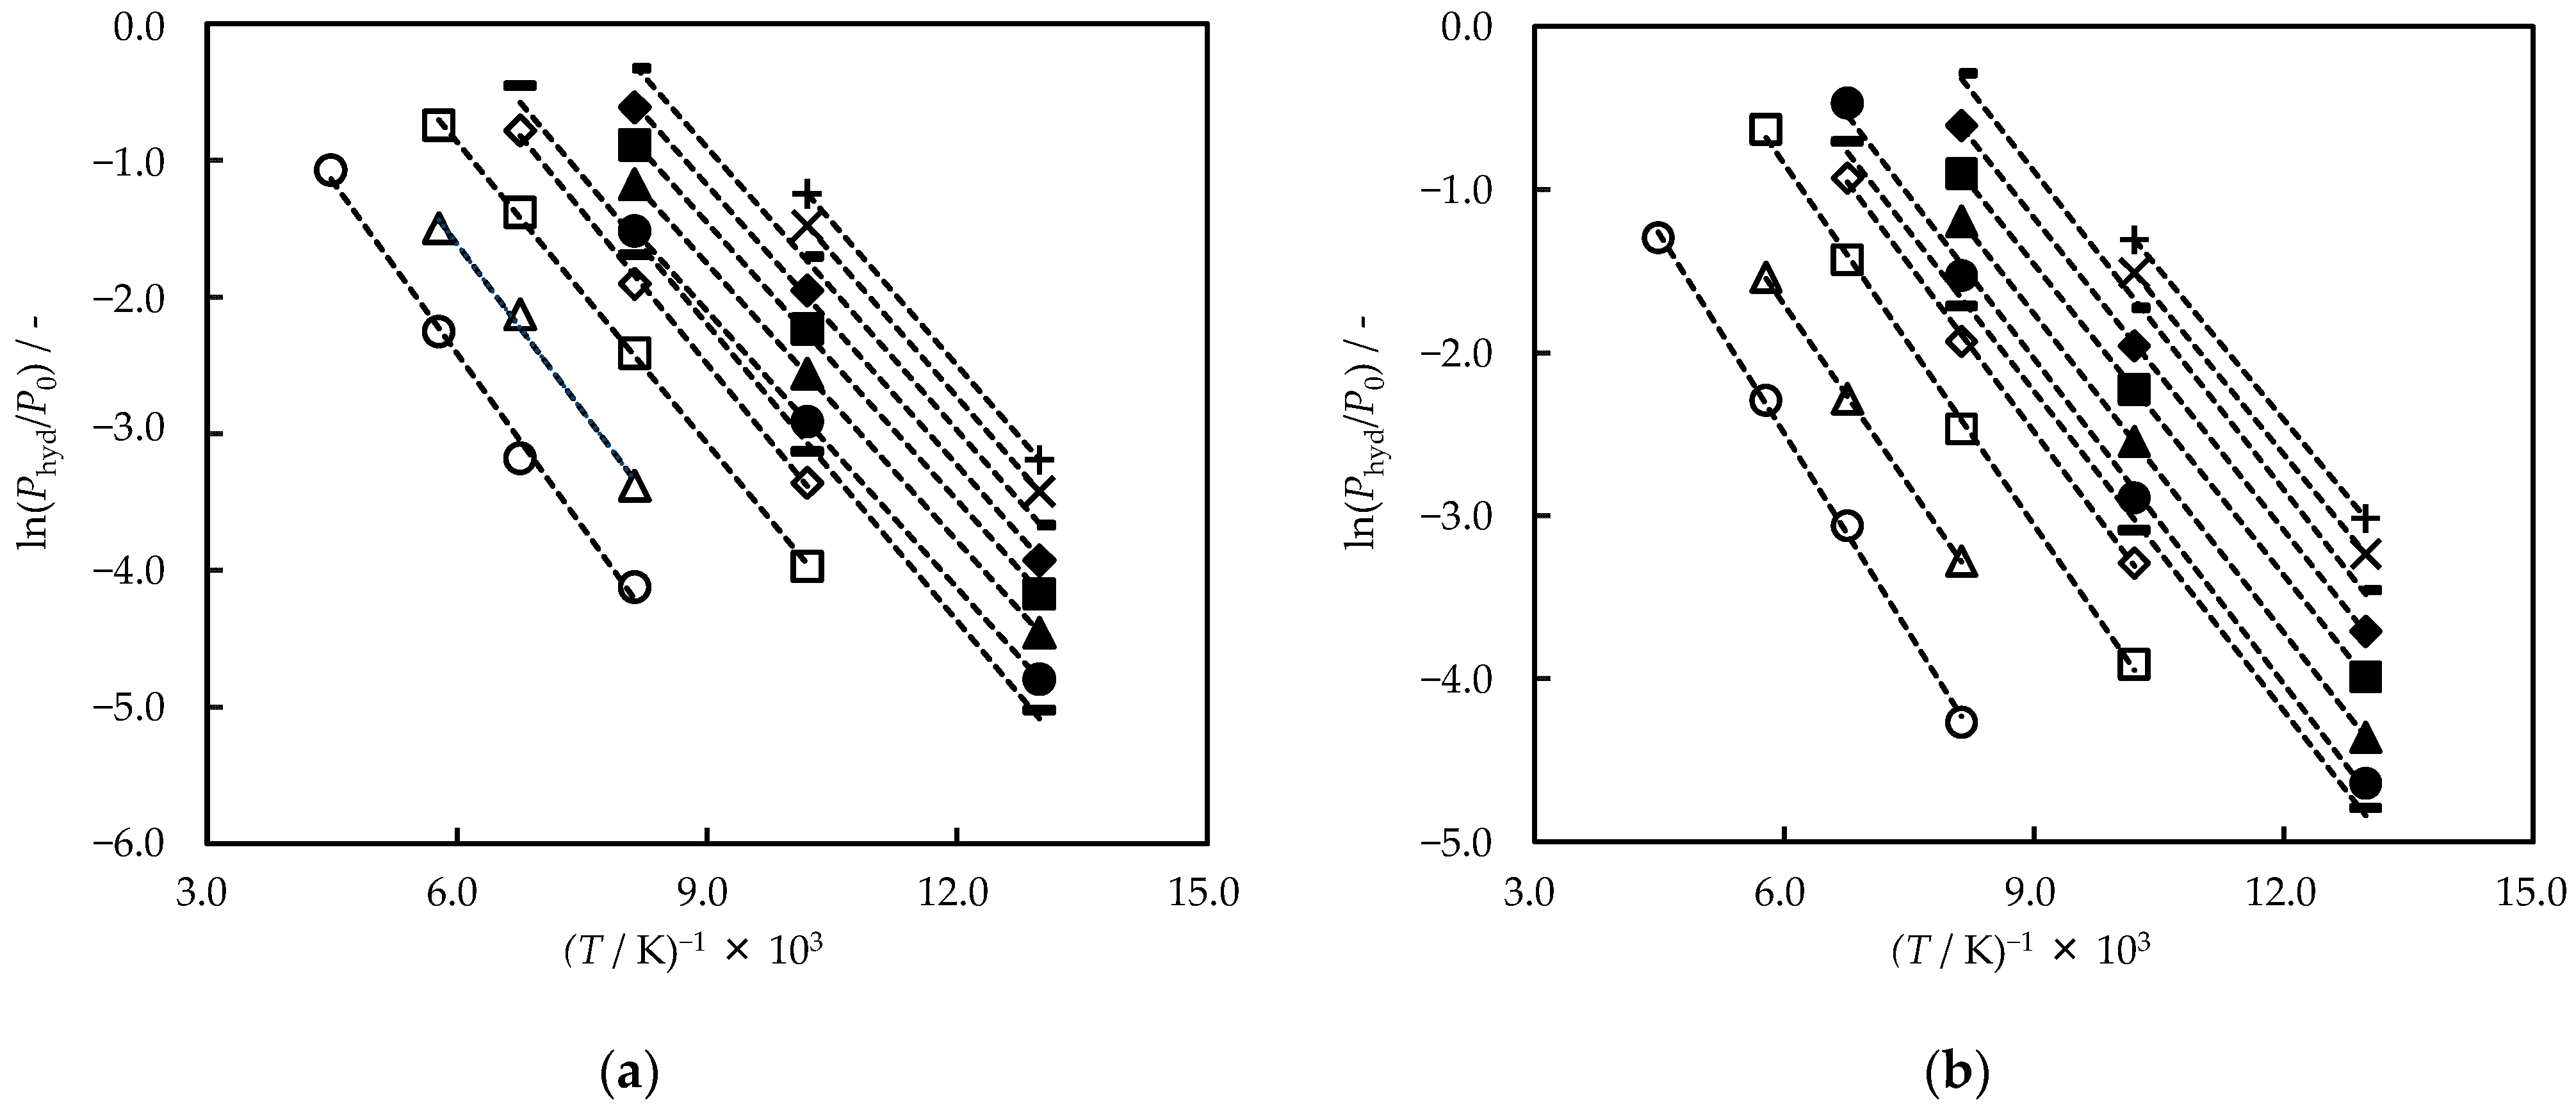
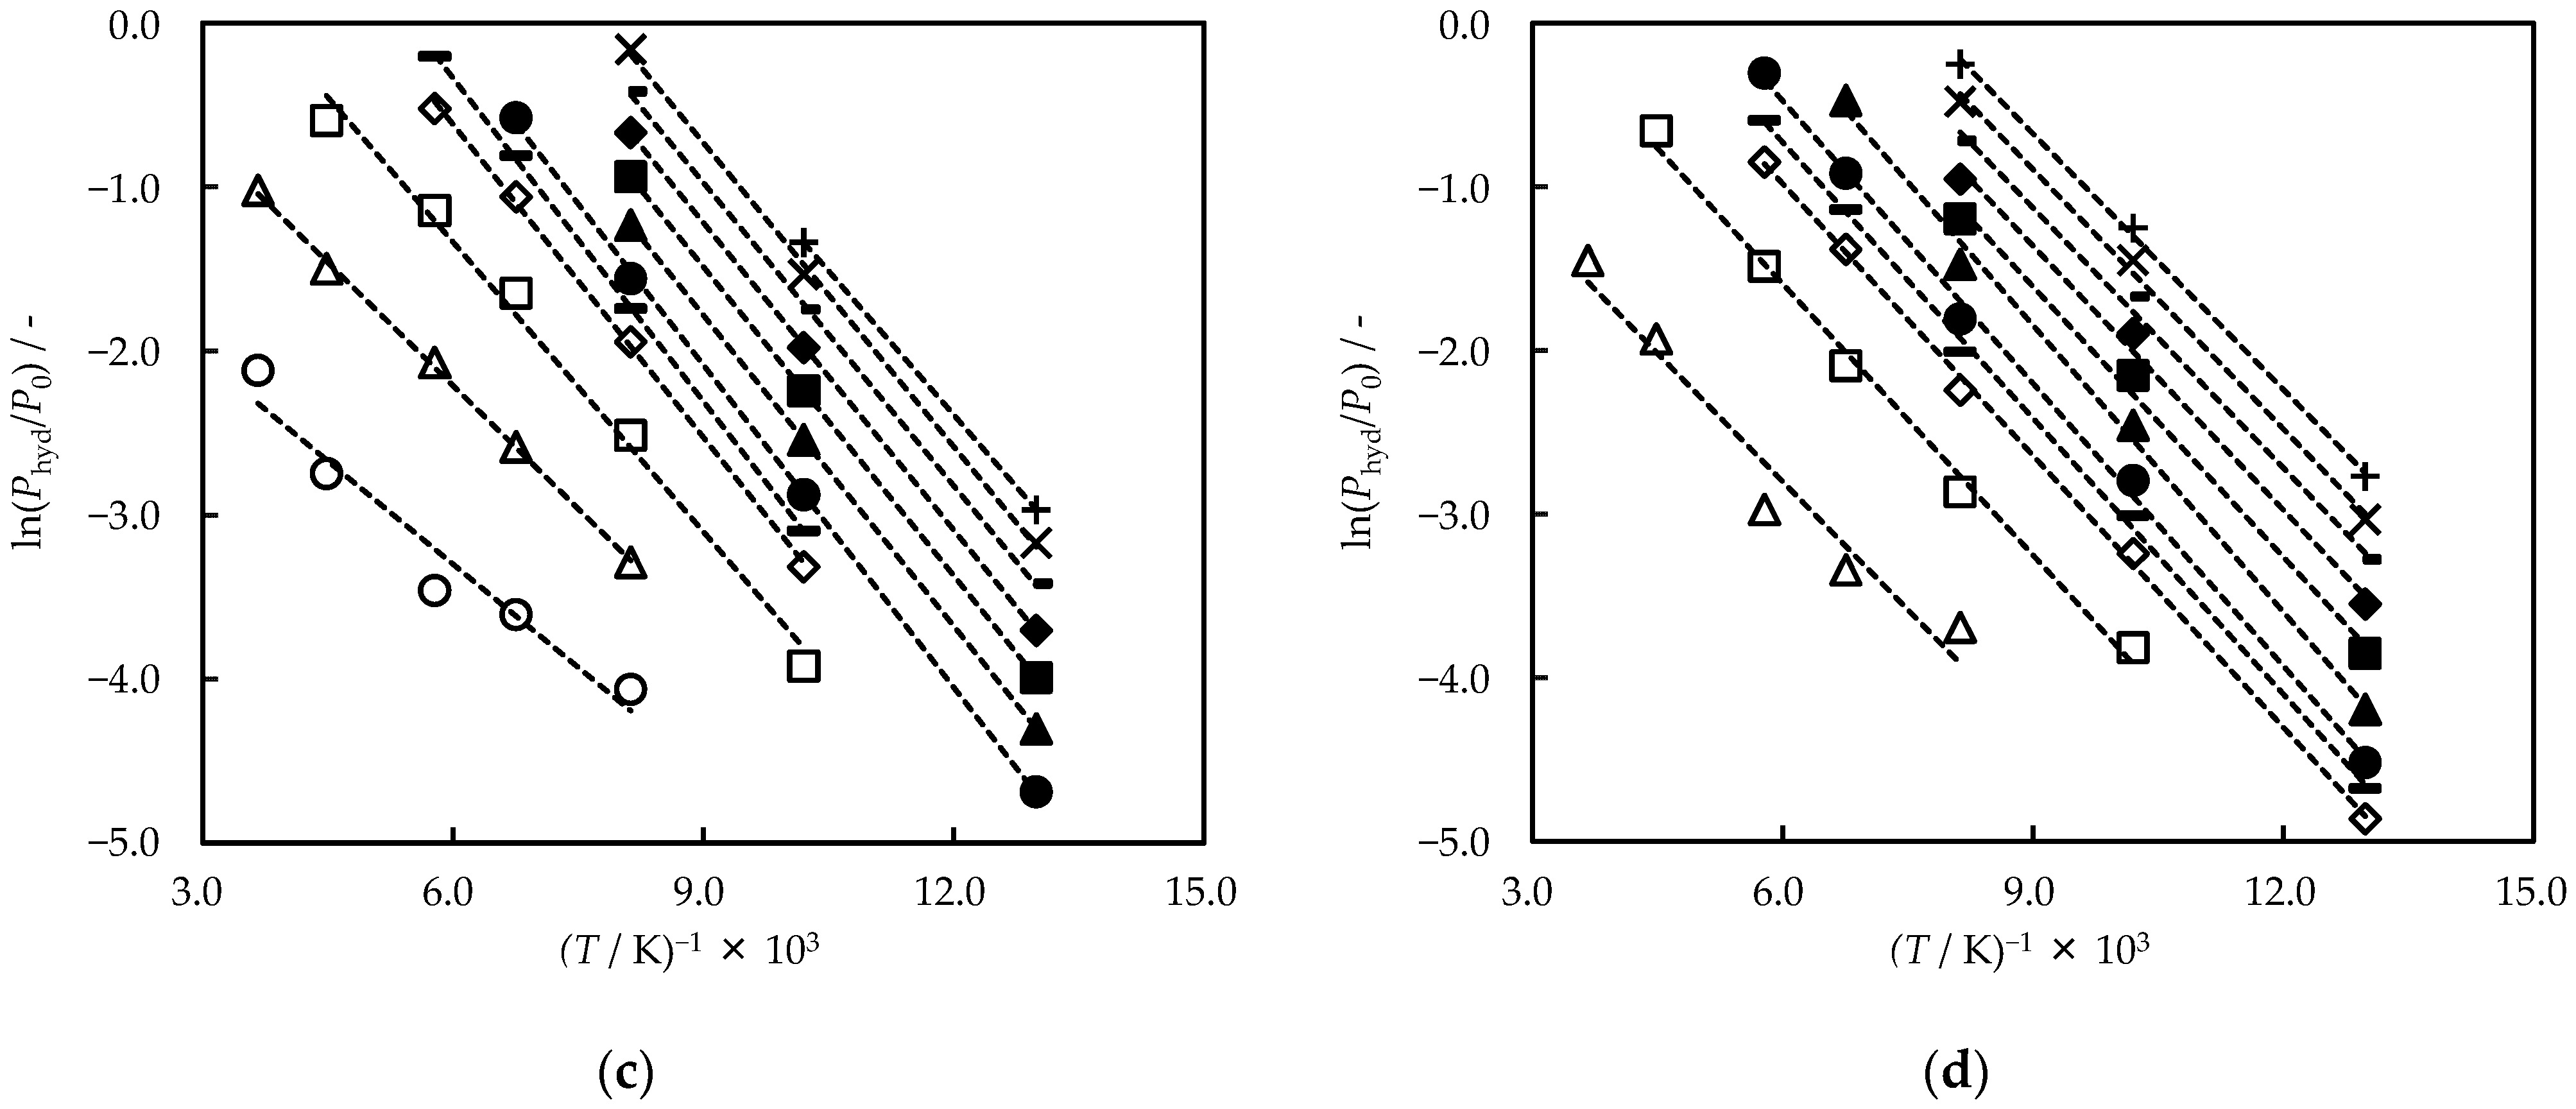
Figure 9 illustrates the van’t Hoff plots derived from the hydrogen adsorption data shown in Figure 6. The plot of the 0.05 mass % of hydrogen content for KB_9.3 was not able to be calculated owing to the lack of plural isotherm data. The van’t Hoff plots of KB demonstrated good linearity under all hydrogen content conditions. However, for the Pd-modified KBs, the linearity was not very good for the lower hydrogen contents.
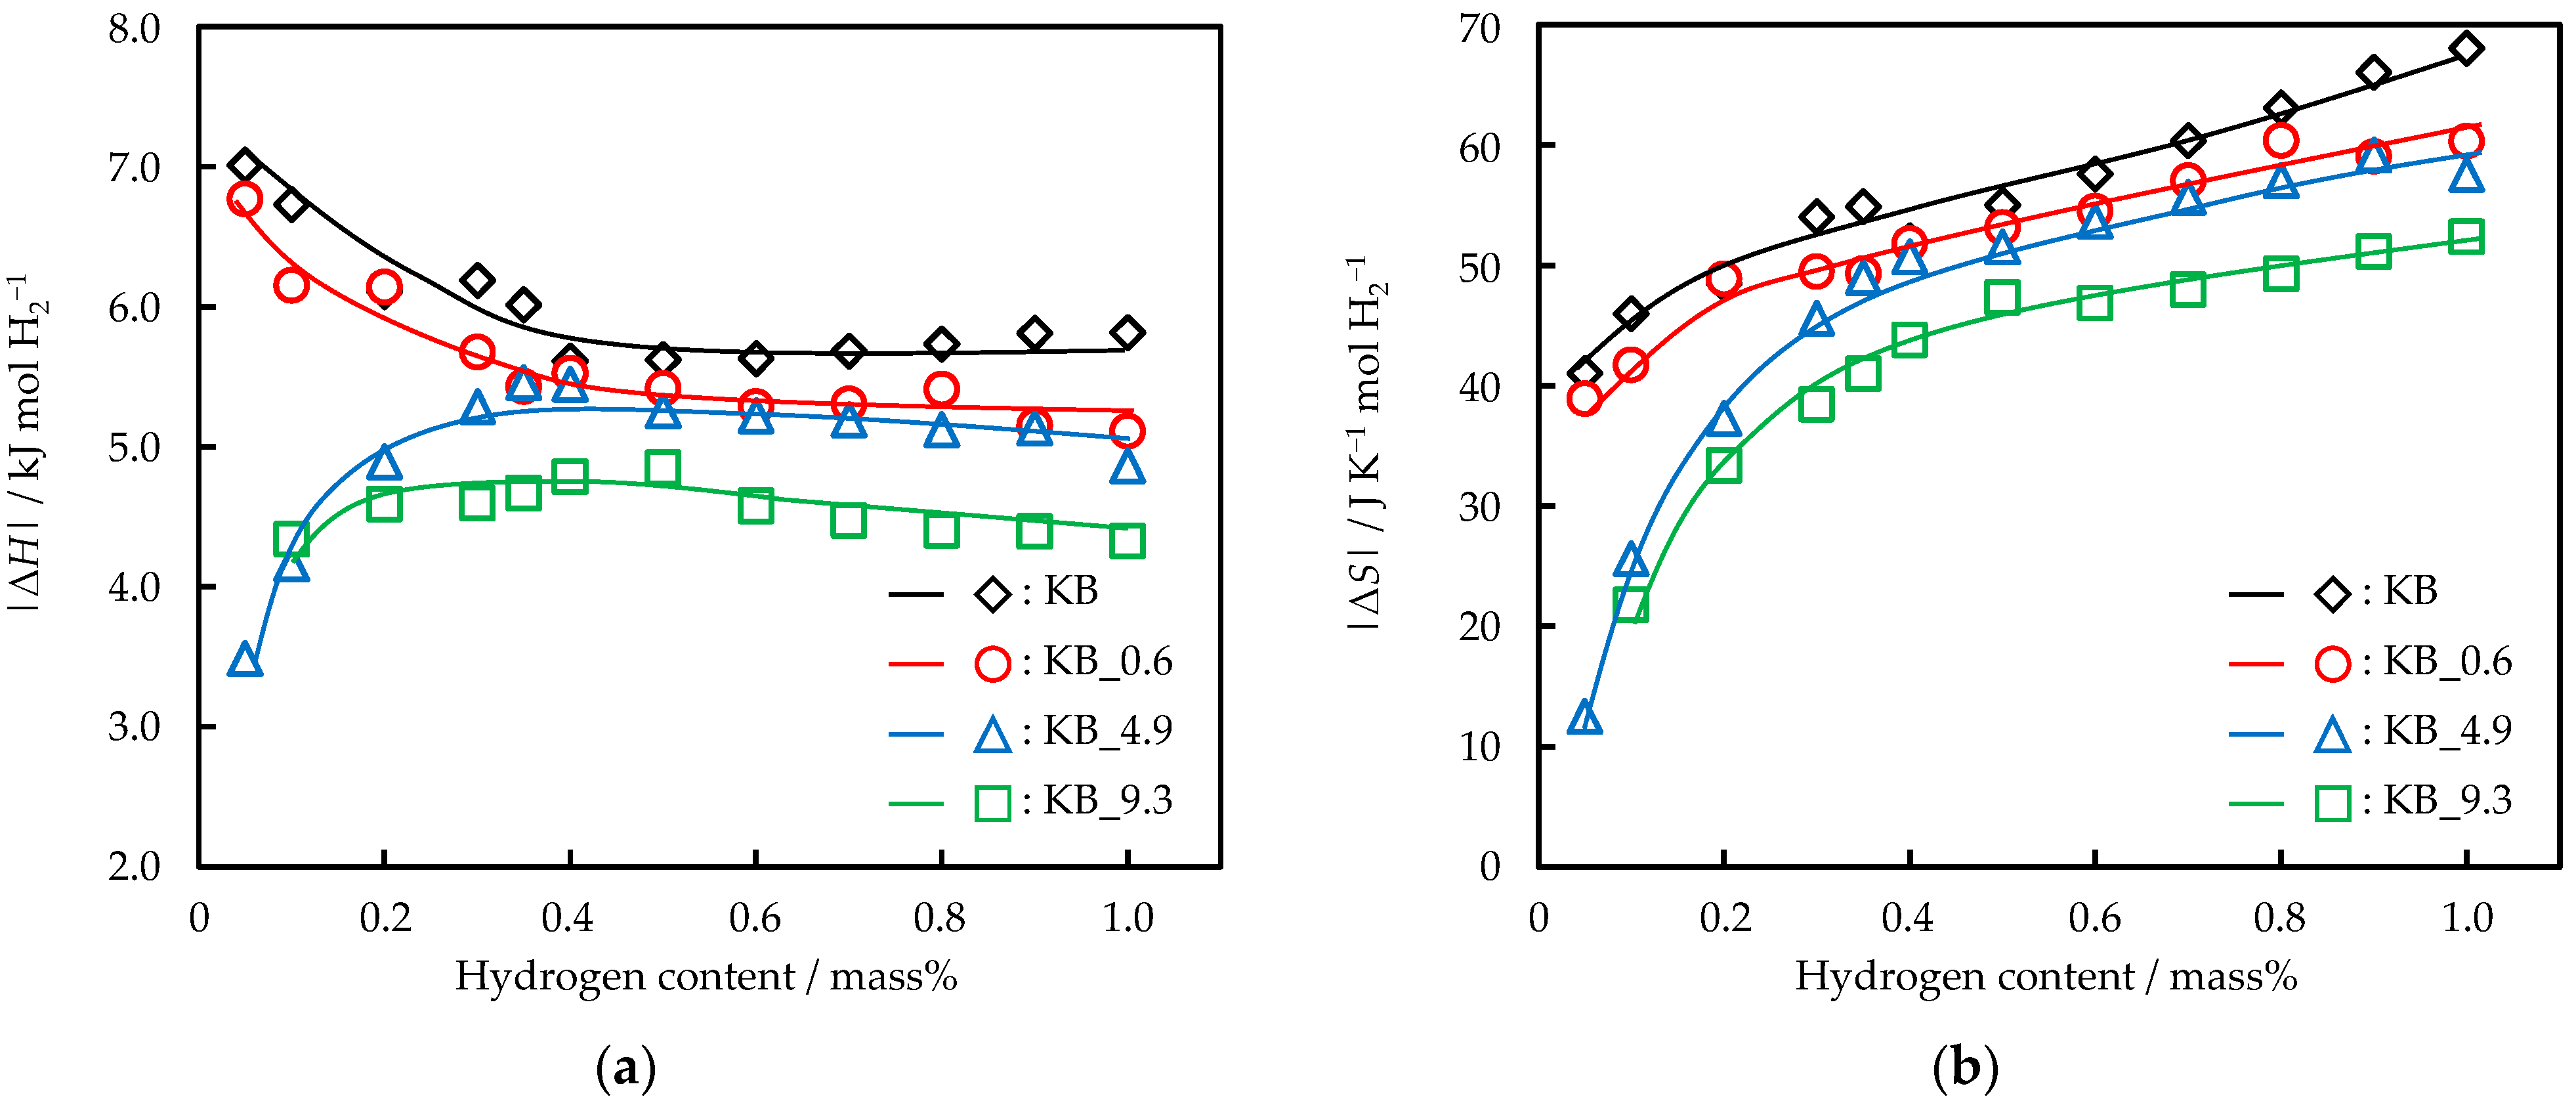
The absolute values of enthalpy changes (|ΔH|) and entropy change (|ΔS|) on hydrogen adsorption in the hydrogen content range of 0.05–1.0 mass % contents are shown in Figure 10a and b, respectively. The hydrogen contents of 0.05 mass % and 0.35 mass % were added as the hydrogen adsorption point to examine the |ΔH| and |ΔS| in detail. Although the |ΔH| and |ΔS| were calculated using the van’t Hoff plots of various hydrogen contents, the changes were relatively smooth. The |ΔH| of KB at 0.05 mass % of hydrogen content was 7.0 kJ mol H2−1, and the |ΔH| gradually decreased with increase in hydrogen content. KB had heterogeneous binding energy sites for hydrogen adsorption [18,39]. Further, hydrogen settled only at deep potential sites at higher temperatures, and shallow potential sites at lower temperatures [27]. After the 0.4 mass % of hydrogen content, the |ΔH| was approximately 5.7 ± 0.1 kJ mol H2−1. The highly active sites of KB would be occupied with approximately 0.4 mass % of hydrogen content. The enthalpies of hydrogen adsorption on various amorphous carbons in the low-temperature range are summarized in Table 2. The |ΔH| of KB was consistent with that of the other activated carbons. The higher Pd content gave the smaller |ΔH| as shown in Figure 10a. When the Pd content was high, it was difficult for hydrogen adsorption to reach equilibrium. Excessive Pd atoms would initially block the deep potential sites, and successive adsorption sites would become accessible with the preceding hydrogen adsorption. In the low hydrogen adsorption range, the |ΔH| of KB_4.9 and KB_9.3 were small and increased with increasing hydrogen contents. The increasing tendency of |ΔH| was seemingly unexpected behavior. The hydrogen adsorption was an exothermic reaction. Conversely, the departing movement of the Pd was probably an endothermic process. The smallness of |ΔH| would be due to the suppression by the endothermic process. The enthalpy changes were thus related to the hydrogen adsorption process and the process associated with hydrogen adsorption, which was the collapse of the KB-Pd stable structures to form hydrogen acceptable sites. The aforementioned phenomena were similar to the rule of reversed stability in hydrogen storage alloys. According to the rule, some KB-Pd stable structures would form, and hydrogen adsorption would be relatively unstable, i.e., the Pd-modified KBs would adsorb more hydrogen under higher pressures and at lower temperatures. The results prompt further discussion. Pd-modified KBs adsorbed more hydrogen than KB, demonstrating Pd’s effectiveness.
As shown in Figure 10b, |ΔS| increased with the progress of hydrogen adsorption in all samples. This was probably because, as hydrogen adsorption progressed, the range in which hydrogen could be adsorbed became narrower. This can also be expressed as a decrease in the degrees of freedom of hydrogen. Because the change in entropy corresponds to the fixation of gaseous molecular hydrogen, it approximately matches 130 J K−1 mol H2−1, which is the standard entropy of hydrogen [3]. The |ΔS| for all samples did not yet reach the standard entropy of hydrogen. This was also supported by the unsaturation of hydrogen adsorption, as shown in Figure 6. Furthermore, the |ΔS| decreased with increasing Pd content. The entropy changes would also be affected by the movement of hydrogen on the solid, that is, the number of adsorption options. The decrease in the |ΔS| was consistent with the phenomenon that the hydrogen contents increased with increasing Pd contents at each high temperature. For KB_4.9 and KB_9.3, the smallness of |ΔS| in the low hydrogen adsorption range was more prominent than in the other two samples. This would be because the movement of hydrogen during adsorption was large and unstable. This supposition is related to the above description about the enthalpy changes.
Pd coexistence has caused at least the characteristic enthalpy and entropy changes on hydrogen adsorption in addition to increase in the hydrogen content. Hydrogen was adsorbed by a chemical and physical process. The chemical process involved the acceptance of atomic hydrogen produced by Pd on the carbon sites, and the physical process involved Van der Waals interactions between hydrogen molecules and the carbon surface. CBs’ suitability as hydrogen storage materials was also demonstrated. Studies are being conducted to elucidate the essence of the cooperative effect and to increase the hydrogen content.
4. Conclusions
Hydrogen content increased as the temperature decreased from 273 K to 77 K for KB, KB_0.6, KB_4.9, and KB_9.3, and almost all hydrogen contents of Pd-modified KBs exceeded the hydrogen content of KB at each temperature. While KB_0.6 adsorbed the most hydrogen at 77 K, KBs with the higher Pd contents adsorbed more hydrogen than KB_0.6 at higher temperatures, 98 K, 123 K, 148 K, 173 K, 223 K, and 273 K. Excessive hydrogen, as evaluated by subtracting the sum of the physisorption content and the occluded content to form Pd hydride, PdH0.6, from the measured hydrogen content, was significant at lower temperatures and increased with Pd content. The efficiency at 77 K was demonstrated at KB_0.6, and steeper increases were observed at higher temperatures for KBs with higher Pd contents. The optimization of Pd modification must be performed specifically at each objective temperature, with the excessive hydrogen content maximized.
Author Contributions
Conceptualization, N.N.; methodology, N.N.; investigation, T.K.; resources, T.T., Y.K. and N.N.; writing—original draft preparation, T.K.; writing—review and editing, N.N.; supervision, N.N.; funding acquisition, T.T. All authors have read and agreed to the published version of the manuscript.
Funding
This research received no external funding.
Acknowledgments
This work was supported by the University of Tokyo Advanced Characterization Nanotechnology Platform in the Nanotechnology Platform Project sponsored by the Ministry of Education, Culture, Sports, Science and Technology, Japan [grant number JPMXP09A16UT0179, JPMXP09A21UT0191].
Conflicts of Interest
The authors declare no conflict of interest.
References
- Luo, Y.; Wang, Q.; Li, J.; Xu, F.; Sun, L.; Zou, Y.; Chu, H.; Li, B.; Zhang, K. Enhanced hydrogen storage/sensing of metal hydrides by nanomodification. Mater. Today Nano 2020, 9, 100071. [Google Scholar] [CrossRef]
- Abe, J.O.; Popoola, A.P.I.; Ajenifuja, E.; Popoola, O.M. Hydrogen energy, economy and storage: Review and recommendation. Int. J. Hydrog. Energy 2019, 44, 15072–15086. [Google Scholar] [CrossRef]
- Züttel, A. Hydrogen storage methods. Sci. Nat. 2004, 91, 157–172. [Google Scholar] [CrossRef] [PubMed]
- Mehrizi, M.Z.; Abdi, J.; Rezakazemi, M.; Salehi, E. A review on recent advances in hollow spheres for hydrogen storage. Int. J. Hydrog. Energy 2020, 45, 17583–17604. [Google Scholar] [CrossRef]
- Rather, S. Preparation, characterization and hydrogen storage studies of carbon nanotubes and their composites: A review. Int. J. Hydrog. Energy 2020, 45, 4653–4672. [Google Scholar] [CrossRef]
- Akasaka, H.; Takahata, T.; Toda, I.; Ono, H.; Ohshio, S.; Himeno, S.; Kokubu, T.; Saitoh, H. Hydrogen storage ability of porous carbon material fabricated from coffee bean wastes. Int. J. Hydrog. Energy 2011, 36, 580–585. [Google Scholar] [CrossRef]
- Cheng, Y.; Wu, L.; Fang, C.; Li, T.; Chen, J.; Yang, M.; Zhang, Q. Synthesis of porous carbon materials derived from laminaria japonica via simple carbonization and activation for supercapacitors. J. Mater. Res. Technol. 2020, 9, 3261–3271. [Google Scholar] [CrossRef]
- Kim, M.-J.; Choi, S.W.; Kim, H.; Mun, S.; Lee, K.B. Simple synthesis of spent coffee ground-based microporous carbons using K2CO3 as an activation agent and their application to CO2 capture. Chem. Eng. J. 2020, 397, 125404. [Google Scholar] [CrossRef]
- Kim, B.-J.; Lee, Y.-S.; Park, S.-J. A study on the hydrogen storage capacity of Ni-plated porous carbon nanofibers. Int. J. Hydrog. Energy 2008, 33, 4112–4115. [Google Scholar] [CrossRef]
- Wu, H.; Wexler, D.; Ranjbartoreh, A.R.; Liu, H.; Wang, G. Chemical processing of double-walled carbon nanotubes for enhanced hydrogen storage. Int. J. Hydrog. Energy 2010, 35, 6345–6349. [Google Scholar] [CrossRef]
- Hwang, J.Y.; Lee, S.H.; Sim, K.S.; Kim, J.W. Synthesis and hydrogen storage of carbon nanofibers. Synth. Met. 2002, 126, 81–85. [Google Scholar] [CrossRef]
- Xiao, J.; Peng, R.; Cossement, D.; Bénard, P.; Chahine, R. Heat and mass transfer and fluid flow in cryo-adsorptive hydrogen storage system. Int. J. Hydrog. Energy 2013, 38, 10871–10879. [Google Scholar] [CrossRef]
- Hermosilla-Lara, G.; Momen, G.; Marty, P.H.; Le Neindre, B.; Hassouni, K. Hydrogen storage by adsorption on activated carbon: Investigation of the thermal effects during the charging process. Int. J. Hydrog. Energy 2007, 32, 1542–1553. [Google Scholar] [CrossRef] [Green Version]
- Xiao, Y.; Dong, H.; Long, C.; Zheng, M.; Lei, B.; Zhang, H.; Liu, Y. Melaleuca bark based porous carbons for hydrogen storage. Int. J. Hydrog. Energy 2014, 39, 11661–11667. [Google Scholar] [CrossRef]
- Lee, S.-Y.; Park, S.-J. Influence of the pore size in multi-walled carbon nanotubes on the hydrogen storage behaviors. J. Solid State Chem. 2012, 194, 307–312. [Google Scholar] [CrossRef]
- Czakkel, O.; Nagy, B.; Dobos, G.; Fouquet, P.; Bahn, E.; László, K. Static and dynamic studies of hydrogen adsorption on nanoporous carbon gels. Int. J. Hydrog. Energy 2019, 44, 18169–18178. [Google Scholar] [CrossRef]
- Geng, Z.; Wang, D.; Zhang, C.; Zhou, X.; Xin, H.; Liu, X.; Cai, M. Spillover enhanced hydrogen uptake of Pt/Pd doped corncob-derived activated carbon with ultra-high surface area at high pressure. Int. J. Hydrog. Energy 2014, 39, 13643–13649. [Google Scholar] [CrossRef]
- Minuto, F.D.; Policicchio, A.; Aloise, A.; Agostino, R.G. Liquid-like hydrogen in the micropores of commercial activated carbons. Int. J. Hydrog. Energy 2015, 40, 14562–14572. [Google Scholar] [CrossRef]
- Zheng, Q.; Wang, X.; Gao, S. Adsorption equilibrium of hydrogen on graphene sheets and activated carbon. Cryogenics 2014, 61, 143–148. [Google Scholar] [CrossRef]
- Huang, C.-C.; Chen, H.-M.; Chen, C.-H. Hydrogen adsorption on modified activated carbon. Int. J. Hydrog. Energy 2010, 35, 2777–2780. [Google Scholar] [CrossRef]
- Zhao, W.; Fierro, V.; Zlotea, C.; Izquierdo, M.T.; Chevalier-César, C.; Latroche, M.; Celzard, A. Activated carbons doped with Pd nanoparticles for hydrogen storage. Int. J. Hydrog. Energy 2012, 37, 5072–5080. [Google Scholar] [CrossRef]
- Kostoglou, N.; Tzitzios, V.; Kontos, A.G.; Giannakopoulos, K.; Tampaxis, C.; Papavasiliou, A.; Charalambopoulou, G.; Steriotis, T.; Li, Y.; Liao, K.; et al. Synthesis of nanoporous graphene oxide adsorbents by freeze-drying or microwave radiation: Characterization and hydrogen storage properties. Int. J. Hydrog. Energy 2015, 40, 6844–6852. [Google Scholar] [CrossRef]
- González-Navarro, M.F.; Giraldo, L.; Moreno-Piraján, J.C. Preparation and characterization of activated carbon for hydrogen storage from waste African oil-palm by microwave-induced LiOH basic activation. J. Anal. Appl. Pyrolysis 2014, 107, 82–86. [Google Scholar] [CrossRef]
- Pan, W.; Zhang, X.; Li, S.; Wu, D.; Mao, Z. Measuring hydrogen storage capacity of carbon nanotubes by high-pressure microbalance. Int. J. Hydrog. Energy 2005, 30, 719–722. [Google Scholar] [CrossRef]
- Marella, M.; Tomaselli, M. Synthesis of carbon nanofibers and measurements of hydrogen storage. Carbon 2006, 44, 1404–1413. [Google Scholar] [CrossRef]
- Im, J.-E.; Oh, S.-L.; Choi, K.-H.; Wang, K.-K.; Jung, S.; Cho, W.; Oh, M.; Kim, Y.-R. Hydrogen uptake efficiency of mesoporous carbon nanofiber and its structural factors to determine the uptake efficiency. Surf. Coat. Technol. 2010, 205, S99–S103. [Google Scholar] [CrossRef]
- Knight, E.W.; Gillespie, A.K.; Prosniewski, M.J.; Stalla, D.; Dohnke, E.; Rash, T.A.; Pfeifer, P.; Wexler, C. Determination of the enthalpy of adsorption of hydrogen in activated carbon at room temperature. Int. J. Hydrog. Energy 2020, 45, 15541–15552. [Google Scholar] [CrossRef]
- Tellez-Juárez, M.C.; Fierro, V.; Zhao, W.; Fernández-Huerta, N.; Izquierdo, M.T.; Reguera, E.; Celzard, A. Hydrogen storage in activated carbons produced from coals of different ranks: Effect of oxygen content. Int. J. Hydrog. Energy 2014, 39, 4996–5002. [Google Scholar] [CrossRef]
- Kaneko, T.; Watanuki, Y.; Toyama, T.; Kojima, Y.; Nishimiya, N. Hydrogen sorption and desorption behaviors of metal-carbon composites prepared by alcohol CVD method. Int. J. Hydrog. Energy 2015, 40, 16323–16329. [Google Scholar] [CrossRef]
- Kaneko, T.; Watanuki, Y.; Toyama, T.; Kojima, Y.; Nishimiya, N. Characterization and hydrogen sorption behaviors of FeNiCr-carbon composites derived from Fe, Ni and Cr-containing polyacrylonitrile fibers prepared by electrospinning method. Int. J. Hydrog. Energy 2017, 42, 10014–10022. [Google Scholar] [CrossRef]
- Baca, M.; Cendrowski, K.; Banach, P.; Michalkiewicz, B.; Mijowska, E.; Kalenczuk, R.J.; Zielinska, B. Effect of Pd loading on hydrogen storage properties of disordered mesoporous hollow carbon spheres. Int. J. Hydrog. Energy 2017, 42, 30461–30469. [Google Scholar] [CrossRef]
- Stadie, N.P.; Purewal, J.J.; Ahn, C.C.; Fultz, B. Measurements of hydrogen spillover in platinum doped superactivated carbon. Langmuir 2010, 26, 15481–15485. [Google Scholar] [CrossRef] [Green Version]
- Oh, H.; Gennett, T.; Atanassov, P.; Kurttepeli, M.; Bals, S.; Hurst, K.E.; Hirscher, M. Hydrogen adsorption properties of platinum decorated hierarchically structured templated carbons. Microporous Mesoporous Mater. 2013, 177, 66–74. [Google Scholar] [CrossRef]
- Klechikov, A.; Sun, J.; Hu, G.; Zheng, M.; Wågberg, T.; Talyzin, A.V. Graphene decorated with metal nanoparticles: Hydrogen sorption and related artefacts. Microporous Mesoporous Mater. 2017, 250, 27–34. [Google Scholar] [CrossRef] [Green Version]
- Zhou, Y.; Zhou, L. Experimental study on high-pressure adsorption of hydrogen on activated carbon. Sci. China Ser. B Chem. 1996, 39, 598–607. [Google Scholar] [CrossRef]
- Shen, L.; Ding, H.; Cao, Q.; Jia, W.; Wang, W.; Guo, Q. Fabrication of Ketjen black-high density polyethylene superhydrophobic conductive surfaces. Carbon 2012, 50, 4284–4290. [Google Scholar] [CrossRef]
- Thommes, M.; Kaneko, K.; Neimark, A.V.; Olivier, J.P.; Rodriguez-Reinoso, F.; Rouquerol, J.; Sing, K.S.W. Physisorption of gases, with special reference to the evaluation of surface area and pore size distribution (IUPAC Technical Report). Pure Appl. Chem. 2015, 87, 1051–1069. [Google Scholar] [CrossRef] [Green Version]
- Contescu, C.I.; Benthem, K.; Li, S.; Bonifacio, C.S.; Pennycook, S.J.; Jena, P.; Gallego, N.C. Single Pd atoms in activated carbon fibers and their contribution to hydrogen storage. Carbon 2011, 49, 4050–4058. [Google Scholar] [CrossRef]
- Ma, L.-P.; Wu, Z.-S.; Li, J.; Wu, E.-D.; Ren, W.-C.; Cheng, H.-M. Hydrogen adsorption behavior of graphene above critical temperature. Int. J. Hydrog. Energy 2009, 34, 2329–2332. [Google Scholar] [CrossRef]
Figure 1.
Nitrogen adsorption-desorption isotherms at 77 K for KB, KB_0.6, KB_4.9, and KB_9.3.

Figure 2.
Differential PSDs for KB, KB_0.6, KB_4.9, and KB_9.3.

Figure 3.
TEM images of (a) KB, (b) KB_0.6, (c) KB_4.9, and (d) KB_9.3.

Figure 4.
Cu Kα XRD patterns of KB, KB_0.6, KB_4.9, KB_9.3, and Pd(acac)2. JCPDS data of Pd (#00-005-0681) is included at the bottom.
Figure 4.
Cu Kα XRD patterns of KB, KB_0.6, KB_4.9, KB_9.3, and Pd(acac)2. JCPDS data of Pd (#00-005-0681) is included at the bottom.

Figure 5.
Raman spectra of KB, KB_0.6, KB_4.9, and KB_9.3.

Figure 6.
Hydrogen adsorption isotherms for (a) KB, (b) KB_0.6, (c) KB_4.9, and (d) KB_9.3. Temperature/K, ◇: 77, ▲: 98, △: 123, ■: 148, □: 173, ●: 223, ○: 273. The insets in (a,b) are hydrogen adsorption isotherms plotted by the linear pressure.
Figure 6.
Hydrogen adsorption isotherms for (a) KB, (b) KB_0.6, (c) KB_4.9, and (d) KB_9.3. Temperature/K, ◇: 77, ▲: 98, △: 123, ■: 148, □: 173, ●: 223, ○: 273. The insets in (a,b) are hydrogen adsorption isotherms plotted by the linear pressure.

Figure 7.
Variation of hydrogen content under 0.8 MPa of hydrogen with temperature for KB, KB_0.6, KB_4.9, and KB_9.3. The hydrogen contents at 273 K of KB and KB_0.6 are the saturated hydrogen contents under 0.38 MPa and 0.42 MPa of hydrogen, respectively.
Figure 7.
Variation of hydrogen content under 0.8 MPa of hydrogen with temperature for KB, KB_0.6, KB_4.9, and KB_9.3. The hydrogen contents at 273 K of KB and KB_0.6 are the saturated hydrogen contents under 0.38 MPa and 0.42 MPa of hydrogen, respectively.

Figure 8.
Variation of excessive hydrogen content under 0.8 MPa of hydrogen with temperature for KB_0.6, KB_4.9, and KB_9.3. The excessive hydrogen content at 273 K of KB_0.6 is calculated from the saturated hydrogen contents of KB under 0.38 MPa and KB_0.6 under 0.42 MPa.
Figure 8.
Variation of excessive hydrogen content under 0.8 MPa of hydrogen with temperature for KB_0.6, KB_4.9, and KB_9.3. The excessive hydrogen content at 273 K of KB_0.6 is calculated from the saturated hydrogen contents of KB under 0.38 MPa and KB_0.6 under 0.42 MPa.

Figure 9.
Van’t Hoff plots for (a) KB, (b) KB_0.6, (c) KB_4.9, and (d) KB_9.3. Hydrogen content/mass %, ○: 0.05, △: 0.1, □: 0.2, ◇: 0.3, ─:0.35, ●: 0.4, ▲: 0.5, ■: 0.6, ◆: 0.7, -: 0.8, ×: 0.9, +:1.0. Dotted lines show linear approximations.
Figure 9.
Van’t Hoff plots for (a) KB, (b) KB_0.6, (c) KB_4.9, and (d) KB_9.3. Hydrogen content/mass %, ○: 0.05, △: 0.1, □: 0.2, ◇: 0.3, ─:0.35, ●: 0.4, ▲: 0.5, ■: 0.6, ◆: 0.7, -: 0.8, ×: 0.9, +:1.0. Dotted lines show linear approximations.


Figure 10.
Variation of (a) |ΔH| and (b) |ΔS| with hydrogen content for KB, KB_0.6, KB_4.9, and KB_9.3.
Figure 10.
Variation of (a) |ΔH| and (b) |ΔS| with hydrogen content for KB, KB_0.6, KB_4.9, and KB_9.3.


Table 1.
Specific surface areas, micropore volumes, and mesopore volumes of KB, KB_0.6, KB_4.9, and KB_9.3.
Table 1.
Specific surface areas, micropore volumes, and mesopore volumes of KB, KB_0.6, KB_4.9, and KB_9.3.
| Sample | SBET | Vmicro 1 | Vmeso 2 |
|---|---|---|---|
| (m2 g−1) | (cm3 g−1) | (cm3 g−1) | |
| KB | 1925 | 0.290 | 2.09 |
| KB_0.6 | 1750 | 0.152 | 1.98 |
| KB_4.9 | 1686 | 0.203 | 1.81 |
| KB_9.3 | 1650 | 0.139 | 1.85 |
1 calculated within the pore size range < 2 nm. 2 calculated within the pore size range 2–50 nm.
Table 2.
Enthalpies of hydrogen adsorption on various amorphous carbons.
| Sample | Classification | Enthalpy | Temperature | Reference |
|---|---|---|---|---|
| (kJ mol H2−1) | (K) | |||
| AX-21 | Activated carbon | 6.4 1 | 77–298 | 35 |
| Litchi trunk based activated carbon | Activated carbon | 5.6–7.9 | 77–90 | 20 |
| SAC-02 | Activated carbon | 4.05–5.52 | 77.15–293.15 | 19 |
| Filtercarb GCC 8×30 | Activated carbon | 6.8 1–7.7 ± 0.4 2 | 77–318 | 18 |
| Filtercarb PHA | Activated carbon | 6.8 1–7.0 ± 0.4 2 | 77–318 | 18 |
| Nuchar SA-1500 | Activated carbon | 7.0 ± 1.3 1 | 77–318 | 18 |
| MWV-0260 3 | Activated carbon | 8.2 4 | 77–87 | 27 |
| KB | Carbon black | 5.7 ± 0.1–7.0 | 77–273 | The present study |
1 Average value. 2 At very low hydrogen coverage. 3 Molded into monolith. 4 At low hydrogen coverage.
Publisher’s Note: MDPI stays neutral with regard to jurisdictional claims in published maps and institutional affiliations. |
© 2022 by the authors. Licensee MDPI, Basel, Switzerland. This article is an open access article distributed under the terms and conditions of the Creative Commons Attribution (CC BY) license (https://creativecommons.org/licenses/by/4.0/).
Share and Cite
MDPI and ACS Style
Kaneko, T.; Toyama, T.; Kojima, Y.; Nishimiya, N. Temperature Dependence of Hydrogen Adsorption on Pd-Modified Carbon Blacks and Their Enthalpy-Entropy Changes. C 2022, 8, 16. https://0-doi-org.brum.beds.ac.uk/10.3390/c8010016
AMA Style
Kaneko T, Toyama T, Kojima Y, Nishimiya N. Temperature Dependence of Hydrogen Adsorption on Pd-Modified Carbon Blacks and Their Enthalpy-Entropy Changes. C. 2022; 8(1):16. https://0-doi-org.brum.beds.ac.uk/10.3390/c8010016
Chicago/Turabian StyleKaneko, Takehiro, Takeshi Toyama, Yoshiyuki Kojima, and Nobuyuki Nishimiya. 2022. "Temperature Dependence of Hydrogen Adsorption on Pd-Modified Carbon Blacks and Their Enthalpy-Entropy Changes" C 8, no. 1: 16. https://0-doi-org.brum.beds.ac.uk/10.3390/c8010016
Note that from the first issue of 2016, this journal uses article numbers instead of page numbers. See further details here.