The Role of DNA/Histone Modifying Enzymes and Chromatin Remodeling Complexes in Testicular Germ Cell Tumors


1
Cancer Biology and Epigenetics Group, Research Center of Portuguese Oncology Institute of Porto (GEBC CI-IPOP), R. Dr. António Bernardino de Almeida, 4200-072 Porto, Portugal
2
Department of Pathology, Portuguese Oncology Institute of Porto (IPOP), R. Dr. António Bernardino de Almeida, 4200-072 Porto, Portugal
3
Department of Pathology and Molecular Immunology, Institute of Biomedical Sciences Abel Salazar, University of Porto (ICBAS-UP), Rua Jorge Viterbo Ferreira 228, 4050-513 Porto, Portugal
*
Author to whom correspondence should be addressed.
Cancers 2019, 11(1), 6; https://0-doi-org.brum.beds.ac.uk/10.3390/cancers11010006
Submission received: 22 November 2018
/
Revised: 10 December 2018
/
Accepted: 18 December 2018
/
Published: 20 December 2018
(This article belongs to the Special Issue Histone Modification in Cancer)
Abstract
:It is well established that cancer cells exhibit alterations in chromatin structure and accessibility. Indeed, the dysregulation of many protein-coding players with enzymatic activity (DNA and histone-modifying enzymes) and chromatin remodelers have been depicted in various tumor models in recent years. Still, little attention has been directed towards testicular germ cell tumors (TGCTs)—representing the most common neoplasm among young adult Caucasian men—with most studies focusing on exploring the role of DNA methyltransferases (DNMTs) and DNA demethylases (TETs). TGCTs represent a complex tumor model, associated with developmental and embryogenesis-related phenomena, and display seldom (cyto)genetic aberrations, leaving room for Epigenetics to explain such morphological and clinical diversity. Herein, we have summarized the major findings that were reported in literature regarding the dysregulation of DNA/histone-modifying enzymes and chromatin remodelers in TGCTs. Additionally, we performed in silico analysis of The Cancer Genome Atlas database to find the most relevant of those players in TGCTs. We concluded that several DNA/histone-modifying enzymes and chromatin remodelers may serve as biomarkers for subtyping, dictating prognosis and survival, and, possibly, for serving as targets of directed, less toxic therapies.
1. Testicular Germ Cell Tumors in Brief
Testicular germ cell tumors (TGCTs) comprise more than 95% of testicular neoplasms and they are grouped in two major families according to the most recent World Health Organization classification: the germ-cell neoplasia in situ (GCNIS)-related tumors (the most frequent, which include Seminomas (SEs) and Non-Seminomatous Tumors (NSTs), two subgroups with very distinct behavior and clinical impact), and the GCNIS-unrelated ones [1,2].
Despite representing only 1% of male cancer worldwide, they constitute the most common cancer afflicting Caucasian men between 15–44 years old, with the Western lifestyle contributing to a rising incidence. They also exhibit outstanding cure rates and a decreasing mortality trend, in response to multimodal treatments. However, many issues are left unresolved and they deserve our attention, namely the substantial proportion of patients with disseminated disease that relapse with poor prognosis, the emergence of cisplatin resistance, and the considerable morbidity induced by chemo- and radiotherapy in such young patients with long lifetime expectancy [3,4].
TGCTs are remarkably heterogeneous (reflecting the complexity of this tumor model) but they mainly share a unifying cytogenetic background and display very few mutations. In this line, it is only natural that various Epi-phenomena might play a fundamental role in these neoplasms. Therefore, the study of new Epi-markers might aid in tumor subtype discrimination, prognosis assessment, and disease monitoring, as no accurate validated biomarkers exist for these purposes. Also, the manipulation of these Epi-markers might provide ways of uncovering therapies with improved antitumor activity, less toxicity, and that may overcome cisplatin resistance [5,6,7,8,9,10,11].
2. Protein-Coding Epigenetic Players: Their Role in Cancer
Histones and non-histone proteins undergo post-translational modifications (PTMs), the most studied being methylation, acetylation, and phosphorylation, which alter the chromatin pattern, hence controlling gene expression. Also, chromatin remodeling complexes (ChRC) alter the nucleosome structure, with implications in DNA accessibility. Another type of proteins (methyltransferases and demethylases) are responsible for regulating (i.e., writing and erasing) DNA methylation, again with implications in gene expression and chromatin stability. In this line, all of these players are involved in fundamental biological processes, such as cell division and proliferation, cell cycle, metabolism, pluripotency, genomic imprinting, and DNA repair, and globally regulate the transcription of many genes. Therefore, it is only rational to think that these epigenetic mechanisms are deregulated in cancer, and that they can be modulated to treat these patients [12,13,14,15,16]. In fact, cancer cells globally display hypomethylation (contributing to genomic instability) along with a preferential hyper/hypomethylation of promoter-associated CpG islands of tumor suppressor genes and oncogenes, respectively. Histone-modifying enzymes and ChRCs cooperate in modulating gene expression profile, upregulating oncogenes, and downregulating tumor suppressors. All in all, these players have been shown to be relevant to all the steps of tumorigenesis, in various models [14,17,18,19,20,21,22,23,24,25].
3. Protein-Coding Epigenetic Players in Testicular Germ Cell Tumors
The field of Epigenetics in TGCTs has been expanding in the last years, with a growing number of publications on the topic. Most studies have focused on methylation [26,27,28,29] and on microRNAs (miRs) [30,31,32,33], where the major breakthroughs in TGCTs have taken place. Protein-coding epigenetic players, including DNA-modifying enzymes, histone-modifying enzymes, and ChRCs, have been explored in diverse tumor models in the recent years; however, little attention has been paid to TGCTs. Hence, we have conducted a PubMed search with the query “testicular germ cell tumors” AND “(protein-coding epigenetic players)”, with no time period restraints. Only papers that were written in English were considered. All abstracts were read in order to select those papers truly related to the topic.
Table 1 displays the result of our query, listing original articles addressing the role of these players in TGCTs pathogenesis and summarizing their major findings [34,35,36,37,38,39,40,41,42,43,44,45,46,47,48,49,50,51,52,53,54,55]. Despite the overwhelming evidence that stem cells and germ cells display dynamic epigenetic modifications during differentiation and spermatogenesis, including changes in the expression of these enzymes (e.g., with DNA methyltransferases more expressed in spermatogonia and histone methyltransferases mainly in spermatocytes) [10,56,57,58,59,60,61,62], there is still a lack of studies on the role of these players and related modifications in TGCTs (especially in certain families, with most studies published so far focusing on DNA-modifying enzymes).
In this line, we performed an in silico analysis of the publicly available The Cancer Genome Atlas (TCGA) database for TGCTs, regarding the diverse families of both DNA-modifying, histone modifying, and chromatin remodeling enzymes. We ultimately aimed to identify alterations in these players, exposing those potentially being the most relevant, and finally, providing the reader with a list of the most promising biomarkers to be further validated in independent patient cohorts. For this, we used the online resource cBioPortal for Cancer Genomics [63] and a user-defined entry gene set for all of these players. Statistical analysis with the available data was performed with Microsoft Excel 2016, GraphPad Prism 6 and IBM SPSS Statistics v.24. Distribution of continuous variables between groups was compared using the nonparametric Mann-Whitney U test. Co-occurrence/mutual exclusivity of alterations in pair of genes was assessed with the odds ratio (OR). Biomarker performance was assessed through the receiver operating characteristics (ROC) curve construction. ROC curves were constructed plotting sensitivity (true positive) against 1-specificity (false positive). A cut-off was established by the Youden’s index method [64,65]. Area under the curve (AUC) and biomarker performance parameters, including sensitivity, specificity, positive predictive value (PPV), negative predictive value (NPV), and accuracy, were ascertained. Survival curves were plotted with the Kaplan-Meier method and log-rank test was used for survival analysis. A p-value that was equal or inferior to 0.05 was considered to be significant. Bonferroni’s correction was applied to multiple pairwise comparisons.
A summary of major findings of this analysis is depicted in Table 2.
3.1. DNA-MODIFYING ENZYMES
3.1.1. Methylation
DNA Methyltransferases (DNMTs)
DNMTs are involved in many biological processes; they catalyze the transfer of a methyl group to DNA (both de novo or maintenance methylation), using S-adenosyl methionine (SAM) as the methyl-donor. There are three DNMTs with catalytic activity described in mammals: DNMT1, DNMT3A, and DNMT3B (DNMT3L, despite being structurally similar to DNMT3A/3B, is inactive on its own) [14]. These enzymes are deregulated in 27/156 (17%) TGCTs, mainly by mRNA upregulation (77.7% of the cases). The most commonly altered enzyme was DNMT3B (10% of tumor samples). DNMT3A and DNMT3B showed significantly co-occurrent alterations (logOR 2.785, adjusted p-value < 0.0001).
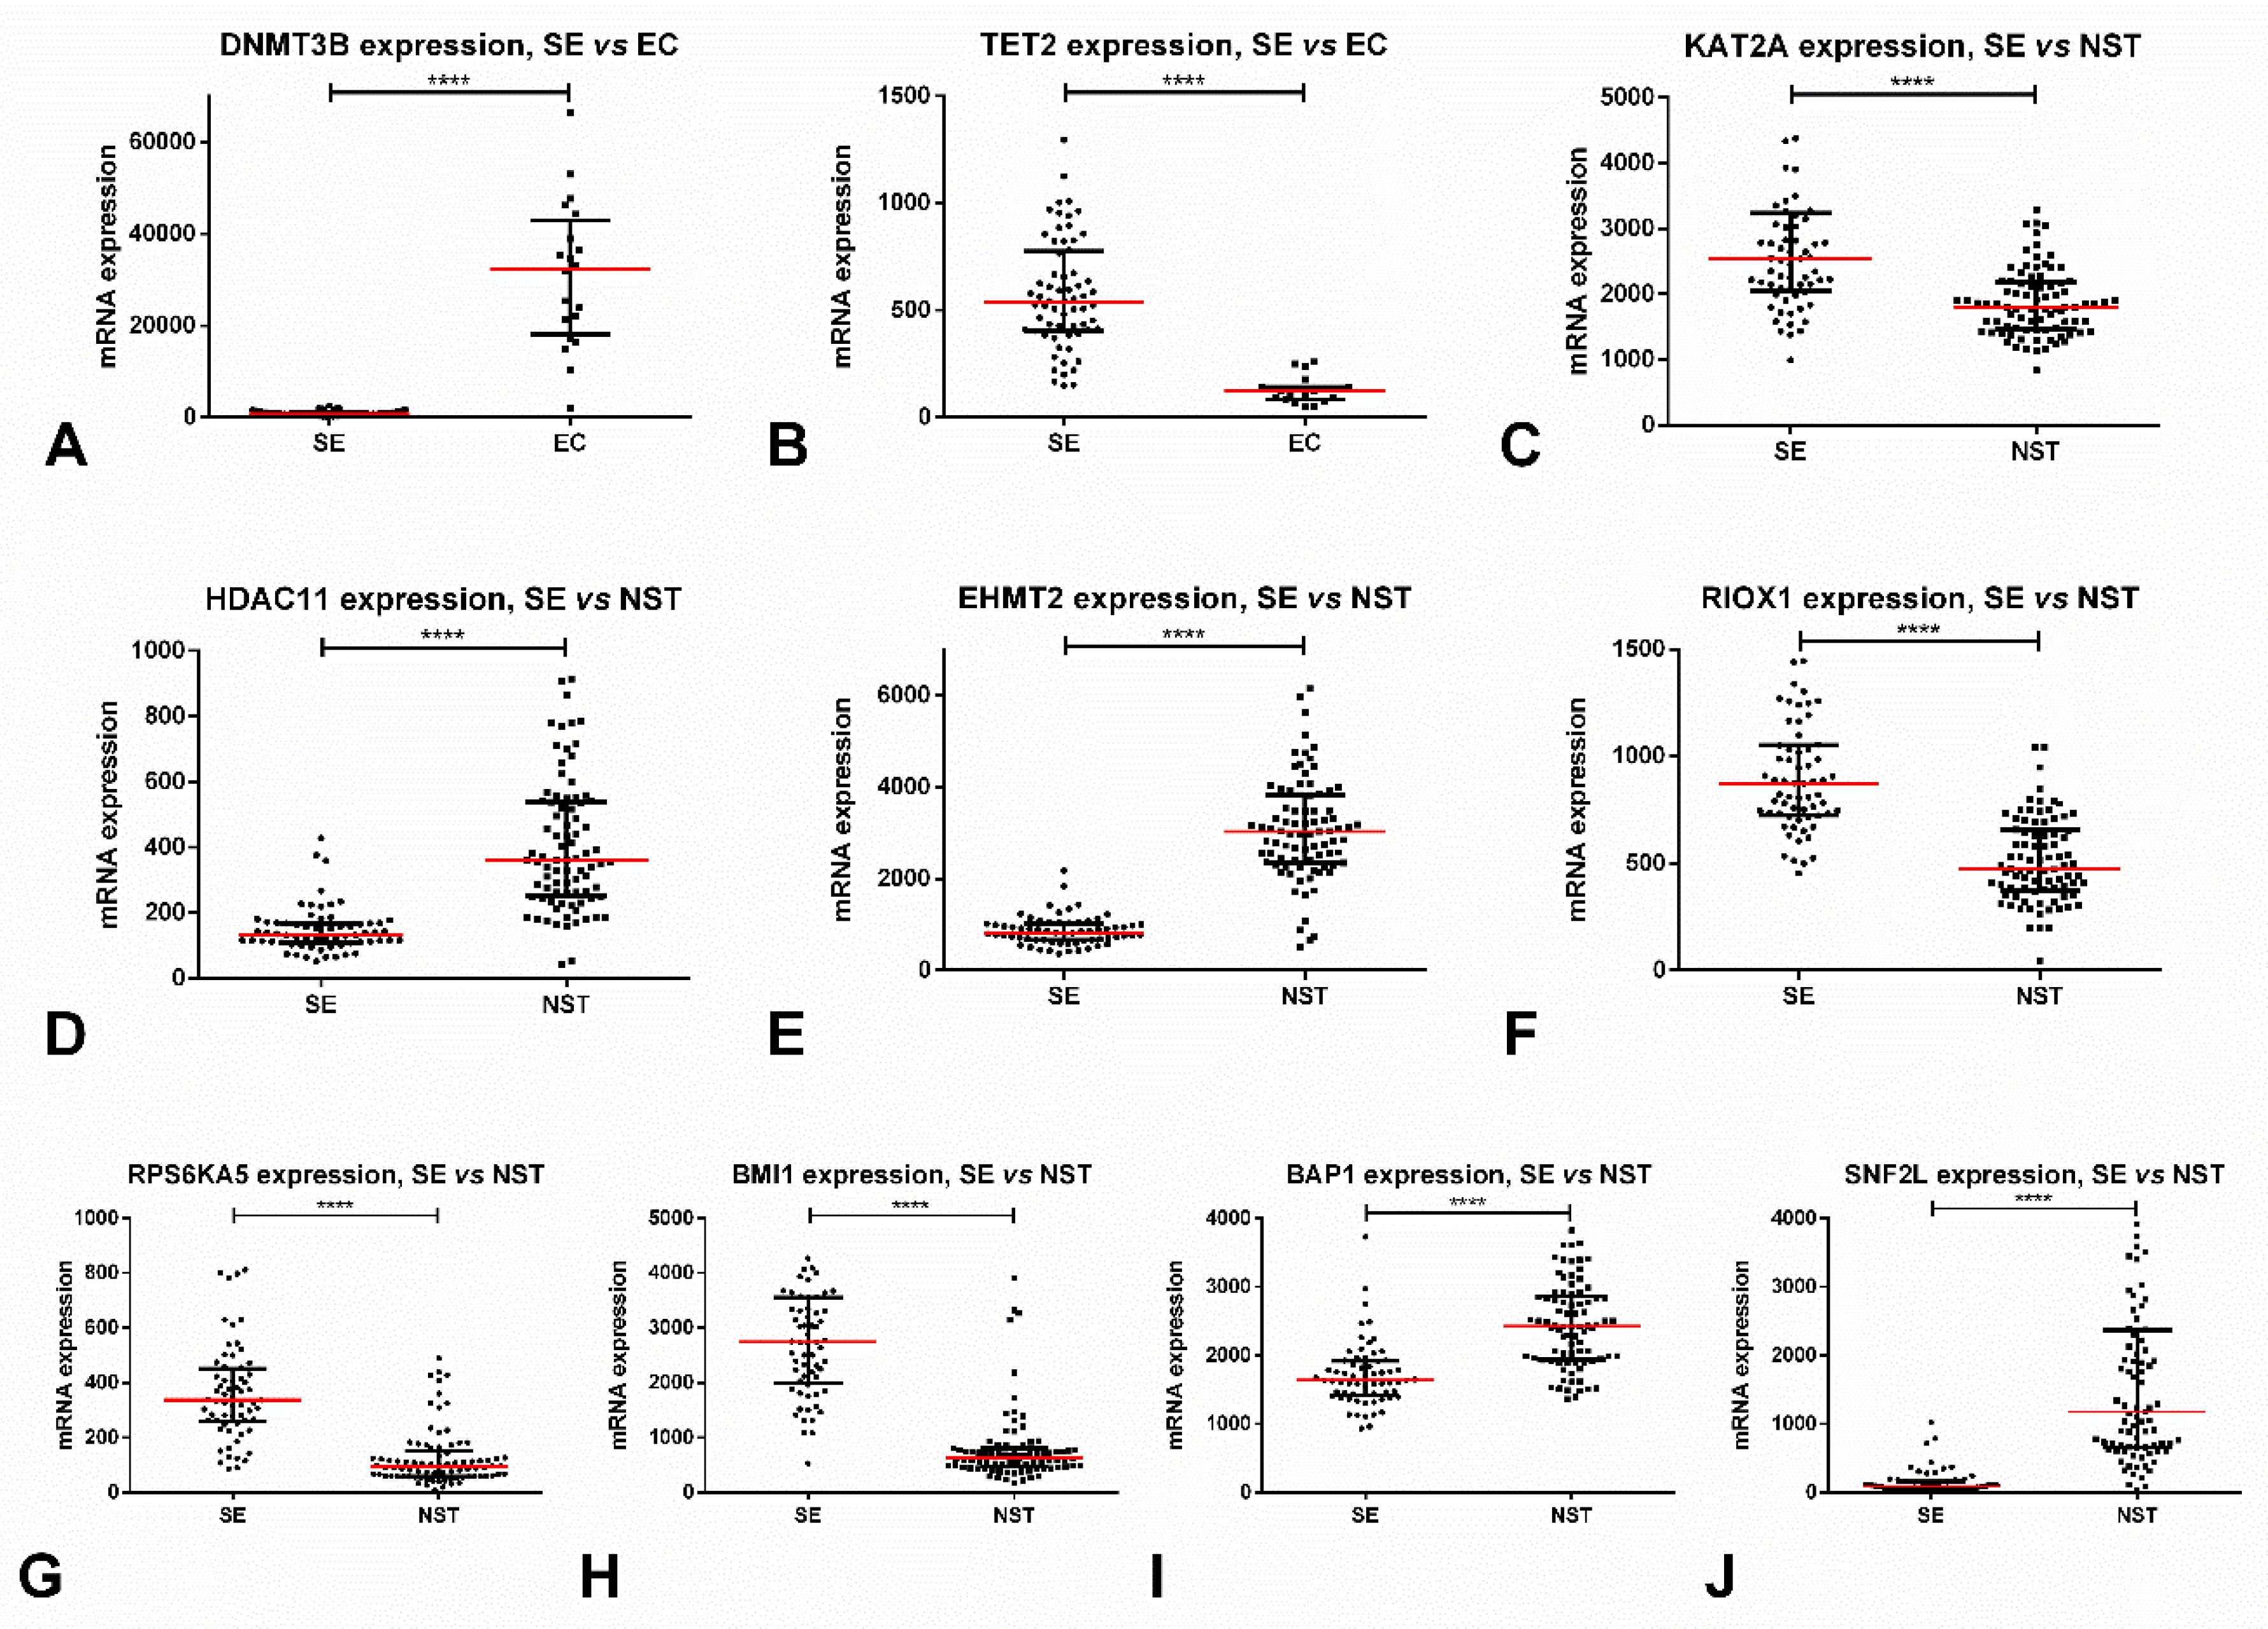
Regarding subtype discrimination, SEs disclosed significantly lower expression levels of all three enzymes (p < 0.0001) as compared to NSTs. The best performance was obtained for DNMT3A, rendering an AUC of 0.88. Interestingly, DNMT3A and DNMT3B expression was remarkably different among SEs and ECs (being strongly upregulated in the latter, p < 0.0001), with these enzymes discriminating among subtypes with AUCs of 0.98 and 0.99 (Figure 1A). Stage I patients also exhibited lower DNMT3A (p = 0.0006) and DNMT3B (p = 0.0011) expression levels when compared to stage II/III patients. No significant associations with overall (OS) or disease/progression-free (D/PFS) survival were depicted.
DNA Demethylases (TETs)
TETs catalyze the iterative demethylation of 5-methylcytosine (5mC). Three TETs are described in humans: TET1-3 [23]. They are deregulated in 26/156 (17%) of TGCT samples, 80.8% of cases by mRNA upregulation. However, individually, alterations in these enzymes were present in less than 10% of the tumors, with the most commonly altered being TET3 (in 8%).
Regarding subtype discrimination, SEs showed significantly higher expression levels of TET2 when compared to NSTs (p < 0.0001), achieving an AUC = 0.79. Again, the differences in expression between SEs and ECs were quite remarkable (with upregulation in SEs, p < 0.0001), rendering an AUC = 0.98 (Figure 1B). Stage I disease also expressed significantly higher levels of TET2 when compared to stages II/III (p = 0.0096). No significant associations with OS or D/PFS were depicted.
MAIN CONCLUSIONS: SEs display lower expression levels of DNMTs and higher expression levels of TET2, compatible with the described hypomethylated genome pattern of these tumors when compared to NSTs [29]. The expression pattern of these enzymes is completely opposite in ECs (with higher expression of DNMTs and lower expression of TET2), a finding that might prove useful in discriminating these two forms of TGCT, which have very different aggressiveness and prognosis. Also, there is room for prognostic impact of these markers, as DNMTs/TET2 are upregulated and downregulated, respectively, in advanced stage disease. These findings are in accordance with most studies published so far, which also report DNMTs’ overexpression in ECs [36,40,42,47,48,50] and of TETs in SEs [45] (Table 1).
3.2. HISTONE-MODIFYING ENZYMES
3.2.1. Acetylation
Lysine Acetyltransferases (KATs)
A. MYST Family
The MYST family is the largest family of histone acetyl transferases (HATs), being responsible for acetylating the epsilon-amino group of lysine, direct PTM phenomena. HATs are, in general, qualified as transcription activators. The MYST family, specifically, is characterized by a distinct conserved domain, containing a C2HC zinc finger and an acetyl-CoA binding site. It includes five members in humans: KAT5 (TIP60/PLIP), KAT6A (MOZ/MYST3), KAT6B (MORF/MYST4), KAT7 (HBO1/MYST2), and KAT8 (MOF/MYST1) [66,67]. Globally, these genes are deregulated in 68/156 (44%) of TGCT samples. Most alterations consisted of mRNA upregulation (69%), followed by mRNA downregulation (22%). KAT6A was the member showing more frequent deregulation (in 20% of samples), followed by KAT5 and KAT7 (11% and 10% of cases, respectively). Alterations in KAT6A and KAT7 were significantly mutually exclusive (p = 0.03, logOR < −3), but not after Bonferroni’s correction.
Regarding subtype discrimination, SEs showed significantly higher KAT6A and KAT6B expression levels (p < 0.0001 for both) when compared to NSTs. On the contrary, KAT5 and KAT8 were significantly downregulated in SEs as compared to NSTs (p < 0.0001 and p = 0.003, respectively). As a biomarker for discriminating SEs vs. NSTs, the best performance was rendered by KAT5, displaying an AUC = 0.75. Also, patients with stage I disease showed significantly higher expression levels of KAT6B and lower expression levels of KAT8 when compared to stages II/III (p = 0.004 and p = 0.02).
B. GNAT Family
The GNAT (GCN5-related N-acetyltransferase) family is also involved in the reversible lysine acetylation of proteins such as histones and includes two main members, KAT2A/GCN5 and KAT2B/PCAF, and also others like ATAT1/MEC17, KAT1/HAT1, KAT9/ELP3, and AT1/SLC33A1. They are characterized by sharing a domain with four conserved motifs A–D [24,68,69]. Globally, they are deregulated in 82/156 (53%) of TGCT samples, almost always due to mRNA upregulation (94%). The most commonly deregulated enzyme was KAT9 (in 36% of TGCTs—43% of SEs and 28% of NSTs), the remainder only being deregulated in less than 10% of tumor samples. KAT2A and KAT9 expression was found to be mutually exclusive (p = 0.026, logOR < −3), but it did not remain significant after Bonferroni’s correction.
KAT1, KAT2A (Figure 1C), KAT2B, and KAT9 mRNA expression levels were significantly higher in SEs when compared to NSTs (p < 0.0001, p < 0.0001, p < 0.0001 and p = 0.0012), with the best discrimination performance disclosed by KAT2A (AUC = 0.78). On the other hand, SLC33A1 and ATAT1 were significantly downregulated in SEs as compared to NSTs (p < 0.0001, p = 0.0370). Also, KAT2B was significantly upregulated in patients with stage I disease compared to stages II/III (p = 0.0037). No impact on survival analysis was depicted.
C. Orphan Family
Besides the two aforementioned major KATs families, there are other enzymes with HAT activity, but which lack a true consensus HAT domain, and they are grouped together in the “orphan family” [70,71]. It includes the p300/CREB-binding protein pair (KAT3A/CREBBP and KAT3B/EP300), which have interchangeable roles during embryogenesis, and the nuclear and transcription factor-related KATs (such as KAT4/TAF1, KAT12/GTF3C4, KAT13A/NCOA1, KAT13B/NCOA3, KAT13C/NCOA2, and KAT13D/CLOCK). Globally, they are deregulated in 82/156 (53%) of TGCTs, mostly by mRNA upregulation (71%). The most commonly deregulated enzyme was KAT13C (in 41% of tumors, 94% of the cases by mRNA upregulation), followed by KAT3B (in 14% of tumors); also, both enzymes were displayed co-occurrent alterations, as did KAT13A and KAT13C (adjusted p-value < 0.001, logOR > 3, for both).
SEs showed significantly higher KAT13A, KAT13C, KAT3B expression levels (p < 0.0001 for all), and CLOCK (p = 0.0002). The best performance was depicted by KAT13A (AUC = 0.74), followed by KAT13C and KAT3B (AUC = 0.72). Also, stage I tumors showed the overexpression of KAT3B, KAT13A, and KAT13C as compared to stages II/III (p = 0.0128, p = 0.0308, p = 0.0304). No impact on survival analysis was depicted.
Lysine Deacetylases (KDACs)
A. Zn2+-Dependent Histone Deacetylases (HDACs)
KDACs target both histones and non-histone proteins, deacetylating their lysine residues, again contributing to PTM phenomena. They are generally regarded as transcriptional co-repressors. KDACs are organized into two major classes according to their dependence on co-factors: the Zn2+-dependent classical HDACs and the NAD+-dependent sirtuins’ family. Classical HDACs are usually grouped taking into account their basic structure, function, subcellular topography, and homology to yeast forms. To date, eleven HDACs have been identified in the human genome (HDAC1–11), which are assigned to four deacetylase classes: class I (HDACs 1, 2, 3 and 8), class IIa (HDACs 4, 5, 7 and 9), class IIb (HDACs 6 and 10), and class IV (HDAC 11) [72]. Globally, they are deregulated in 87/156 (56%) of TGCTs, 78% of the times due to mRNA upregulation. The most frequently altered proteins were HDAC9 (14% of samples) and HDAC1/HDAC7 (13% of samples); all HDAC1 alterations consisted of mRNA upregulation. Significant co-occurrent alterations were shown between HDAC6 and HDAC8 (adjusted p-value 0.006, logOR 2.9).
Regarding subtype discrimination, HDAC1, HDAC2, HDAC3, HDAC8, HDAC9, and HDAC11 (Figure 1D) were significantly downregulated in SEs when compared to NSTs (p = 0.0042 for HDAC2, p < 0.0001 for the remainder). On the contrary, HDAC5, HDAC6, and HDAC7 were significantly upregulated in SEs (p = 0.0001, p < 0.0001, p = 0.0036). The discrimination performances were quite good, namely for HDAC1 (AUC = 0.85), HDAC8 (AUC = 0.85), HDAC9 (AUC = 0.92), and HDAC11 (AUC = 0.93). The latter allowed the following discriminating performance parameters: sensitivity = 82.4%, specificity = 92.3%, PPV = 93.3%, NPV = 80.0%, accuracy = 86.7%. Like for DNMTs/TETs, differences in expression of most HDACs were quite remarkable between SEs and ECs (with upregulation in the latter, p < 0.0001); for instance, HDAC1 and HDAC9 expression levels perfectly discriminated among these tumor subtypes with AUC=1. Also, stage II/III tumors showed significantly higher levels of HDAC1 and HDAC11 (p = 0.0002 and p = 0.0160) and lower levels of HDAC9 (p = 0.0028). Nevertheless, there was no impact on survival.
B. NAD+-Dependent Sirtuin Deacetylases (SIRTs)
The remaining deacetylase class (class III) refers to the more recently uncovered SIRT family of proteins, which have the particularity of being dependent not on Zn2+ (thus being insensitive to hydroxamic acids that function as Zn2+-chelators), but on NAD+. There are seven SIRTs in the human genome (SIRT1–7) [73], which show deregulation in 53/156 (34%) of TGCTs, mainly by mRNA upregulation (87%). The most commonly deregulated enzymes were SIRT2 and SIRT6, in 10% of samples. SIRT3 and SIRT6 were significantly concurrently altered (adjusted p-value 0.002, logOR > 3).
SIRT4 and SIRT5 expression was significantly lower and higher in SEs as compared to NSTs, respectively (p < 0.0001 for both); still, they rendered only modest AUCs of 0.77 and 0.72. Patients with stage II/III disease showed SIRT4 overexpression (p = 0.01). No significant impact on survival was depicted.
MAIN CONCLUSIONS: SEs display higher expression levels of most acetylases and lower expression levels of most deacetylases, compatible with an acetylated, transcription-prone genome characteristic of these tumors. Again, important differences in the expression between SEs and NSTs (and especially between SEs and ECs) were noticed for HDACs (in accordance with the studies finding higher expression of HDACs in NST subtypes, such as choriocarcinoma and EC [53,54]), which might prove valuable in the clinical setting for discriminating these subtypes with different prognosis and treatment approaches. Regarding deacetylation, HDACs seem to have more impact in TGCTs biology than SIRTs. They were also found to associate with higher stage disease, as opposed to previous findings [53], meaning that studies in larger cohorts may be needed to ascertain their prognostic value.
3.2.2. Methylation
Lysine Methyltransferases (KMTs)
A. SET Domain-Containing KMTs
Similar to methyltransferases that transfer methyl groups to DNA using SAM as a methyl donor, various enzymes catalyze this same transfer into histone proteins, specifically into lysine (and also arginine) residues. Depending on the residue and its position this change might provide transcriptional repression (H3K9 or H3K27, for example) or activation (H3K4, for instance). This major family of KMTs has a specific SET domain and it includes 51 members and various subfamilies, namely SMYD, MLL, SET, EZH, SUV, PRDM, and NSD-related proteins [74,75], and they are deregulated in 141/156 (90%) TGCT samples, mainly by mRNA upregulation (48%). However, 45% of tumors exhibited multiple alterations. The most commonly deregulated members were SETD4 (45%), EZH2 (21%), followed by KMT2C/MLL3, NSD3, and PRDM10 (15% each). Five pairs of proteins showed significantly co-occurring alterations: KMT2A and PRDM10 (logOR > 3, adjusted p-value 0.001), NSD3 and PRDM4 (logOR 2.4, adjusted p-value 0.012), ASH1L and PRDM11 (logOR > 3, adjusted p-value 0.016), ASH1L and SMYD1 (logOR > 3, adjusted p-value 0.016), and KMT2D and PRDM4 (logOR 2.327, adjusted p-value 0.041).
Many proteins were differentially expressed among SEs and NSTs: SEs depicted significantly higher expression of KMT2B, KMT2C, KMT2D, SETD1A, EZH1, SETDB2, SMYD3, PRDM2, PRDM15, PRDM1, PRDM7, and SETD4 (p < 0.0001), but lower expression of EHMT2 (Figure 1E), MECOM, SETD7, PRDM5, (p < 0.0001), and EZH2 (p = 0.0037), as compared to NSTs. The best discrimination power was rendered by EHMT2/KMT1C, PRDM1, PRDM5 (all with AUC = 0.96), and KMT2B (AUC = 0.94). EHMT2 displayed the following discrimination parameters: sensitivity = 94.1%, specificity = 96.9%, PPV = 97.6%, NPV = 92.6%, accuracy = 95.3%. Concerning associations with disease stage, the most impressive were EHMT2, which was significantly downregulated in stage I disease (p < 0.0001), and also KMT2B and PRDM15, which were significantly overexpressed in stage I disease (p = 0.0024 and p = 0.0002).
Regarding survival analysis, patients with altered KMT2D/MLL2 showed significantly better D/PFS (p = 0.0284); also, patients with PRDM2 alterations showed significantly worse OS and D/PFS (p = 0.0225 and p = 0.0432, respectively).
B. DOT1-Like Family (DOT1L)
DOT1L is the single member of this family of KMTs, which has a distinct structural domain [74,75,76]. It is deregulated in 14/156 (9%) TGCTs, mainly by mRNA upregulation (79%). Two missense mutations were found.
SEs exhibited significantly higher mRNA expression levels than NSTs (p < 0.0001), rendering an AUC = 0.79 for discriminating among both subtypes. Interestingly, DOT1L expression differed between SEs and pure ECs, with the former displaying higher levels (p < 0.0001); for these, an AUC = 0.87 was depicted. No association with the disease stage or survival was found.
Arginine Methyltransferases (PRMTs)
Another group of enzymes introduces methyl groups preferentially into arginine residues. There are nine PRMTs encoded in human genome (PRMT1–9) [77], and they show deregulation in 81/156 (52%) TGCTs, mainly by mRNA upregulation (50.6%) and also amplification (24.7%). The most commonly deregulated are PRMT8 and PRMT2, in 21% and 13% of the samples, respectively; in particular, all alterations in PRMT8 consisted of amplifications, except for one case with a missense mutation. No significant co-occurring or mutual exclusive alterations were found.
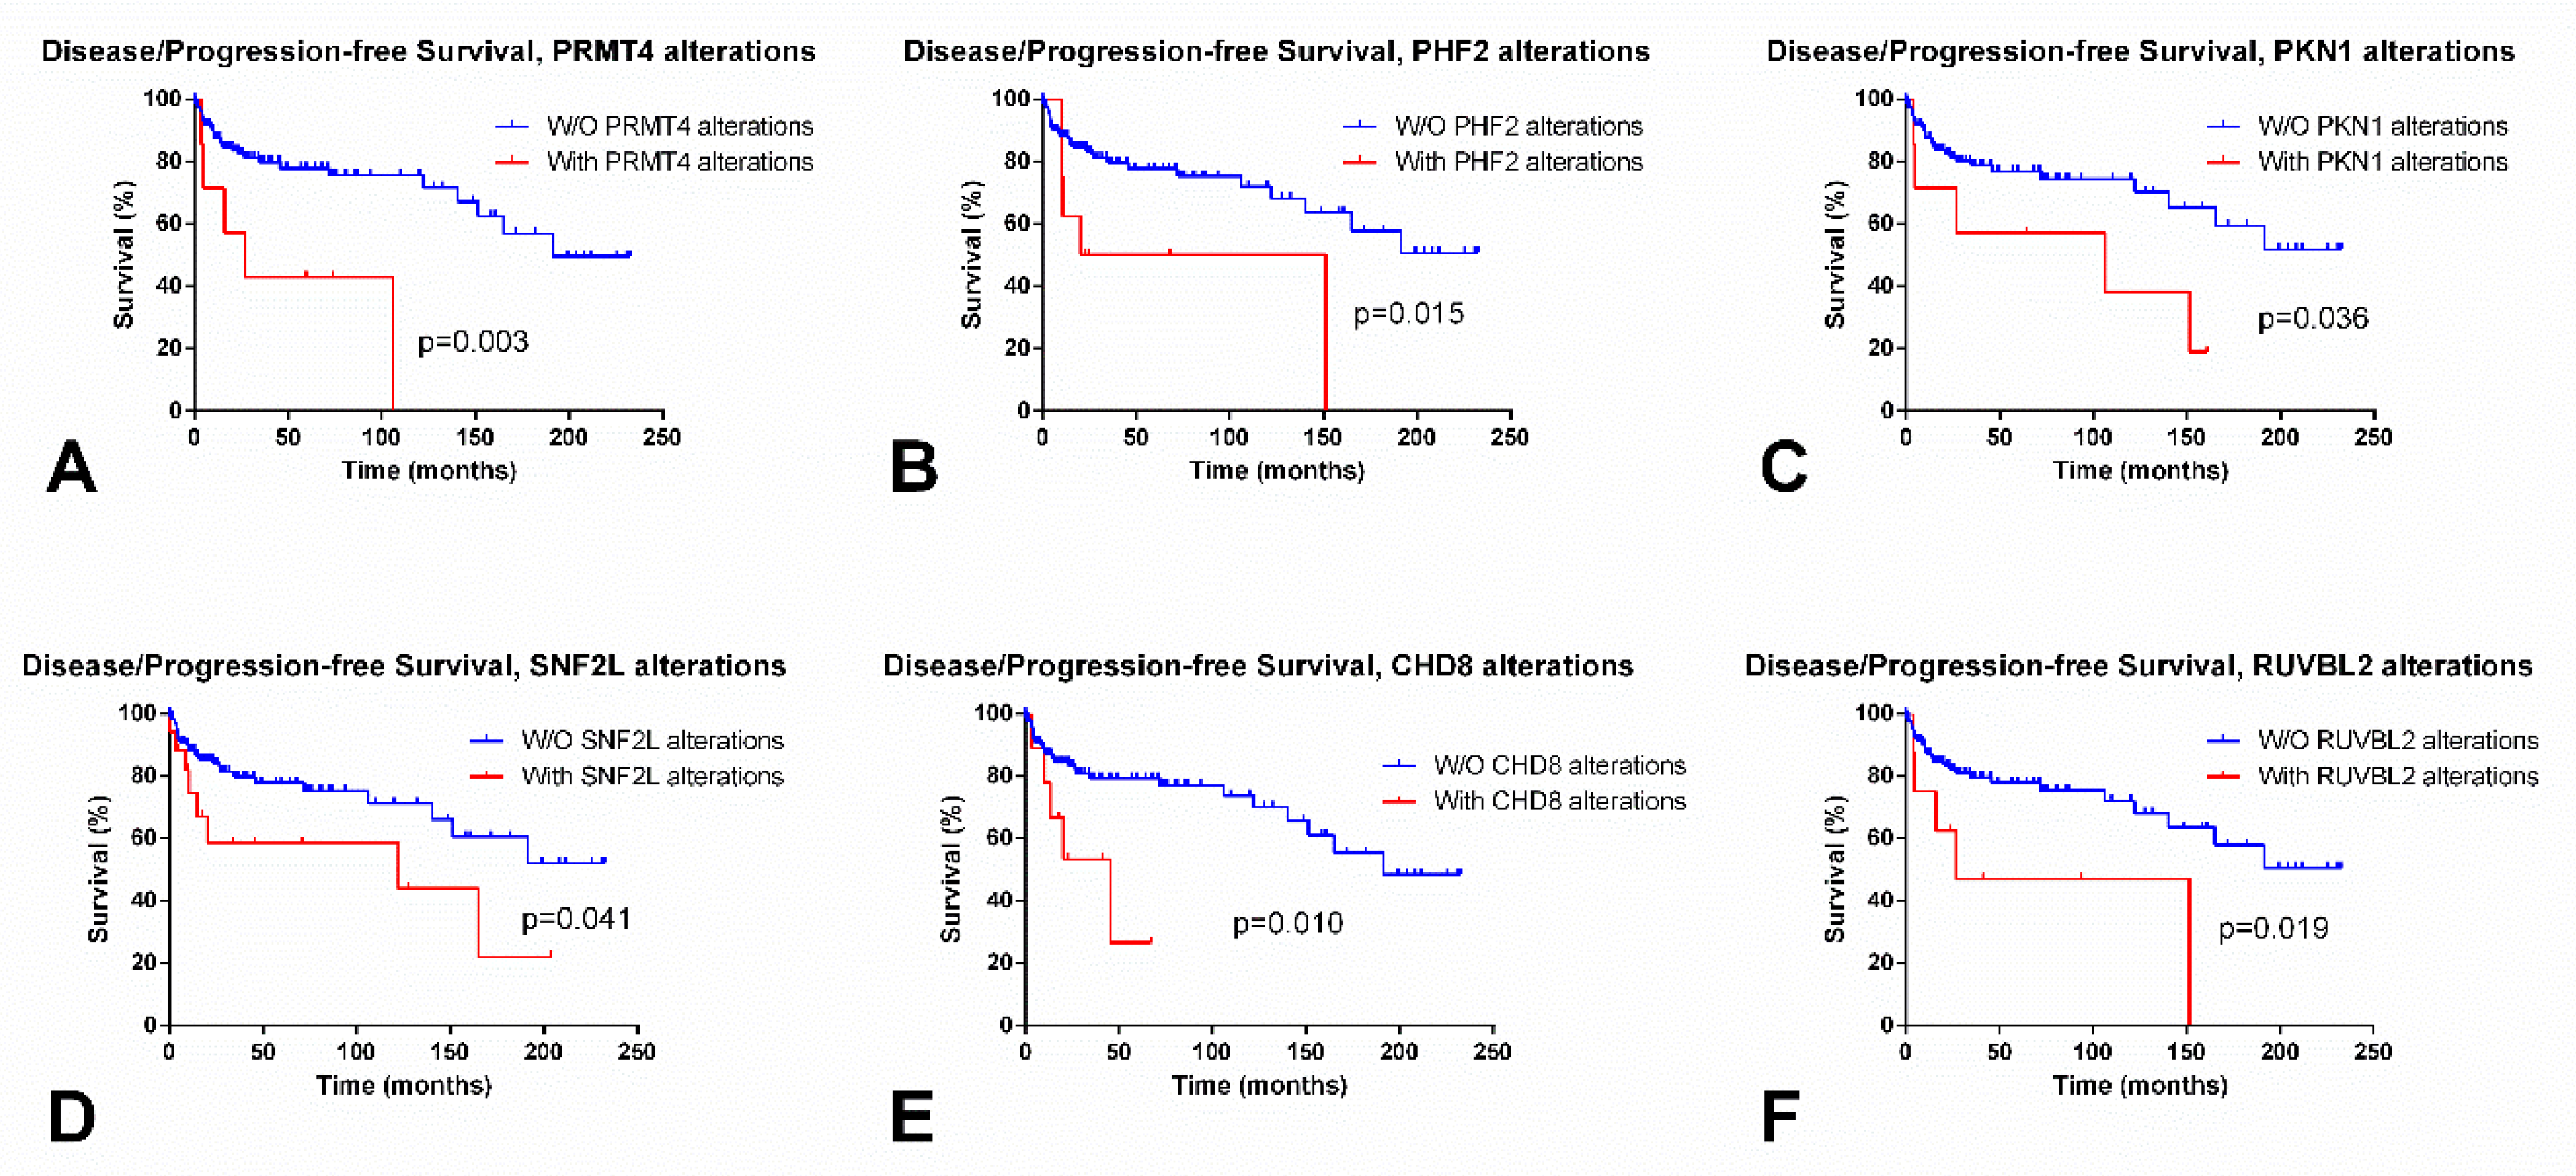
SEs showed significantly lower expression levels of PRMT8 as compared to NSTs (p < 0.0001); PRMT8 allowed for an AUC = 0.83 for discriminating both subtypes. On the contrary, PRMT9 was overexpressed in SEs compared to NSTs, and an AUC = 0.75 was obtained. No associations with disease stage were depicted. However, patients with alterations in PRMT4 (also known as CARM1) showed significantly poorer D/PFS (log rank, p = 0.003) (Figure 2A).
Lysine Demethylases (KDMs)
A. Alpha-Ketoglutarate (2OG) and Fe2+-Dependent, Jumonji (JmjC) Domain-Containing Demethylases
Regarding the removal of methyl groups from lysine residues, two classes of enzymes are considered, again based on their dependence of co-factors: the 2OG/Fe2+-dependent dioxygenases that contain a JmjC domain, and also the FAD-dependent amine oxidases. The former is the major family of KDMs, being composed of 29 different demethylase proteins [74,75,78], which are deregulated in 132/156 (85%) of TGCTs, mainly by mRNA upregulation (41%) and multiple alterations (40%). The most commonly altered enzyme was KDM5A (in 21% of TGCTs, by amplification in all but three tumors) and KDM7A (in 19% of TGCTs, always by mRNA upregulation). Two pairs, KDM4D + KDM4E and JARID2 + KDM2B, tended to show co-occurring alterations (logOR > 3, adjusted p-value 0.014; and logOR 2.446, adjusted p-value 0.015).
SEs showed the overexpression of most demethylases, namely KDM4D (p = 0.0097), KDM3A (p = 0.0003), KDM8, RIOX1 (Figure 1F), HSPBAP1, KDM2A, KDM7A, and KDM3B (p < 0.0001); however, the downregulation of TYW5 and JMJD8 (p < 0.0001 for both) was also disclosed. The best discrimination power was obtained with HSPBAP1 (AUC = 0.93) and RIOX1 (AUC = 0.89). Patients with stage I disease depicted higher RIOX1 and KDM2A expression levels when compared to stages II/III (p = 0.0069 and p = 0.0441, respectively).
Regarding survival, patients with KDM6B and PHF2 alterations endured significantly poorer OS (p = 0.00907) and D/PFS (p = 0.0150), respectively (Figure 2B).
B. FAD-Dependent Amine Oxidase Demethylases (LSDs)
The other class of KDMs contains two family members in this group: KDM1A/LSD1 and KDM1B/LSD2 [79]. They are deregulated in 22/156 (14%) TGCTs, mainly by mRNA upregulation (91%). The most commonly deregulated of the two was LSD1 (8% of the samples). Alterations in these enzymes were neither mutually exclusive nor co-occurrent.
SEs overexpressed LSD2 as compared to NSTs (p < 0.0001), but the discrimination power was rather modest (AUC = 0.73), and no differences were depicted for LSD1. Patients with stage I disease showed higher LSD2 expression when compared to NSTs (p = 0.0062). No significant impact on survival was depicted.
MAIN CONCLUSIONS: SEs display higher expression levels of enzymes that establish activating modifications, such as KDM4D, KDM3A, KMT2B/C/D, SETD1A, and lower expression of those which establish repressive marks, like EHMT2 and EZH2 (despite the latter being reported in another work not to display significant differences in expression among SEs and NSTs [37]). More studies are needed to fully understand the interaction of all these enzymes, their respective modifications, and how they influence TGCTs biology.
3.2.3. Phosphorylation
Serine/Threonine/Tyrosine Kinases
Besides methylation and acetylation, another histone PTMs can affect the chromatin structure. One of them is phosphorylation, which is introduced by proteins called kinases, and it has implications in many biological processes such as DNA repair and transcription regulation. These kinases, which include RPS6KA3, RPS6KA4, RPS6KA5, ATR, ATM, BUB1, DCAF1, BAZ1B, MST1, HASPIN, JAK2, PRKDC, WEE1, AURKB, MAPK3, CHEK1, PKN1, CDK2, PAK2, and FYN, [80] are deregulated in 134/156 (86%) of TGCTs, mainly by mRNA upregulation (63.4%). The only significantly co-occurring pair was CHEK2 and ATM (logOR 2.565, adjusted p-value 0.029). The most frequently altered kinases were BAZ1B (34%) and PRKDC (33%).
Regarding differential expression among SEs vs NSTs, the most remarkable were RPS6KA5, ATR, ATM, and BAZ1B (overexpressed in SEs as compared to NSTs, p < 0.0001), and RPS6KA4, PAK2, and AURKB (downregulated in SEs compared to NSTs, p < 0.0001). The best discrimination was rendered by RPS6KA5 (AUC = 0.89) (Figure 1G), BAZ1B (AUC = 0.85), AURKB, and RPS6KA4 (AUC = 0.83 for both). Patients with stage I disease displayed lower AURKB and RPS6KA4 transcript levels; and higher ATM and ATR transcript levels when compared to stages II/III (p = 0.0373 and p = 0.0491; p = 0.0046 and p = 0.0078, respectively). Patients with ATM alterations showed poorer OS (p = 0.0468) and those with RPS6KA4 and PKN1 alterations disclosed poorer D/PFS (p = 0.0138 and p = 0.0361) (Figure 2C).
3.2.4. Ubiquitination
Ubiquitin Ligases
Histone ubiquitination (and deubiquitination) are less well explored PTMs, but they have been shown to crosstalk with the remaining modifications having impact on DNA repair and gene expression. The histone proteins most commonly conjugated with ubiquitin (especially monoubiquitination) are H2A and H2B. The enzymes catalyzing this reaction are ubiquitin ligases; they include RING1, RNF2, BMI1, UBE2D3, RNF20, RNF40, UBE2A, UBE2B, and UBE2E1 [81,82] and are deregulated in 73/156 (47%) of TGCTs, mainly by mRNA upregulation (68%). The most frequently altered enzymes were RING1 and RNF40 (10% for both). No co-occurring or mutually exclusive pairs of enzymes with alterations were depicted.
SEs displayed significantly higher mRNA expression levels of RNF2 and BMI1 (Figure 1H) and lower expression of RING1, RNF20, and UBE2A when compared to NSTs (p < 0.0001 for all). The most remarkable enzyme in subtype discrimination was BMI1, reaching an AUC = 0.95, followed by RNF20 (AUC = 0.90). Stage I patients also exhibited higher BMI1 and RNF2 expression (p = 0.0013, p = 0.352), and lower RNF20 expression (p = 0.0127). Patients with RNF40 and UBE2E1 alterations disclosed poorer P/DFS (p = 0.0214 and p = 0.0282).
Deubiquitinating Enzymes
On the other hand, enzymes removing ubiquitin from histone residues are called deubiquitinating enzymes. The enzymes USP16, USP21, MYSM1, BAP1, USP3, and USP22 [81] are deregulated in 58/156 (37%) TGCTs, mainly by mRNA upregulation (82.8%). The most frequently altered enzyme was USP16 and BAP1 (12% for both). Again, no co-occurring or mutually exclusive pairs of enzymes with alterations were depicted.
SEs showed significantly higher expression levels of USP16, reaching an AUC = 0.89; and, significantly lower levels of BAP1 (Figure 1I), achieving an AUC = 0.84 (p < 0.0001). Also, stage I tumors displayed USP16 overexpression (p = 0.0001) when compared to stages II/III.
MAIN CONCLUSIONS: Ubiquitination has not been explored thus far in TGCTs, but their differential expression among SEs and NSTs (reaching high AUC values) suggest that they might play an important role in tumorigenesis.
3.3. CHROMATIN REMODELING ENZYMES
ChRCs represent a wide range of proteins that have the common ability of inducing chromatin changes in a dynamic way, including nucleosome sliding, conformational modification of the nucleossome itself, and switching the composition of the histone octamers. Thus, they alter both histones and affect the histone-DNA interaction in the nucleosome. Through ATP hydrolysis, these players are grouped in four major families according to their core structure and presence of certain domains.
3.3.1. SWI/SNF Family
The SWI/SNF chromatin remodelers contain bromodomains and they constitute a large complex composed of various subunits, including BRG1/SMARCA4, BRM/SMARCA2, BAF180/PBRM1, ARID1A, ARID1B, ARID2, SNF5/SMARCB1, BRD7, and BAF60A/SMARCD1 [22,83]. They are deregulated in 84/156 (54%) TGCTs, mainly by mRNA upregulation (63%), but mRNA downregulation occurred in 13 cases. ARID1B showed significantly co-occurrent alterations with PBRM1 (logOR > 3, adjusted p-value < 0.0001). The most frequently deregulated enzyme was BAF60A/SMARCD1 (12%), ARID2, and BRG1/SMARCA4 (11% for both).
SEs showed higher BRG1 and BRM expression levels (p < 0.0001), but lower SMARCD1 levels (p = 0.0020), as compared to NSTs. The best discrimination was achieved by BRM, rendering an AUC = 0.84. Stage I tumors showed significantly higher expression levels of BRM compared to stages II/III (p = 0.0004).
3.3.2. ISWI Family
SNF2H/SMARCA5, SNF2L/SMARCA1, and BAZ1A are members of the ISWI family (which contain SANT-SLIDE modules) [22,84], and they show alterations in 32/56 (21%) TGCTs, mainly by mRNA upregulation (90.6%). SNF2L was the most frequently altered (15%), all consisting of mRNA upregulation. SNF2L and BAZ1A showed significantly co-occurrent alterations (logOR 2.201, adjusted p-value 0.005).
SEs exhibited significantly lower SNF2L expression levels when compared to NSTs (p < 0.0001) (Figure 1J), achieving an AUC = 0.96. Also, stage I patients showed lower SNF2L expression levels as compared to stages II/III (p = 0.0386). Patients with altered SNF2L showed significantly worse D/PFS (p = 0.0411) (Figure 2D).
3.3.3. CHD Family
This family includes nine CHD enzymes (CHD1–9), which possess chromodomains [22,85]. They are deregulated in 92/156 (59%) TGCTs. Most alterations were due to mRNA upregulation (54.3%) and amplification (20.7%). The most frequently deregulated enzymes were CHD7 (28%) and CHD4 (21%). Three pairs tended to show co-occurrent alterations: CHD3 and CHD9 (logOR > 3, adjusted p-value < 0.001), CHD2 and CHD3 (logOR > 3, adjusted p-value 0.006), and CHD2 and CHD9 (logOR > 3, adjusted p-value 0.033).
Regarding subtype discrimination, SEs showed significantly higher expression levels of CHD1, CHD2, CHD6, and CHD7 as compared to NSTs (p < 0.0001), while exhibiting lower CHD4 expression (p < 0.0001). The best discrimination performance was achieved by CHD1 and CHD7 (AUC = 0.81 for both). Also, patients with stage I disease showed higher CHD7 and CHD8 transcript levels when compared to stages II/III (p = 0.0009 and p = 0.0026). Cases with CHD8 and CHD2 alterations showed poorer D/PFS (p = 0.0095 and p = 0.0493, respectively) (Figure 2E).
3.3.4. INO80 Family
INO80, SWR1/SRCAP, RVB1/RUVBL1, RVB2/RUVBL2, YY1, ARP4/ACTL6A, ARP5/ACTR5, and ARP6/ACTR6 are members of the INO80 family (which are characterized by helicase SANT domains) [22], and they are deregulated in 62/156 (40%) TGCTs, mainly by mRNA upregulation (74.2%). The most commonly deregulated enzyme was ARP6/ACTR6 (12% of TGCTs). No single alteration in ARP5/ACTR5 was depicted. There were no significant co-occurrent or mutually exclusive pairs.
Concerning differential expression among tumor subtype and disease stage, SEs and stage I patients displayed higher expression levels of INO80 as compared to NSTs and stages II/III (p < 0.0001 and p = 0.0054, respectively), achieving an AUC = 0.88 for the SE vs. NST discrimination. Also, patients with SRCAP and RUVBL2 alterations showed poorer D/PFS (p = 0.0488 and p = 0.0191) (Figure 2F).
MAIN CONCLUSIONS: Again, ChRCs represent unexplored territory in TGCTs. Alterations in CHD proteins are particularly frequent. This analysis points out they could be important not only in TGCT subtyping, but also in prognostication (survival impact).
4. Conclusions
The integrated molecular characterization of TGCTs is only now being uncovered [86]. There is an urgent need for better biomarkers that can supplant the classical serum markers used in clinical practice (which display many drawbacks), both for diagnostic, prognostic, and predictive purposes. DNA/histone-modifying enzymes (along with related modifications) and chromatin remodelers show promise as biomarkers, as they are frequently differentially expressed among the major classes and subtypes of TGCTs, reflecting the so-called developmental model of tumorigenesis and the locked epigenetic status of the corresponding cell of origin. Nevertheless, they are still scarcely explored in TGCT patients. In this work, we have analyzed the expression of several protein coding epigenetic enzymes at the mRNA level e tumor samples. Detection of such transcript-based biomarkers in liquid biopsies might be technically challenging; however, novel techniques for detection of circulating tumor cells and their transcripts are increasingly being employed with success in several tumor models and they should be pursued in TGCTs as well [87,88,89,90]. If effectively detected in liquid biopsies, these epigenetic players may be explored as biomarkers for targeted therapies. By allowing lower toxicity than the routinely employed chemotherapy regimens, these therapies might improve patients’ quality of life, which is fundamental for such young individuals with large life expectancy. Also, when used in combination, they may prove useful in overcoming cisplatin resistance, which eventually emerges in TGCT patients. The frequent upregulation of DNMTs in ECs (when compared to SEs) may, for instance, be used as a biomarker of susceptibility to DNMT inhibitors (DNMTi). These pharmacological agents comprehend both nucleoside and non-nucleoside analogs and the rationale for using them stands in the fact that by inhibiting the enzymatic activity of DNMTs they lead to the attenuation of malignant phenotype by inducing differentiation and tumor cell death (for review see [91]). Two of these agents (5-azacytidine and 5-aza-2′-deoxycytidine) are in fact already approved for treatment of patients with hematological malignancies, and they might prove useful in this particularly aggressive TGCT subtype. The frequent upregulation of KDACs in NSTs (the most aggressive and challenging subtypes of TGCTs), especially of those that are dependent on Zn2+ (HDACs), also indicates a potential benefit from HDAC inhibitors (HDACi), such as hydroxamic acid inhibitors (one of which—suberanilohydroxamic acid—is already approved again for the treatment of hematological cancers) [92,93]. Inhibitors of HATs (HATi), although not being particularly selective, may also aid in treating patients with SE which show frequently upregulation of these enzymes [94]. The use of such agents might allow for dose reduction of chemotherapy that these young patients endure, as SE is a highly chemo-sensitive solid tumor.
All in all, more studies in larger series are needed to explore the practical role and the clinical value of these enzymes in TGCTs.
Author Contributions
Conception and design: J.L.; Revision and editing: R.H. and C.J.
Funding
This research was funded by FCT—Fundação para a Ciência e Tecnologia (POCI-01-0145-FEDER-29043). J.L. is supported by an FCT—Fundação para a Ciência e Tecnologia—fellowship (SFRH/BD/132751/2017).
Conflicts of Interest
The authors declare they have no competing interest.
References
- Moch, H.; Cubilla, A.L.; Humphrey, P.A.; Reuter, V.E.; Ulbright, T.M. The 2016 WHO Classification of Tumours of the Urinary System and Male Genital Organs-Part A: Renal, Penile, and Testicular Tumours. Eur. Urol. 2016, 70, 93–105. [Google Scholar] [CrossRef]
- Lobo, J.; Costa, A.L.; Vilela-Salgueiro, B.; Rodrigues, A.; Guimaraes, R.; Cantante, M.; Lopes, P.; Antunes, L.; Jeronimo, C.; Henrique, R. Testicular germ cell tumors: Revisiting a series in light of the new WHO classification and AJCC staging systems, focusing on challenges for pathologists. Hum. Pathol. 2018, 82, 113–124. [Google Scholar] [CrossRef]
- Trabert, B.; Chen, J.; Devesa, S.S.; Bray, F.; McGlynn, K.A. International patterns and trends in testicular cancer incidence, overall and by histologic subtype, 1973–2007. Andrology 2015, 3, 4–12. [Google Scholar] [CrossRef] [PubMed]
- Beyer, J.; Albers, P.; Altena, R.; Aparicio, J.; Bokemeyer, C.; Busch, J.; Cathomas, R.; Cavallin-Stahl, E.; Clarke, N.W.; Classen, J.; et al. Maintaining success, reducing treatment burden, focusing on survivorship: Highlights from the third European consensus conference on diagnosis and treatment of germ-cell cancer. Ann. Oncol. 2013, 24, 878–888. [Google Scholar] [CrossRef]
- Henrique, R.; Jeronimo, C. Testicular Germ Cell Tumors Go Epigenetics: Will miR-371a-3p Replace Classical Serum Biomarkers? Eur. Urol. 2017, 71, 221–222. [Google Scholar] [CrossRef] [PubMed]
- Costa, A.L.; Lobo, J.; Jeronimo, C.; Henrique, R. The epigenetics of testicular germ cell tumors: Looking for novel disease biomarkers. Epigenomics 2017, 9, 155–169. [Google Scholar] [CrossRef] [PubMed]
- Buljubasic, R.; Buljubasic, M.; Bojanac, A.K.; Ulamec, M.; Vlahovic, M.; Jezek, D.; Bulic-Jakus, F.; Sincic, N. Epigenetics and testicular germ cell tumors. Gene 2018, 661, 22–33. [Google Scholar] [CrossRef] [PubMed]
- Looijenga, L.H.; Stoop, H.; Biermann, K. Testicular cancer: Biology and biomarkers. Virchows Arch. 2014, 464, 301–313. [Google Scholar] [CrossRef] [PubMed]
- Van Der Zwan, Y.G.; Stoop, H.; Rossello, F.; White, S.J.; Looijenga, L.H. Role of epigenetics in the etiology of germ cell cancer. Int. J. Dev. Biol. 2013, 57, 299–308. [Google Scholar] [CrossRef]
- Kristensen, D.G.; Skakkebaek, N.E.; Rajpert-De Meyts, E.; Almstrup, K. Epigenetic features of testicular germ cell tumours in relation to epigenetic characteristics of foetal germ cells. Int. J. Dev. Biol. 2013, 57, 309–317. [Google Scholar] [CrossRef] [Green Version]
- Murray, M.J.; Huddart, R.A.; Coleman, N. The present and future of serum diagnostic tests for testicular germ cell tumours. Nat. Rev. Urol. 2016, 13, 715–725. [Google Scholar] [CrossRef] [PubMed] [Green Version]
- DesJarlais, R.; Tummino, P.J. Role of Histone-Modifying Enzymes and Their Complexes in Regulation of Chromatin Biology. Biochemistry 2016, 55, 1584–1599. [Google Scholar] [CrossRef] [PubMed]
- Shanmugam, M.K.; Arfuso, F.; Arumugam, S.; Chinnathambi, A.; Jinsong, B.; Warrier, S.; Wang, L.Z.; Kumar, A.P.; Ahn, K.S.; Sethi, G.; et al. Role of novel histone modifications in cancer. Oncotarget 2018, 9, 11414–11426. [Google Scholar] [CrossRef] [PubMed]
- Zhang, W.; Xu, J. DNA methyltransferases and their roles in tumorigenesis. Biomark Res. 2017, 5, 1. [Google Scholar] [CrossRef]
- Tyagi, M.; Imam, N.; Verma, K.; Patel, A.K. Chromatin remodelers: We are the drivers!! Nucleus 2016, 7, 388–404. [Google Scholar] [CrossRef]
- Arrowsmith, C.H.; Bountra, C.; Fish, P.V.; Lee, K.; Schapira, M. Epigenetic protein families: A new frontier for drug discovery. Nat. Rev. Drug. Discov. 2012, 11, 384–400. [Google Scholar] [CrossRef]
- Lobo, J.; Rodrigues, A.; Antunes, L.; Graca, I.; Ramalho-Carvalho, J.; Vieira, F.Q.; Martins, A.T.; Oliveira, J.; Jeronimo, C.; Henrique, R. High immunoexpression of Ki67, EZH2, and SMYD3 in diagnostic prostate biopsies independently predicts outcome in patients with prostate cancer. Urol. Oncol. 2018, 36, 161.e7–161.e17. [Google Scholar] [CrossRef]
- Ferreira, M.J.; Pires-Luis, A.S.; Vieira-Coimbra, M.; Costa-Pinheiro, P.; Antunes, L.; Dias, P.C.; Lobo, F.; Oliveira, J.; Goncalves, C.S.; Costa, B.M.; et al. SETDB2 and RIOX2 are differentially expressed among renal cell tumor subtypes, associating with prognosis and metastization. Epigenetics 2017, 12, 1057–1064. [Google Scholar] [CrossRef]
- Junqueira-Neto, S.; Vieira, F.Q.; Montezuma, D.; Costa, N.R.; Antunes, L.; Baptista, T.; Oliveira, A.I.; Graca, I.; Rodrigues, A.; Magalhaes, J.S.; et al. Phenotypic impact of deregulated expression of class I histone deacetylases in urothelial cell carcinoma of the bladder. Mol. Carcinog. 2015, 54, 523–531. [Google Scholar] [CrossRef]
- Carvalho, S.; Freitas, M.; Antunes, L.; Monteiro-Reis, S.; Vieira-Coimbra, M.; Tavares, A.; Paulino, S.; Videira, J.F.; Jeronimo, C.; Henrique, R. Prognostic value of histone marks H3K27me3 and H3K9me3 and modifying enzymes EZH2, SETDB1 and LSD-1 in colorectal cancer. J. Cancer Res. Clin. Oncol. 2018. [Google Scholar] [CrossRef]
- Roberts, C.W.; Orkin, S.H. The SWI/SNF complex--chromatin and cancer. Nat. Rev. Cancer 2004, 4, 133–142. [Google Scholar] [CrossRef] [PubMed]
- Langst, G.; Manelyte, L. Chromatin Remodelers: From Function to Dysfunction. Genes (Basel) 2015, 6, 299–324. [Google Scholar] [CrossRef] [PubMed] [Green Version]
- Rasmussen, K.D.; Helin, K. Role of TET enzymes in DNA methylation, development, and cancer. Genes Dev. 2016, 30, 733–750. [Google Scholar] [CrossRef] [PubMed] [Green Version]
- Koutsogiannouli, E.A.; Wagner, N.; Hader, C.; Pinkerneil, M.; Hoffmann, M.J.; Schulz, W.A. Differential Effects of Histone Acetyltransferase GCN5 or PCAF Knockdown on Urothelial Carcinoma Cells. Int. J. Mol. Sci. 2017, 18, 1449. [Google Scholar] [CrossRef] [PubMed]
- Skulte, K.A.; Phan, L.; Clark, S.J.; Taberlay, P.C. Chromatin remodeler mutations in human cancers: Epigenetic implications. Epigenomics 2014, 6, 397–414. [Google Scholar] [CrossRef] [PubMed]
- Markulin, D.; Vojta, A.; Samarzija, I.; Gamulin, M.; Beceheli, I.; Jukic, I.; Maglov, C.; Zoldos, V.; Fucic, A. Association Between RASSF1A Promoter Methylation and Testicular Germ Cell Tumor: A Meta-analysis and a Cohort Study. Cancer Genom. Proteom. 2017, 14, 363–372. [Google Scholar] [CrossRef]
- Martinelli, C.; Lengert, A.V.H.; Carcano, F.M.; Silva, E.C.A.; Brait, M.; Lopes, L.F.; Vidal, D.O. MGMT and CALCA promoter methylation are associated with poor prognosis in testicular germ cell tumor patients. Oncotarget 2017, 8, 50608–50617. [Google Scholar] [CrossRef]
- Spiller, C.M.; Gillis, A.J.; Burnet, G.; Stoop, H.; Koopman, P.; Bowles, J.; Looijenga, L.H. Cripto: Expression, epigenetic regulation and potential diagnostic use in testicular germ cell tumors. Mol. Oncol. 2016, 10, 526–537. [Google Scholar] [CrossRef]
- Rijlaarsdam, M.A.; Tax, D.M.; Gillis, A.J.; Dorssers, L.C.; Koestler, D.C.; de Ridder, J.; Looijenga, L.H. Genome wide DNA methylation profiles provide clues to the origin and pathogenesis of germ cell tumors. PLoS ONE 2015, 10, e0122146. [Google Scholar] [CrossRef]
- Vilela-Salgueiro, B.; Barros-Silva, D.; Lobo, J.; Costa, A.L.; Guimaraes, R.; Cantante, M.; Lopes, P.; Braga, I.; Oliveira, J.; Henrique, R.; et al. Germ cell tumour subtypes display differential expression of microRNA371a-3p. Philos. Trans. R. Soc. Lond. B. Biol. Sci. 2018, 373. [Google Scholar] [CrossRef]
- Van Agthoven, T.; Eijkenboom, W.M.H.; Looijenga, L.H.J. microRNA-371a-3p as informative biomarker for the follow-up of testicular germ cell cancer patients. Cell. Oncol. (Dordr) 2017, 40, 379–388. [Google Scholar] [CrossRef] [PubMed] [Green Version]
- Leao, R.; van Agthoven, T.; Figueiredo, A.; Jewett, M.A.S.; Fadaak, K.; Sweet, J.; Ahmad, A.E.; Anson-Cartwright, L.; Chung, P.; Hansen, A.; et al. Serum miRNA Predicts Viable Disease after Chemotherapy in Patients with Testicular Nonseminoma Germ Cell Tumor. J. Urol. 2018, 200, 126–135. [Google Scholar] [CrossRef]
- Anheuser, P.; Radtke, A.; Wulfing, C.; Kranz, J.; Belge, G.; Dieckmann, K.P. Serum Levels of MicroRNA371a-3p: A Highly Sensitive Tool for Diagnosing and Staging Testicular Germ Cell Tumours: A Clinical Case Series. Urol. Int. 2017, 99, 98–103. [Google Scholar] [CrossRef] [PubMed] [Green Version]
- Almstrup, K.; Nielsen, J.E.; Mlynarska, O.; Jansen, M.T.; Jorgensen, A.; Skakkebaek, N.E.; Rajpert-De Meyts, E. Carcinoma in situ testis displays permissive chromatin modifications similar to immature foetal germ cells. Br. J. Cancer 2010, 103, 1269–1276. [Google Scholar] [CrossRef] [PubMed] [Green Version]
- Eckert, D.; Biermann, K.; Nettersheim, D.; Gillis, A.J.; Steger, K.; Jack, H.M.; Muller, A.M.; Looijenga, L.H.; Schorle, H. Expression of BLIMP1/PRMT5 and concurrent histone H2A/H4 arginine 3 dimethylation in fetal germ cells, CIS/IGCNU and germ cell tumors. BMC Dev. Biol. 2008, 8, 106. [Google Scholar] [CrossRef]
- Beyrouthy, M.J.; Garner, K.M.; Hever, M.P.; Freemantle, S.J.; Eastman, A.; Dmitrovsky, E.; Spinella, M.J. High DNA methyltransferase 3B expression mediates 5-aza-deoxycytidine hypersensitivity in testicular germ cell tumors. Cancer Res. 2009, 69, 9360–9366. [Google Scholar] [CrossRef]
- Hinz, S.; Magheli, A.; Weikert, S.; Schulze, W.; Krause, H.; Schrader, M.; Miller, K.; Kempkensteffen, C. Deregulation of EZH2 expression in human spermatogenic disorders and testicular germ cell tumors. World J. Urol. 2010, 28, 631–635. [Google Scholar] [CrossRef]
- Wang, J.; Lu, F.; Ren, Q.; Sun, H.; Xu, Z.; Lan, R.; Liu, Y.; Ward, D.; Quan, J.; Ye, T.; et al. Novel histone demethylase LSD1 inhibitors selectively target cancer cells with pluripotent stem cell properties. Cancer Res. 2011, 71, 7238–7249. [Google Scholar] [CrossRef]
- Arai, E.; Nakagawa, T.; Wakai-Ushijima, S.; Fujimoto, H.; Kanai, Y. DNA methyltransferase 3B expression is associated with poor outcome of stage I testicular seminoma. Histopathology 2012, 60, E12–E18. [Google Scholar] [CrossRef]
- Omisanjo, O.A.; Biermann, K.; Hartmann, S.; Heukamp, L.C.; Sonnack, V.; Hild, A.; Brehm, R.; Bergmann, M.; Weidner, W.; Steger, K. DNMT1 and HDAC1 gene expression in impaired spermatogenesis and testicular cancer. Histochem. Cell. Biol. 2007, 127, 175–181. [Google Scholar] [CrossRef]
- Yamada, S.; Kohu, K.; Ishii, T.; Ishidoya, S.; Hiramatsu, M.; Kanto, S.; Fukuzaki, A.; Adachi, Y.; Endoh, M.; Moriya, T.; et al. Gene expression profiling identifies a set of transcripts that are up-regulated inhuman testicular seminoma. DNA Res. 2004, 11, 335–344. [Google Scholar] [CrossRef] [PubMed]
- Minami, K.; Chano, T.; Kawakami, T.; Ushida, H.; Kushima, R.; Okabe, H.; Okada, Y.; Okamoto, K. DNMT3L is a novel marker and is essential for the growth of human embryonal carcinoma. Clin. Cancer Res. 2010, 16, 2751–2759. [Google Scholar] [CrossRef] [PubMed]
- Bartkova, J.; Bakkenist, C.J.; Rajpert-De Meyts, E.; Skakkebaek, N.E.; Sehested, M.; Lukas, J.; Kastan, M.B.; Bartek, J. ATM activation in normal human tissues and testicular cancer. Cell. Cycle 2005, 4, 838–845. [Google Scholar] [CrossRef] [PubMed]
- Chieffi, P.; Troncone, G.; Caleo, A.; Libertini, S.; Linardopoulos, S.; Tramontano, D.; Portella, G. Aurora B expression in normal testis and seminomas. J. Endocrinol. 2004, 181, 263–270. [Google Scholar] [CrossRef] [PubMed] [Green Version]
- Benesova, M.; Trejbalova, K.; Kucerova, D.; Vernerova, Z.; Hron, T.; Szabo, A.; Amouroux, R.; Klezl, P.; Hajkova, P.; Hejnar, J. Overexpression of TET dioxygenases in seminomas associates with low levels of DNA methylation and hydroxymethylation. Mol. Carcinog. 2017, 56, 1837–1850. [Google Scholar] [CrossRef] [PubMed] [Green Version]
- Kristensen, D.G.; Nielsen, J.E.; Jorgensen, A.; Skakkebaek, N.E.; Rajpert-De Meyts, E.; Almstrup, K. Evidence that active demethylation mechanisms maintain the genome of carcinoma in situ cells hypomethylated in the adult testis. Br. J. Cancer 2014, 110, 668–678. [Google Scholar] [CrossRef] [PubMed]
- Matsuoka, T.; Kawai, K.; Ando, S.; Sugita, S.; Kandori, S.; Kojima, T.; Miyazaki, J.; Nishiyama, H. DNA methyltransferase-3 like protein expression in various histological types of testicular germ cell tumor. Jpn. J. Clin. Oncol. 2016, 46, 475–481. [Google Scholar] [CrossRef] [Green Version]
- Chen, B.F.; Suen, Y.K.; Gu, S.; Li, L.; Chan, W.Y. A miR-199a/miR-214 self-regulatory network via PSMD10, TP53 and DNMT1 in testicular germ cell tumor. Sci. Rep. 2014, 4, 6413. [Google Scholar] [CrossRef]
- Ueda, J.; Ho, J.C.; Lee, K.L.; Kitajima, S.; Yang, H.; Sun, W.; Fukuhara, N.; Zaiden, N.; Chan, S.L.; Tachibana, M.; et al. The hypoxia-inducible epigenetic regulators Jmjd1a and G9a provide a mechanistic link between angiogenesis and tumor growth. Mol. Cell. Biol. 2014, 34, 3702–3720. [Google Scholar] [CrossRef]
- Chen, B.F.; Gu, S.; Suen, Y.K.; Li, L.; Chan, W.Y. microRNA-199a-3p, DNMT3A, and aberrant DNA methylation in testicular cancer. Epigenetics 2014, 9, 119–128. [Google Scholar] [CrossRef]
- Ishii, T.; Kohu, K.; Yamada, S.; Ishidoya, S.; Kanto, S.; Fuji, H.; Moriya, T.; Satake, M.; Arai, Y. Up-regulation of DNA-methyltransferase 3A expression is associated with hypomethylation of intron 25 in human testicular germ cell tumors. Tohoku J. Exp. Med. 2007, 212, 177–190. [Google Scholar] [CrossRef] [PubMed]
- Liang, J.J.; Wang, Z.; Chiriboga, L.; Greco, M.A.; Shapiro, E.; Huang, H.; Yang, X.J.; Huang, J.; Peng, Y.; Melamed, J.; et al. The expression and function of androgen receptor coactivator p44 and protein arginine methyltransferase 5 in the developing testis and testicular tumors. J. Urol. 2007, 177, 1918–1922. [Google Scholar] [CrossRef] [PubMed]
- Fritzsche, F.R.; Hasler, A.; Bode, P.K.; Adams, H.; Seifert, H.H.; Sulser, T.; Moch, H.; Barghorn, A.; Kristiansen, G. Expression of histone deacetylases 1, 2 and 3 in histological subtypes of testicular germ cell tumours. Histol. Histopathol. 2011, 26, 1555–1561. [Google Scholar] [CrossRef] [PubMed]
- Yin, F.; Lan, R.; Zhang, X.; Zhu, L.; Chen, F.; Xu, Z.; Liu, Y.; Ye, T.; Sun, H.; Lu, F.; et al. LSD1 regulates pluripotency of embryonic stem/carcinoma cells through histone deacetylase 1-mediated deacetylation of histone H4 at lysine 16. Mol. Cell. Biol. 2014, 34, 158–179. [Google Scholar] [CrossRef] [PubMed]
- Di Zazzo, E.; Porcile, C.; Bartollino, S.; Moncharmont, B. Critical Function of PRDM2 in the Neoplastic Growth of Testicular Germ Cell Tumors. Biology (Basel) 2016, 5, 54. [Google Scholar] [CrossRef] [PubMed]
- Vega, A.; Baptissart, M.; Caira, F.; Brugnon, F.; Lobaccaro, J.M.; Volle, D.H. Epigenetic: A molecular link between testicular cancer and environmental exposures. Front. Endocrinol. (Lausanne) 2012, 3, 150. [Google Scholar] [CrossRef]
- Liu, S.; Brind’Amour, J.; Karimi, M.M.; Shirane, K.; Bogutz, A.; Lefebvre, L.; Sasaki, H.; Shinkai, Y.; Lorincz, M.C. Setdb1 is required for germline development and silencing of H3K9me3-marked endogenous retroviruses in primordial germ cells. Genes Dev. 2014, 28, 2041–2055. [Google Scholar] [CrossRef]
- Zhou, Z.; Yang, X.; He, J.; Liu, J.; Wu, F.; Yu, S.; Liu, Y.; Lin, R.; Liu, H.; Cui, Y.; et al. Kdm2b Regulates Somatic Reprogramming through Variant PRC1 Complex-Dependent Function. Cell. Rep. 2017, 21, 2160–2170. [Google Scholar] [CrossRef]
- Yamamoto, T.; Takenaka, C.; Yoda, Y.; Oshima, Y.; Kagawa, K.; Miyajima, H.; Sasaki, T.; Kawamata, S. Differentiation potential of Pluripotent Stem Cells correlates to the level of CHD7. Sci. Rep. 2018, 8, 241. [Google Scholar] [CrossRef]
- Deniz, O.; de la Rica, L.; Cheng, K.C.L.; Spensberger, D.; Branco, M.R. SETDB1 prevents TET2-dependent activation of IAP retroelements in naive embryonic stem cells. Genome Biol. 2018, 19, 6. [Google Scholar] [CrossRef]
- Del Mazo, J.; Garcia-Lopez, J.; Weber, M. Epigenetic traits of testicular cancer: From primordial germ cells to germ cell tumors. Epigenomics 2014, 6, 253–255. [Google Scholar] [CrossRef] [PubMed]
- Elliott, A.M.; de Miguel, M.P.; Rebel, V.I.; Donovan, P.J. Identifying genes differentially expressed between PGCs and ES cells reveals a role for CREB-binding protein in germ cell survival. Dev. Biol. 2007, 311, 347–358. [Google Scholar] [CrossRef] [PubMed]
- Cerami, E.; Gao, J.; Dogrusoz, U.; Gross, B.E.; Sumer, S.O.; Aksoy, B.A.; Jacobsen, A.; Byrne, C.J.; Heuer, M.L.; Larsson, E.; et al. The cBio cancer genomics portal: An open platform for exploring multidimensional cancer genomics data. Cancer Discov. 2012, 2, 401–404. [Google Scholar] [CrossRef] [PubMed]
- Youden, W.J. Index for rating diagnostic tests. Cancer 1950, 3, 32–35. [Google Scholar] [CrossRef] [Green Version]
- Schisterman, E.F.; Perkins, N.J.; Liu, A.; Bondell, H. Optimal cut-point and its corresponding Youden Index to discriminate individuals using pooled blood samples. Epidemiology 2005, 16, 73–81. [Google Scholar] [CrossRef] [PubMed]
- Voss, A.K.; Thomas, T. MYST family histone acetyltransferases take center stage in stem cells and development. Bioessays 2009, 31, 1050–1061. [Google Scholar] [CrossRef]
- Sapountzi, V.; Cote, J. MYST-family histone acetyltransferases: Beyond chromatin. Cell. Mol. Life Sci. 2011, 68, 1147–1156. [Google Scholar] [CrossRef]
- Nagy, Z.; Tora, L. Distinct GCN5/PCAF-containing complexes function as co-activators and are involved in transcription factor and global histone acetylation. Oncogene 2007, 26, 5341–5357. [Google Scholar] [CrossRef] [Green Version]
- Di Martile, M.; Del Bufalo, D.; Trisciuoglio, D. The multifaceted role of lysine acetylation in cancer: Prognostic biomarker and therapeutic target. Oncotarget 2016, 7, 55789–55810. [Google Scholar] [CrossRef]
- Lee, K.K.; Workman, J.L. Histone acetyltransferase complexes: One size doesn’t fit all. Nat. Rev. Mol. Cell. Biol. 2007, 8, 284–295. [Google Scholar] [CrossRef]
- Di Cerbo, V.; Schneider, R. Cancers with wrong HATs: The impact of acetylation. Brief. Funct. Genom. 2013, 12, 231–243. [Google Scholar] [CrossRef] [PubMed]
- Parbin, S.; Kar, S.; Shilpi, A.; Sengupta, D.; Deb, M.; Rath, S.K.; Patra, S.K. Histone deacetylases: A saga of perturbed acetylation homeostasis in cancer. J. Histochem. Cytochem. 2014, 62, 11–33. [Google Scholar] [CrossRef] [PubMed]
- Roth, M.; Chen, W.Y. Sorting out functions of sirtuins in cancer. Oncogene 2014, 33, 1609–1620. [Google Scholar] [CrossRef] [PubMed]
- Tian, X.; Zhang, S.; Liu, H.M.; Zhang, Y.B.; Blair, C.A.; Mercola, D.; Sassone-Corsi, P.; Zi, X. Histone lysine-specific methyltransferases and demethylases in carcinogenesis: New targets for cancer therapy and prevention. Curr. Cancer Drug Targets 2013, 13, 558–579. [Google Scholar] [CrossRef] [PubMed]
- McGrath, J.; Trojer, P. Targeting histone lysine methylation in cancer. Pharmacol. Ther. 2015, 150, 1–22. [Google Scholar] [CrossRef] [PubMed]
- Kim, W.; Choi, M.; Kim, J.E. The histone methyltransferase Dot1/DOT1L as a critical regulator of the cell cycle. Cell. Cycle 2014, 13, 726–738. [Google Scholar] [CrossRef] [Green Version]
- Yang, Y.; Bedford, M.T. Protein arginine methyltransferases and cancer. Nat. Rev. Cancer 2013, 13, 37–50. [Google Scholar] [CrossRef] [PubMed]
- Park, S.Y.; Park, J.W.; Chun, Y.S. Jumonji histone demethylases as emerging therapeutic targets. Pharmacol. Res. 2016, 105, 146–151. [Google Scholar] [CrossRef] [PubMed]
- Hosseini, A.; Minucci, S. A comprehensive review of lysine-specific demethylase 1 and its roles in cancer. Epigenomics 2017, 9, 1123–1142. [Google Scholar] [CrossRef]
- Rossetto, D.; Avvakumov, N.; Cote, J. Histone phosphorylation: A chromatin modification involved in diverse nuclear events. Epigenetics 2012, 7, 1098–1108. [Google Scholar] [CrossRef]
- Cao, J.; Yan, Q. Histone ubiquitination and deubiquitination in transcription, DNA damage response, and cancer. Front. Oncol. 2012, 2, 26. [Google Scholar] [CrossRef] [PubMed]
- Meas, R.; Mao, P. Histone ubiquitylation and its roles in transcription and DNA damage response. DNA Repair (Amst) 2015, 36, 36–42. [Google Scholar] [CrossRef] [PubMed] [Green Version]
- Masliah-Planchon, J.; Bieche, I.; Guinebretiere, J.M.; Bourdeaut, F.; Delattre, O. SWI/SNF chromatin remodeling and human malignancies. Annu. Rev. Pathol. 2015, 10, 145–171. [Google Scholar] [CrossRef] [PubMed]
- Bartholomew, B. ISWI chromatin remodeling: One primary actor or a coordinated effort? Curr. Opin. Struct. Biol. 2014, 24, 150–155. [Google Scholar] [CrossRef] [PubMed]
- Stanley, F.K.; Moore, S.; Goodarzi, A.A. CHD chromatin remodelling enzymes and the DNA damage response. Mutat. Res. 2013, 750, 31–44. [Google Scholar] [CrossRef] [PubMed]
- Shen, H.; Shih, J.; Hollern, D.P.; Wang, L.; Bowlby, R.; Tickoo, S.K.; Thorsson, V.; Mungall, A.J.; Newton, Y.; Hegde, A.M.; et al. Integrated Molecular Characterization of Testicular Germ Cell Tumors. Cell. Rep. 2018, 23, 3392–3406. [Google Scholar] [CrossRef]
- Todenhofer, T.; Hennenlotter, J.; Dorner, N.; Kuhs, U.; Aufderklamm, S.; Rausch, S.; Bier, S.; Mischinger, J.; Schellbach, D.; Hauch, S.; et al. Transcripts of circulating tumor cells detected by a breast cancer-specific platform correlate with clinical stage in bladder cancer patients. J. Cancer Res. Clin. Oncol. 2016, 142, 1013–1020. [Google Scholar] [CrossRef]
- Stein, U.; Burock, S.; Herrmann, P.; Wendler, I.; Niederstrasser, M.; Wernecke, K.D.; Schlag, P.M. Circulating MACC1 transcripts in colorectal cancer patient plasma predict metastasis and prognosis. PLoS ONE 2012, 7, e49249. [Google Scholar] [CrossRef]
- Burock, S.; Herrmann, P.; Wendler, I.; Niederstrasser, M.; Wernecke, K.D.; Stein, U. Circulating Metastasis Associated in Colon Cancer 1 transcripts in gastric cancer patient plasma as diagnostic and prognostic biomarker. World J. Gastroenterol. 2015, 21, 333–341. [Google Scholar] [CrossRef]
- Genc, C.G.; Jilesen, A.P.J.; Nieveen van Dijkum, E.J.M.; Klumpen, H.J.; van Eijck, C.H.J.; Drozdov, I.; Malczewska, A.; Kidd, M.; Modlin, I. Measurement of circulating transcript levels (NETest) to detect disease recurrence and improve follow-up after curative surgical resection of well-differentiated pancreatic neuroendocrine tumors. J. Surg. Oncol. 2018, 118, 37–48. [Google Scholar] [CrossRef]
- Marques-Magalhaes, A.; Graca, I.; Henrique, R.; Jeronimo, C. Targeting DNA Methyltranferases in Urological Tumors. Front. Pharmacol. 2018, 9, 366. [Google Scholar] [CrossRef] [PubMed]
- Heerboth, S.; Lapinska, K.; Snyder, N.; Leary, M.; Rollinson, S.; Sarkar, S. Use of epigenetic drugs in disease: An overview. Genet. Epigenet. 2014, 6, 9–19. [Google Scholar] [CrossRef] [PubMed]
- Kim, H.J.; Bae, S.C. Histone deacetylase inhibitors: Molecular mechanisms of action and clinical trials as anti-cancer drugs. Am. J. Transl. Res. 2011, 3, 166–179. [Google Scholar] [PubMed]
- Wapenaar, H.; Dekker, F.J. Histone acetyltransferases: Challenges in targeting bi-substrate enzymes. Clin. Epigenet. 2016, 8, 59. [Google Scholar] [CrossRef] [PubMed]
Figure 1.
Most relevant alterations in protein-coding epigenetic players in testicular germ cell tumors, based on TCGA data. (A) Differential mRNA expression of DNMT3B among SE vs. EC; (B) Differential mRNA expression of TET2 among SE vs. EC; (C) Differential mRNA expression of KAT2A among SE vs. NST; (D) Differential mRNA expression of HDAC11 among SE vs. NST; (E) Differential mRNA expression of EHMT2 among SE vs. NST; (F) Differential mRNA expression of RIOX1 among SE vs. NST; (G) Differential mRNA expression of RPS6KA5 among SE vs. NST; (H) Differential mRNA expression of BMI1 among SE vs. NST; (I) Differential mRNA expression of BAP1 among SE vs. NST; (J) Differential mRNA expression of SNF2L among SE vs. NST. Abbreviations: EC—embryonal carcinoma; NST—non-seminomatous tumor; SE—seminoma; **** stands for p < 0.0001.

Figure 2.
Most significant differences in disease/progression-free survival according to alterations in epigenetic enzymes in testicular germ cell tumors, based on TCGA data. (A) Disease/progression-free (D/PFS) according to alterations in PRMT4; (B) D/PFS according to alterations in PHF2; (C) D/PFS according to alterations in PKN1; (D) D/PFS according to alterations in SNF2L; (E) D/PFS according to alterations in CHD8; and, (F) D/PFS according to alterations in RUVBL2.


Table 1.
Summary of most relevant publications regarding the role of DNA/histone-modifying enzymes and chromatin remodeling complexes involved in testicular germ cell tumors.
Table 1.
Summary of most relevant publications regarding the role of DNA/histone-modifying enzymes and chromatin remodeling complexes involved in testicular germ cell tumors.
| Family | Epigenetic Players | Major Findings | Sample Type and Size | Methodology | Author |
|---|---|---|---|---|---|
| Histone Kinases | ATM | pS-ATM constitutively detected in TGCTs (↑↑ in ECs) and normal testis | TGCTs and normal testes (FFPE) | IHC | Bartkova et al. 2005 [43] |
| AURKB | ↑ in SEs (vs. normal testis) correlated with Ki67 proliferation index | 10 SEs (FFPE) | IHC | Chieffi et al. 2004 [44] | |
| DNA Methyltransferases | DNMT1 | DNMT1 ↑↑ in ECs and ↑ in TEs (vs. absent in SEs); | 32 TGCTs (FFPE) | RT-PCR IHC ISH | Omisanjo et al. 2007 [40] |
| ↑ in ECs (vs. normal testis) Evidence of a miR-199a/miR-214/PSMD10/TP53/DNMT1 self-regulatory pathway | 9 ECs + 12 normal testes (genomic RNA samples) TGCT cell lines | RT-PCR MSP WB | Chen et al. 2014 [48] | ||
| DNMT3A | ↑ in TGCTs (vs. normal testis) and associates with hypomethylation of intron 25 | 20 TGCTs + 9 adjacent tissue + 1 normal testis (FFPE and frozen tissue) | PCR IB/SB IHC | Ishii et al. 2007 [51] | |
| ↑ in SEs (vs. normal testis) | 8 SEs (frozen tissue) | Oligonucleotide-based microarray RT-PCR IHC | Yamada et al. 2004 [41] | ||
| ↑ in ECs (vs. normal testis); DNMT3A is the target of miR-199a-3p | 11 TGCTs + 14 normal testes (genomic RNA samples) TGCT cell lines | RT-PCR MSP/BSP WB | Chen et al. 2014 [50] | ||
| DNMT3B | ↑ in stage III SEs; ↑ associates with poorer relapse-free survival | 88 SEs (FFPE) | IHC | Arai et al. 2012 [39] | |
| ↑ in ECs (vs. somatic solid tumors) ↑ leads to 5AZA hypersensitivity in ECs (vs. somatic tumors) | TGCT cell lines | RT-PCR WB | Beyrouthy et al. 2009 [36] | ||
| DNMT3L | ↑ in ECs (vs. other TGCT subtypes); ↑ in advanced stage SEs | TMAs (n = 83 TGCTs) | IHC | Matsuoka et al. 2016 [47] | |
| ↑ in ECs (vs. somatic tumors and vs. other TGCT subtypes) | 53 TGCTs (FFPE, 43 with frozen tissue) TGCT cell lines | RT-PCR IHC WB | Minami et al. 2010 [42] | ||
| Histone Methyltransferases | EHMT2 | Its loss results in decreased tumor growth | TMA (67 TGCTs + 13 adjacent tissue + 4 normal testes) Cell lines Animal models | RT-PCR WB ChIP IHC | Ueda et al. 2014 [49] |
| EZH2 | ↓ in GCNIS and TGCTs (vs. normal testis) No significant differences between SEs vs. NSTs | 100 TGCTs + 4 GCNIS (frozen tissue) | RT-PCR | Hinz et al. 2010 [37] | |
| EZH2 is expressed in GCNIS cells, but only in the cytoplasm | TGCTs and GCNIS (FFPE) | IHC | Almstrup et al. 2010 [34] | ||
| Histone Deacetylases | HDAC1/2/3 | All 3 HDACs ↑ in CHs No associations with prognostic features | TMA (n = 325 TGCTs) | IHC | Fritzsche et al. 2011 [53] |
| HDAC1 | HDAC1 is expressed at low levels in TGCTs | 32 TGCTs (FFPE) | RT-PCR IHC ISH | Omisanjo et al. 2007 [40] | |
| HDAC1 regulates EC cells proliferation by establishing H4K16; HDAC1 ↑ in EC pluripotent cells (vs. non-pluripotent cells) | TGCT cell lines | RT-PCR ChIP WB | Yin et al. 2014 [54] | ||
| Histone Demethylases | JMJD1A | ↓ in TGCTs (vs. normal testis); Its loss results in increased tumor growth | TMA (67 TGCTs + 13 adjacent tissue + 4 normal testes) Cell lines Animal models | RT-PCR WB ChIP IHC | Ueda et al. 2014 [49] |
| JMJD3 | JMJD3 is absent in GCNIS | TGCTs and GCNIS (FFPE) | IHC | Almstrup et al. 2010 [34] | |
| KDM6A | KDM6A is absent in GCNIS | TGCTs and GCNIS (FFPE) | IHC | Almstrup et al. 2010 [34] | |
| LSD1 | ↑ in SEs (vs. normal testis) and pluripotent TGCT cells; LSD1 inhibitors and LSD1 knockdown impeded proliferation of pluripotent TGCT cells (vs. somatic tumors) | TMAs (n = 6 SEs) TGCT cell lines | WB IHC | Wang et al. 2011 [38] | |
| LSD1 regulates EC cells proliferation by establishing H4K16; LSD1 ↑ in EC pluripotent cells (vs. non-pluripotent cells) | TGCT cell lines | RT-PCR ChIP WB | Yin et al. 2014 [54] | ||
| Histone Methyltransferases | PRDM1 and PRMT5 | H2AR3me2 and H4R3me2 establishment; ↑ co-expression in GCNIS and SEs (vs. NSTs) → silencing of differentiation-related genes | 46 TGCTs + 15 GCNIS tissue (FFPE), 17 frozen tissue TGCT cell lines | Array RT-PCR Co-IP WB IHC | Eckert et al. 2008 [35] |
| PRDM2 | PRDM2 binds ER-α and influences proliferation, survival and apoptosis | TGCT cell lines | RT-PCR WB IP | Zazzo et al. 2016 [55] | |
| PRMT5 | PRMT5 colocalizes with p44 (AR coactivator) PRMT5 ↓ in the nucleus and ↑ in the cytoplasm (vs. normal testis) | 33 SEs + 9 normal testes + 11 LCTs (FFPE) | IHC | Liang et al. 2006 [52] | |
| DNA Demethylases | TET1/2 | TETs ↓ in GCNIS | TGCTs + normal testes (FFPE and frozen tissue) TGCT cell lines | RT-PCR ELISA WB IHC/IF | Kristensen et al. 2014 [46] |
| TET1 | ↑ in SEs (vs. normal testis and vs. NSTs) | 47 TGCTs + 7 normal testes (frozen tissue) TGCT cell lines | RT-PCR Droplet digital PCR IHC | Benesova et al. 2017 [45] |
Upward (↑) and downward (↓) arrows stand for up- and downregulation, respectively. Abbreviations: AR—androgen receptor; BSP—bisulfite sequencing PCR; CH—choriocarcinoma; ChIP—chromatin immunoprecipitation; CoIP—co-immunoprecipitation; EC—embryonal carcinoma; ER-α—estrogen receptor alpha; FFPE—formalin-fixed paraffin embedded; GCNIS—germ cell neoplasia in situ; IB—immunoblot; IF—immunofluorescence; IHC—immunohistochemistry; ISH—in situ hybridization; LCT—Leydig cell tumor; MSP—methylation specific PCR; NST—non-seminomatous tumor; PCR—polymerase chain reaction; pS-ATM—S1981-phosphorylated ATM; RT-PCR—real-time PCR; SB—southern blot; SE—seminoma; TGCT—testicular germ cell tumor; TMA—tissue microarray; WB—western blot; 5AZA—5-aza-2′deoxycytidine.
Table 2.
Summary of most relevant DNA/histone-modifying enzymes and chromatin remodeling complexes involved in testicular germ cell tumors according to The Cancer Genome Atlas (TCGA) database analysis.
Table 2.
Summary of most relevant DNA/histone-modifying enzymes and chromatin remodeling complexes involved in testicular germ cell tumors according to The Cancer Genome Atlas (TCGA) database analysis.
| PLAYERS * | Most Frequently Deregulated (% of Cases) | Related Alterations (logOR) | SEvsNST | Best Performance (AUC) | Association with Stage | Survival Impact |
|---|---|---|---|---|---|---|
| DNA-modifying enzymes | ||||||
| DNMTs | DNMT3B (10) | DNMT3A and DNMT3B (co-occurrent, 2.785) | All ↓ in SE | DNMT3A (0.88) | Yes (DNMT3A/3B) | No |
| TETs | TET3 (8) | No | TET2 ↑ in SE | TET2 (0.79) | Yes (TET2) | No |
| Histone-modifying enzymes | ||||||
| ACETYLATION | ||||||
| KATs | ||||||
| MYST family | KAT6A (20) | KAT6A and KAT7 (mutually exclusive, <−3) | KAT6A/6B ↑ in SE; KAT5/8 ↓ in SE | KAT5 (0.75) | Yes (KAT6B and KAT8) | No |
| GNAT family | KAT9 (36) | KAT2A and KAT9 (mutually exclusive, <−3) | KAT1/2A/2B/9 ↑ in SE; SLC33A1 and ATAT1 ↓ in SE | KAT2A (0.78) | Yes (KAT2B) | No |
| Orphan family | KAT13C (41) | KAT3B and KAT13C; KAT13A and KAT13C (co-occurrent, >3) | KAT3B/13A/13C and CLOCK ↑ in SE | KAT13A (0.74) | Yes (KAT3B/13A/13C) | No |
| KDACs | ||||||
| HDACs | HDAC9 (14) | HDAC6 and HDAC8 (co-occurrent, 2.9) | HDAC1/2/3/8/9/11 ↓ in SE; HDAC5/6/7 ↑ in SE | HDAC11 (0.93) | Yes (HDAC1/11) | No |
| SIRTs | SIRT2/6 (10) | SIRT3 and SIRT6 (co-occurrent, >3) | SIRT4 ↓ in SE; SIRT5 ↑ in SE | SIRT4 (0.77) | Yes (SIRT4) | No |
| METHYLATION | ||||||
| KMTs | ||||||
| SET domain | SETD4 (45) EZH2 (21) | KMT2A and PRDM10; ASH1L and PRDM11; ASH1L and SMYD1 (co-occurrent, >3) | KMT2B/2C/2D, SETD1A/D4/DB2, EZH1, SMYD3 and PRDM1/2/7/15 ↑ in SE; EHMT2, MECOM, SETD7, PRDM5 and EZH2 ↓ in SE | EHMT2, PRDM1 and PRDM5 (AUC 0.96) | Yes (EHMT2, KMT2B and PRDM15) | Yes (KMT2D and PRDM2) |
| DOT1-like | DOT1L (9) | N/A | ↑ in SE | DOT1L (0.79) | No | No |
| PRMTs | PRMT8 (21) | No | PRMT8 ↓ in SE PRMT9 ↑ in SE | PRMT8 (0.83) | No | Yes (PRMT4) |
| KDMs | ||||||
| Jumonji-domain | KDM5A (21) KDM7A (19) | KDM4D and KDM4E (co-occurrent, >3) | KDM2A/3A/3B/4D/7A/8, RIOX1 and HSPBAP1 ↑ in SE; TYW5 and JMJD8 ↓ in SE | HSPBAP1 (0.93) | Yes (RIOX1 and KDM2A) | Yes (KDM6B and PHF2) |
| LSDs | LSD1 (8) | No | LSD2 ↑ in SE | LSD2 (0.73) | Yes (LSD2) | No |
| PHOSPHORYLATION | ||||||
| Kinases | BAZ1B (34) PRKDC (33) | CHEK2 and ATM (co-occurrent, 2.565) | BAZ1B, ATM, ATR and RPS6KA5 ↑ in SE; RPS6KA4, PAK2 and AURKB ↓ in SE | RPS6KA5 (0.89) | Yes (AURKB, ATM, ATR and RPS6KA4) | Yes (ATM, RPS6KA4 and PKN1) |
| UBIQUITINATION | ||||||
| Ubiquitin ligases | RING1 and RNF40 (10) | No | RNF2 and BMI1 ↑ in SE; RING1, RNF20 and EBE2A ↓ in SE | BMI1 (0.95) | Yes (BMI1, RNF2 and RNF20) | Yes (RNF40 and UBE2E1) |
| Deubiquitinating enzymes | USP16 and BAP1 (12) | No | USP16 ↑ in SE; BAP1 ↓ in SE | USP16 (0.89) | Yes (USP16) | No |
| Chromatin remodeling complexes | ||||||
| SWI/SNF | SMARCD1 (12) | ARID1B and PBRM1 (co-occurrent, >3) | BRG1 and BRM ↑ in SE; SMARCD1 ↓ in SE | BRM (0.84) | Yes (BRM) | No |
| ISWI | SNF2L (15) | SNF2L and BAZ1A (co-occurrent, 2.201) | SNF2L ↓ in SE | SNF2L (0.96) | Yes (SNF2L) | Yes (SNF2L) |
| CHD | CHD7 (28) CHD4 (21) | CHD3, CHD2 and CHD9 (co-occurrent alterations, >3) | CHD1/2/6/7 ↑ in SE; CHD4 ↓ in SE | CDH1 and CHD7 (0.81) | Yes (CHD7 and CHD8) | Yes (CHD2 and CHD8) |
| INO80 | ARP6 (12) | No | INO80 ↑ in SE | INO80 (0.88) | Yes (INO80) | Yes (SRCAP and RUVBL2) |
* Only the most relevant and significant players are represented. Upward (↑) and downward (↓) arrows stand for up- and downregulation, respectively. Abbreviations: AUC—area under the curve; N/A—not applicable; NST—non-seminomatous tumors; OR—odds ratio; SE—seminoma; TGCT—testicular germ cell tumors.
© 2018 by the authors. Licensee MDPI, Basel, Switzerland. This article is an open access article distributed under the terms and conditions of the Creative Commons Attribution (CC BY) license (http://creativecommons.org/licenses/by/4.0/).
Share and Cite
MDPI and ACS Style
Lobo, J.; Henrique, R.; Jerónimo, C. The Role of DNA/Histone Modifying Enzymes and Chromatin Remodeling Complexes in Testicular Germ Cell Tumors. Cancers 2019, 11, 6. https://0-doi-org.brum.beds.ac.uk/10.3390/cancers11010006
AMA Style
Lobo J, Henrique R, Jerónimo C. The Role of DNA/Histone Modifying Enzymes and Chromatin Remodeling Complexes in Testicular Germ Cell Tumors. Cancers. 2019; 11(1):6. https://0-doi-org.brum.beds.ac.uk/10.3390/cancers11010006
Chicago/Turabian StyleLobo, João, Rui Henrique, and Carmen Jerónimo. 2019. "The Role of DNA/Histone Modifying Enzymes and Chromatin Remodeling Complexes in Testicular Germ Cell Tumors" Cancers 11, no. 1: 6. https://0-doi-org.brum.beds.ac.uk/10.3390/cancers11010006
Note that from the first issue of 2016, this journal uses article numbers instead of page numbers. See further details here.