Menin and Menin-Associated Proteins Coregulate Cancer Energy Metabolism

 , , and
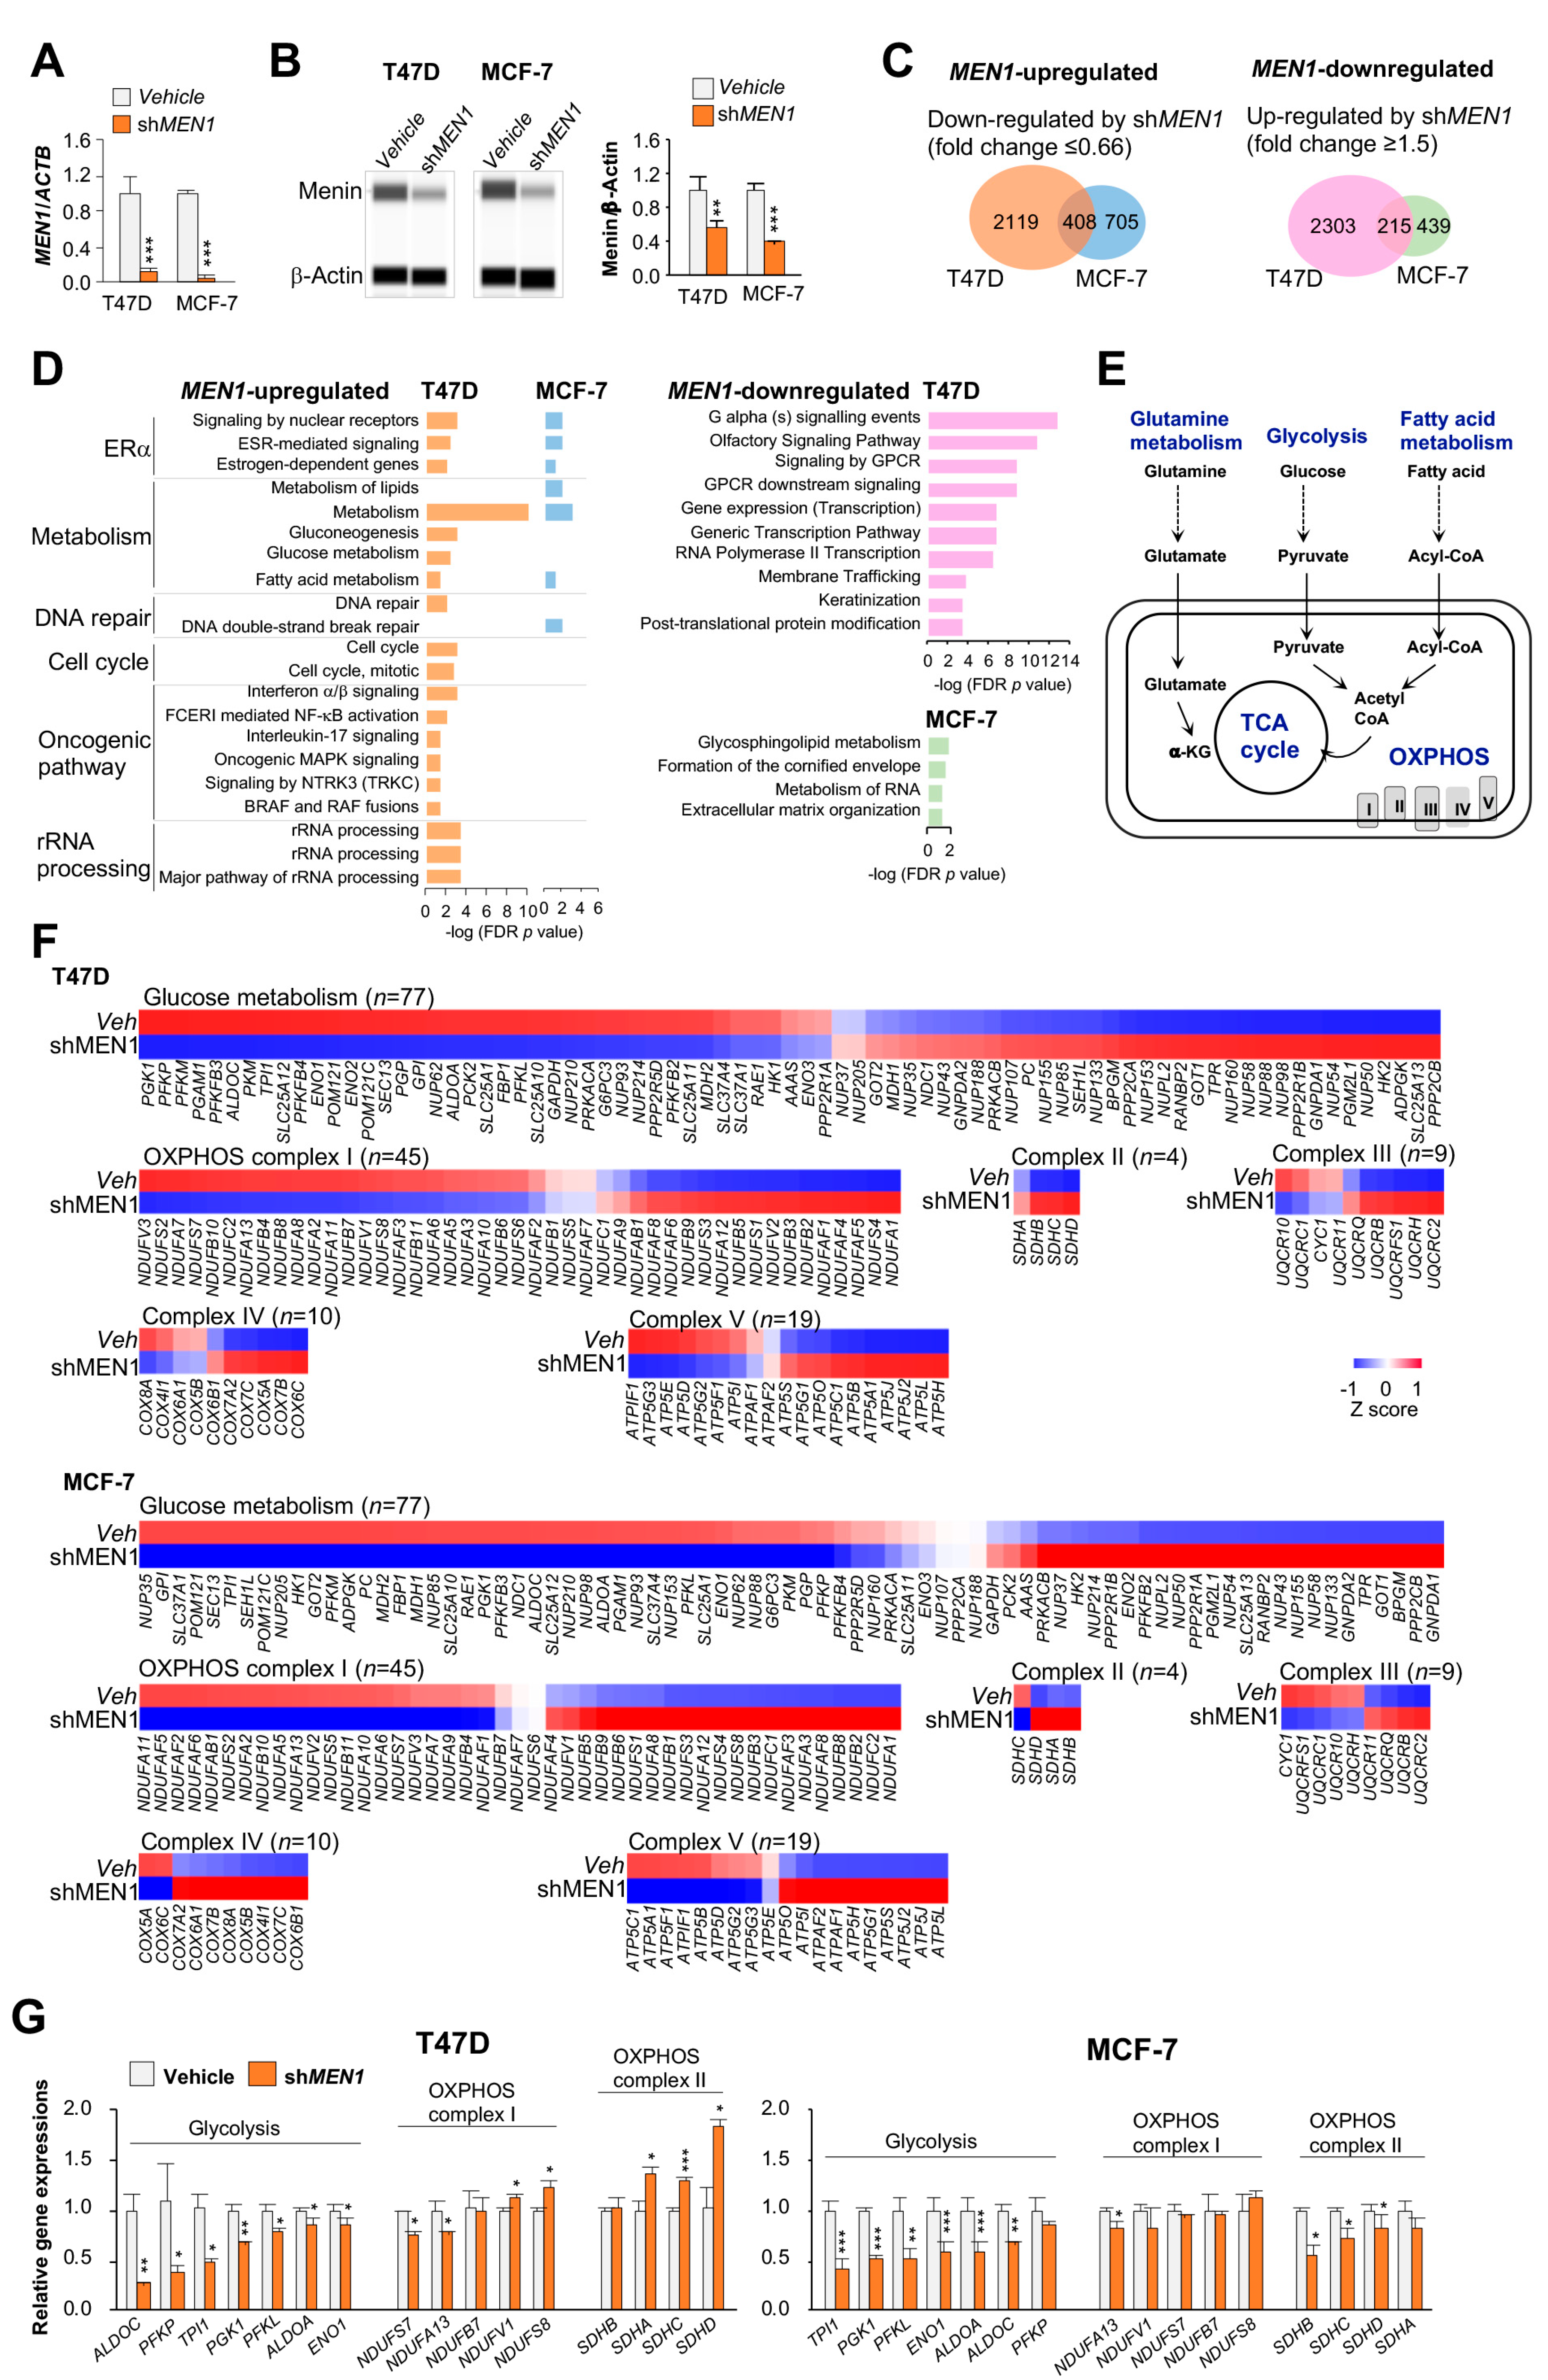
Abstract
:Simple Summary
Abstract
1. Introduction
2. Results
2.1. Gene Transcription of Energy Metabolism Pathways Modulated by MEN1
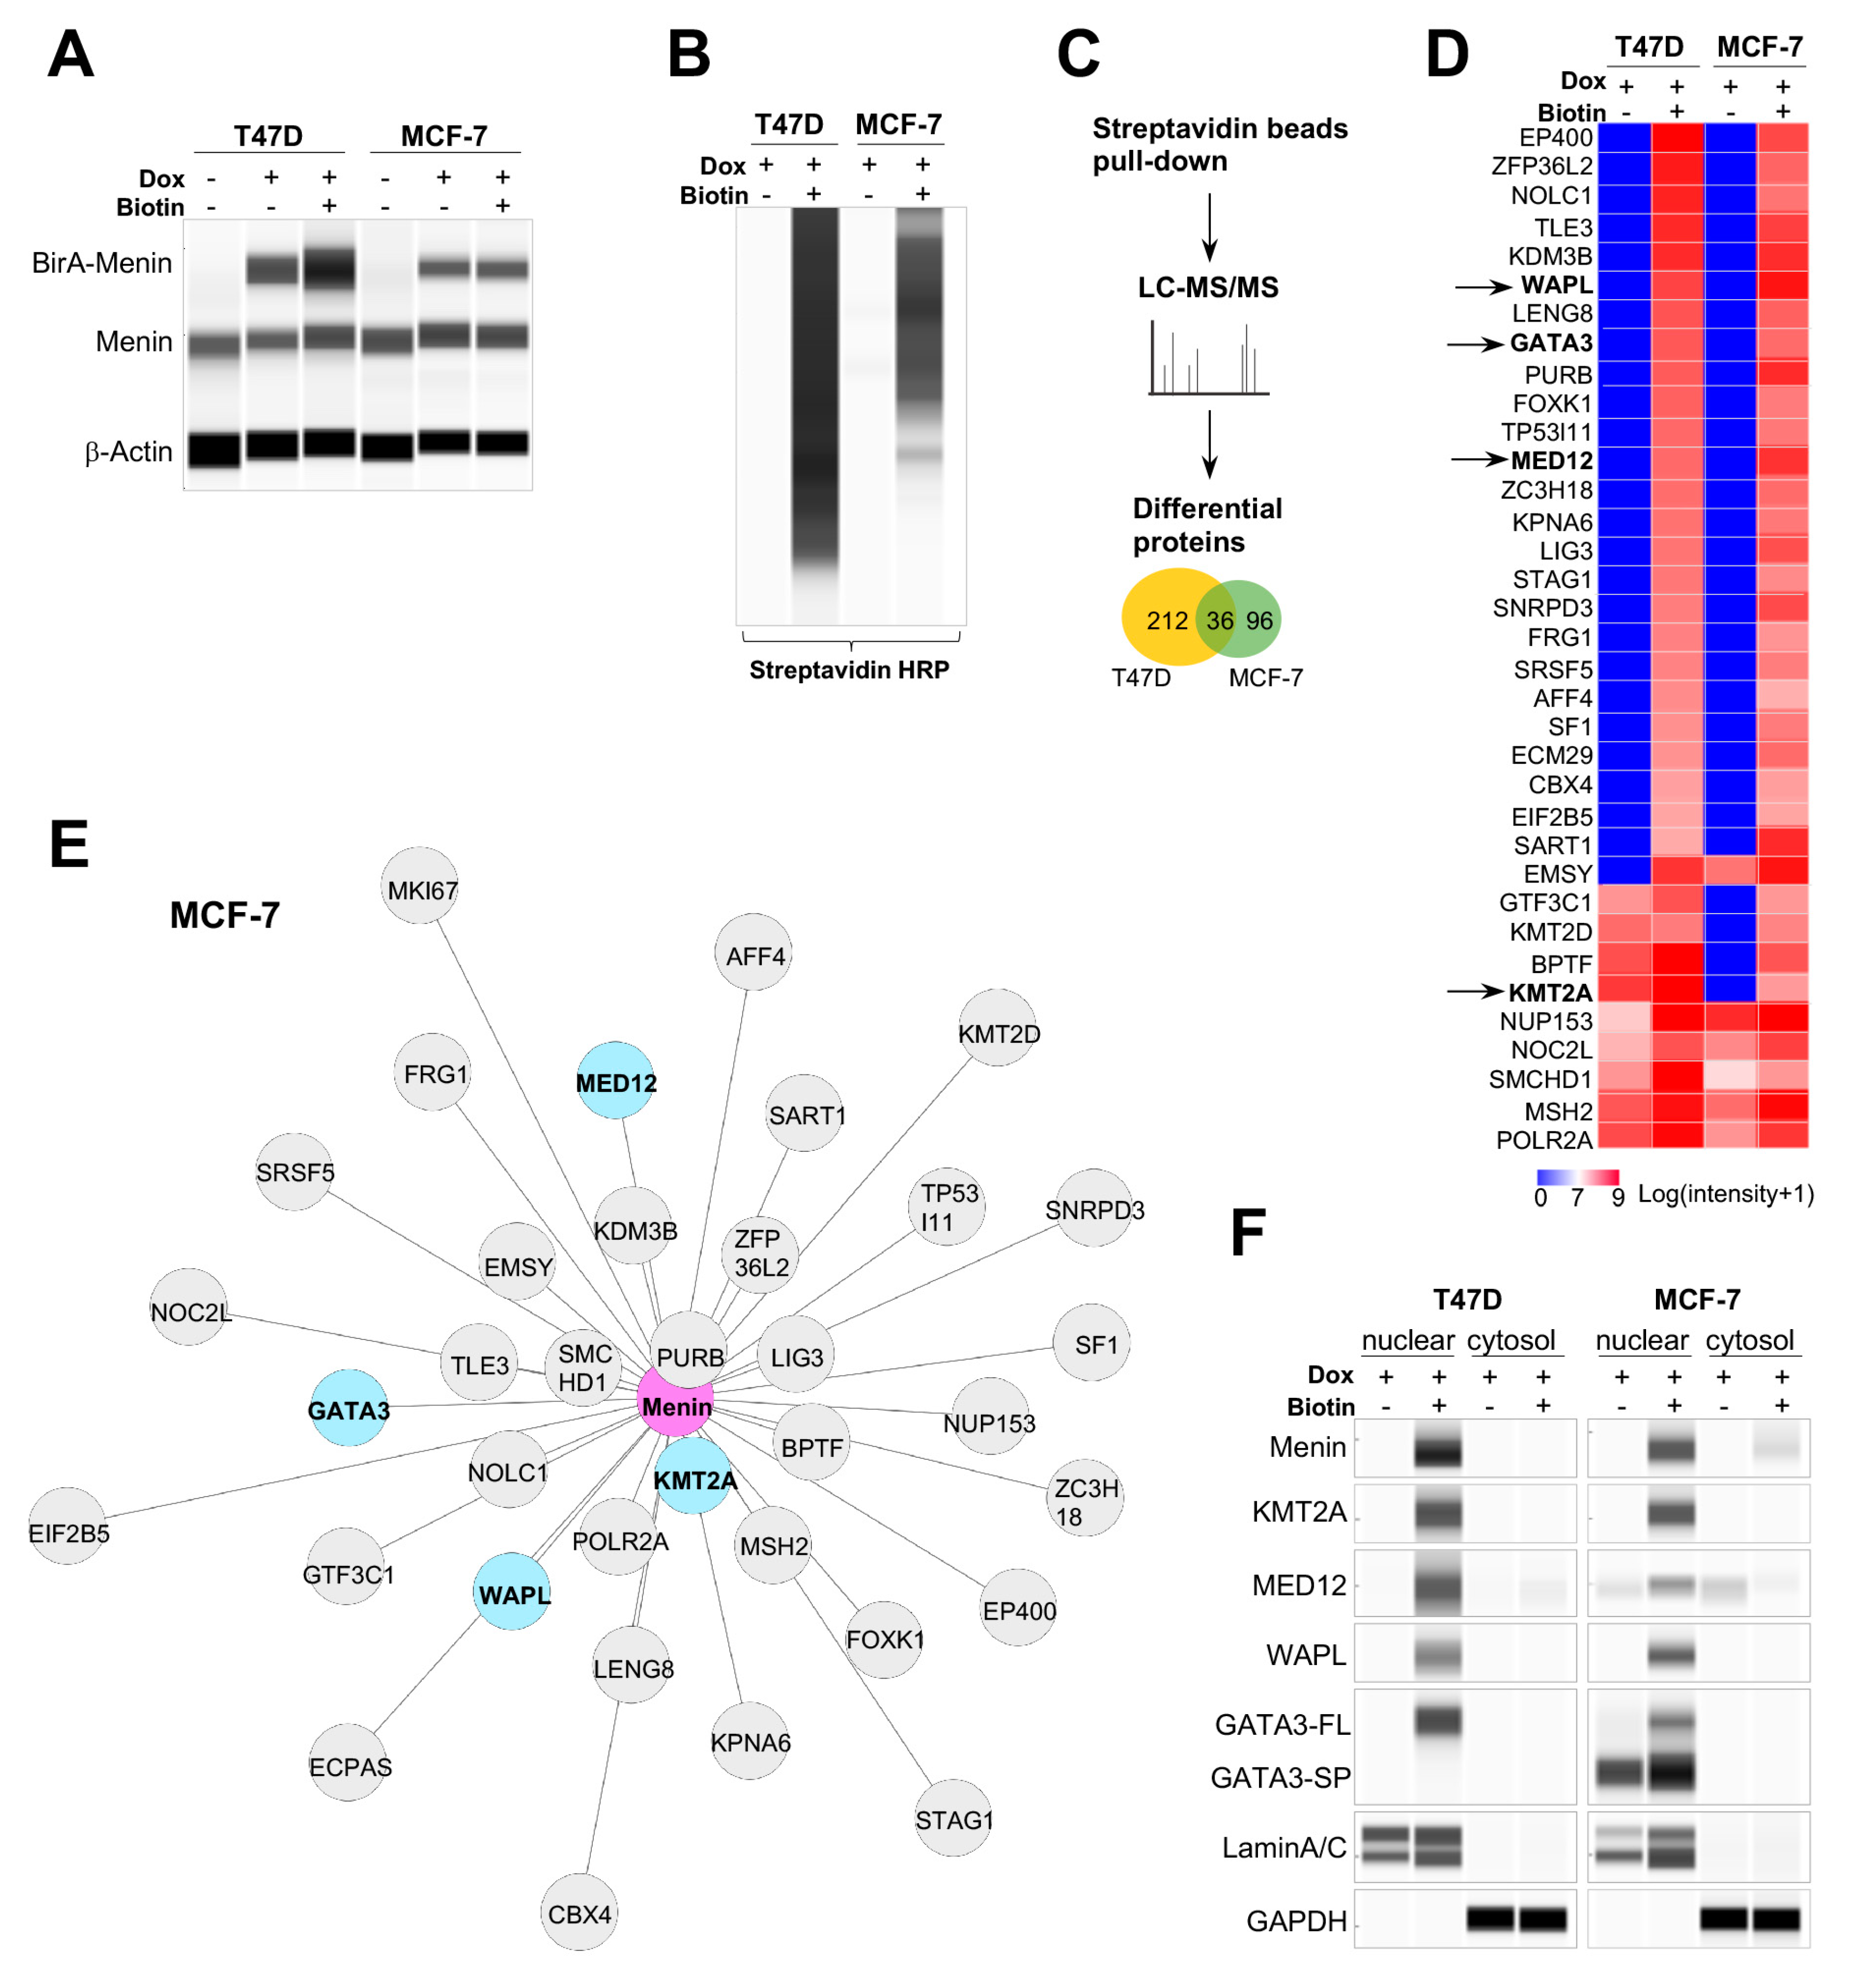
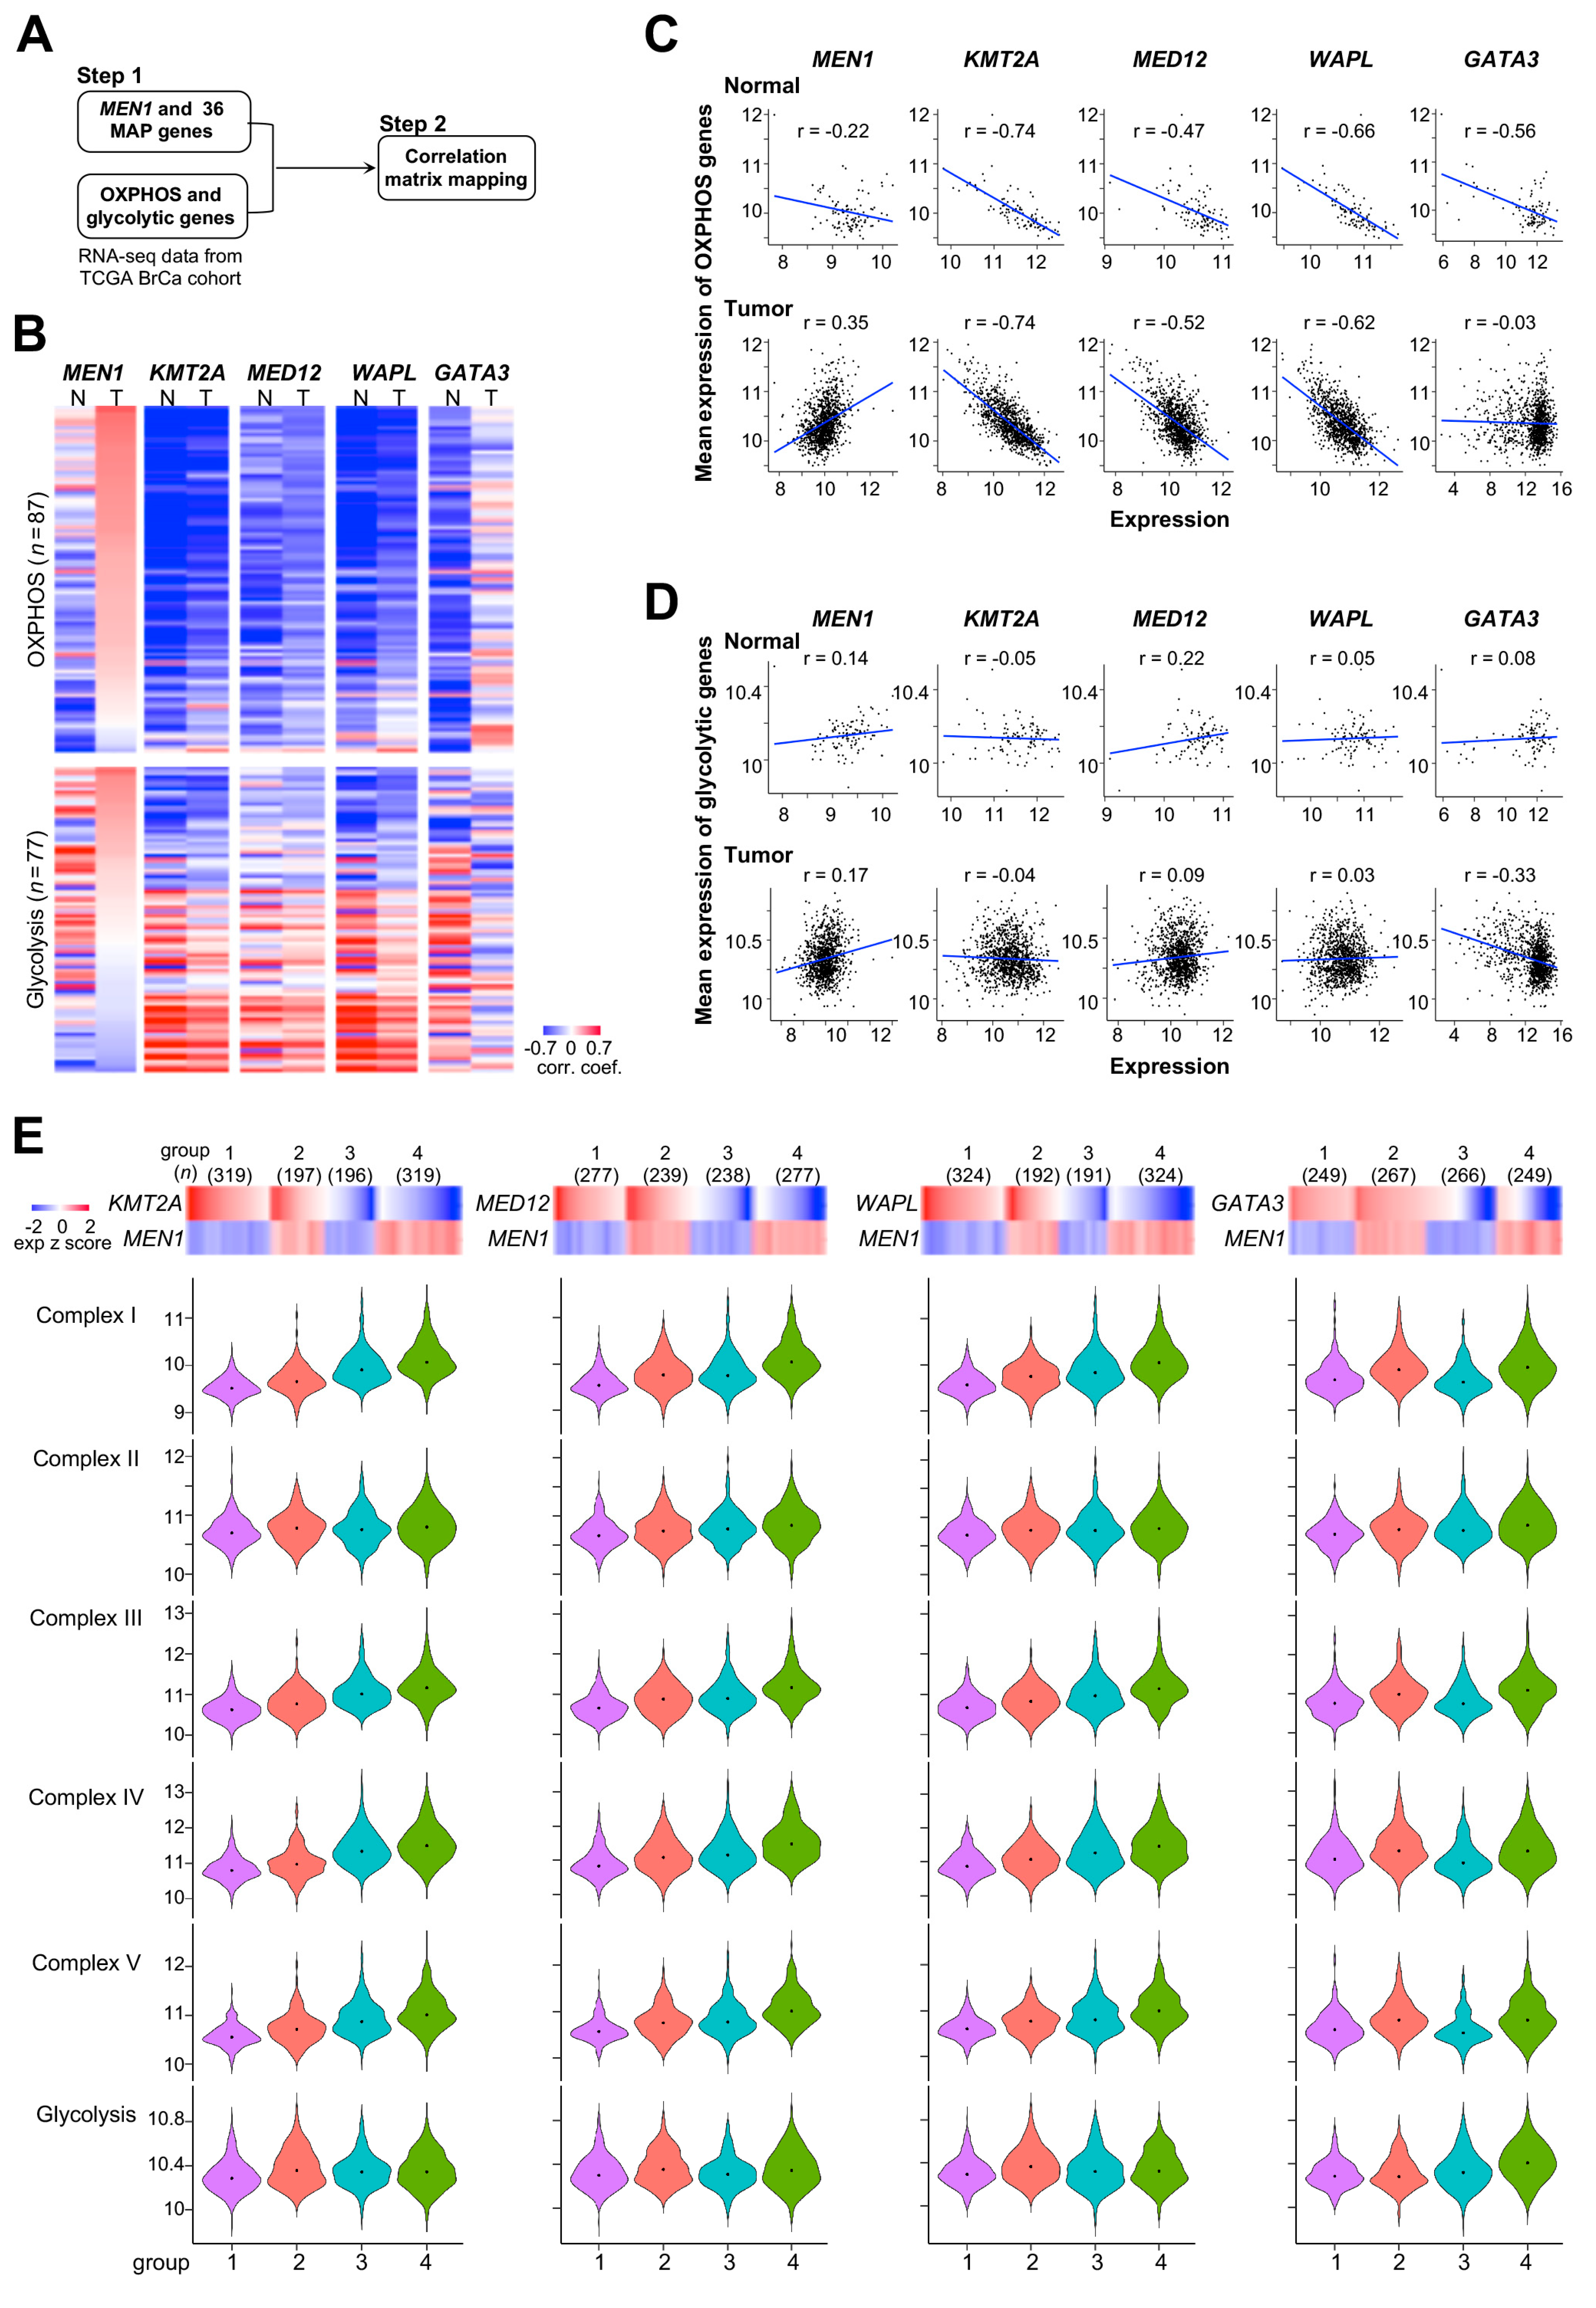
2.2. Energy Metabolism Genes Coregulated by Menin and Menin-Associated Proteins in Primary Tumors
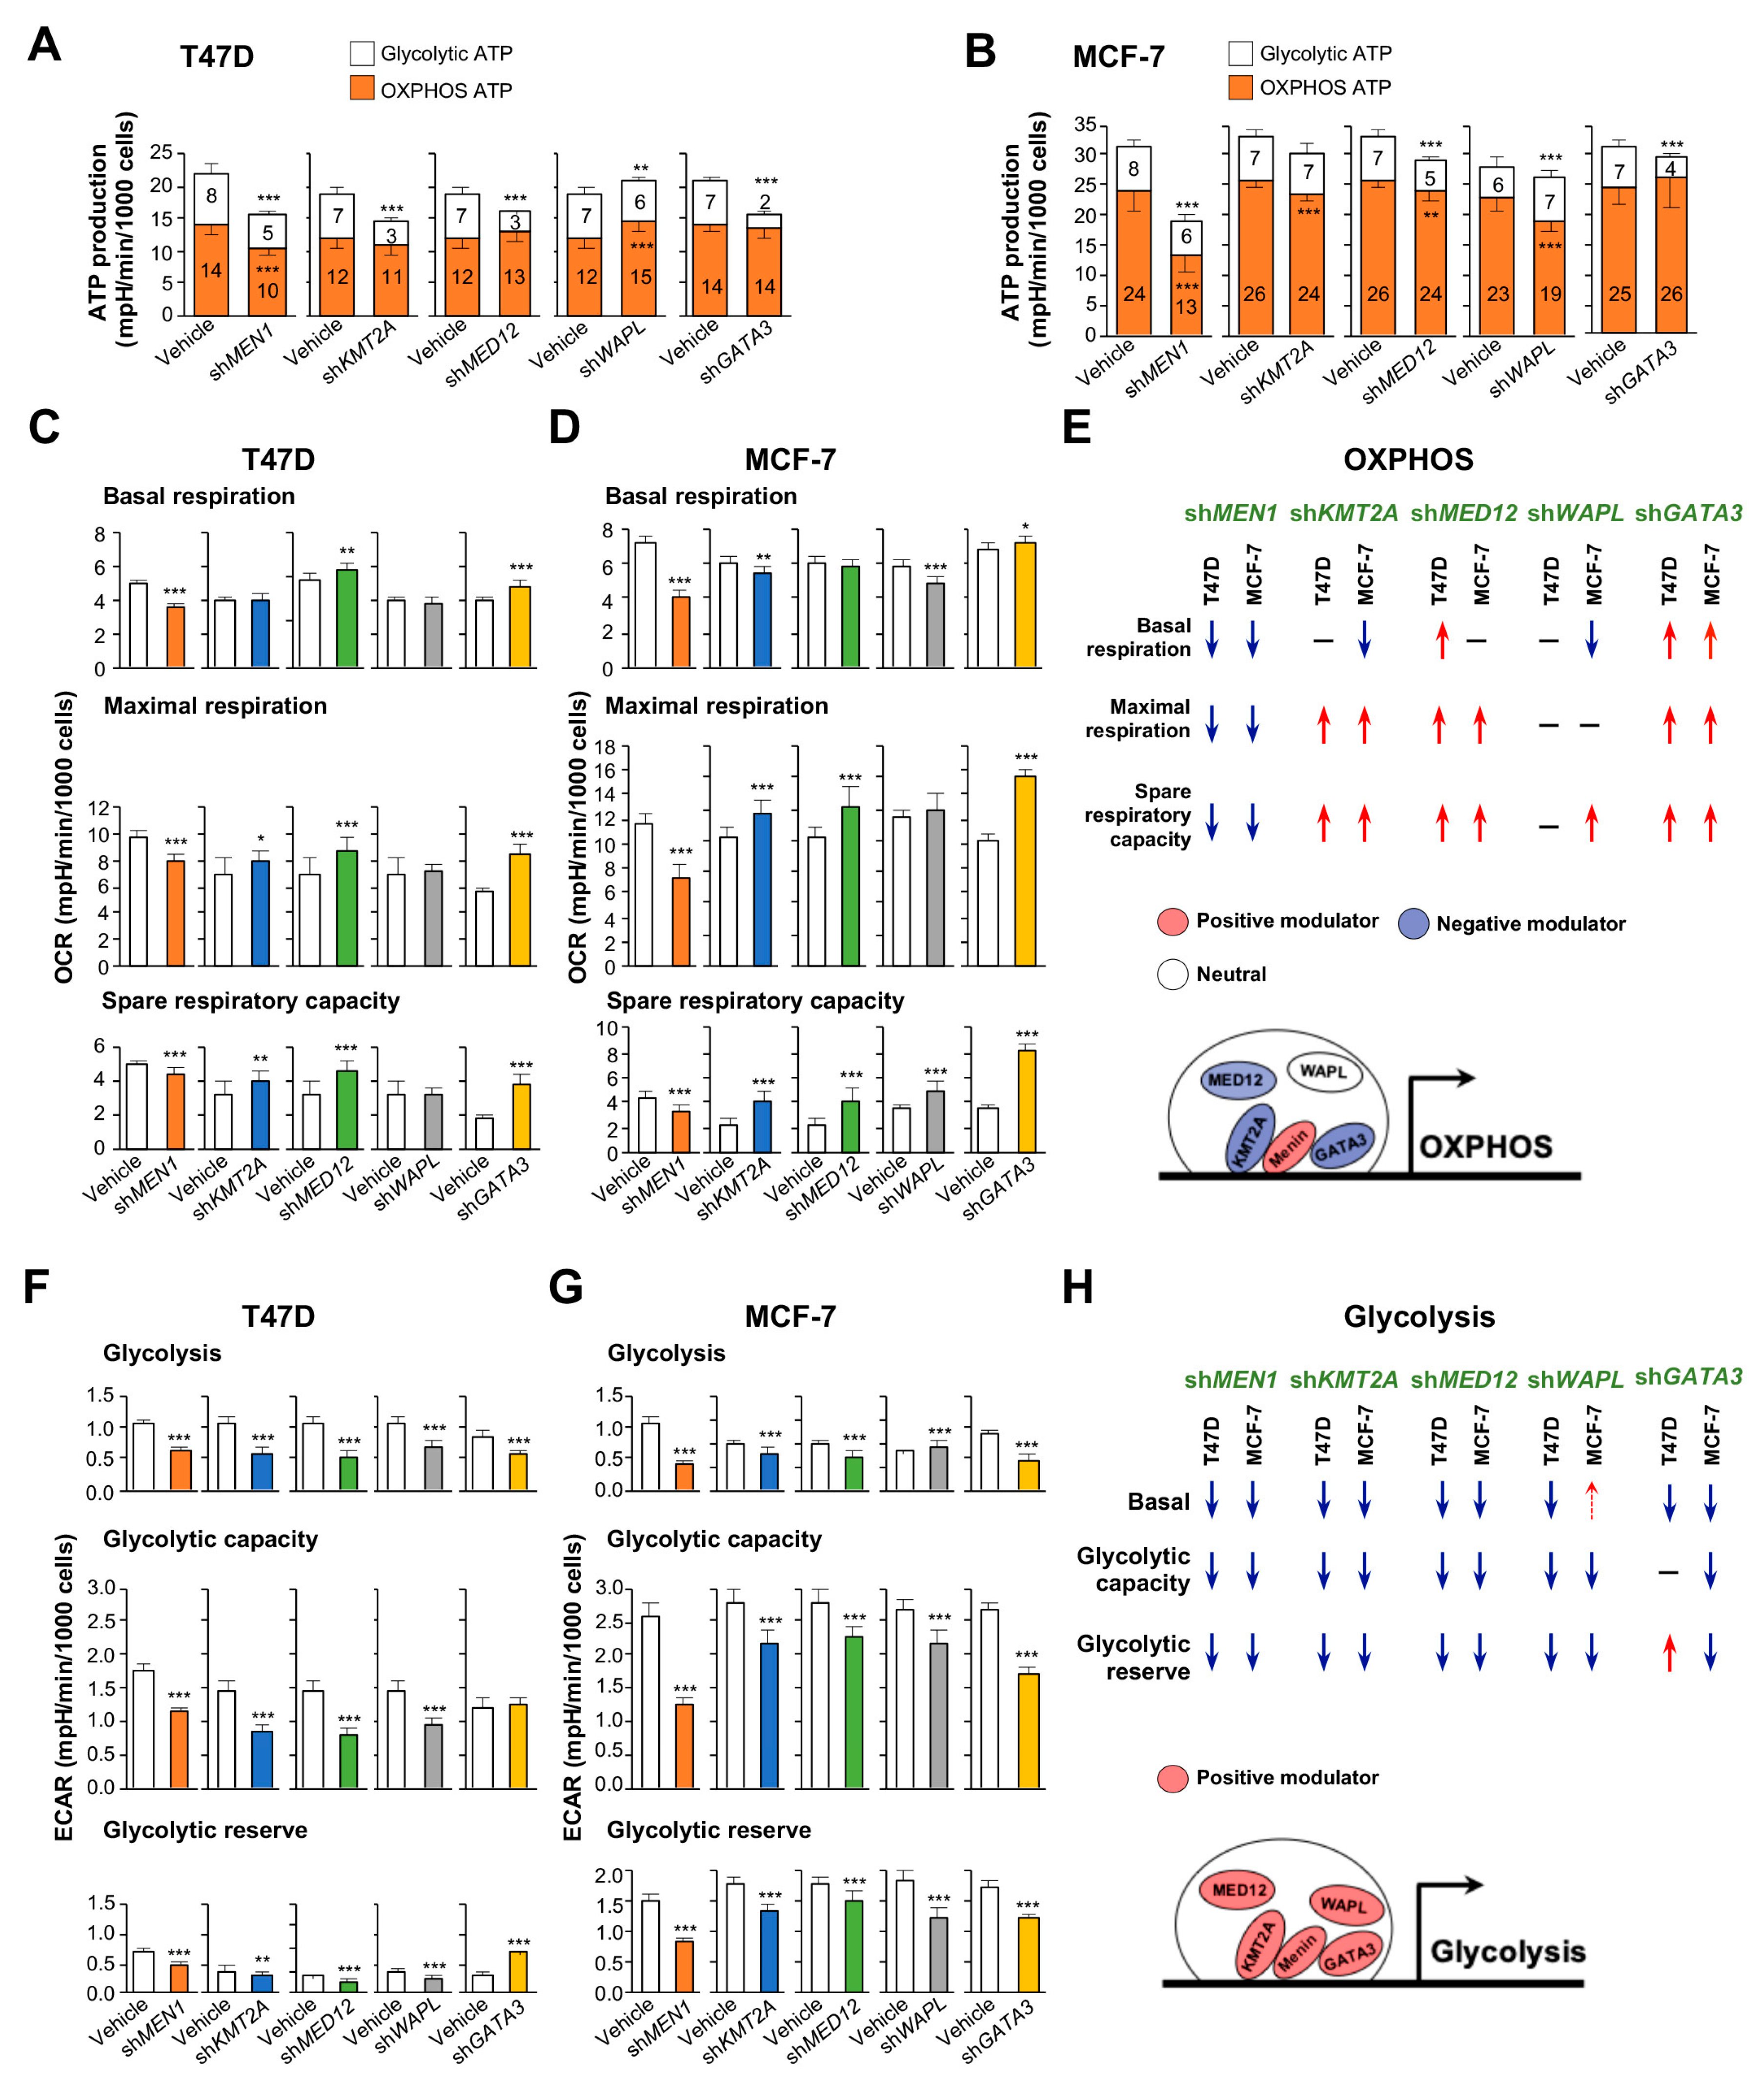
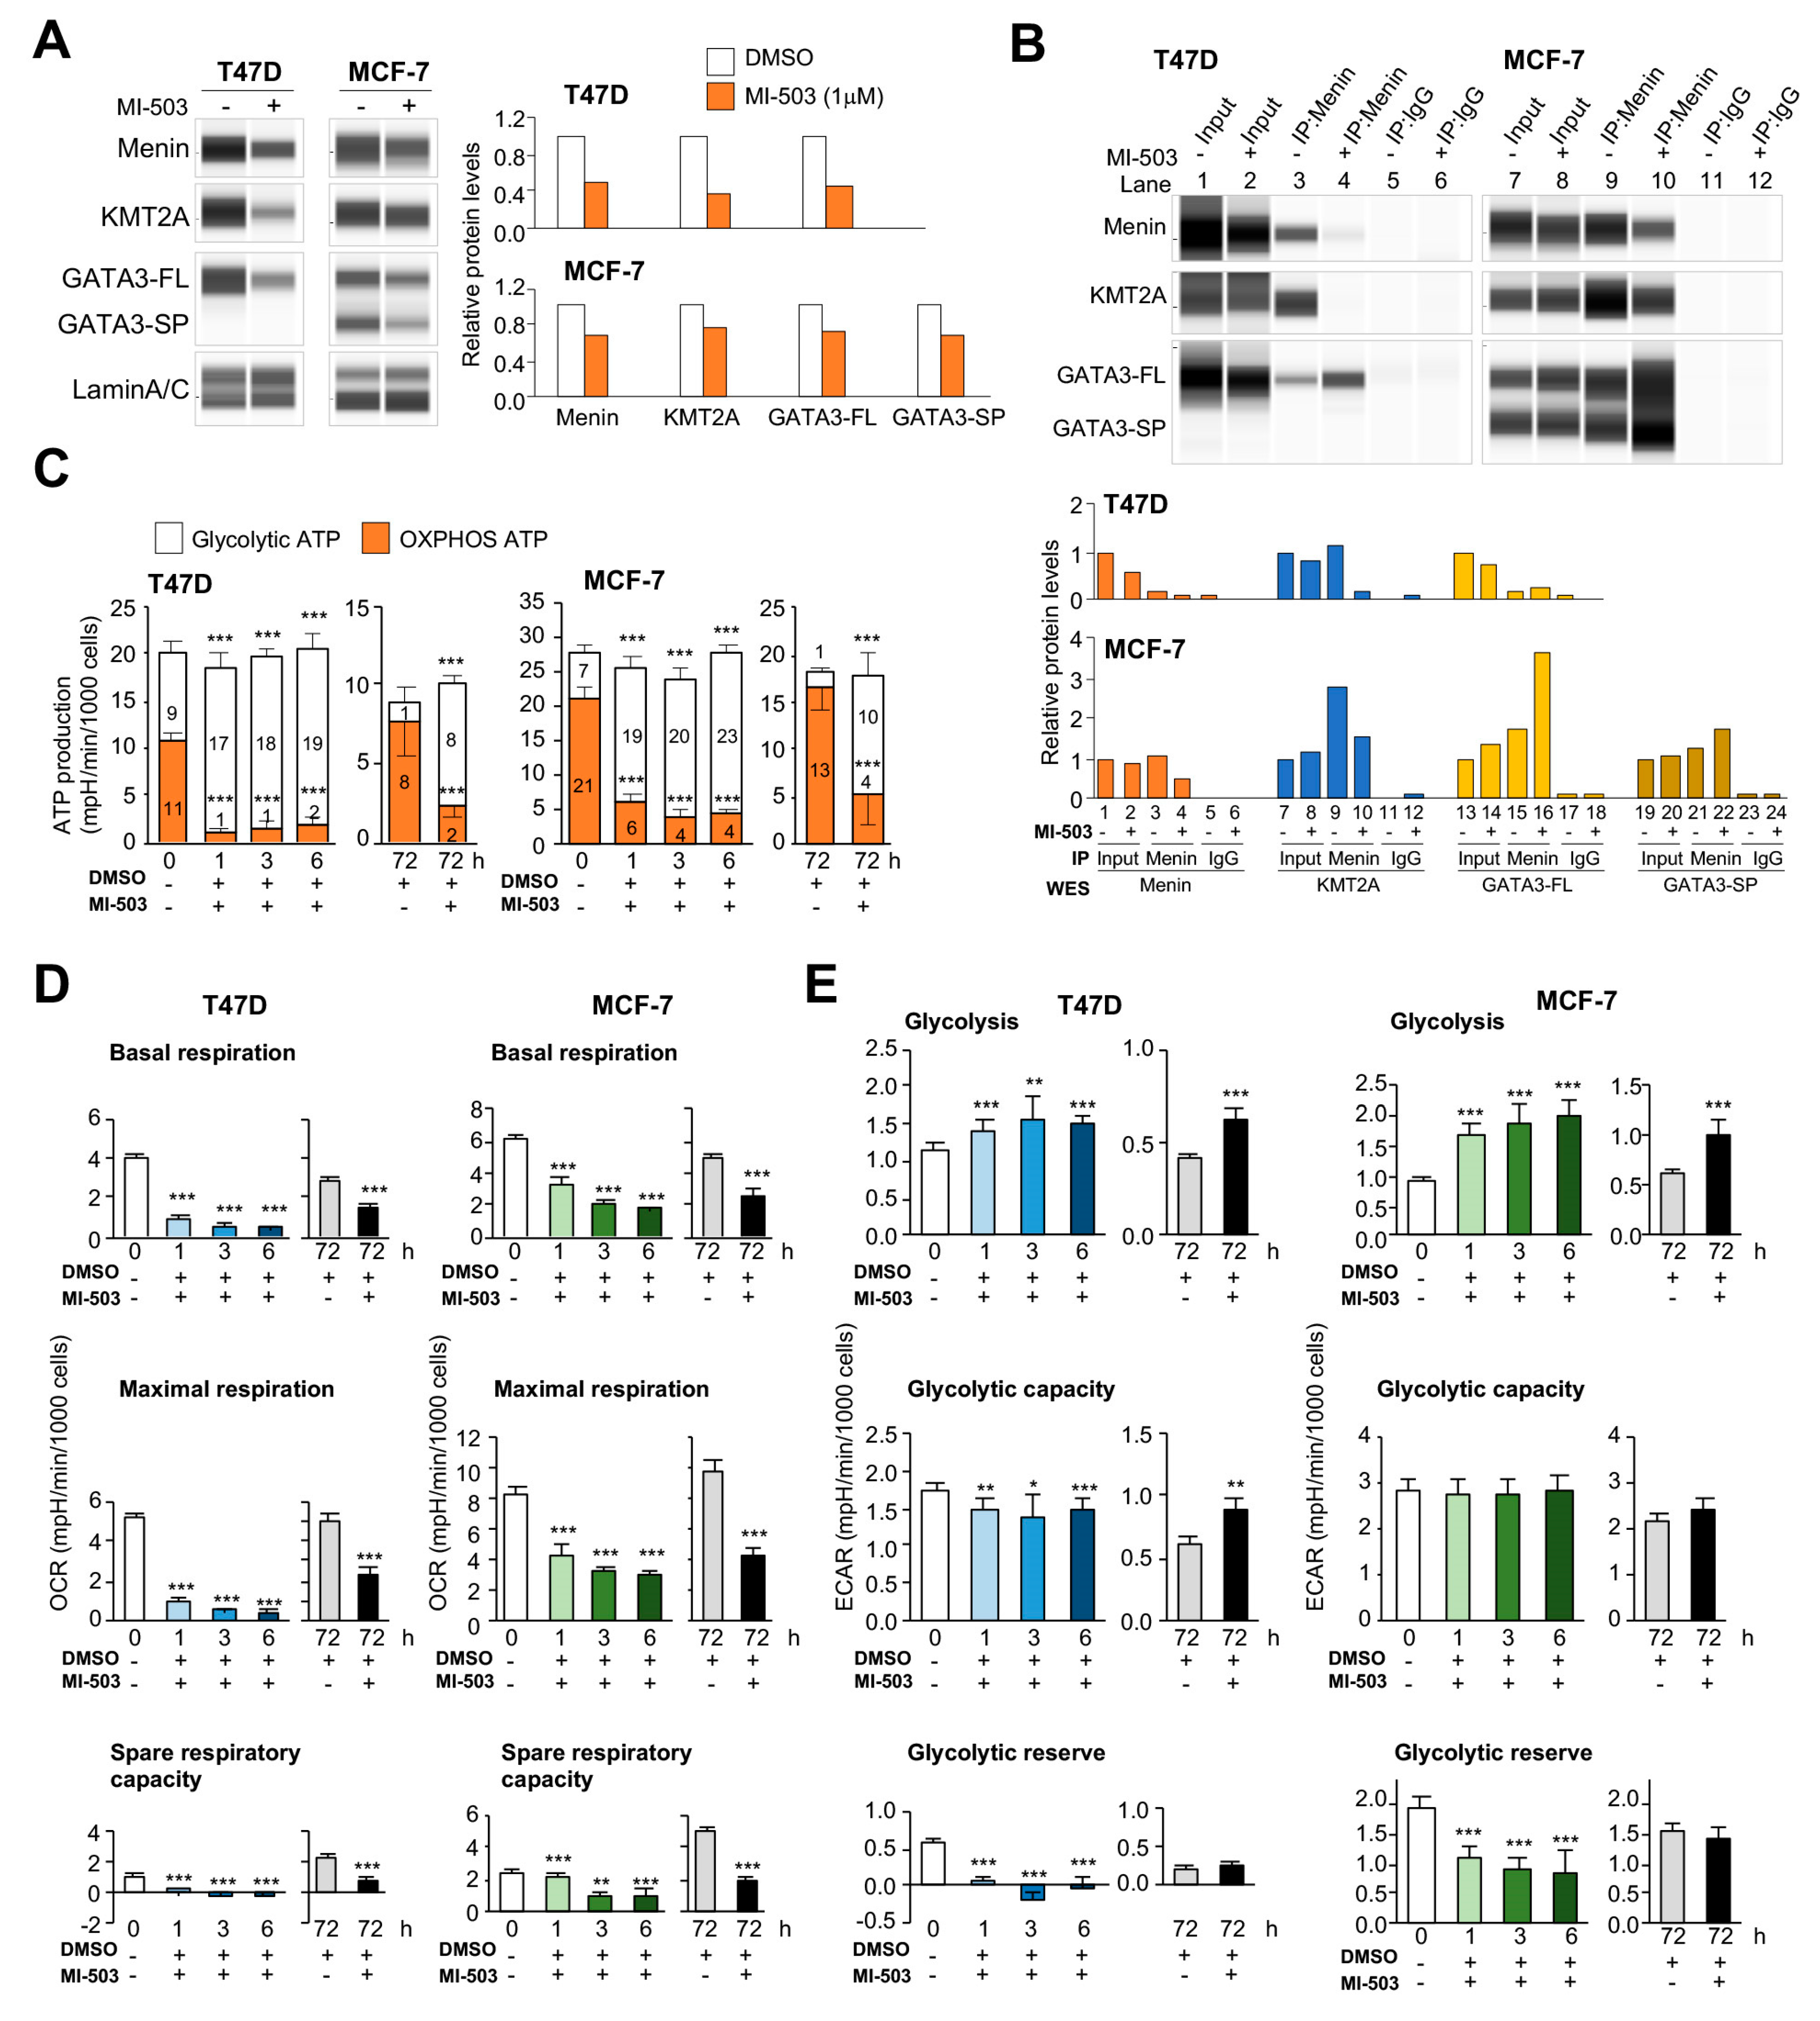
2.3. Counteracting Roles of MAPs in Menin-Modulated OXPHOS and Glycolysis
2.4. Essential Interactions between Menin and KMT2A for OXPHOS Functions
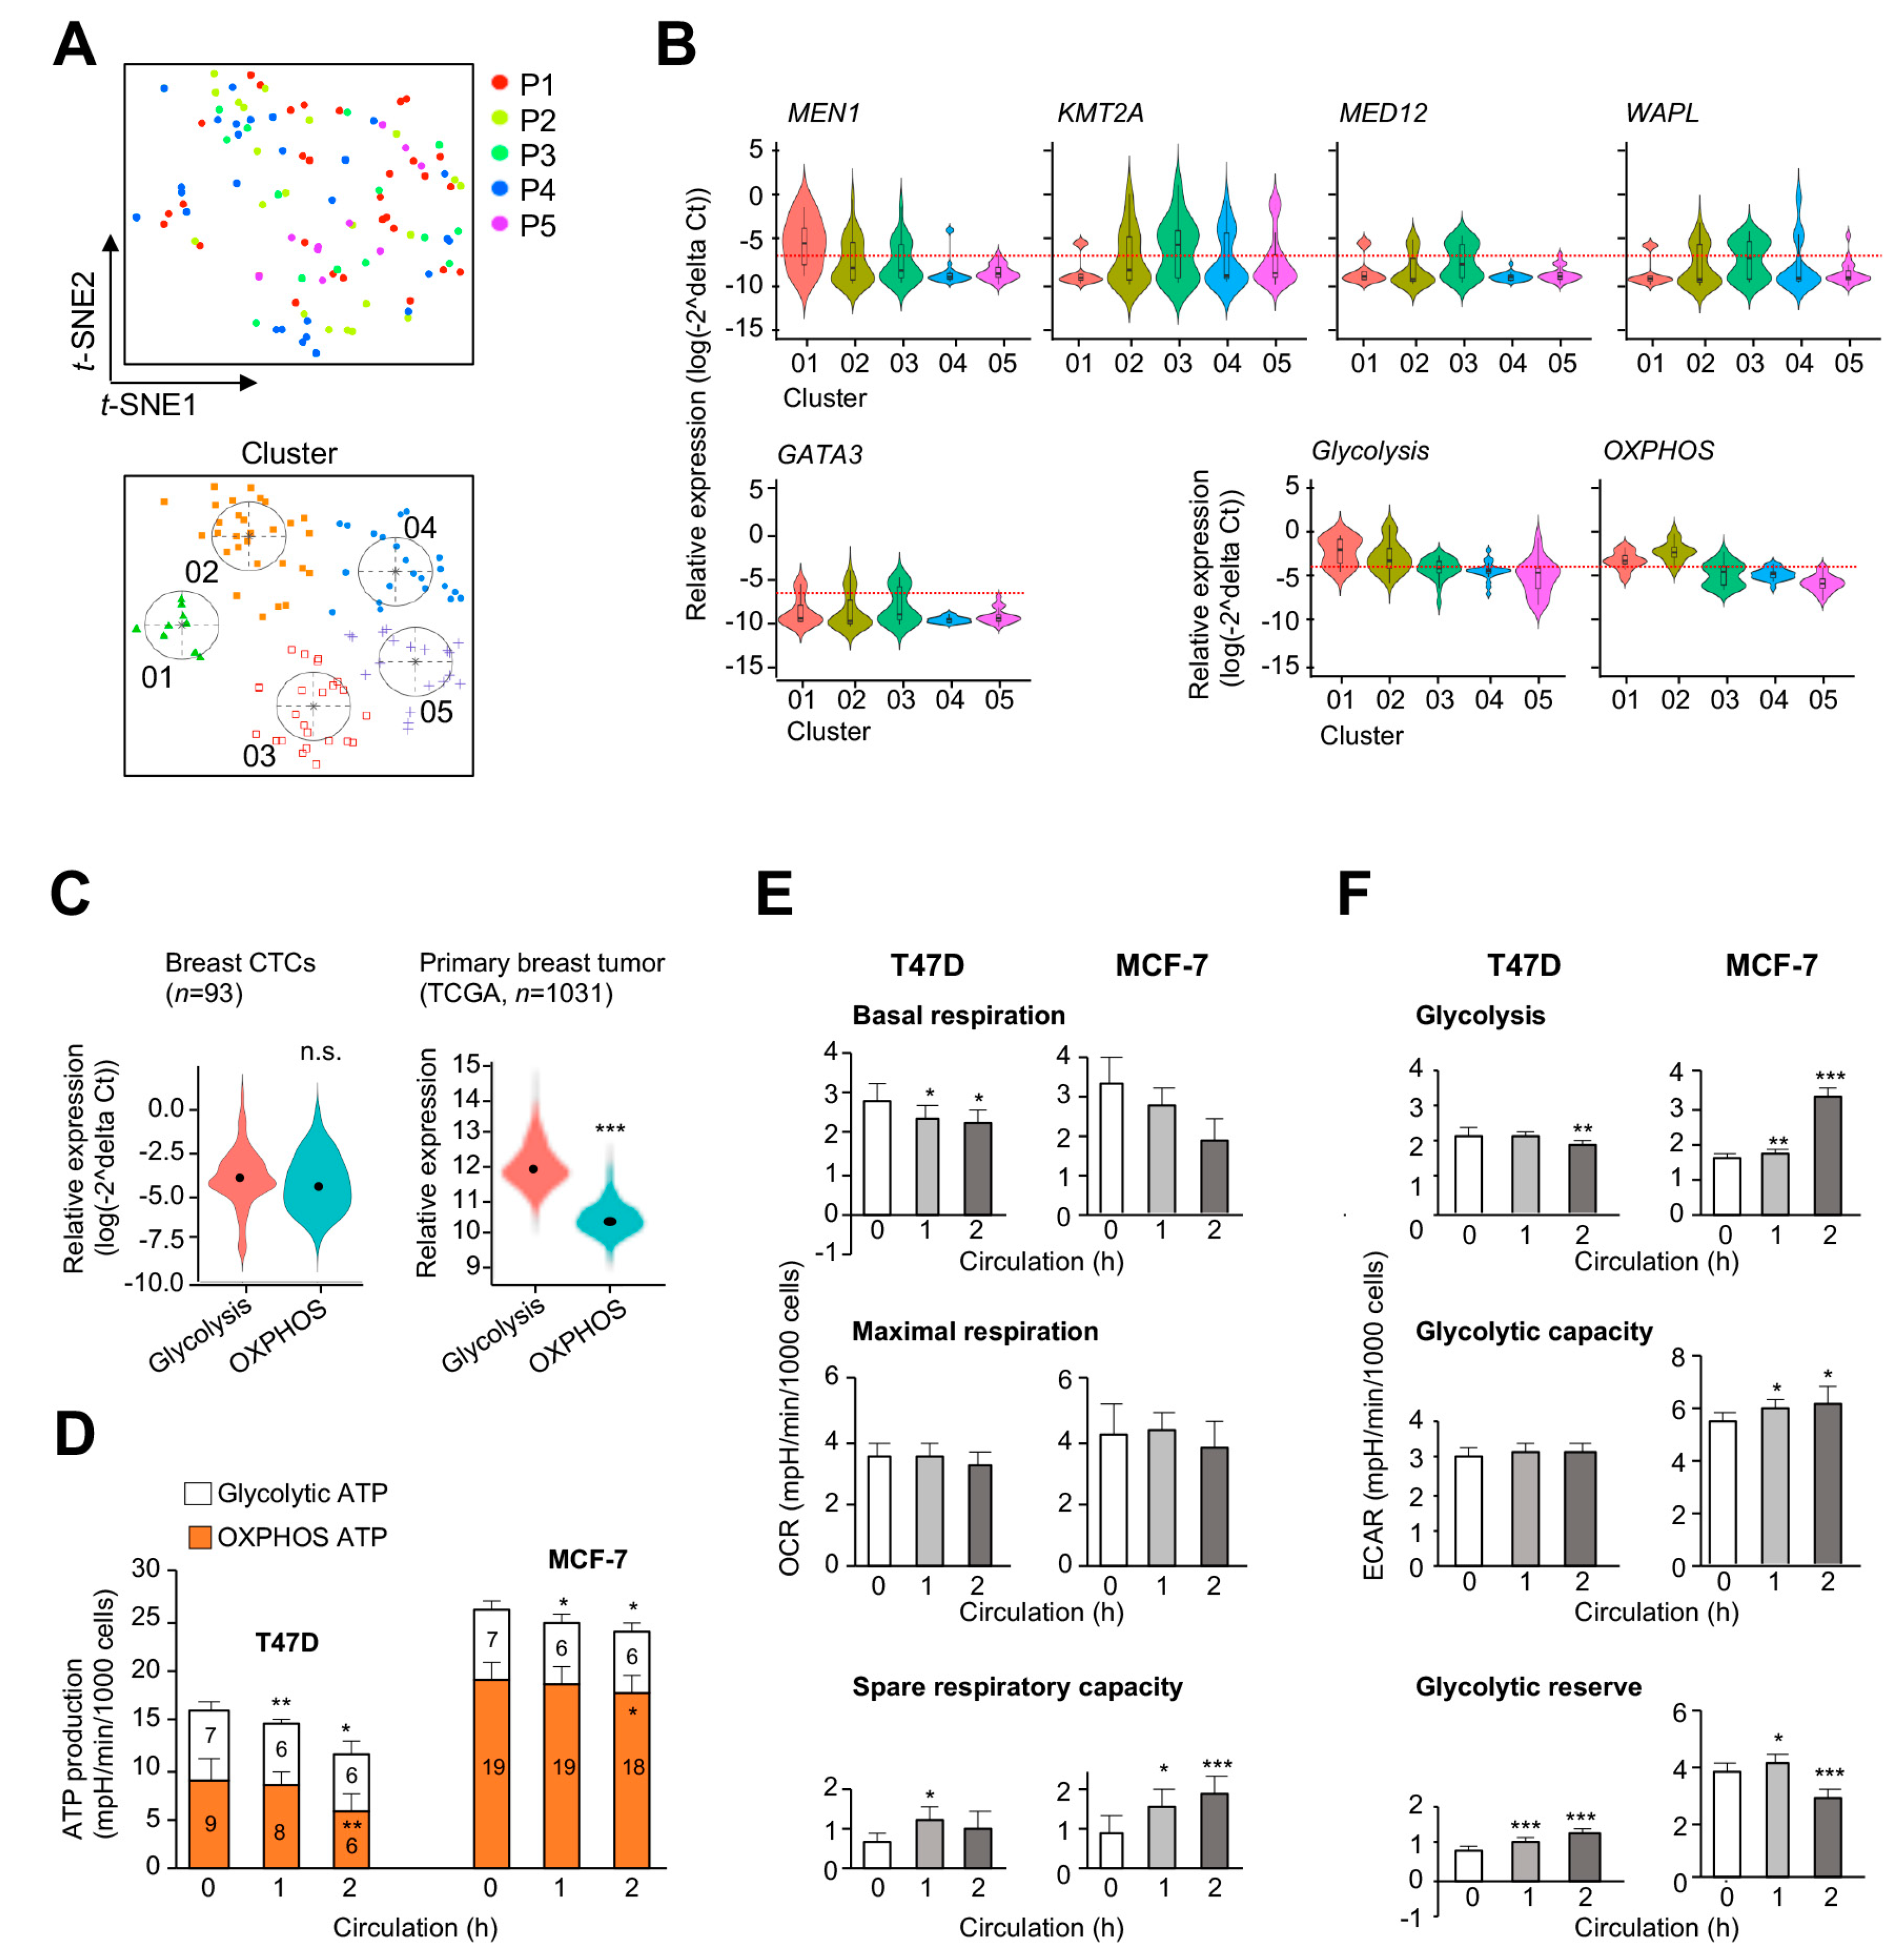
2.5. Upregulation of MEN1, OXPHOS, and Glycolytic Genes in Circulating Tumor Cells
3. Discussion
4. Materials and Methods
4.1. Cell Cultures, shRNA Knockdown, and MI-503 Treatment
4.2. RNA-seq and Quantitative Reverse Transcription PCR (RT-qPCR)
4.3. Proximity-Dependent Biotin Identification (BioID) Assay
4.4. WES and Immunoprecipitation Assays
4.5. Seahorse Assays
4.6. Circulating Tumor Cells (CTCs) Isolation and Culture
4.7. Immunofluorescence Analysis
4.8. Single-Cell qRT-PCR
4.9. In Vitro Flow-Based Assay
4.10. Cell Viability Assay
4.11. In Silico Analysis
4.12. Data Availability
5. Conclusions
Supplementary Materials
Author Contributions
Funding
Acknowledgments
Conflicts of Interest
References
- Matkar, S.; Thiel, A.; Hua, X. Menin: A scaffold protein that controls gene expression and cell signaling. Trends Biochem. Sci. 2013, 38, 394–402. [Google Scholar] [CrossRef] [PubMed] [Green Version]
- Thakker, R.V.; Newey, P.J.; Walls, G.V.; Bilezikian, J.; Dralle, H.; Ebeling, P.R.; Melmed, S.; Sakurai, A.; Tonelli, F.; Brandi, M.L. Clinical practice guidelines for multiple endocrine neoplasia type 1 (MEN1). J. Clin. Endocrinol. Metab. 2012, 97, 2990–3011. [Google Scholar] [CrossRef] [PubMed]
- Qiu, H.; Jin, B.-M.; Wang, Z.-F.; Xu, B.; Zheng, Q.-F.; Zhang, L.; Zhu, L.-Y.; Shi, S.; Yuan, J.-B.; Lin, X.; et al. MEN1 deficiency leads to neuroendocrine differentiation of lung cancer and disrupts the DNA damage response. Nat. Commun. 2020, 11, 1–12. [Google Scholar] [CrossRef] [PubMed] [Green Version]
- Dreijerink, K.M.; Goudet, P.; Burgess, J.; Valk, G.D. International Breast Cancer in MEN1 Study Group Breast-cancer predisposition in multiple endocrine neoplasia type. N. Engl. J. Med. 2014, 371, 583–584. [Google Scholar]
- Pantaleo, M.A.; Urbini, M.; Indio, V.; Ravegnini, G.; Nannini, M.; De Luca, M.; Tarantino, G.; Angelini, S.; Gronchi, A.; Vincenzi, B.; et al. Genome-wide analysis identifies MEN1 and MAX mutations and a neuroendocrine-like oolecular heterogeneity in quadruple WT GIST. Mol. Cancer Res. 2017, 15, 553–562. [Google Scholar] [CrossRef] [PubMed] [Green Version]
- Ehrlich, L.; Hall, C.; Meng, F.; Lairmore, T.; Alpini, G.; Glaser, S. A review of the scaffold protein Menin and its role in hepatobiliary pathology. Gene Expr. 2017, 17, 251–263. [Google Scholar] [CrossRef]
- Yokoyama, A.; Somervaille, T.C.P.; Smith, K.S.; Rozenblatt-Rosen, O.; Meyerson, M.; Cleary, M.L. The Menin tumor suppressor protein is an essential oncogenic cofactor for MLL-associated leukemogenesis. Cell 2005, 123, 207–218. [Google Scholar] [CrossRef]
- Wu, G.; Yuan, M.; Shen, S.; Ma, X.; Fang, J.; Zhu, L.; Sun, L.; Liu, Z.; He, X.; Huang, D.; et al. Menin enhances c-Myc-mediated transcription to promote cancer progression. Nat. Commun. 2017, 8, 15278. [Google Scholar] [CrossRef]
- Kaji, H.; Canaff, L.; Lebrun, J.-J.; Goltzman, D.; Hendy, G.N. Inactivation of menin, a Smad3-interacting protein, blocks transforming growth factor type signaling. Proc. Natl. Acad. Sci. USA 2001, 98, 3837–3842. [Google Scholar] [CrossRef] [Green Version]
- Dreijerink, K.M.; Groner, A.C.; Vos, E.; Font-Tello, A.; Gu, L.; Chi, D.; Reyes, J.; Cook, J.; Lim, E.; Lin, C.Y.; et al. Enhancer-mediated oncogenic function of the menin tumor suppressor in breast cancer. Cell Rep. 2017, 18, 2359–2372. [Google Scholar] [CrossRef] [Green Version]
- Cao, Y.; Xue, Y.; Xue, L.; Jiang, X.; Wang, X.; Zhang, Z.; Yang, J.; Lu, J.; Zhang, C.; Wang, W.; et al. Hepatic menin recruits SIRT1 to control liver steatosis through histone deacetylation. J. Hepatol. 2013, 59, 1299–1306. [Google Scholar] [CrossRef]
- Malik, R.; Khan, A.P.; Asangani, I.A.; Cieślik, M.; Prensner, J.R.; Wang, X.; Iyer, M.K.; Jiang, X.; Borkin, D.; Escara-Wilke, J.; et al. Targeting the MLL complex in castration-resistant prostate cancer. Nat. Med. 2015, 21, 344–352. [Google Scholar] [CrossRef] [PubMed]
- Dreijerink, K.M.; Timmers, H.T.M.; Brown, M.; Timmers, M. Twenty years of menin: Emerging opportunities for restoration of transcriptional regulation in MEN. Endocr.-Relat. Cancer 2017, 24, T135–T145. [Google Scholar] [CrossRef] [PubMed] [Green Version]
- Huang, J.; Gurung, B.; Wan, B.; Matkar, S.; Veniaminova, N.A.; Wan, K.; Merchant, J.L.; Hua, X.; Lei, M. The same pocket in menin binds both MLL and JUND but has opposite effects on transcription. Nature 2012, 482, 542–546. [Google Scholar] [CrossRef] [PubMed]
- Murai, M.J.; Chruszcz, M.; Reddy, G.; Grembecka, J.; Cierpicki, T. Crystal structure of menin reveals binding site for mixed lineage leukemia (MLL) protein. J. Biol. Chem. 2011, 286, 31742–31748. [Google Scholar] [CrossRef] [Green Version]
- Heppner, C.; Bilimoria, K.Y.; Agarwal, S.; Kester, M.; Whitty, L.J.; Guru, S.C.; Chandrasekharappa, S.C.; Collins, F.S.; Spiegel, A.M.; Marx, S.J.; et al. The tumor suppressor protein menin interacts with NF-κB proteins and inhibits NF-κB-mediated transactivation. Oncogene 2001, 20, 4917–4925. [Google Scholar] [CrossRef] [Green Version]
- Cao, Y.; Liu, R.; Jiang, X.; Lu, J.; Jiang, J.; Zhang, C.; Li, X.; Ning, G. Nuclear-cytoplasmic shuttling of menin regulates nuclear translocation of β-Catenin. Mol. Cell. Biol. 2009, 29, 5477–5487. [Google Scholar] [CrossRef] [Green Version]
- Dreijerink, K.M.; Mulder, K.W.; Winkler, G.S.; Höppener, J.W.; Lips, C.J.; Timmers, H.T.M. Menin Links Estrogen Receptor Activation to Histone H3K4 Trimethylation. Cancer Res. 2006, 66, 4929–4935. [Google Scholar] [CrossRef] [Green Version]
- Varnaitė, R.; MacNeill, S.A.; Kalvodova, L. Inside Front Cover: Meet the neighbors: Mapping local protein interactomes by proximity-dependent labeling with BioID. Proteomics 2016, 16, 2503–2518. [Google Scholar] [CrossRef] [Green Version]
- Zhu, J.; Thompson, C.B. Metabolic regulation of cell growth and proliferation. Nat. Rev. Mol. Cell Biol. 2019, 20, 436–450. [Google Scholar] [CrossRef]
- Zhu, C.; Li, L.; Zhang, Z.; Bi, M.; Wang, H.; Su, W.; Hernandez, K.; Liu, P.; Chen, J.; Chen, M.; et al. A Non-canonical role of YAP/TEAD is required for activation of Estrogen-regulated enhancers in breast cancer. Mol. Cell 2019, 75, 791–806.e8. [Google Scholar] [CrossRef]
- Divakaruni, A.S.; Paradyse, A.; Ferrick, D.A.; Murphy, A.N.; Jastroch, M. Analysis and interpretation of microplate-based oxygen consumption and pH data. Gen. Methods Enzymol. 2014, 547, 309–354. [Google Scholar]
- Borkin, D.; He, S.; Miao, H.; Kempińska, K.; Pollock, J.; Chase, J.; Purohit, T.; Malik, B.; Zhao, T.; Wang, J.; et al. Pharmacologic inhibition of the Menin-MLL interaction blocks progression of MLL leukemia in vivo. Cancer Cell 2015, 27, 589–602. [Google Scholar] [CrossRef] [Green Version]
- Hackett, S.R.; Zanotelli, V.R.T.; Xu, W.; Goya, J.; O Park, J.; Perlman, D.H.; Gibney, P.A.; Botstein, D.; Storey, J.D.; Rabinowitz, J.D. Systems-level analysis of mechanisms regulating yeast metabolic flux. Science 2016, 354, aaf2786. [Google Scholar] [CrossRef] [Green Version]
- Berenguer, M.; Zhang, J.; Bruce, M.C.; Martinez, L.; González, T.; Gurtovenko, A.A.; Xu, T.; Le Marchand-Brustel, Y.; Govers, R. Dimethyl sulfoxide enhances GLUT4 translocation through a reduction in GLUT4 endocytosis in insulin-stimulated 3T3-L1 adipocytes. Biochimie 2011, 93, 697–709. [Google Scholar] [CrossRef] [PubMed]
- Chen, C.-L.; Mahalingam, D.; Osmulski, P.; Jadhav, R.R.; Wang, C.-M.; Leach, R.J.; Chang, T.-C.; Weitman, S.D.; Kumar, A.P.; Sun, L.; et al. Single-cell analysis of circulating tumor cells identifies cumulative expression patterns of EMT-related genes in metastatic prostate cancer. Prostate 2012, 73, 813–826. [Google Scholar] [CrossRef] [PubMed] [Green Version]
- Strati, A.; Nikolaou, M.; Georgoulias, V.; Lianidou, E.S. Prognostic significance of TWIST1, CD24, CD44, and ALDH1 transcript quantification in EpCAM-positive circulating tumor cells from early stage breast cancer patients. Cells 2019, 8, 652. [Google Scholar] [CrossRef] [Green Version]
- Papadaki, M.A.; Stoupis, G.; Theodoropoulos, P.A.; Mavroudis, D.; Georgoulias, V.; Agelaki, S. Circulating tumor cells with stemness and epithelial-to-mesenchymal transition features are chemoresistant and predictive of poor outcome in metastatic breast cancer. Mol. Cancer Ther. 2018, 18, 437–447. [Google Scholar] [CrossRef] [Green Version]
- Liberti, M.V.; Locasale, J.W. The Warburg Effect: How Does it Benefit Cancer Cells? Trends Biochem. Sci. 2016, 41, 211–218. [Google Scholar] [CrossRef] [Green Version]
- LeBleu, V.S.; O’Connell, J.T.; Herrera, K.N.G.; Wikman, H.; Pantel, K.; Haigis, M.C.; De Carvalho, F.M.; Damascena, A.; Chinen, L.T.D.; Rocha, R.M.; et al. PGC-1α mediates mitochondrial biogenesis and oxidative phosphorylation in cancer cells to promote metastasis. Nat. Cell Biol. 2014, 16, 992–1003. [Google Scholar] [CrossRef] [Green Version]
- Hampel, U.; Garreis, F.; Burgemeister, F.; Eßel, N.; Paulsen, F.P. Effect of intermittent shear stress on corneal epithelial cells using an in vitro flow culture model. Ocul. Surf. 2018, 16, 341–351. [Google Scholar] [CrossRef]
- Yu, L.; Lu, M.; Jia, D.; Ma, J.; Ben-Jacob, E.; Levine, H.; Kaipparettu, B.A.; Onuchic, J.N. Modeling the genetic regulation of cancer metabolism: Interplay between glycolysis and oxidative phosphorylation. Cancer Res. 2017, 77, 1564–1574. [Google Scholar] [CrossRef] [Green Version]
- Van Waveren, C.; Moraes, C.T. Transcriptional co-expression and co-regulation of genes coding for components of the oxidative phosphorylation system. BMC Genom. 2008, 9, 18. [Google Scholar] [CrossRef] [Green Version]
- Jia, D.; Lu, M.; Jung, K.H.; Park, J.H.; Yu, L.; Onuchic, J.N.; Kaipparettu, B.A.; Levine, H. Elucidating cancer metabolic plasticity by coupling gene regulation with metabolic pathways. Proc. Natl. Acad. Sci. USA 2019, 116, 3909–3918. [Google Scholar] [CrossRef] [Green Version]
- Hüttemann, M.; Lee, I.; Samavati, L.; Yu, H.; Doan, J.W. Regulation of mitochondrial oxidative phosphorylation through cell signaling. Biochim. Biophys. Acta Bioenerg. 2007, 1773, 1701–1720. [Google Scholar] [CrossRef] [Green Version]
- Garbian, Y.; Ovadia, O.; Dadon, S.; Mishmar, D. Gene expression patterns of oxidative phosphorylation complex I subunits are organized in clusters. PLoS ONE 2010, 5, e9985. [Google Scholar] [CrossRef] [Green Version]
- Suzuki, N.; Gradin, K.; Poellinger, L.; Yamamoto, M. Regulation of hypoxia-inducible gene expression after HIF activation. Exp. Cell Res. 2017, 356, 182–186. [Google Scholar] [CrossRef]
- Quirós, P.M.; Mottis, A.; Auwerx, J. Mitonuclear communication in homeostasis and stress. Nat. Rev. Mol. Cell Biol. 2016, 17, 213–226. [Google Scholar] [CrossRef]
- Li, L.; Liang, Y.; Kang, L.; Liu, Y.; Gao, S.; Chen, S.; Li, Y.; You, W.; Dong, Q.; Hong, T.; et al. Transcriptional regulation of the Warburg effect in cancer by SIX. Cancer Cell 2018, 33, 368–385. [Google Scholar] [CrossRef] [Green Version]
- Krivtsov, A.V.; Armstrong, S.A. MLL translocations, histone modifications and leukaemia stem-cell development. Nat. Rev. Cancer 2007, 7, 823–833. [Google Scholar] [CrossRef]
- Ballabio, E.; Milne, T.A. Molecular and epigenetic mechanisms of MLL in human leukemogenesis. Cancers 2012, 4, 904–944. [Google Scholar] [CrossRef] [Green Version]
- Bochyńska, A.; Lüscher-Firzlaff, J.; Lüscher, B. Modes of interaction of KMT2 histone H3 lysine 4 methyltransferase/COMPASS complexes with chromatin. Cells 2018, 7, 17. [Google Scholar] [CrossRef] [Green Version]
- Yokoyama, A.; Wang, Z.; Wysocka, J.; Sanyal, M.; Aufiero, D.J.; Kitabayashi, I.; Herr, W.; Cleary, M.L. Leukemia proto-oncoprotein MLL forms a SET1-Like histone methyltransferase complex with Menin to regulate Hox gene expression. Mol. Cell. Biol. 2004, 24, 5639–5649. [Google Scholar] [CrossRef] [Green Version]
- Signes, A.; Fernandez-Vizarra, E. Assembly of mammalian oxidative phosphorylation complexes I–V and supercomplexes. Essays Biochem. 2018, 62, 255–270. [Google Scholar]
- Jin, S.; Mao, H.; Schnepp, R.W.; Sykes, S.M.; Silva, A.C.; D’Andrea, A.; Hua, X. Menin associates with FANCD2, a protein involved in repair of DNA damage. Cancer Res. 2003, 63, 4204–4210. [Google Scholar]
- Feng, Z.; Ma, J.; Hua, X. Epigenetic regulation by the menin pathway. Endocr. Relat. Cancer 2017, 24, T147–T159. [Google Scholar] [CrossRef] [Green Version]
- Saxton, R.A.; Sabatini, D.M. mTOR signaling in growth, metabolism, and disease. Cell 2017, 168, 960–976. [Google Scholar] [CrossRef] [Green Version]
- Davidson, S.M.; Papagiannakopoulos, T.; Olenchock, B.A.; Heyman, J.E.; Keibler, M.A.; Luengo, A.; Bauer, M.R.; Jha, A.K.; O’Brien, J.P.; Pierce, K.A.; et al. Environment impacts the metabolic dependencies of Ras-driven non-small cell lung cancer. Cell Metab. 2016, 23, 517–528. [Google Scholar] [CrossRef]


© 2020 by the authors. Licensee MDPI, Basel, Switzerland. This article is an open access article distributed under the terms and conditions of the Creative Commons Attribution (CC BY) license (http://creativecommons.org/licenses/by/4.0/).
Share and Cite
Chou, C.-W.; Tan, X.; Hung, C.-N.; Lieberman, B.; Chen, M.; Kusi, M.; Mitsuya, K.; Lin, C.-L.; Morita, M.; Liu, Z.; et al. Menin and Menin-Associated Proteins Coregulate Cancer Energy Metabolism. Cancers 2020, 12, 2715. https://0-doi-org.brum.beds.ac.uk/10.3390/cancers12092715
Chou C-W, Tan X, Hung C-N, Lieberman B, Chen M, Kusi M, Mitsuya K, Lin C-L, Morita M, Liu Z, et al. Menin and Menin-Associated Proteins Coregulate Cancer Energy Metabolism. Cancers. 2020; 12(9):2715. https://0-doi-org.brum.beds.ac.uk/10.3390/cancers12092715
Chicago/Turabian StyleChou, Chih-Wei, Xi Tan, Chia-Nung Hung, Brandon Lieberman, Meizhen Chen, Meena Kusi, Kohzoh Mitsuya, Chun-Lin Lin, Masahiro Morita, Zhijie Liu, and et al. 2020. "Menin and Menin-Associated Proteins Coregulate Cancer Energy Metabolism" Cancers 12, no. 9: 2715. https://0-doi-org.brum.beds.ac.uk/10.3390/cancers12092715