EGR1/GADD45α Activation by ROS of Non-Thermal Plasma Mediates Cell Death in Thyroid Carcinoma

 ,
,  , and
, and 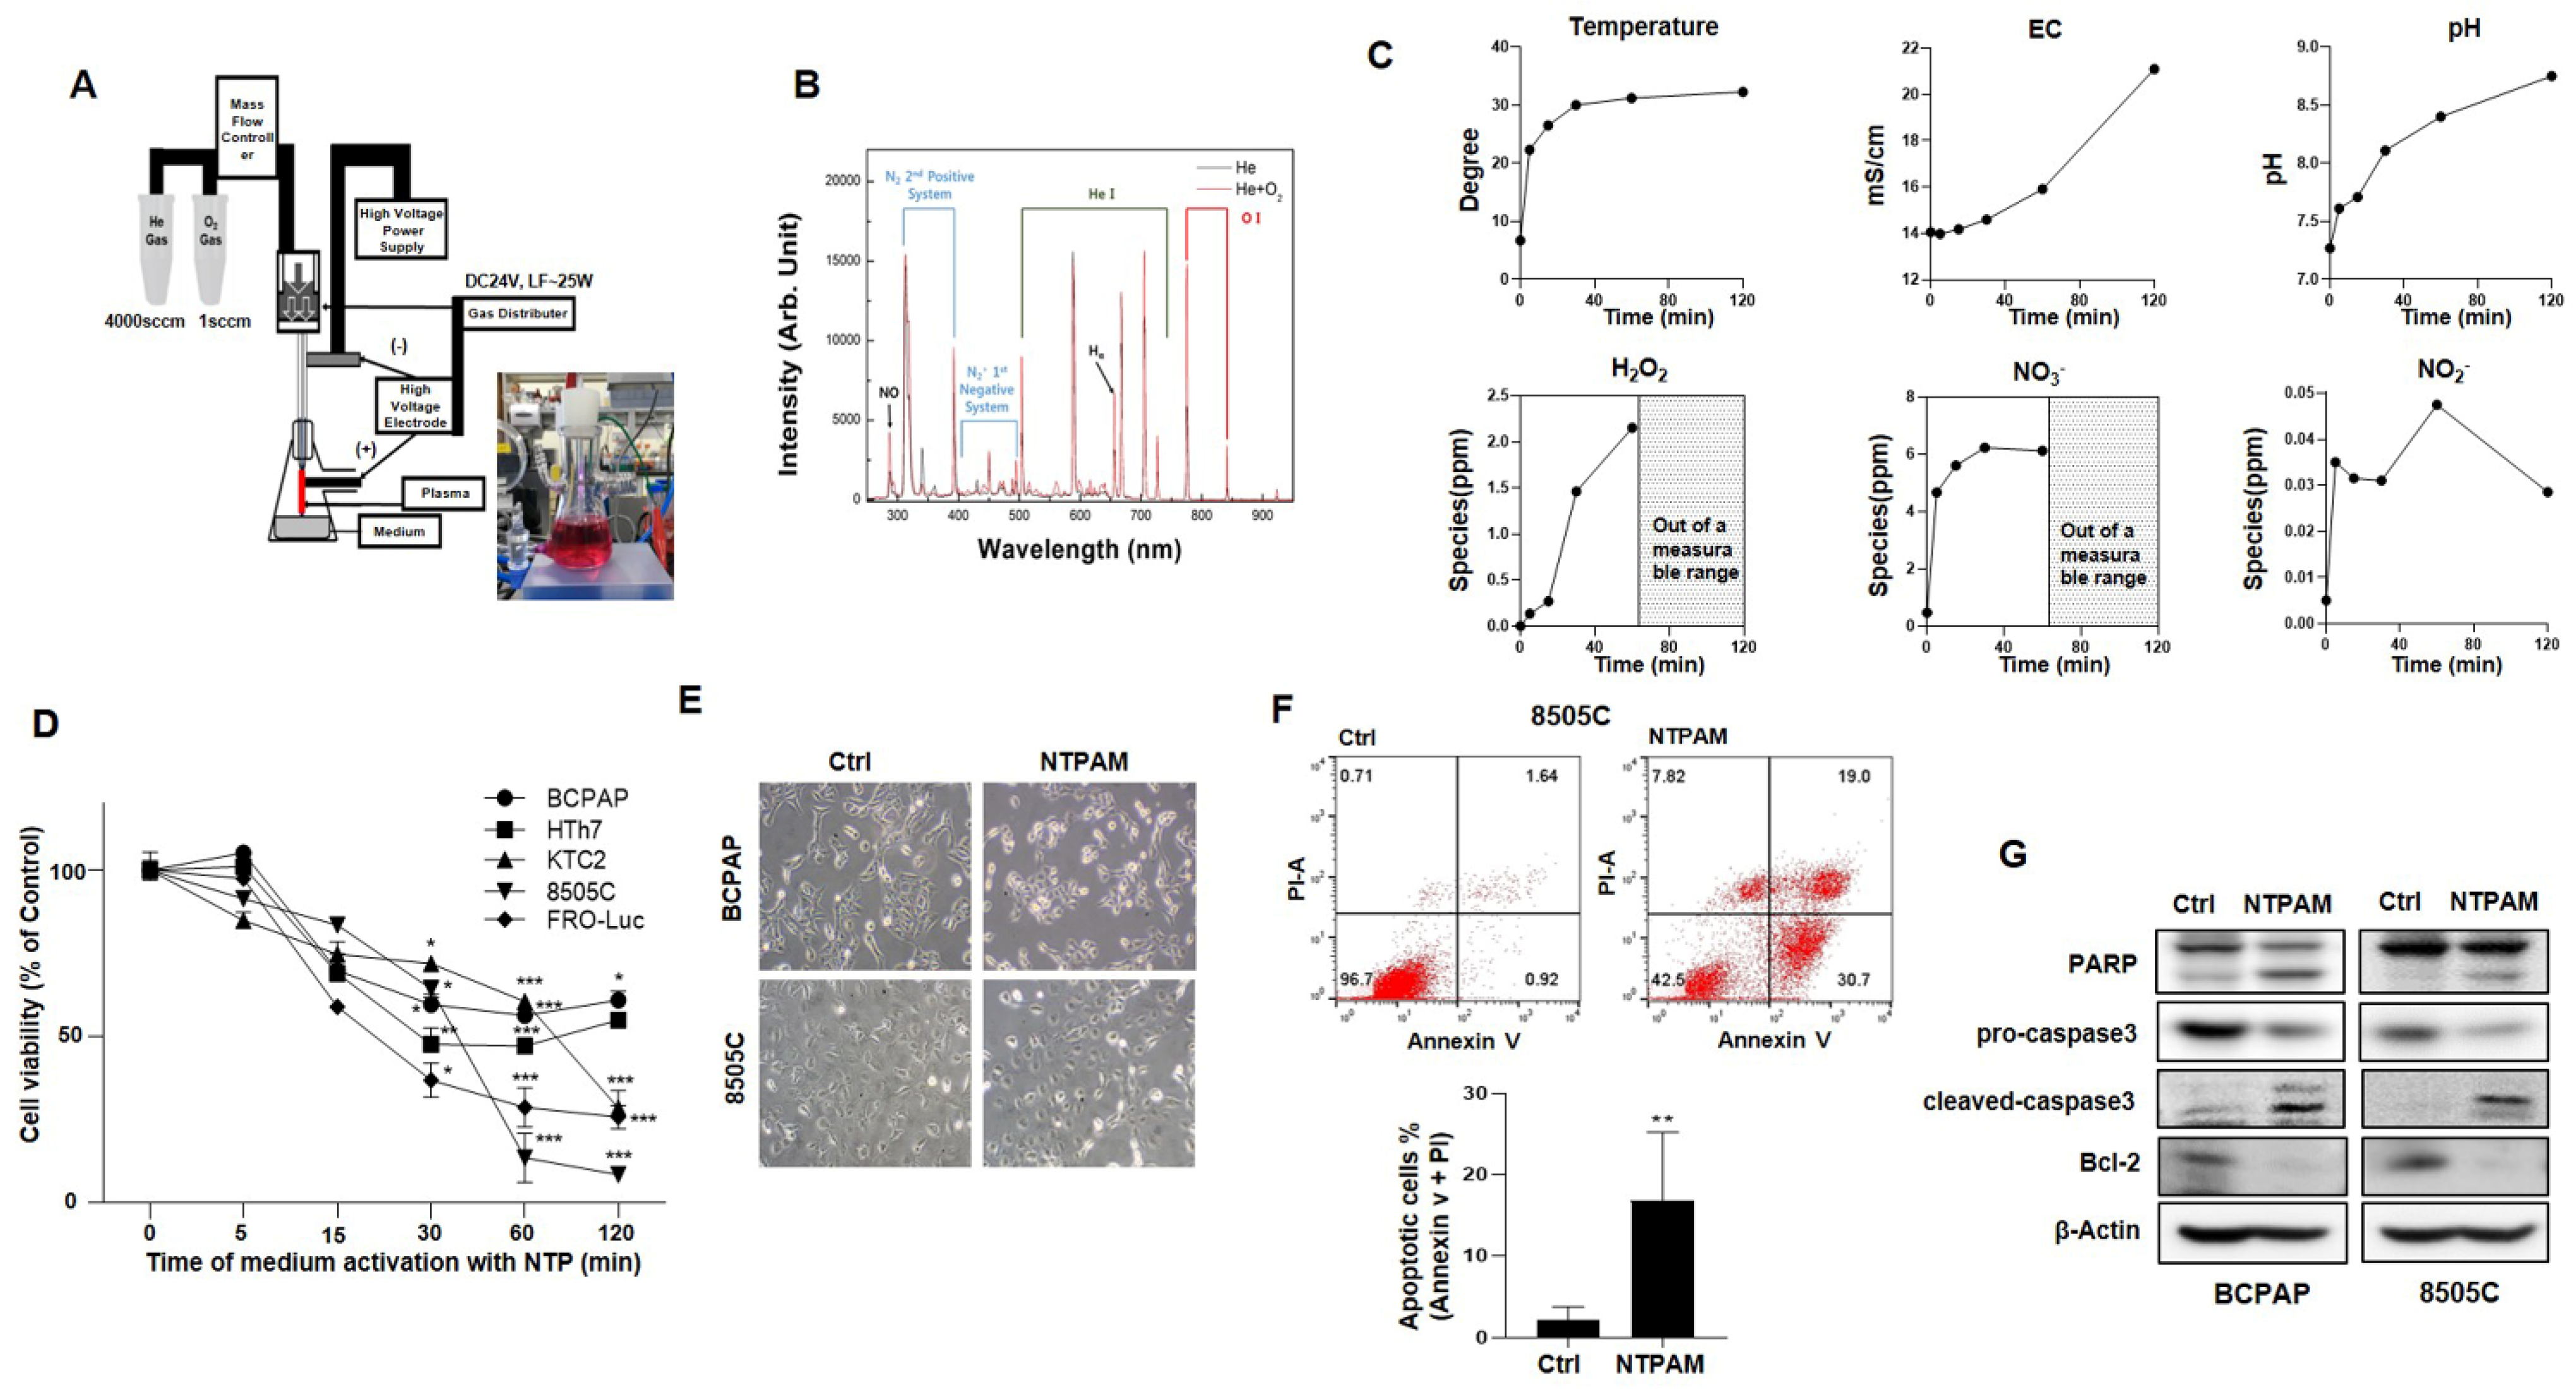
Abstract
:Simple Summary
Abstract
1. Introduction
2. Results
2.1. NTPAM Induces Apoptotic Cell Death in THCA Cells
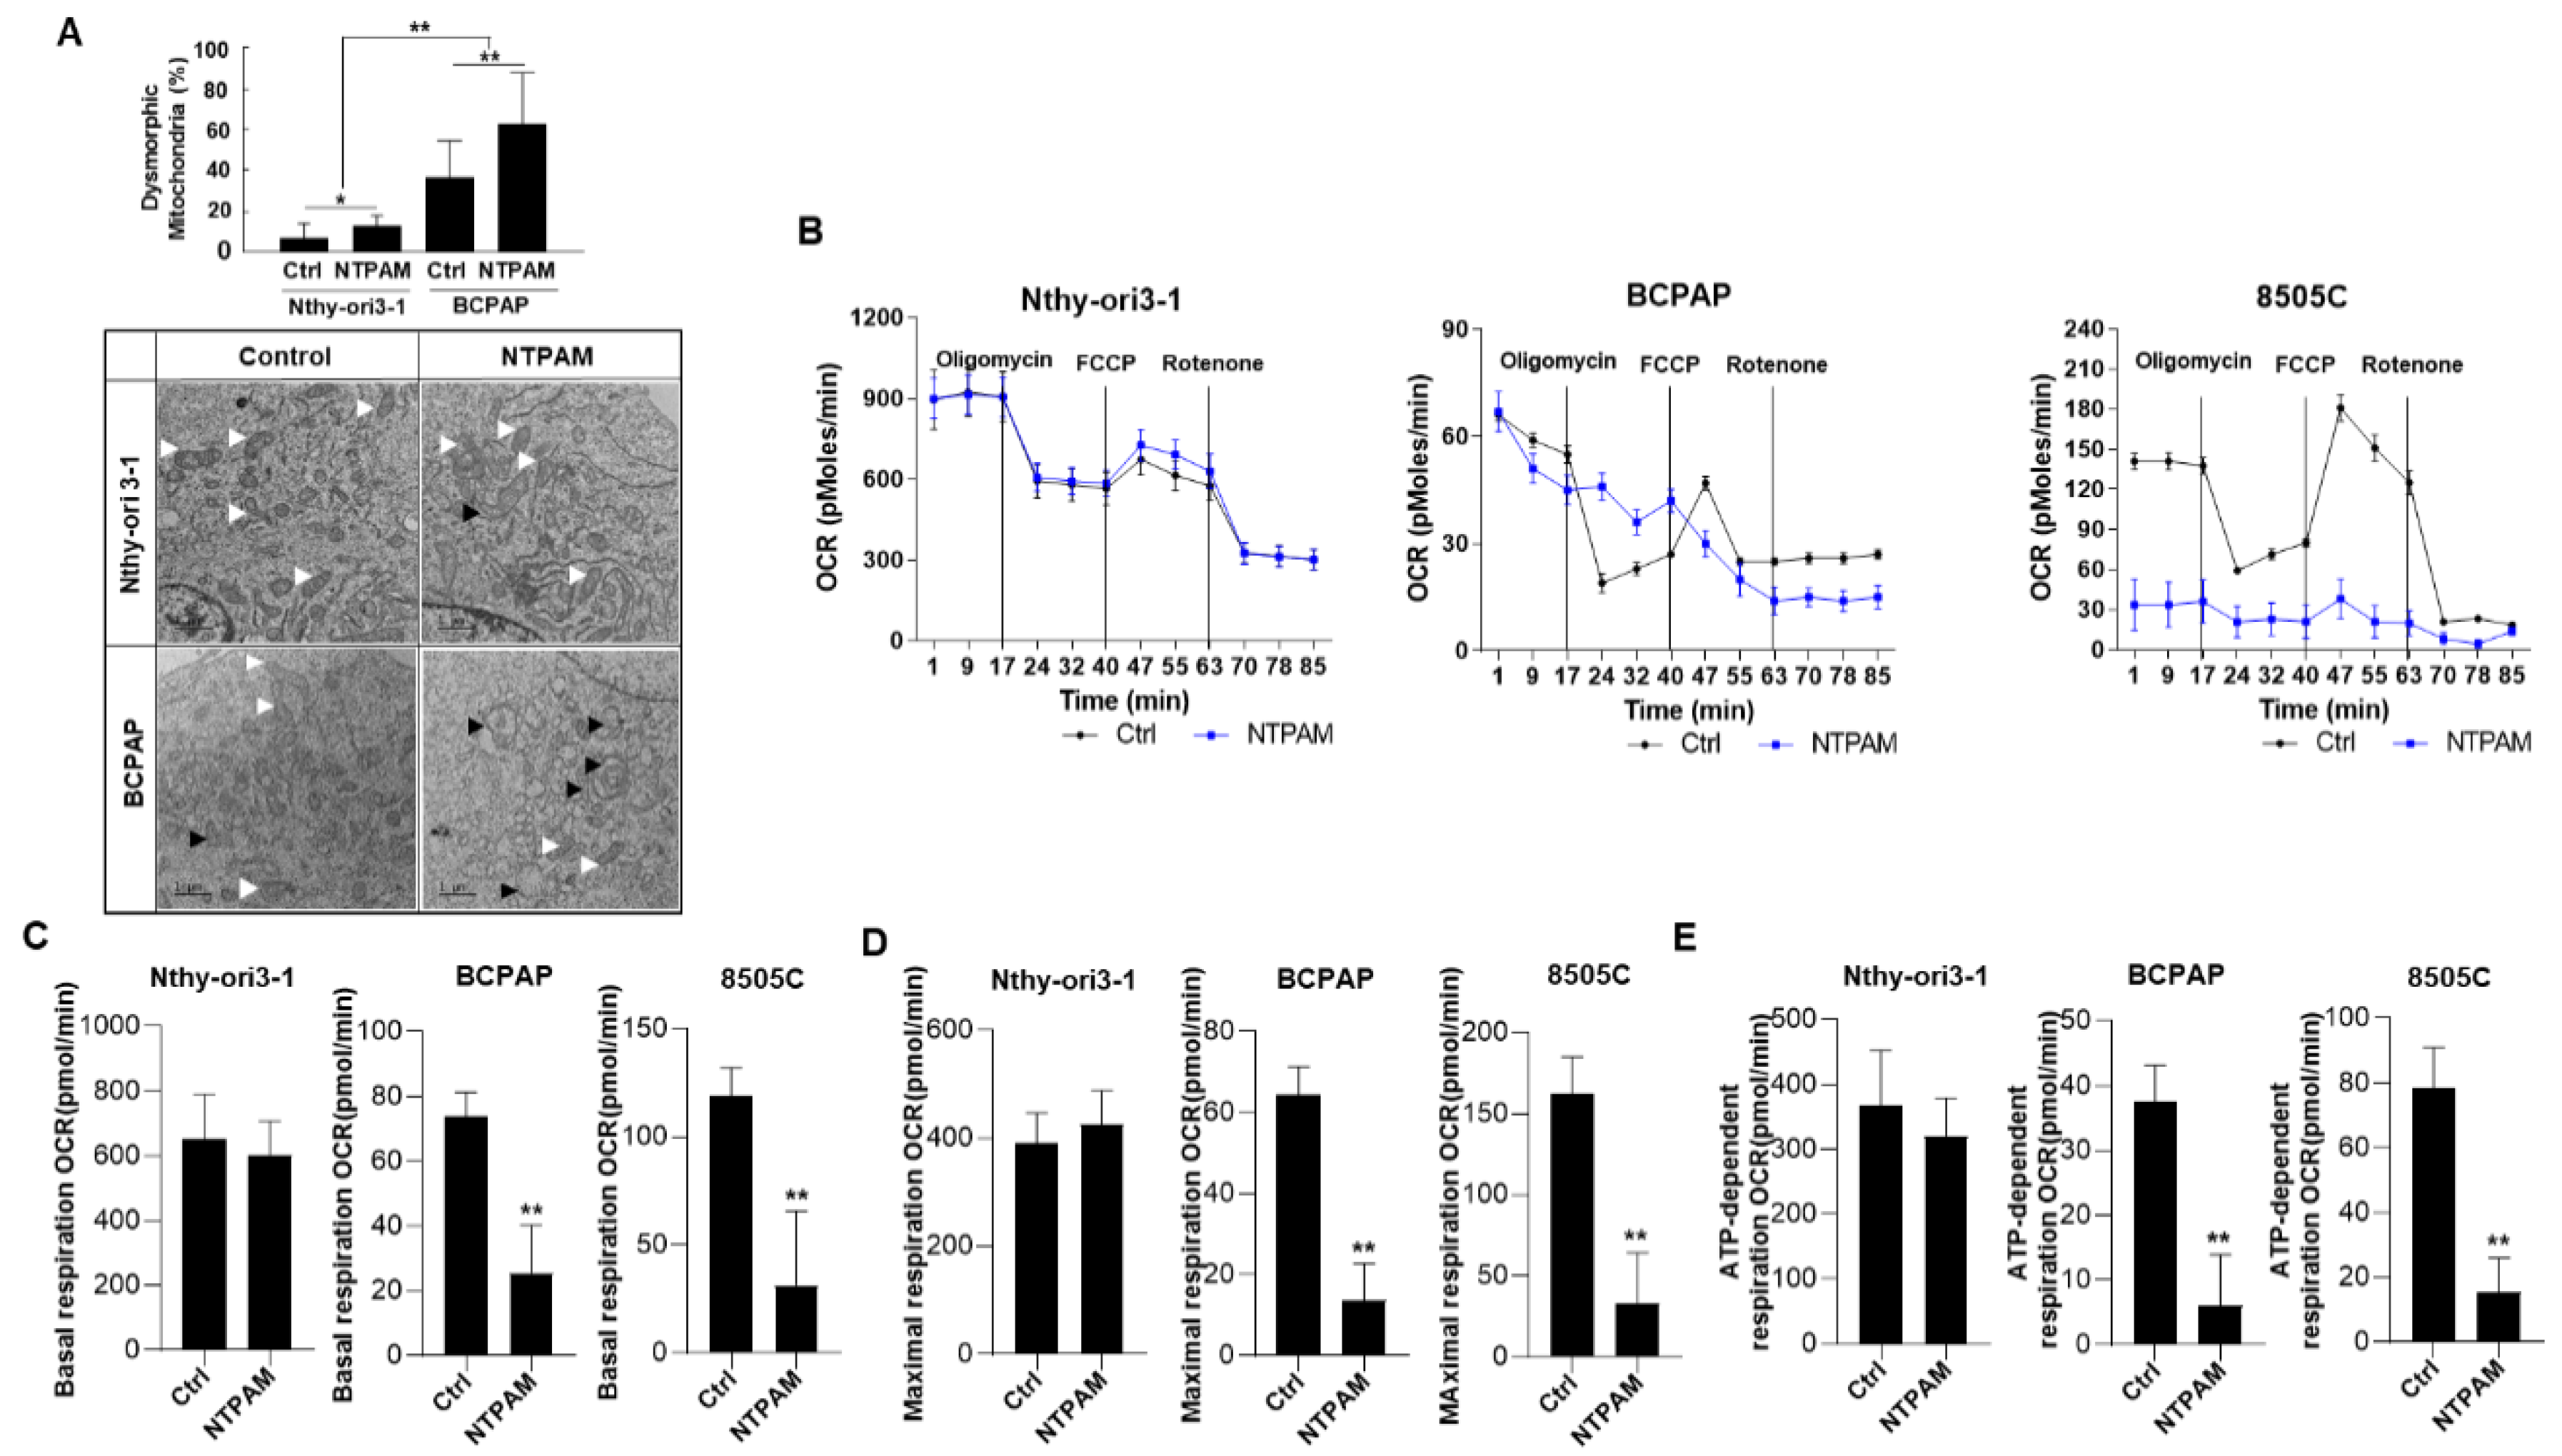
2.2. NTPAM Induces Mitochondrial Dysfunction in THCA Cells
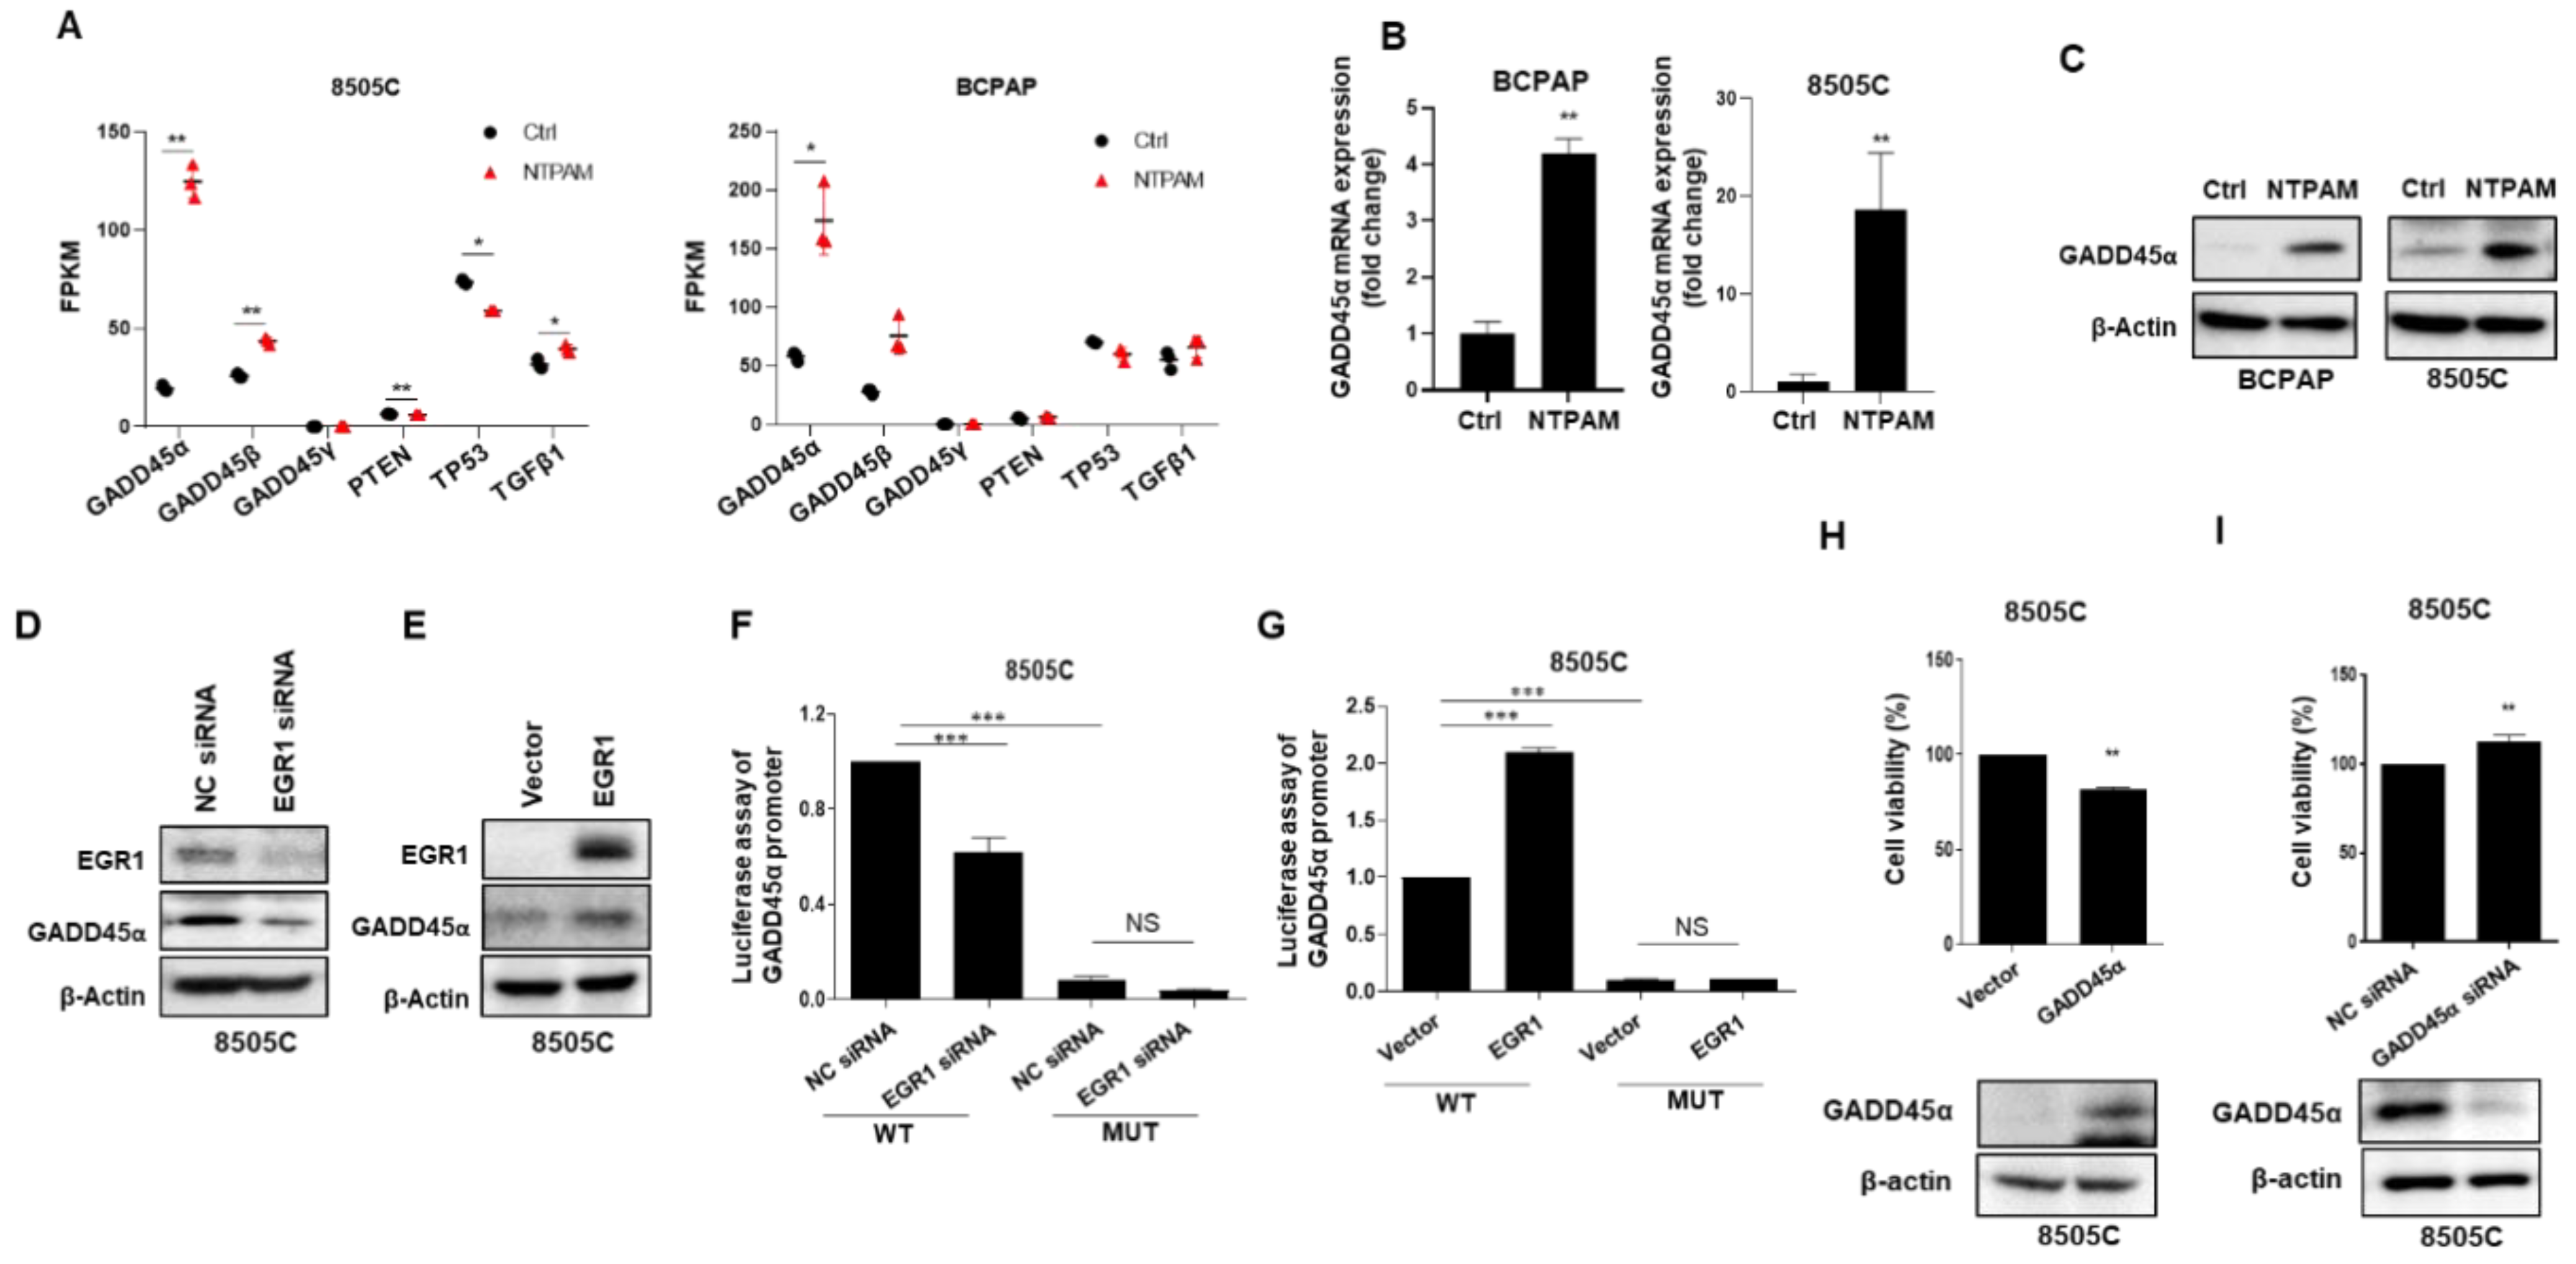
2.3. EGR1 Is a Regulator of Thyroid Tumorigenesis
2.4. EGR1 Is Activated by NTPAM to Mediate Cell Death in THCA
2.5. EGR1 Promotes NTPAM-Mediated Cell Death through Regulation of ROS
2.6. NTPAM Induces Cell Death through the ROS/EGR1/GADD45α Pathway in THCA
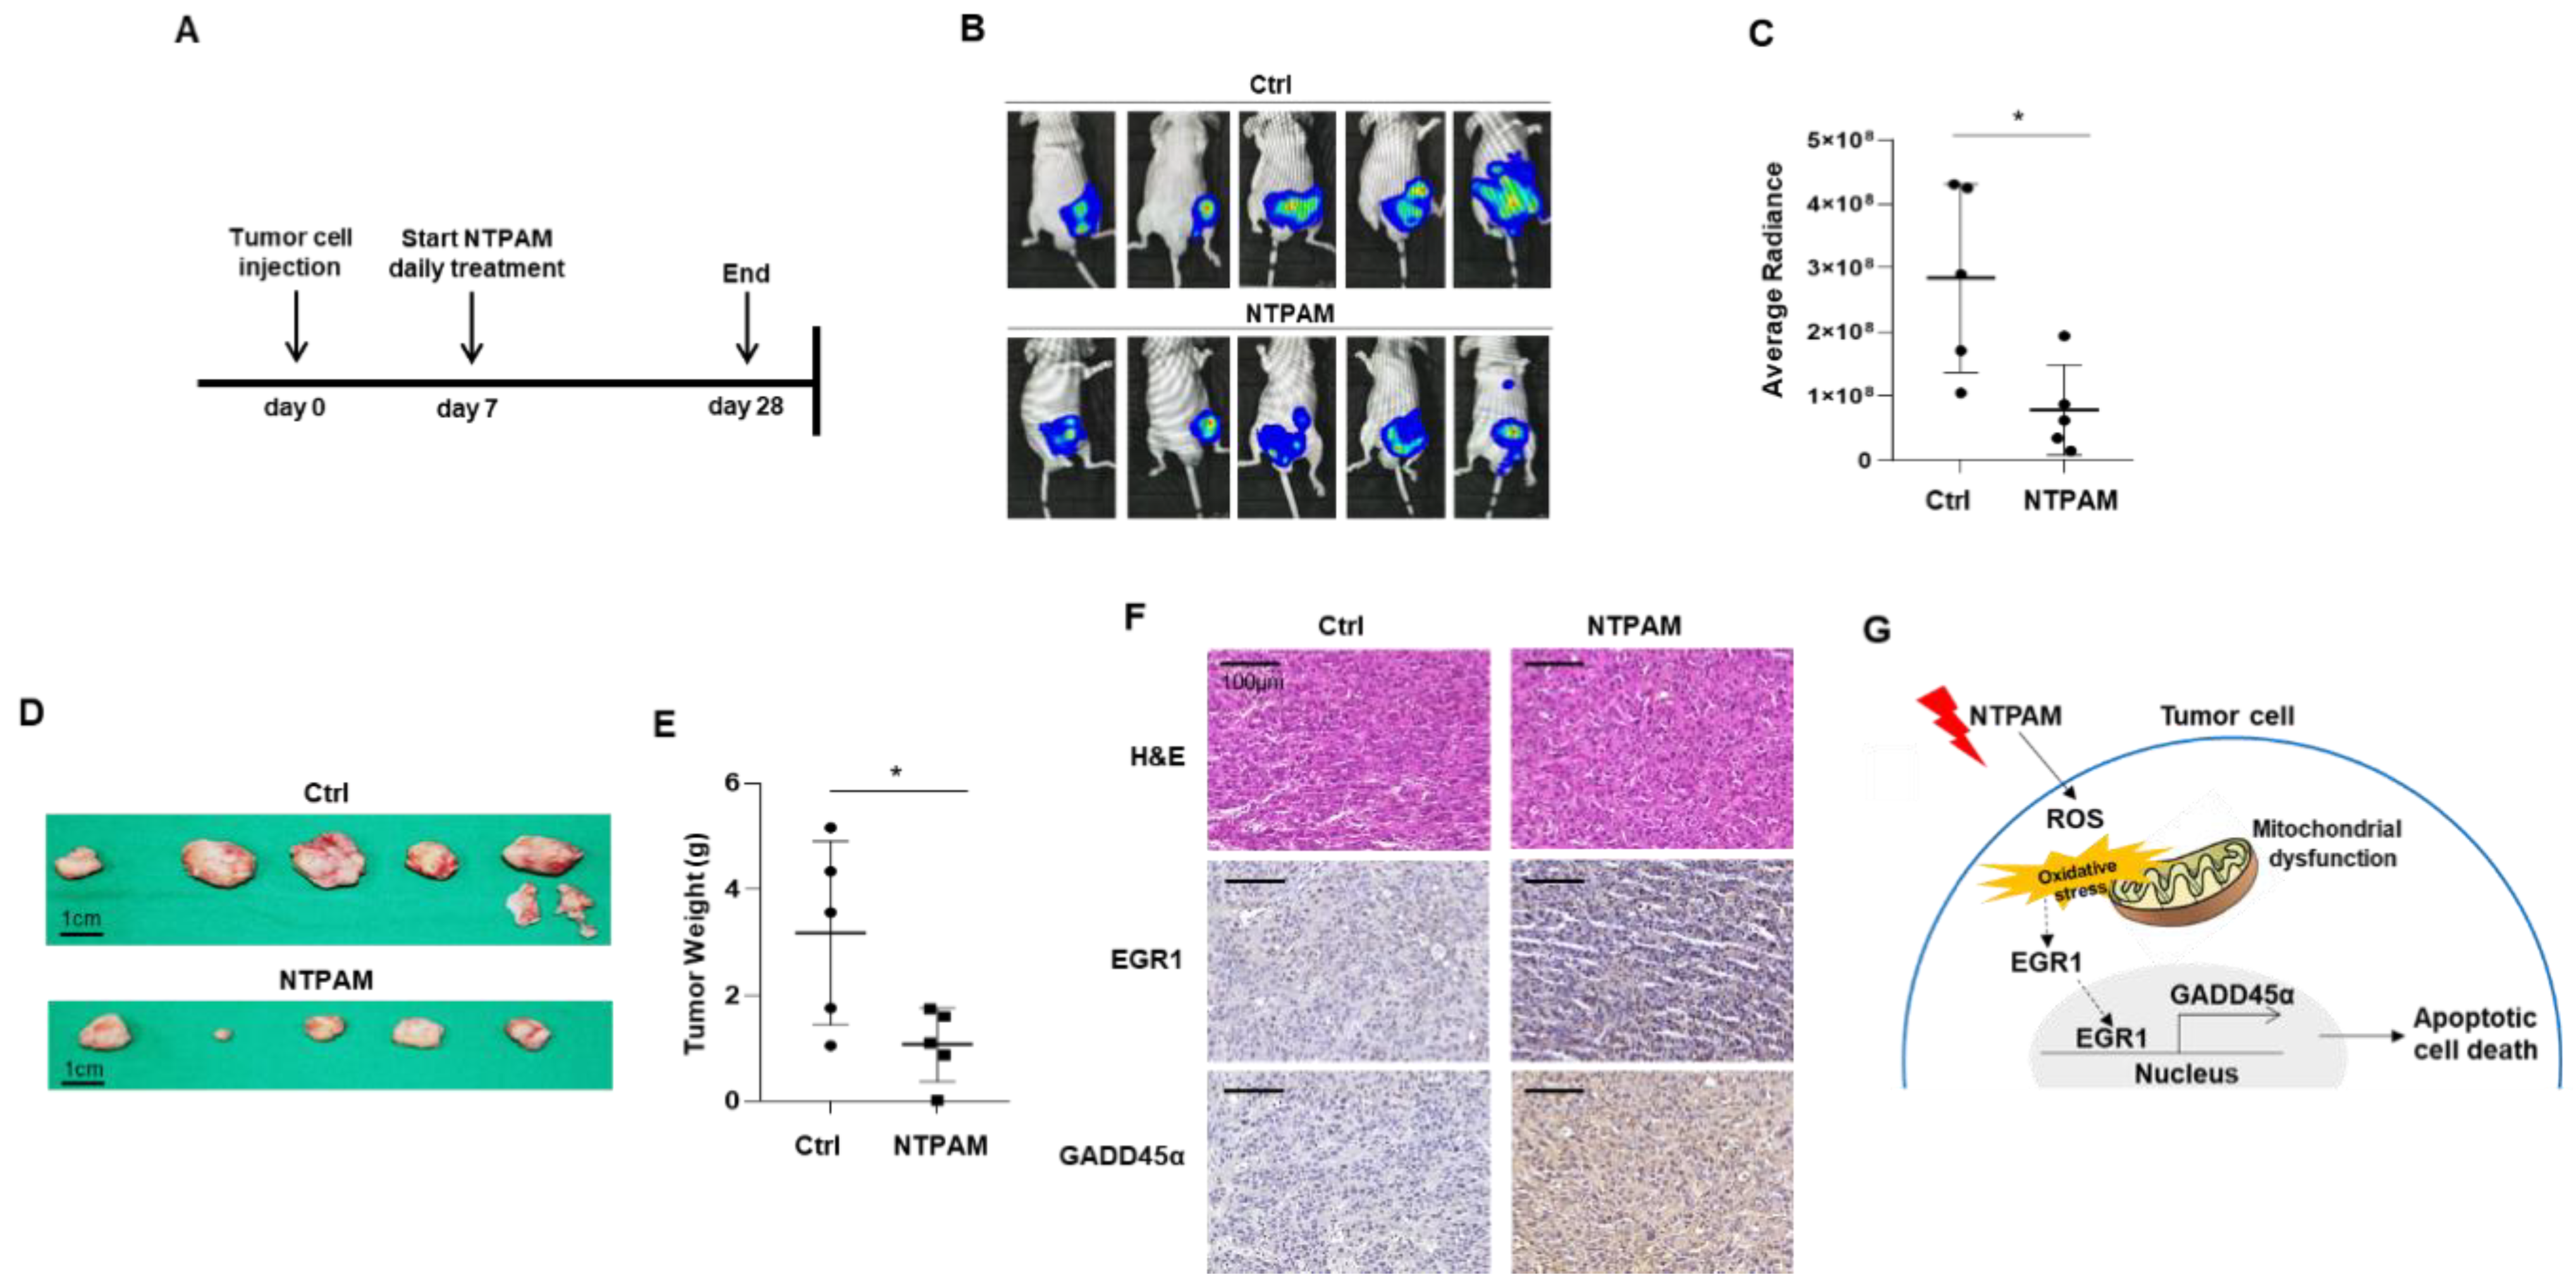
2.7. Antitumor Effect of NTPAM in THCA in a Xenograft Mouse Model
3. Discussion
4. Materials and Methods
4.1. Cell Lines and Materials
4.2. Experimental System Specifications of NTP and NTPAM Preparation
4.3. Cell Viability Assay
4.4. Apoptosis Assay
4.5. Measurement of Oxygen Consumption Rate
4.6. Transmission Electron Microscopy
4.7. RNA Extraction for Sequencing
4.8. Bioinformatic Transcriptome Analysis
4.9. Western Blot Analysis
4.10. RNA Isolation and Quantitative PCR
4.11. Patients’ Samples and Ethics Statement
4.12. Measurement of Mitochondrial ROS Production
4.13. Transient Transfection
4.14. Xenograft In Vivo Tumor Model
4.15. Bioluminescence Imaging and Survival Analysis
4.16. Histological and Immunohistochemical Analysis
4.17. Statistical Analysis
5. Conclusions
Supplementary Materials
Author Contributions
Funding
Institutional Review Board Statement
Informed Consent Statement
Data Availability Statement
Conflicts of Interest
References
- Nguyen, Q.T.; Lee, E.J.; Huang, M.G.; Park, Y.I.; Khullar, A.; Plodkowski, R.A. Diagnosis and treatment of patients with thyroid cancer. Am. Health Drug Benefits 2015, 8, 30–40. [Google Scholar]
- Siegel, R.; Ma, J.; Zou, Z.; Jemal, A. Cancer statistics, 2014. CA Cancer J. Clin. 2014, 64, 9–29. [Google Scholar] [CrossRef] [PubMed] [Green Version]
- Nikiforov, Y.E. Thyroid carcinoma: Molecular pathways and therapeutic targets. Mod. Pathol. 2008, 21 (Suppl. S2), S37–S43. [Google Scholar] [CrossRef] [Green Version]
- Schneider, D.F.; Chen, H. New developments in the diagnosis and treatment of thyroid cancer. CA Cancer J. Clin. 2013, 63, 374–394. [Google Scholar] [CrossRef] [PubMed] [Green Version]
- Lee, S.H.; Lee, S.J.; Jin, S.M.; Lee, N.H.; Kim, D.H.; Chae, S.W.; Sohn, J.H.; Kim, W.S. Relationships between Lymph Node Metastasis and Expression of CD31, D2-40, and Vascular Endothelial Growth Factors A and C in Papillary Thyroid Cancer. Clin. Exp. Otorhinolaryngol. 2012, 5, 150–155. [Google Scholar] [CrossRef] [PubMed]
- Sosonkina, N.; Starenki, D.; Park, J.I. The Role of STAT3 in Thyroid Cancer. Cancers 2014, 6, 526–544. [Google Scholar] [CrossRef] [PubMed] [Green Version]
- Park, C.H.; Song, C.M.; Ji, Y.B.; Pyo, J.Y.; Yi, K.J.; Song, Y.S.; Park, Y.W.; Tae, K. Significance of the Extracapsular Spread of Metastatic Lymph Nodes in Papillary Thyroid Carcinoma. Clin. Exp. Otorhinolaryngol. 2015, 8, 289–294. [Google Scholar] [CrossRef] [PubMed]
- Choi, S.Y.; Cho, J.K.; Moon, J.H.; Son, Y.I. Metastatic Lymph Node Ratio of Central Neck Compartment Has Predictive Values for Locoregional Recurrence in Papillary Thyroid Microcarcinoma. Clin. Exp. Otorhinolaryngol. 2016, 9, 75–79. [Google Scholar] [CrossRef] [Green Version]
- Zheng, C.M.; Ji, Y.B.; Song, C.M.; Ge, M.H.; Tae, K. Number of Metastatic Lymph Nodes and Ratio of Metastatic Lymph Nodes to Total Number of Retrieved Lymph Nodes Are Risk Factors for Recurrence in Patients With Clinically Node Negative Papillary Thyroid Carcinoma. Clin. Exp. Otorhinolaryngol. 2018, 11, 58–64. [Google Scholar] [CrossRef]
- Neff, R.L.; Farrar, W.B.; Kloos, R.T.; Burman, K.D. Anaplastic thyroid cancer. Endocrinol. Metab. Clin. N. Am. 2008, 37, 525–538. [Google Scholar] [CrossRef]
- Pasieka, J.L. Anaplastic thyroid cancer. Curr. Opin. Oncol. 2003, 15, 78–83. [Google Scholar] [CrossRef] [PubMed]
- Moreau, M.; Orange, N.; Feuilloley, M.G. Non-thermal plasma technologies: New tools for bio-decontamination. Biotechnol. Adv. 2008, 26, 610–617. [Google Scholar] [CrossRef] [PubMed]
- Kim, C.H.; Kwon, S.; Bahn, J.H.; Lee, K.; Jun, S.I.; Rack, P.D.; Baek, S.J. Effects of atmospheric nonthermal plasma on invasion of colorectal cancer cells. Appl. Phys. Lett. 2010, 96, 243701. [Google Scholar] [CrossRef] [PubMed] [Green Version]
- Sensenig, R.; Kalghatgi, S.; Cerchar, E.; Fridman, G.; Shereshevsky, A.; Torabi, B.; Arjunan, K.P.; Podolsky, E.; Fridman, A.; Friedman, G.; et al. Non-thermal plasma induces apoptosis in melanoma cells via production of intracellular reactive oxygen species. Ann. Biomed. Eng. 2011, 39, 674–687. [Google Scholar] [CrossRef]
- Kang, S.U.; Cho, J.H.; Chang, J.W.; Shin, Y.S.; Kim, K.I.; Park, J.K.; Yang, S.S.; Lee, J.S.; Moon, E.; Lee, K.; et al. Nonthermal plasma induces head and neck cancer cell death: The potential involvement of mitogen-activated protein kinase-dependent mitochondrial reactive oxygen species. Cell Death Dis. 2014, 5, e1056. [Google Scholar] [CrossRef]
- Akter, M.; Jangra, A.; Choi, S.A.; Choi, E.H.; Han, I. Non-Thermal Atmospheric Pressure Bio-Compatible Plasma Stimulates Apoptosis via p38/MAPK Mechanism in U87 Malignant Glioblastoma. Cancers 2020, 12, 245. [Google Scholar] [CrossRef] [Green Version]
- Kajiyama, H.; Utsumi, F.; Nakamura, K.; Tanaka, H.; Toyokuni, S.; Hori, M.; Kikkawa, F. Future perspective of strategic non-thermal plasma therapy for cancer treatment. J. Clin. Biochem. Nutr. 2017, 60, 33–38. [Google Scholar] [CrossRef] [Green Version]
- Tanaka, H.; Mizuno, M.; Ishikawa, K.; Toyokuni, S.; Kajiyama, H.; Kikkawa, F.; Hori, M. Molecular mechanisms of non-thermal plasma-induced effects in cancer cells. Biol. Chem. 2018, 400, 87–91. [Google Scholar] [CrossRef]
- Sukhatme, V.P.; Cao, X.M.; Chang, L.C.; Tsai-Morris, C.H.; Stamenkovich, D.; Ferreira, P.C.; Cohen, D.R.; Edwards, S.A.; Shows, T.B.; Curran, T.; et al. A zinc finger-encoding gene coregulated with c-fos during growth and differentiation, and after cellular depolarization. Cell 1988, 53, 37–43. [Google Scholar] [CrossRef]
- Datta, R.; Rubin, E.; Sukhatme, V.; Qureshi, S.; Hallahan, D.; Weichselbaum, R.R.; Kufe, D.W. Ionizing radiation activates transcription of the EGR1 gene via CArG elements. Proc. Natl. Acad. Sci. USA 1992, 89, 10149–10153. [Google Scholar] [CrossRef] [Green Version]
- Shi, Q.; Sutariya, V.; Bishayee, A.; Bhatia, D. Sequential activation of Elk-1/Egr-1/GADD45α by arsenic. Oncotarget 2014, 5, 3862–3870. [Google Scholar] [CrossRef] [PubMed]
- Virolle, T.; Adamson, E.D.; Baron, V.; Birle, D.; Mercola, D.; Mustelin, T.; de Belle, I. The Egr-1 transcription factor directly activates PTEN during irradiation-induced signalling. Nat. Cell Biol. 2001, 3, 1124–1128. [Google Scholar] [CrossRef]
- Li, L.; Ameri, A.H.; Wang, S.; Jansson, K.H.; Casey, O.M.; Yang, Q.; Beshiri, M.L.; Fang, L.; Lake, R.G.; Agarwal, S.; et al. EGR1 regulates angiogenic and osteoclastogenic factors in prostate cancer and promotes metastasis. Oncogene 2019, 38, 6241–6255. [Google Scholar] [CrossRef] [PubMed]
- Thyss, R.; Virolle, V.; Imbert, V.; Peyron, J.F.; Aberdam, D.; Virolle, T. NF-kappaB/Egr-1/Gadd45 are sequentially activated upon UVB irradiation to mediate epidermal cell death. EMBO J. 2005, 24, 128–137. [Google Scholar] [CrossRef] [PubMed] [Green Version]
- Baron, V.; Adamson, E.D.; Calogero, A.; Ragona, G.; Mercola, D. The transcription factor Egr1 is a direct regulator of multiple tumor suppressors including TGFbeta1, PTEN, p53, and fibronectin. Cancer Gene Ther. 2006, 13, 115–124. [Google Scholar] [CrossRef] [Green Version]
- Liu, J.; Grogan, L.; Nau, M.M.; Allegra, C.J.; Chu, E.; Wright, J.J. Physical interaction between p53 and primary response gene Egr-1. Int. J. Oncol. 2001, 18, 863–870. [Google Scholar] [CrossRef]
- Das, A.; Chendil, D.; Dey, S.; Mohiuddin, M.; Mohiuddin, M.; Milbrandt, J.; Rangnekar, V.M.; Ahmed, M.M. Ionizing radiation down-regulates p53 protein in primary Egr-1-/- mouse embryonic fibroblast cells causing enhanced resistance to apoptosis. J. Biol. Chem. 2001, 276, 3279–3286. [Google Scholar] [CrossRef] [Green Version]
- Nair, P.; Muthukkumar, S.; Sells, S.F.; Han, S.S.; Sukhatme, V.P.; Rangnekar, V.M. Early growth response-1-dependent apoptosis is mediated by p53. J. Biol. Chem. 1997, 272, 20131–20138. [Google Scholar] [CrossRef] [Green Version]
- Liu, C.; Yao, J.; Mercola, D.; Adamson, E. The transcription factor EGR-1 directly transactivates the fibronectin gene and enhances attachment of human glioblastoma cell line U251. J. Biol. Chem. 2000, 275, 20315–20323. [Google Scholar] [CrossRef] [Green Version]
- Abdulkadir, S.A.; Carbone, J.M.; Naughton, C.K.; Humphrey, P.A.; Catalona, W.J.; Milbrandt, J. Frequent and early loss of the EGR1 corepressor NAB2 in human prostate carcinoma. Hum. Pathol. 2001, 32, 935–939. [Google Scholar] [CrossRef]
- Abdulkadir, S.A.; Qu, Z.; Garabedian, E.; Song, S.K.; Peters, T.J.; Svaren, J.; Carbone, J.M.; Naughton, C.K.; Catalona, W.J.; Ackerman, J.J.; et al. Impaired prostate tumorigenesis in Egr1-deficient mice. Nat. Med. 2001, 7, 101–107. [Google Scholar] [CrossRef] [PubMed]
- Kearsey, J.M.; Coates, P.J.; Prescott, A.R.; Warbrick, E.; Hall, P.A. Gadd45 is a nuclear cell cycle regulated protein which interacts with p21Cip1. Oncogene 1995, 11, 1675–1683. [Google Scholar] [PubMed]
- Wang, X.W.; Zhan, Q.; Coursen, J.D.; Khan, M.A.; Kontny, H.U.; Yu, L.; Hollander, M.C.; O’Connor, P.M.; Fornace, A.J., Jr.; Harris, C.C. GADD45 induction of a G2/M cell cycle checkpoint. Proc. Natl. Acad. Sci. USA 1999, 96, 3706–3711. [Google Scholar] [CrossRef] [Green Version]
- Harkin, D.P.; Bean, J.M.; Miklos, D.; Song, Y.H.; Truong, V.B.; Englert, C.; Christians, F.C.; Ellisen, L.W.; Maheswaran, S.; Oliner, J.D.; et al. Induction of GADD45 and JNK/SAPK-dependent apoptosis following inducible expression of BRCA1. Cell 1999, 97, 575–586. [Google Scholar] [CrossRef] [Green Version]
- Chung, H.K.; Yi, Y.W.; Jung, N.C.; Kim, D.; Suh, J.M.; Kim, H.; Park, K.C.; Kim, D.W.; Hwang, E.S.; Song, J.H.; et al. Gadd45gamma expression is reduced in anaplastic thyroid cancer and its reexpression results in apoptosis. J. Clin. Endocrinol. Metab. 2003, 88, 3913–3920. [Google Scholar] [CrossRef] [PubMed] [Green Version]
- Chang, J.W.; Kang, S.U.; Shin, Y.S.; Kim, K.I.; Seo, S.J.; Yang, S.S.; Lee, J.S.; Moon, E.; Lee, K.; Kim, C.H. Non-thermal atmospheric pressure plasma inhibits thyroid papillary cancer cell invasion via cytoskeletal modulation, altered MMP-2/-9/uPA activity. PLoS ONE 2014, 9, e92198. [Google Scholar] [CrossRef] [Green Version]
- Kang, Y.E.; Kim, J.M.; Lim, M.A.; Lee, S.E.; Yi, S.; Kim, J.T.; Oh, C.; Liu, L.; Jin, Y.; Jung, S.N.; et al. Growth differentiation factor 15 is a cancer cell-induced mitokine that primes thyroid cancer cells for invasiveness. Thyroid Off. J. Am. Thyroid Assoc. 2020. [Google Scholar] [CrossRef]
- Kim, S.Y.; Kim, H.J.; Kang, S.U.; Kim, Y.E.; Park, J.K.; Shin, Y.S.; Kim, Y.S.; Lee, K.; Kim, C.H. Non-thermal plasma induces AKT degradation through turn-on the MUL1 E3 ligase in head and neck cancer. Oncotarget 2015, 6, 33382–33396. [Google Scholar] [CrossRef] [Green Version]
- Kim, S.Y.; Kim, H.J.; Kim, H.J.; Kim, D.H.; Han, J.H.; Byeon, H.K.; Lee, K.; Kim, C.H. HSPA5 negatively regulates lysosomal activity through ubiquitination of MUL1 in head and neck cancer. Autophagy 2018, 14, 385–403. [Google Scholar] [CrossRef] [Green Version]
- Ishaq, M.; Evans, M.M.; Ostrikov, K.K. Effect of atmospheric gas plasmas on cancer cell signaling. Int. J. Cancer 2014, 134, 1517–1528. [Google Scholar] [CrossRef]
- Yu, J.; Zhang, S.S.; Saito, K.; Williams, S.; Arimura, Y.; Ma, Y.; Ke, Y.; Baron, V.; Mercola, D.; Feng, G.S.; et al. PTEN regulation by Akt-EGR1-ARF-PTEN axis. EMBO J. 2009, 28, 21–33. [Google Scholar] [CrossRef] [PubMed] [Green Version]
- Liedtke, K.R.; Bekeschus, S.; Kaeding, A.; Hackbarth, C.; Kuehn, J.P.; Heidecke, C.D.; von Bernstorff, W.; von Woedtke, T.; Partecke, L.I. Non-thermal plasma-treated solution demonstrates antitumor activity against pancreatic cancer cells in vitro and in vivo. Sci. Rep. 2017, 7, 8319. [Google Scholar] [CrossRef] [PubMed]
- Utsumi, F.; Kajiyama, H.; Nakamura, K.; Tanaka, H.; Mizuno, M.; Ishikawa, K.; Kondo, H.; Kano, H.; Hori, M.; Kikkawa, F. Effect of indirect nonequilibrium atmospheric pressure plasma on anti-proliferative activity against chronic chemo-resistant ovarian cancer cells in vitro and in vivo. PLoS ONE 2013, 8, e81576. [Google Scholar] [CrossRef] [PubMed] [Green Version]
- Saadati, F.; Mahdikia, H.; Abbaszadeh, H.A.; Abdollahifar, M.A.; Khoramgah, M.S.; Shokri, B. Comparison of Direct and Indirect cold atmospheric-pressure plasma methods in the B(16)F(10) melanoma cancer cells treatment. Sci. Rep. 2018, 8, 7689. [Google Scholar] [CrossRef] [Green Version]
- Kim, S.Y.; Kim, H.J.; Kim, H.J.; Kim, C.H. Non-Thermal Plasma Induces Antileukemic Effect Through mTOR Ubiquitination. Cells 2020, 9, 595. [Google Scholar] [CrossRef] [Green Version]
- Nguyen, N.H.; Park, H.J.; Yang, S.S.; Choi, K.S.; Lee, J.S. Anti-cancer efficacy of nonthermal plasma dissolved in a liquid, liquid plasma in heterogeneous cancer cells. Sci. Rep. 2016, 6, 29020. [Google Scholar] [CrossRef]
- Wortel, I.M.N.; van der Meer, L.T.; Kilberg, M.S.; van Leeuwen, F.N. Surviving Stress: Modulation of ATF4-Mediated Stress Responses in Normal and Malignant Cells. Trends Endocrinol. Metab. TEM 2017, 28, 794–806. [Google Scholar] [CrossRef]
- Nose, K.; Ohba, M. Functional activation of the egr-1 (early growth response-1) gene by hydrogen peroxide. Biochem. J. 1996, 316 Pt 2, 381–383. [Google Scholar] [CrossRef] [Green Version]
- Pagel, J.I.; Deindl, E. Disease progression mediated by egr-1 associated signaling in response to oxidative stress. Int. J. Mol. Sci. 2012, 13, 13104–13117. [Google Scholar] [CrossRef] [Green Version]
- Rosemary Siafakas, A.; Richardson, D.R. Growth arrest and DNA damage-45 alpha (GADD45alpha). Int. J. Biochem. Cell Biol. 2009, 41, 986–989. [Google Scholar] [CrossRef]
- Hollander, M.C.; Sheikh, M.S.; Bulavin, D.V.; Lundgren, K.; Augeri-Henmueller, L.; Shehee, R.; Molinaro, T.A.; Kim, K.E.; Tolosa, E.; Ashwell, J.D.; et al. Genomic instability in Gadd45a-deficient mice. Nat. Genet. 1999, 23, 176–184. [Google Scholar] [CrossRef] [PubMed]
- Bedard, P.L.; Hansen, A.R.; Ratain, M.J.; Siu, L.L. Tumour heterogeneity in the clinic. Nature 2013, 501, 355–364. [Google Scholar] [CrossRef] [PubMed] [Green Version]
- Adachi, T.; Tanaka, H.; Nonomura, S.; Hara, H.; Kondo, S.; Hori, M. Plasma-activated medium induces A549 cell injury via a spiral apoptotic cascade involving the mitochondrial-nuclear network. Free Radic. Biol. Med. 2015, 79, 28–44. [Google Scholar] [CrossRef] [PubMed]
- Lee, S.Y.; Kang, S.U.; Kim, K.I.; Kang, S.; Shin, Y.S.; Chang, J.W.; Yang, S.S.; Lee, K.; Lee, J.S.; Moon, E.; et al. Nonthermal plasma induces apoptosis in ATC cells: Involvement of JNK and p38 MAPK-dependent ROS. Yonsei Med. J. 2014, 55, 1640–1647. [Google Scholar] [CrossRef] [PubMed] [Green Version]
- Ghosh, S.; Chan, C.K. Analysis of RNA-Seq Data Using TopHat and Cufflinks. Methods Mol. Biol. 2016, 1374, 339–361. [Google Scholar] [CrossRef]
- Thissen, D.; Steinberg, L.; Kuang, D. Quick and Easy Implementation of the Benjamini-Hochberg Procedure for Controlling the False Positive Rate in Multiple Comparisons. J. Educ. Behav. Stat. 2002, 27, 77–83. [Google Scholar] [CrossRef]
- Jung, S.N.; Shin, D.S.; Kim, H.N.; Jeon, Y.J.; Yun, J.; Lee, Y.J.; Kang, J.S.; Han, D.C.; Kwon, B.M. Sugiol inhibits STAT3 activity via regulation of transketolase and ROS-mediated ERK activation in DU145 prostate carcinoma cells. Biochem. Pharmacol. 2015, 97, 38–50. [Google Scholar] [CrossRef]
- Yuan, J.S.; Reed, A.; Chen, F.; Stewart, C.N., Jr. Statistical analysis of real-time PCR data. BMC Bioinform. 2006, 7, 85. [Google Scholar] [CrossRef] [Green Version]


Publisher’s Note: MDPI stays neutral with regard to jurisdictional claims in published maps and institutional affiliations. |
© 2021 by the authors. Licensee MDPI, Basel, Switzerland. This article is an open access article distributed under the terms and conditions of the Creative Commons Attribution (CC BY) license (http://creativecommons.org/licenses/by/4.0/).
Share and Cite
Jung, S.-N.; Oh, C.; Chang, J.W.; Liu, L.; Lim, M.A.; Jin, Y.L.; Piao, Y.; Kim, H.J.; Won, H.-R.; Lee, S.E.; et al. EGR1/GADD45α Activation by ROS of Non-Thermal Plasma Mediates Cell Death in Thyroid Carcinoma. Cancers 2021, 13, 351. https://0-doi-org.brum.beds.ac.uk/10.3390/cancers13020351
Jung S-N, Oh C, Chang JW, Liu L, Lim MA, Jin YL, Piao Y, Kim HJ, Won H-R, Lee SE, et al. EGR1/GADD45α Activation by ROS of Non-Thermal Plasma Mediates Cell Death in Thyroid Carcinoma. Cancers. 2021; 13(2):351. https://0-doi-org.brum.beds.ac.uk/10.3390/cancers13020351
Chicago/Turabian StyleJung, Seung-Nam, Chan Oh, Jae Won Chang, Lihua Liu, Mi Ae Lim, Yan Li Jin, Yudan Piao, Hae Jong Kim, Ho-Ryun Won, Seong Eun Lee, and et al. 2021. "EGR1/GADD45α Activation by ROS of Non-Thermal Plasma Mediates Cell Death in Thyroid Carcinoma" Cancers 13, no. 2: 351. https://0-doi-org.brum.beds.ac.uk/10.3390/cancers13020351