
Microbial Removal of Pb(II) Using an Upflow Anaerobic Sludge Blanket (UASB) Reactor


1
Department of Civil and Water Engineering, National University of Science and Technology, Ascot, Bulawayo, Zimbabwe
2
Department Biochemistry, Genetics and Microbiology, University of Pretoria, Lynnwood Road, Hatfield, Pretoria 0002, South Africa
3
Water Utilisation and Environmental Engineering Division, Department of Chemical Engineering, University of Pretoria, Lynnwood Road, Hatfield, Pretoria 0002, South Africa
*
Author to whom correspondence should be addressed.
Catalysts 2021, 11(4), 512; https://0-doi-org.brum.beds.ac.uk/10.3390/catal11040512
Submission received: 27 February 2021
/
Revised: 15 April 2021
/
Accepted: 16 April 2021
/
Published: 19 April 2021
(This article belongs to the Special Issue Biocatalysis for Green Chemistry)
Abstract
:The main objective of this study was to achieve the continuous biorecovery and bioreduction of Pb(II) using an industrially obtained consortia as a biocatalyst. An upflow anaerobic sludge blanket reactor was used in the treatment process. The bioremediation technique that was applied made use of a yeast extract as the microbial substrate and Pb(NO3)2 as the source of Pb(II). The UASB reactor exhibited removal efficiencies of between 90 and 100% for the inlet Pb concentrations from 80 to 2000 ppm and a maximum removal rate of 1948.4 mg/(L·d) was measured. XRD and XPS analyses of the precipitate revealed the presence of Pb0, PbO, PbS and PbSO4. Supporting experimental work carried out included growth measurements, pH, oxidation–reduction potentials and nitrate levels.
1. Introduction
Lead (Pb) is amongst the most toxic and pernicious heavy metals and is a major pollutant of soil, plants and water [1]. Pb finds its way into the environment through anthropogenic activities, such as painting, soldering, electroplating, the battery industry and mining [2,3,4]. According to Naik and Dubey [5], anthropogenic activities have significantly contributed to the accumulation of lead in the environment by more than 1000-fold over the last 300 years. Human exposure to Pb(II) occurs through the ingestion of contaminated food and water or the inhalation of aerosols and dust particles. The threshold limits of Pb(II) in wastewater and drinking water are both 0.05 ppm [6]. Noncompliance with the aforementioned limits may ultimately result in Pb(II)-related health effects. Tiquia-Arashiro [3], Mathee et al. [7] and Hörstmann and Brink [8] alluded that lead poisoning disproportionately affects children, causing mental retardation and behavioural disorders. In pregnancies, lead poisoning can result in low birth weight, miscarriage and premature delivery [9]. In addition, lead concentrations above 0.4 ppm in blood can result in sperm count reduction in men [9]. Pb(II) poisoning in humans may result in damage to the nervous system, skeleton, brain, heart, liver and kidneys [10]. Ara and Usmani [11] describe Pb(II) as a non-nutritionally essential element, which can damage the deoxyribonucleic acid (DNA) and affect haemoglobin. It affects the haemoglobin through interference with the delta-aminolaevulinic acid dehydratase (ALAD) activity, which is an essential enzyme in the heme biosynthesis and ultimately causes anaemia [11,12]. Radziemska et al. and Zulfiqar et al. [13,14] reported that the contamination of soils by the most toxic elements like Pb(II) ultimately influences the growth and development of plants. Pb(II) has also been reported to be toxic to plants, even in trace amounts [15], with a permissible limit of 2 mg·kg−1. This calls for global effort towards lead removal from the environment. Tiquia-Arashiro [3] has posited that little has been done regarding lead treatment; hence, it is a cause for concern to human and environmental health. Despite being toxic, lead is also an integral part of society, with various industrial applications, such as the aforementioned anthropogenic activities [4]. However, with the current Pb depletion rate of 5 Mt/yr [16] and the current reserve of 85 Mt [17], this implies a likely global lead depletion in the next 17 years. It is, therefore, imperative to enhance environmental sustainability through improved lead management, which can be attained through the application of efficient technologies, such as bioremediation [18].
Tiquia-Arashiro [3] suggested that in addition to the Pb remediation from the ecosystem, there is also a need to recover it from industrial effluents. Bioremediation technology is preferred over other conventional heavy metal treatment methods, such as ion exchange, electrolysis, evaporation, sorption and reverse osmosis [1,19]. These methods pose several disadvantages, such as toxic waste materials, high costs and hazardous waste disposal. Microbial heavy metal removal is known to be a considerably more environmentally friendly and safe alternative to conventional physicochemical methods [20].
Preliminary work and kinetic analyses leading to this project were conducted under batch conditions by members of the Environmental Research Group at the University of Pretoria (South Africa) [8,19,21,22]. Pb bioremoval was found to be optimal at a concentration of 500 ppm, with a 99% removal efficiency after 11 days under anaerobic batch conditions [22].
The majority of batch experiments conducted by this team in the past used Luria Bertani broth as a rich growth medium for microbial Pb removal. A more economically viable option for growth media was sought after and the use of yeast extract instead of LB broth was proposed and proved to be a highly effective substitute [23].
Given the motivating results from the batch experiments, it was imperative to develop a preliminary system for continuous lead removal for future industrial use. This paper presents the first study of continuous biorecovery using simultaneous bioprecipitation and bioreduction of Pb(II) in a UASB reactor with a microbial consortium sourced by Brink et al. [21].
2. Results
2.1. Continuous Experimental Runs
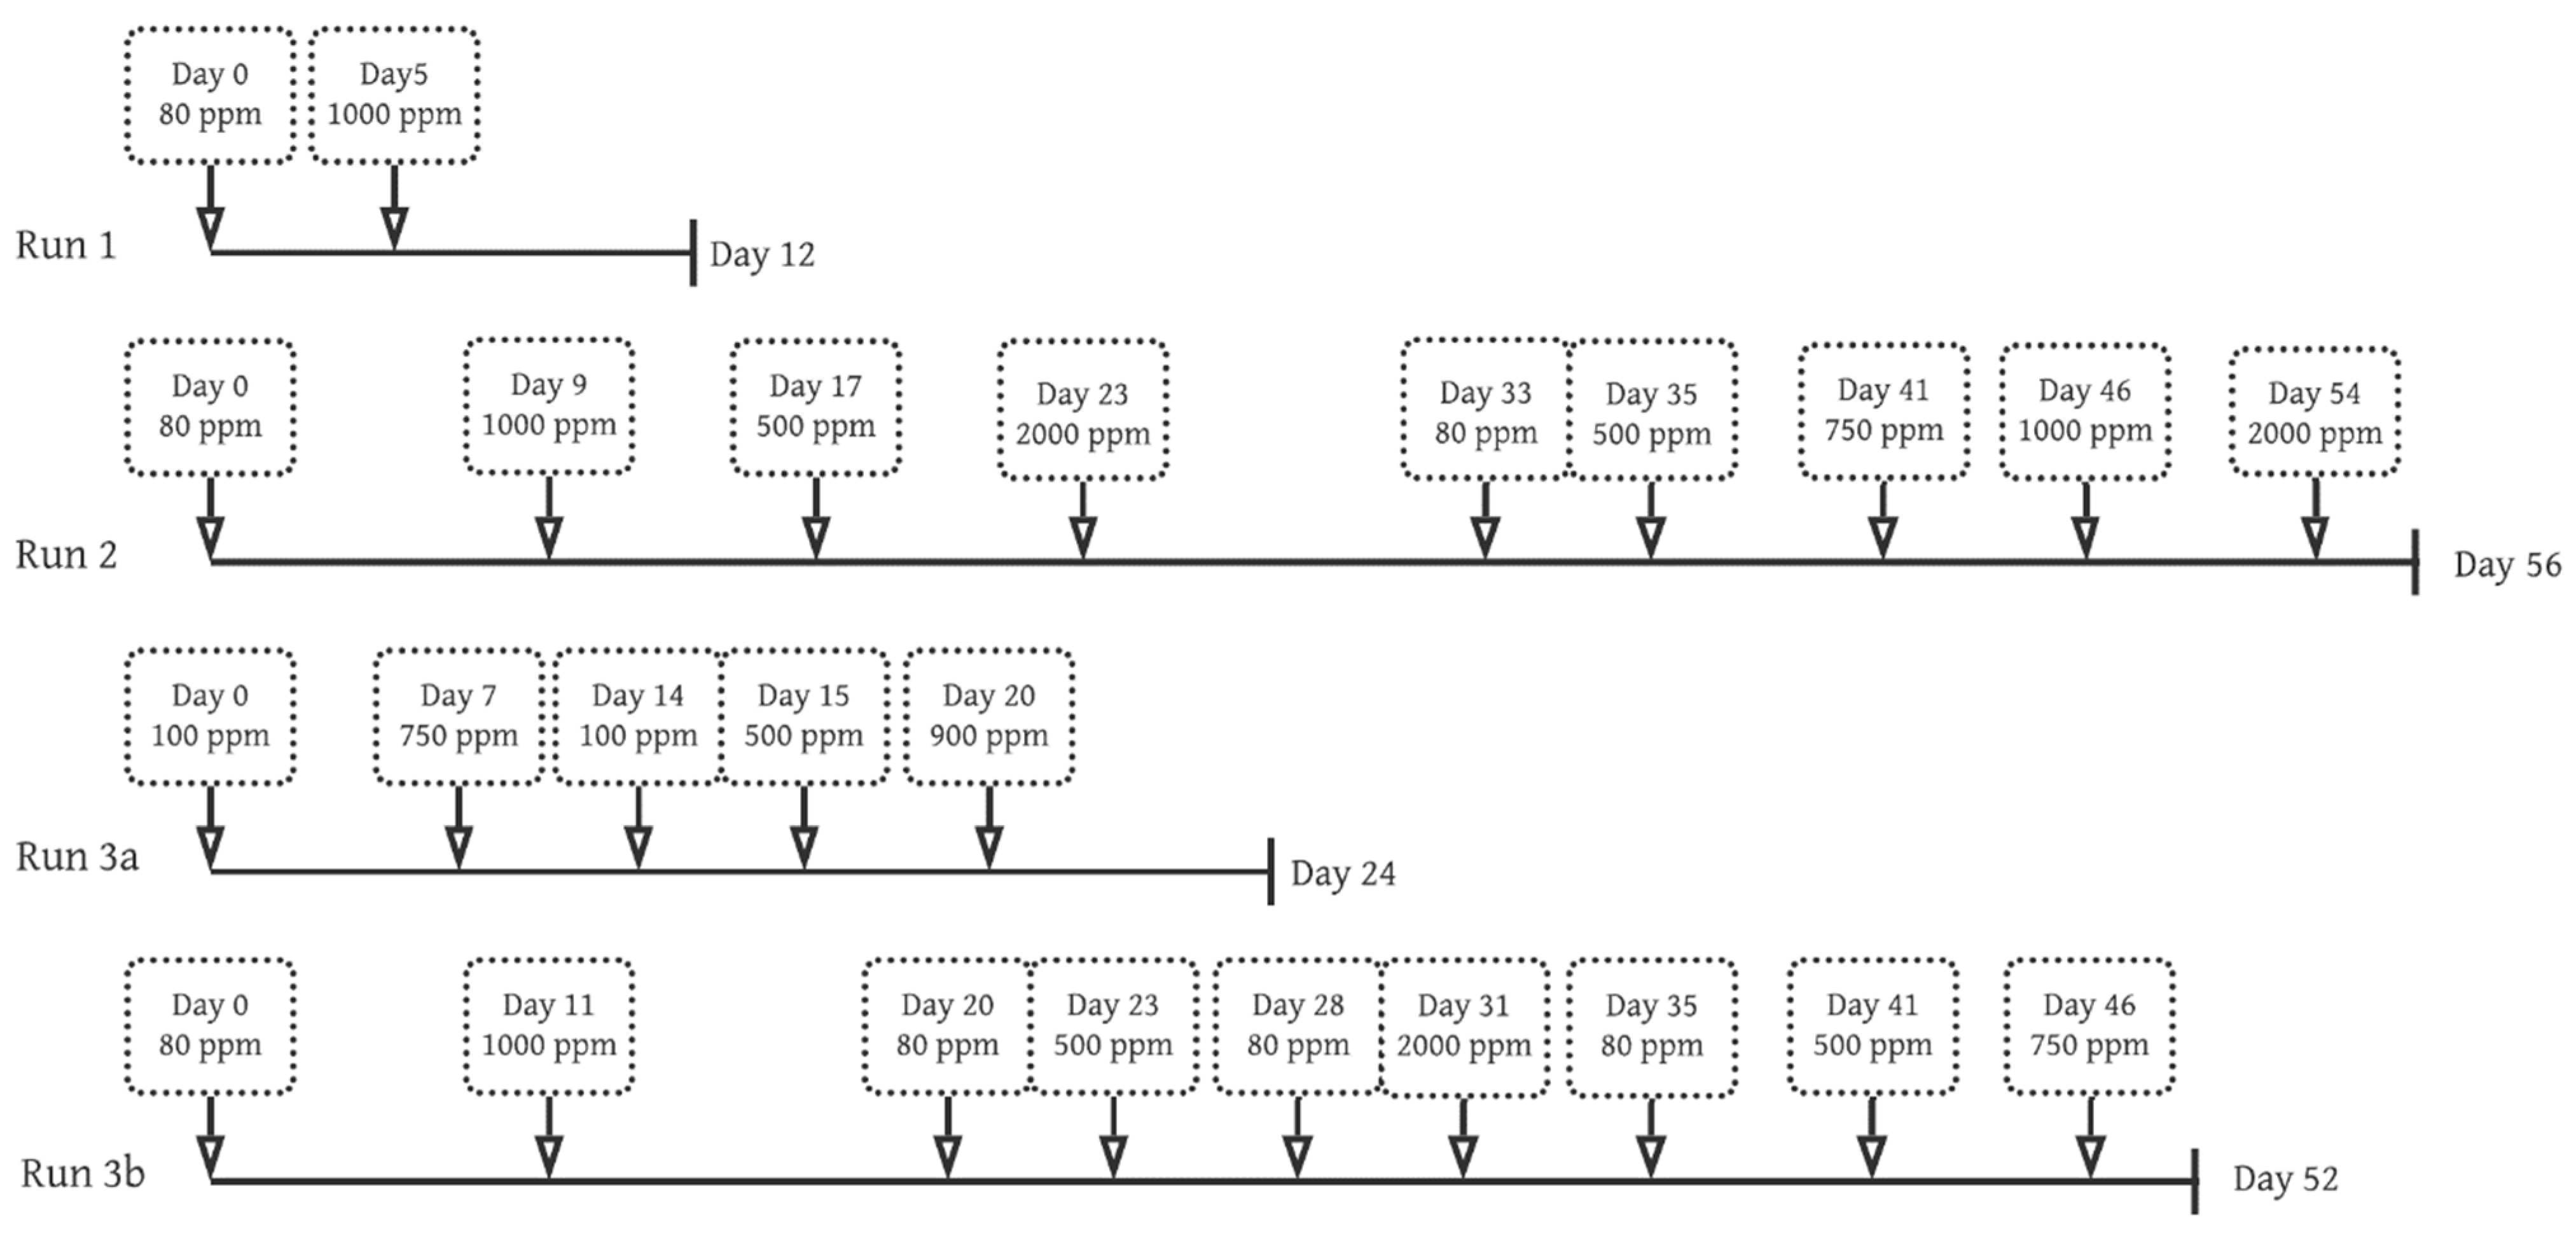
The continuous experiments were initiated in the bioreactor. All of the runs presented the formation of dark grey precipitates after less than 72 h, suggesting positive microbial growth and significant Pb(II) precipitation. The timelines of the multiple loading scenarios used in the four experimental runs in this study are presented in Figure 1 below. The concentrations and timelines were chosen in such a manner to test the system’s resilience and robustness over time. Certain concentrations were measured twice during the runs to test the system’s adaptive capabilities. Pb(II) concentrations were continuously measured and contributed to decisions made in terms of the timelines and concentrations used to optimally test all parameters in question.
Figure 2, Figure 3, Figure 4 and Figure 5 present the results for the Pb(II) removal, metabolic activity, ORP, pH and the Pb(II) removal rates for each of the runs respectively.
It should be noted that the final run (3b) was an extension of run 3a, which was interrupted due to the South African nationwide coronavirus lockdown from March to May 2020. In response to this interruption, it was decided to test the robustness and resilience of the system to severe system upsets. This was done by placing the reactor system in stasis by sealing off the system for the duration of the lockdown (3 months) without the addition of any growth medium or Pb. The system was started up again after the resumption of laboratory activity without the addition of any new inoculant.
2.1.1. Run 1
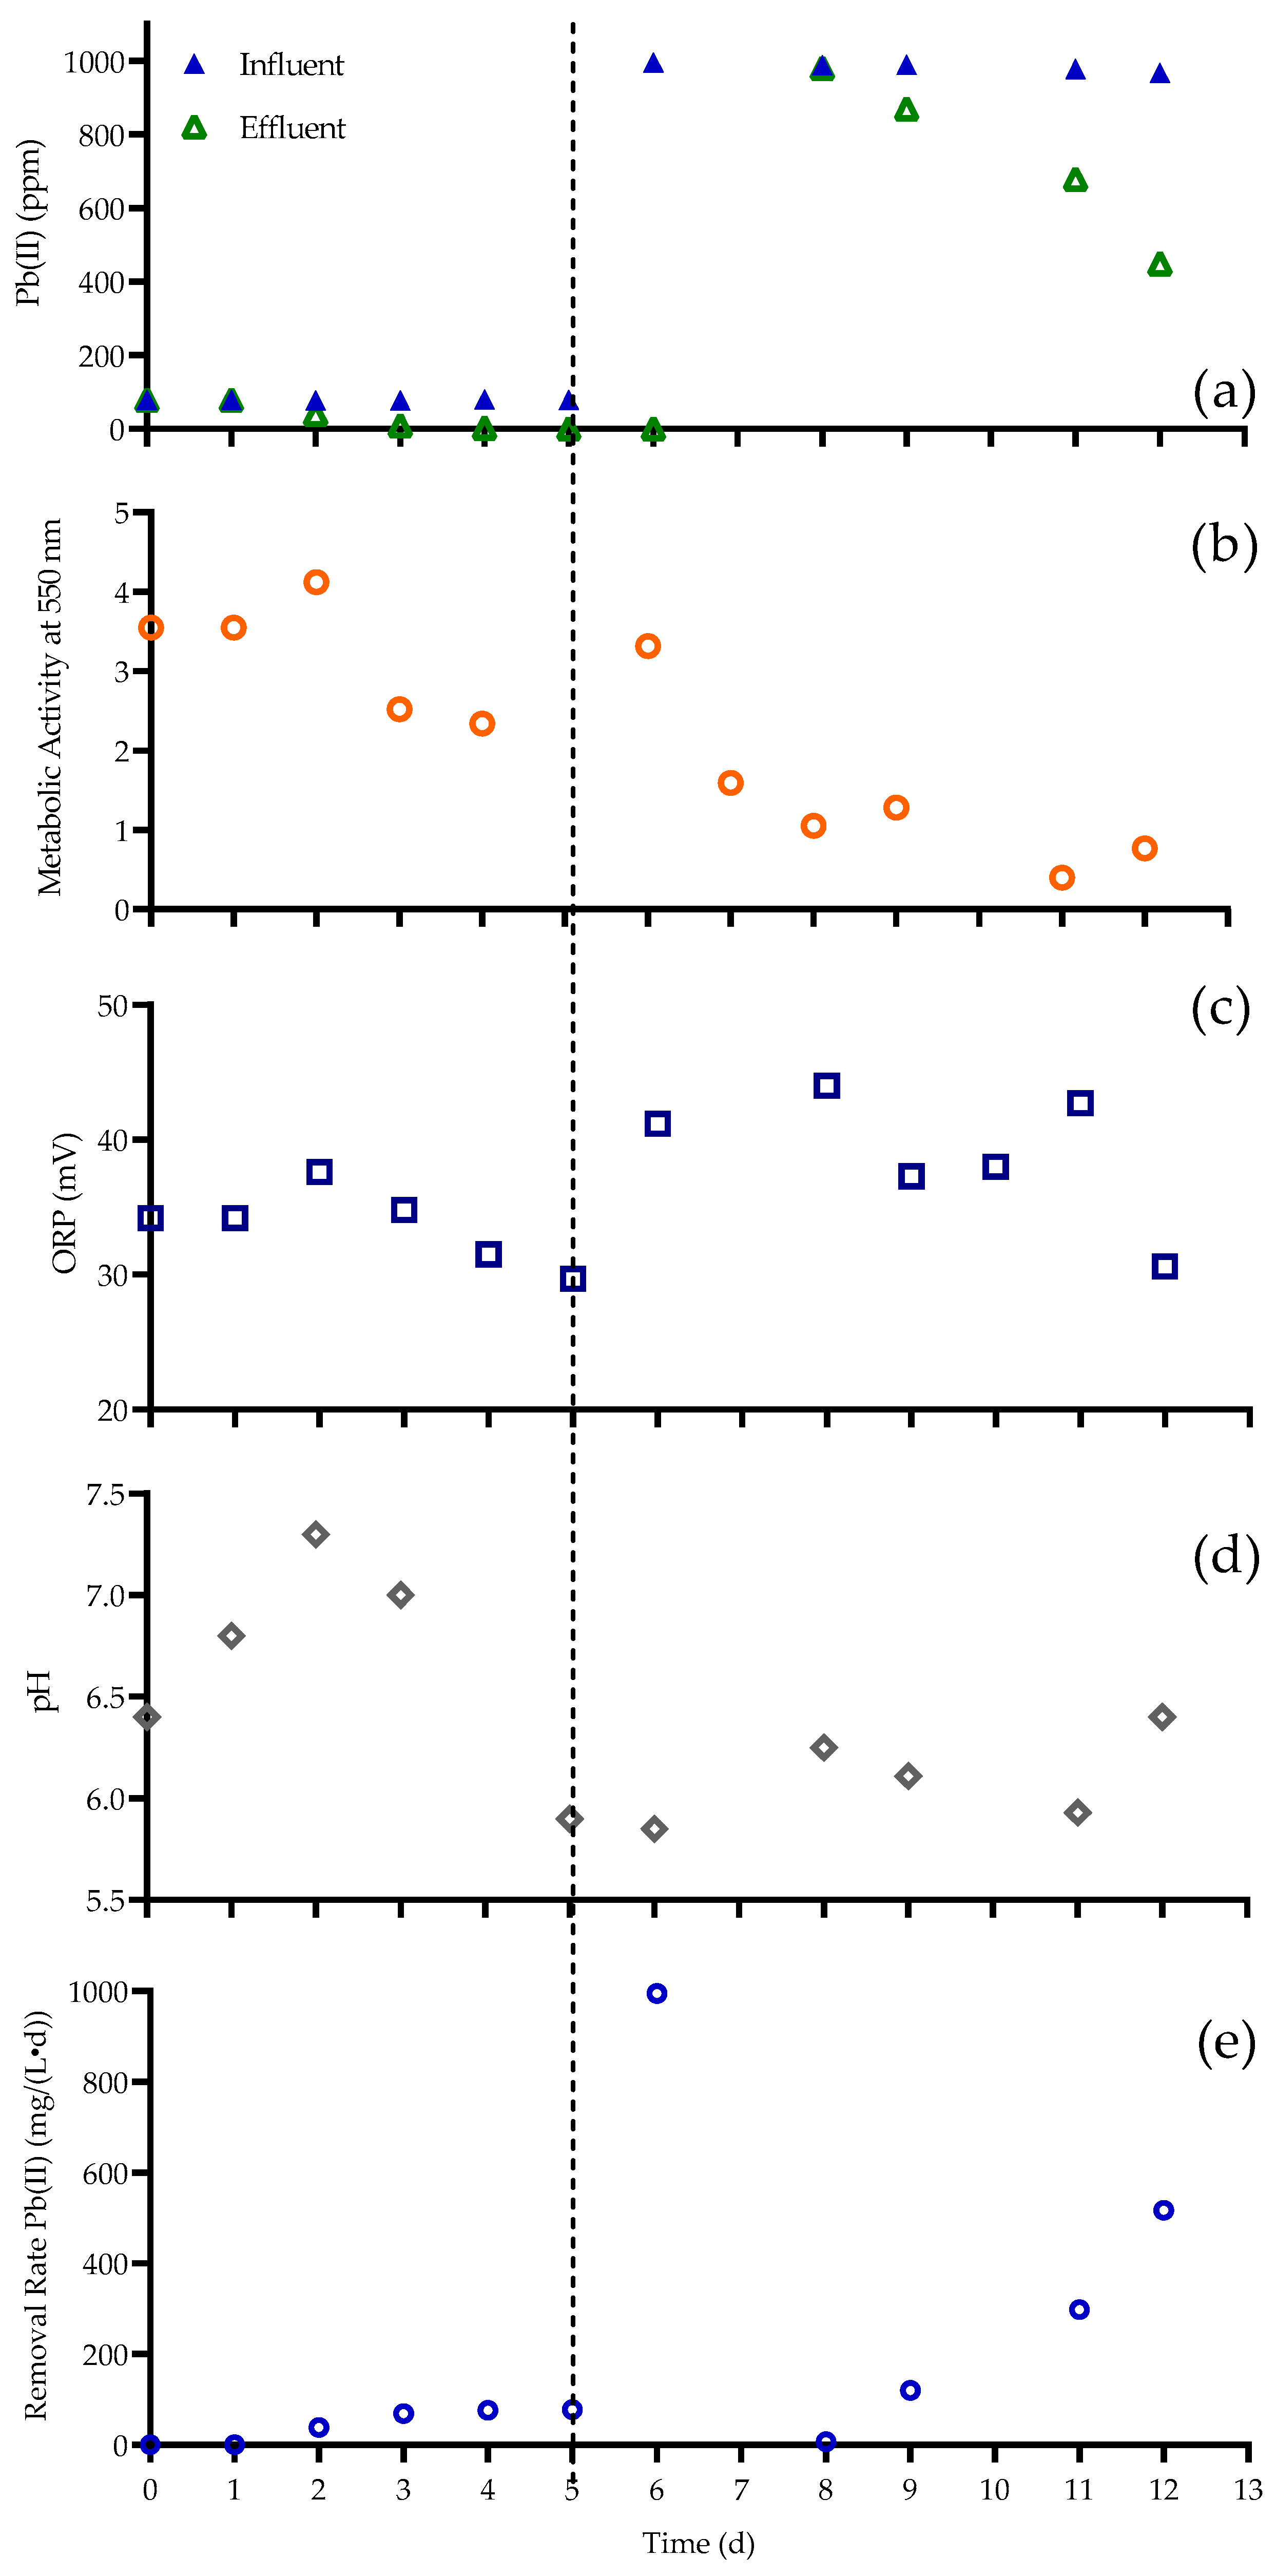
Regarding Figure 2a of run 1, it took 3 days for the UASB reactor to achieve a 98% removal efficiency of 80 ppm Pb(II). The system was consequently shock-loaded with 1000 ppm Pb(II) on day 5, after which, 55% of the Pb(II) was removed on day 7. The growth initially declined after the first introduction of 80 ppm Pb(II), followed by a steady increase in growth measurements between days 1 and 2, suggesting an adaptive detoxification mechanism at work. The lead concentration was increased to 1000 ppm on day 5 and an instant increase in growth was observed, followed by a steady decline in nitrate measurements, confirming a nitrate growth dependence that was suggested in earlier studies [24]. The ORP and pH measurements are presented in Figure 2c,d. The oxidation–reduction potential (ORP), which is one of the important microbial cultivation parameters, was continuously measured to monitor the degree of anaerobiosis. All the ORP values measured were below +100 mV but above 0 mV, implying that the system operated in the anoxic range. According to Dabkowski [25], ORP values between −100 and +100 mV are described as anoxic, transient or near dissolved oxygen (intermediate conditions); this is in contrast with the anaerobic zone, where the ORP is measured below −100 mV. The pH of the system constantly varied between measurements of 5.85 and just below 7.5, indicating little variation. The highest removal rate recorded for this run was found to be 994.9 mg/(L·d) Pb(II), as presented in Figure 2e below.
2.1.2. Run 2
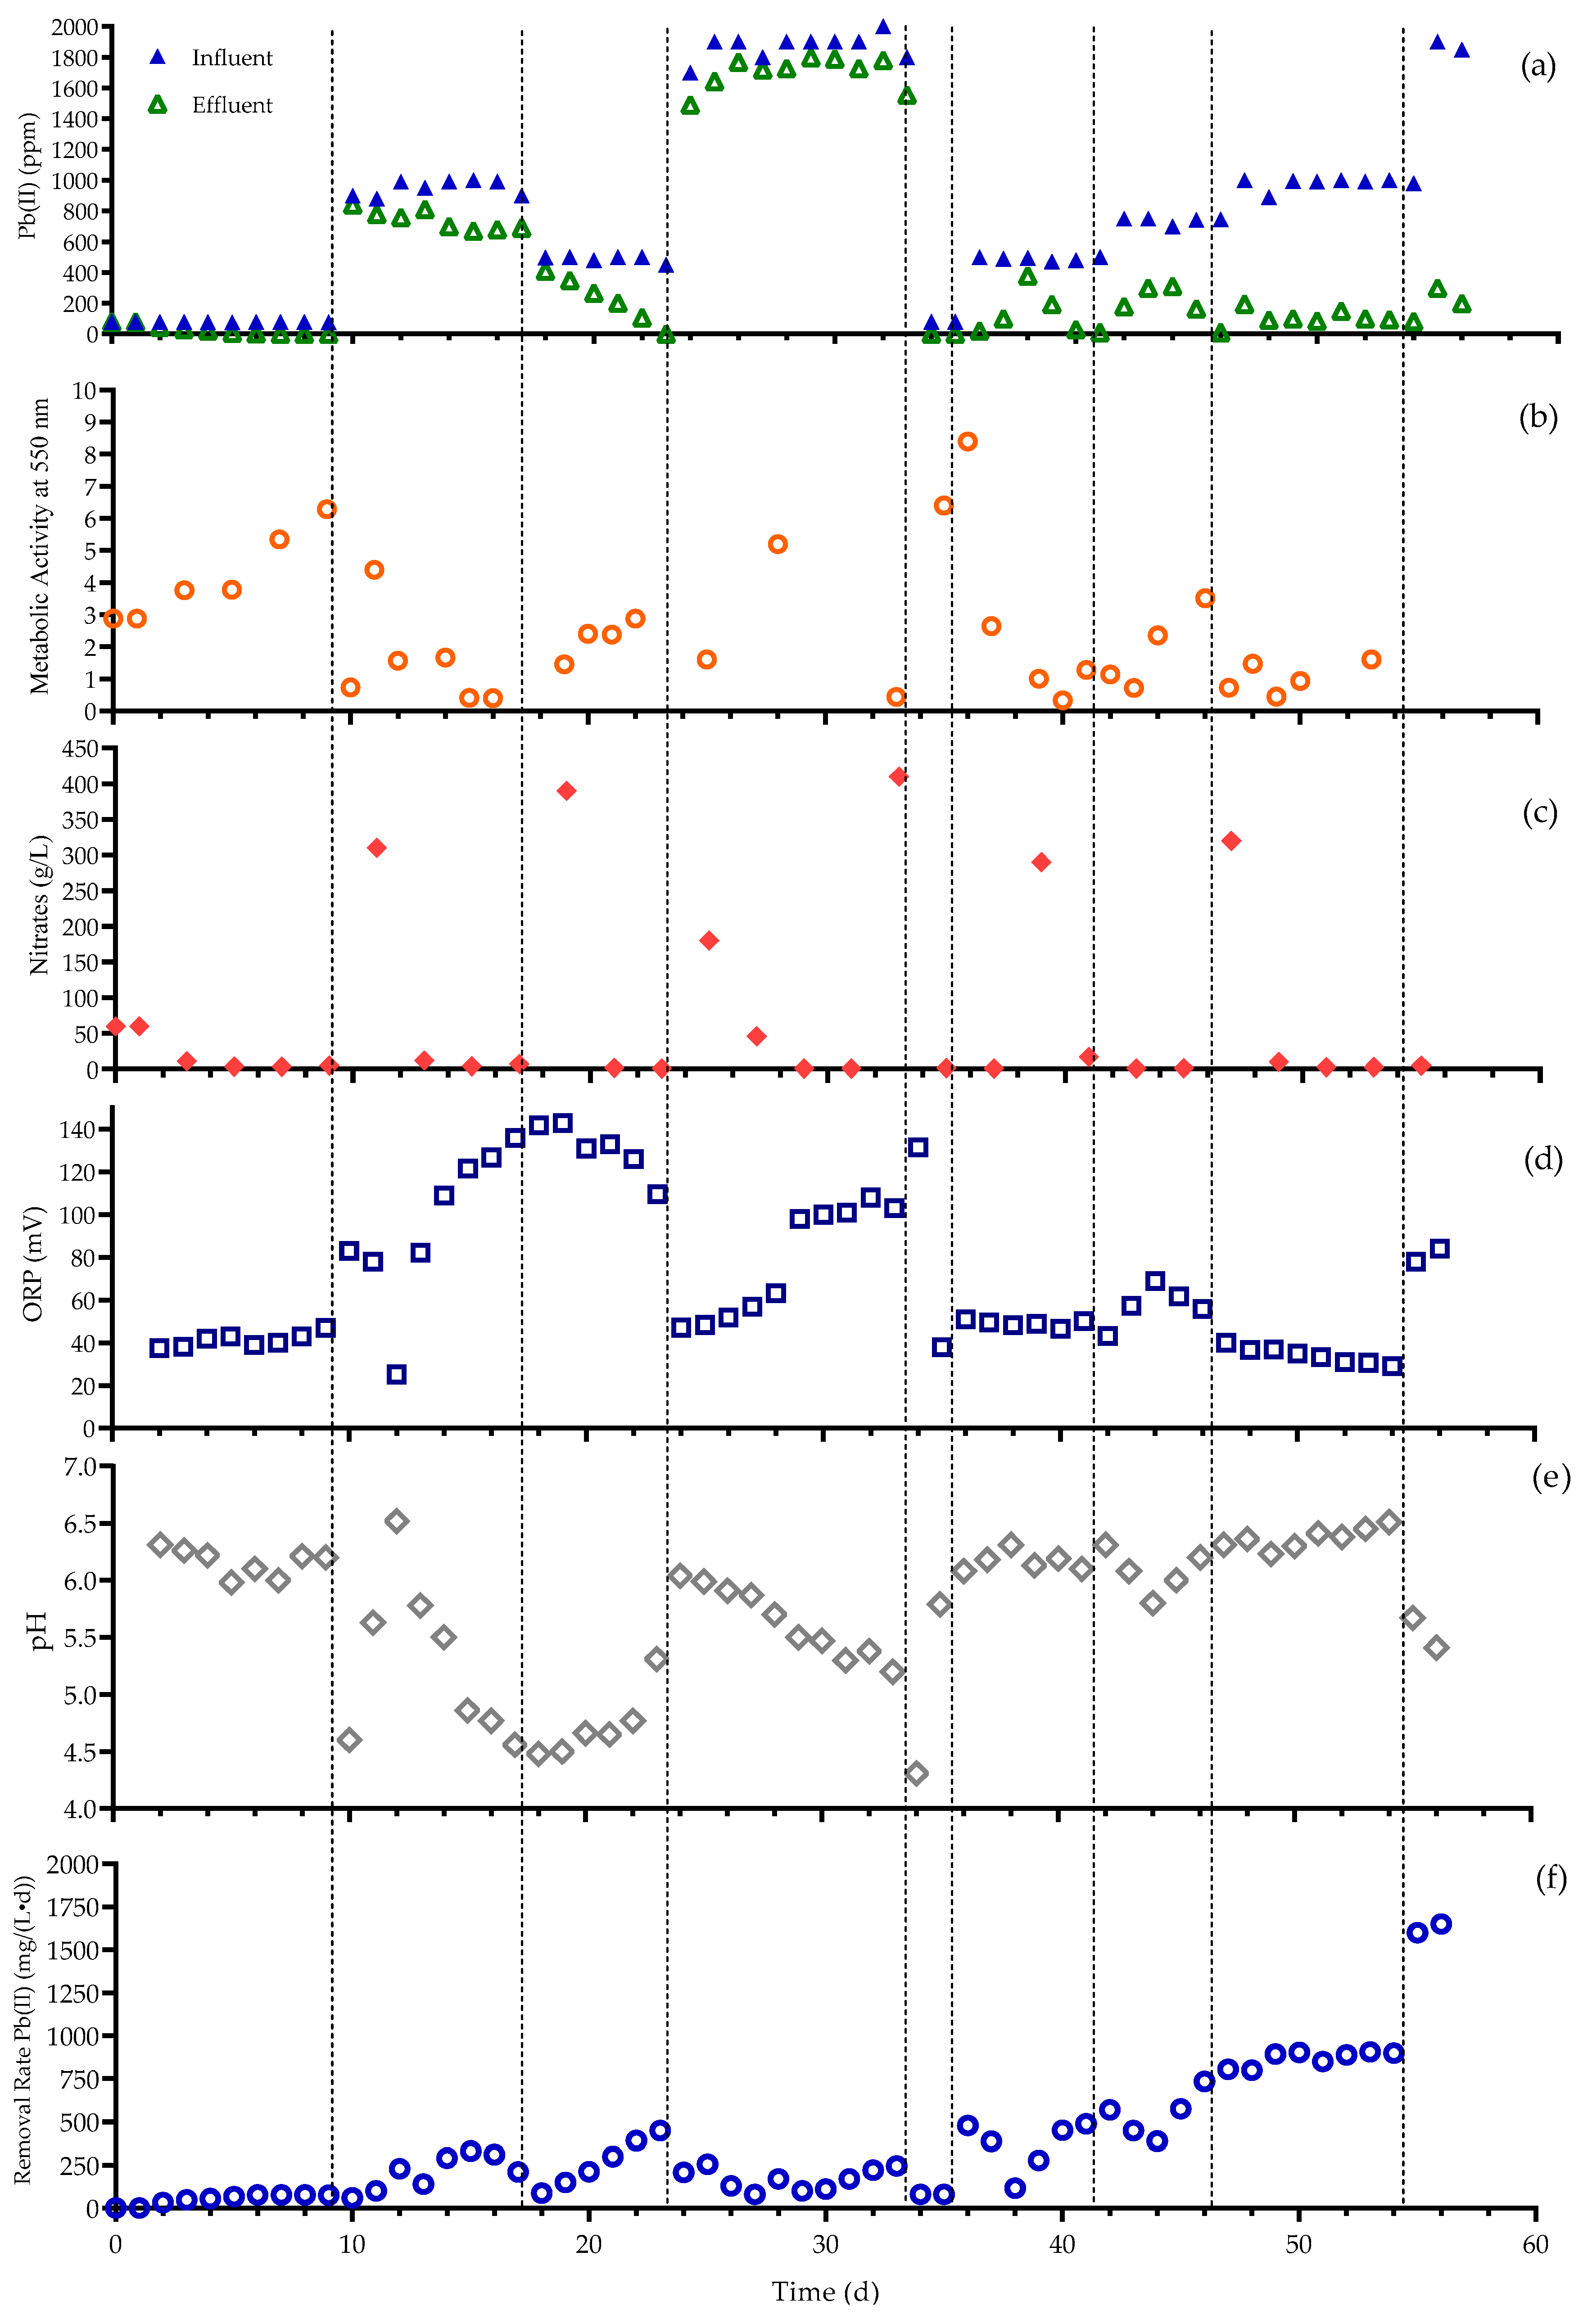
Experimental run 2, as presented in Figure 3, was initiated with a concentration of 80 ppm Pb(II), followed by the production of a dark grey precipitate after 72 h, similar to the first experimental run. The system was shock-loaded on day 9 with 1000 ppm, on day 17 with 500 ppm, on day 23 with 2000 ppm, on day 33 with 80 ppm, on day 35 with 500 ppm, on day 41 with 750 ppm, on day 46 with 1000 ppm and on day 54 with 2000 ppm. During the experimental run, it was observed that the system was able to achieve a maximum of 100% 80 ppm Pb(II) removed on day 34, as well as 100% of 500 ppm on day 23. Other concentrations, such as 750 ppm, were 98% removed on day 46, 92% of 1000 ppm on day 54 and 89% of 2000 ppm Pb(II) on day 56. The initial growth increased as the effluent concentration of Pb(II) decreased within the first 5 days, during which, 80 ppm was added to the influent. The system experienced a shock as the system was loaded with a 1000 ppm, but the growth rapidly recovered to just below the previous maximum on day 5, followed by a rapid decrease in growth up until day 17. From the overall trend that was identified, it was clear that the growth was initially inhibited by the shock of each load, but a quick recovery was presented and growth was rapidly promoted by the introduction of Pb(II). This corresponded to the findings in run 1 indicating that the system was nitrate dependent and that the nitrates that were introduced promoted growth [24]. Maximum growth was measured after the second load of 80 ppm was introduced on day 33, after which, the removal of 80 ppm was instantaneously coupled with a considerable amount of microbial growth. This was indicative of the eager use of nitrates available without much inhibition from the Pb(II).
Most of the observed pH values fell in the range reported by Brink et al. and Peens et al. [20,21], which strongly suggests the presence of elemental lead coupled with the presence of a dark grey precipitate. The maximum ORP value recorded for this run was +143 mV and a minimum of +25.2 mV, which agrees with the results of Blanc and Molof [26] and Lee [27] outside the optimal ORP range for anaerobic treatment (−220 to −290 mV). However, according to Mauerhofer et al. [28], this shows that the aforementioned range holds for facultative anaerobes that require at most a −100 mV ORP because strict anaerobes require less than −330 mV. They further reported that higher values of ORP outside the optimum range do not typically imply the death of certain microbes but instead imply the growth impairment of certain species. Dabkowski [25] reports that ORP values ranging from −100 to +100 mV are optimum for anoxic regions, indicating good system performance in the presence of anoxic conditions. The highest removal rate recorded for this run was 1650 mg/(L·d) Pb(II).
2.1.3. Run 3a
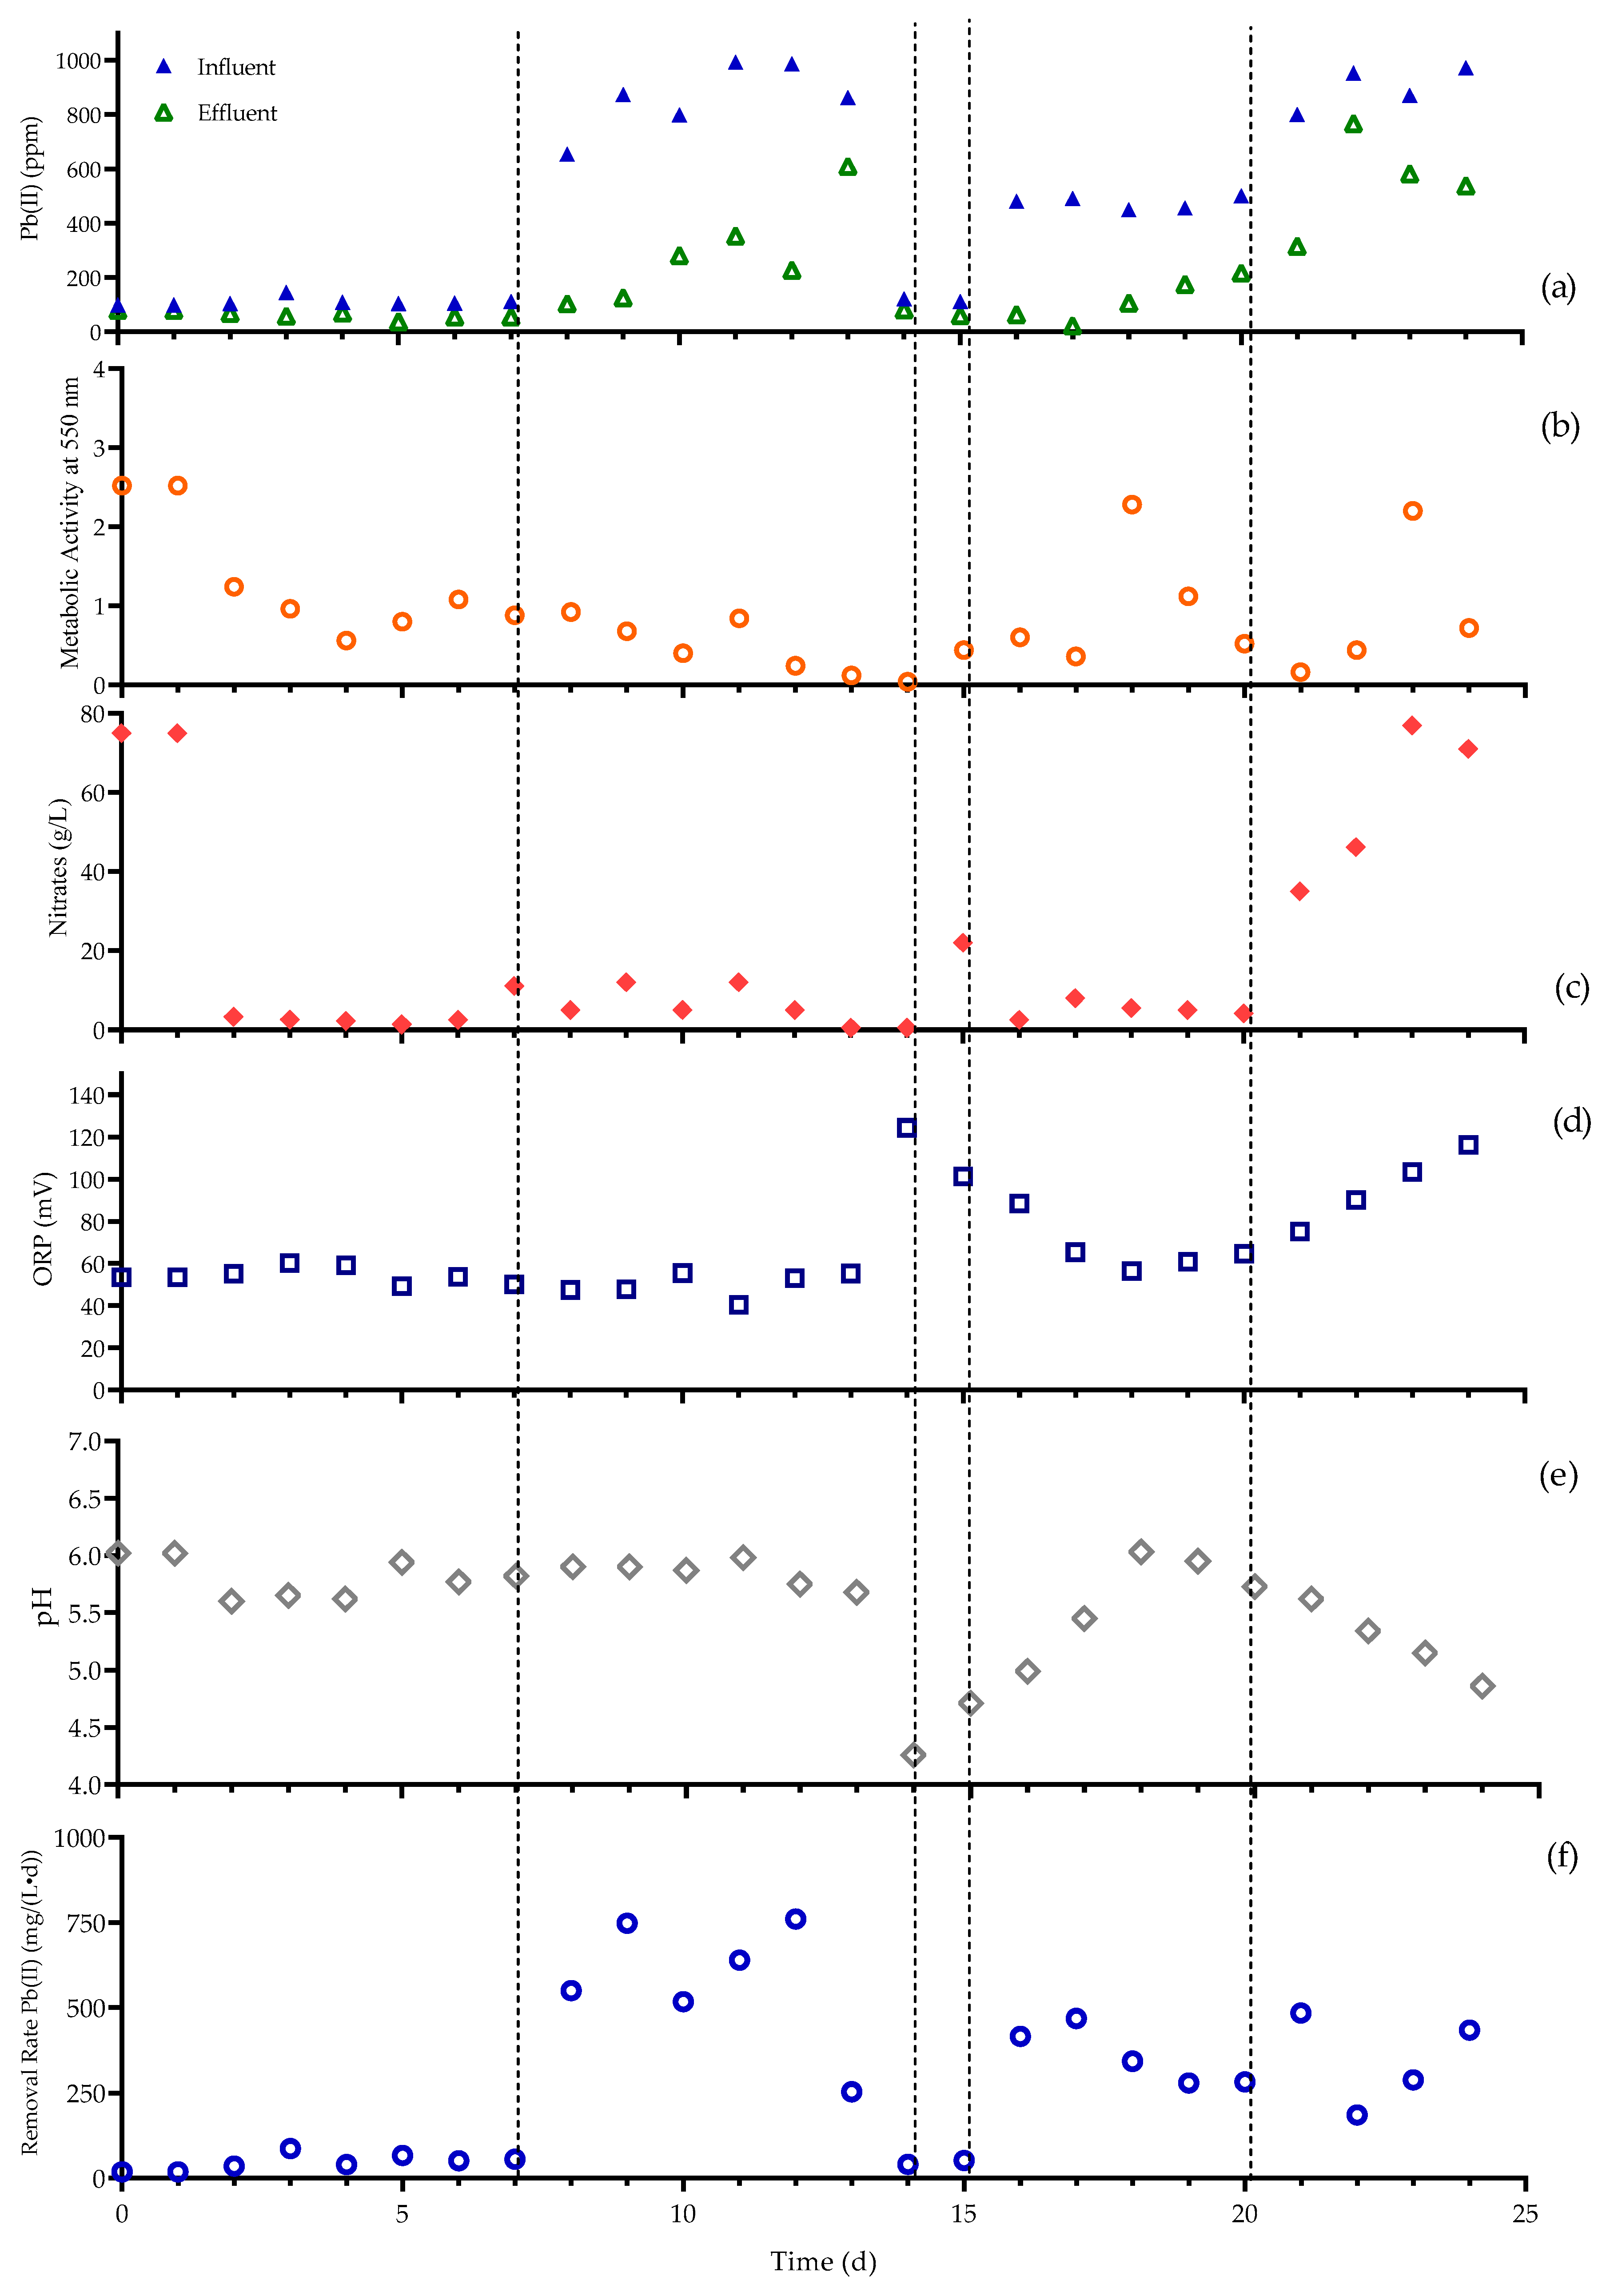
The third experimental run, shown in Figure 4, continued for 24 days and was initially spiked with 100 ppm Pb(II), followed by a load of 750 ppm on day 7, 100 ppm on day 14, 500 ppm on day 15 and, finally, 900 ppm on day 20. Maximum efficiencies of 63% of 100 ppm Pb(II) was achieved on day 5, 85.6% of 750 ppm on day 9, 95% of 500 ppm on day 17 and 60.5% of 900 ppm Pb(II) on day 21. These removal results were relatively consistent with the previous findings, suggesting their repeatability. Similar trends were observed during the first two runs, with an increase in nitrate measurements upon loading, followed by a dramatic decrease. The growth measurements mirrored that of the available nitrates; when the nitrates were depleted, growth was brought to a halt [24]. The only anomaly observed was on day 18, when a spike in growth measurements was presented, coupled with the presence of little to no available nitrates. A reasonable explanation for this lies in the evidence presented by the pH measurements. The pH levels dropped considerably to a minimum of 4.26 just before the spike in growth, which measured outside the range of ideal neutrophilic bacterial growth conditions, which are known to range between 5 and 9 [29]. The spike in growth after the pH recovery would be indicative of ideal conditions and growth was easily maintained once more. The ORP values ranged from a minimum of 40.3 mV and a maximum of 124.3 mV, which was again consistent with the previous experimental runs, indicating an anoxic system rather than a strictly anaerobic system. The maximum removal rate achieved during this run was found to be 760.1 mg/(L·d) Pb(II) (Figure 4f).
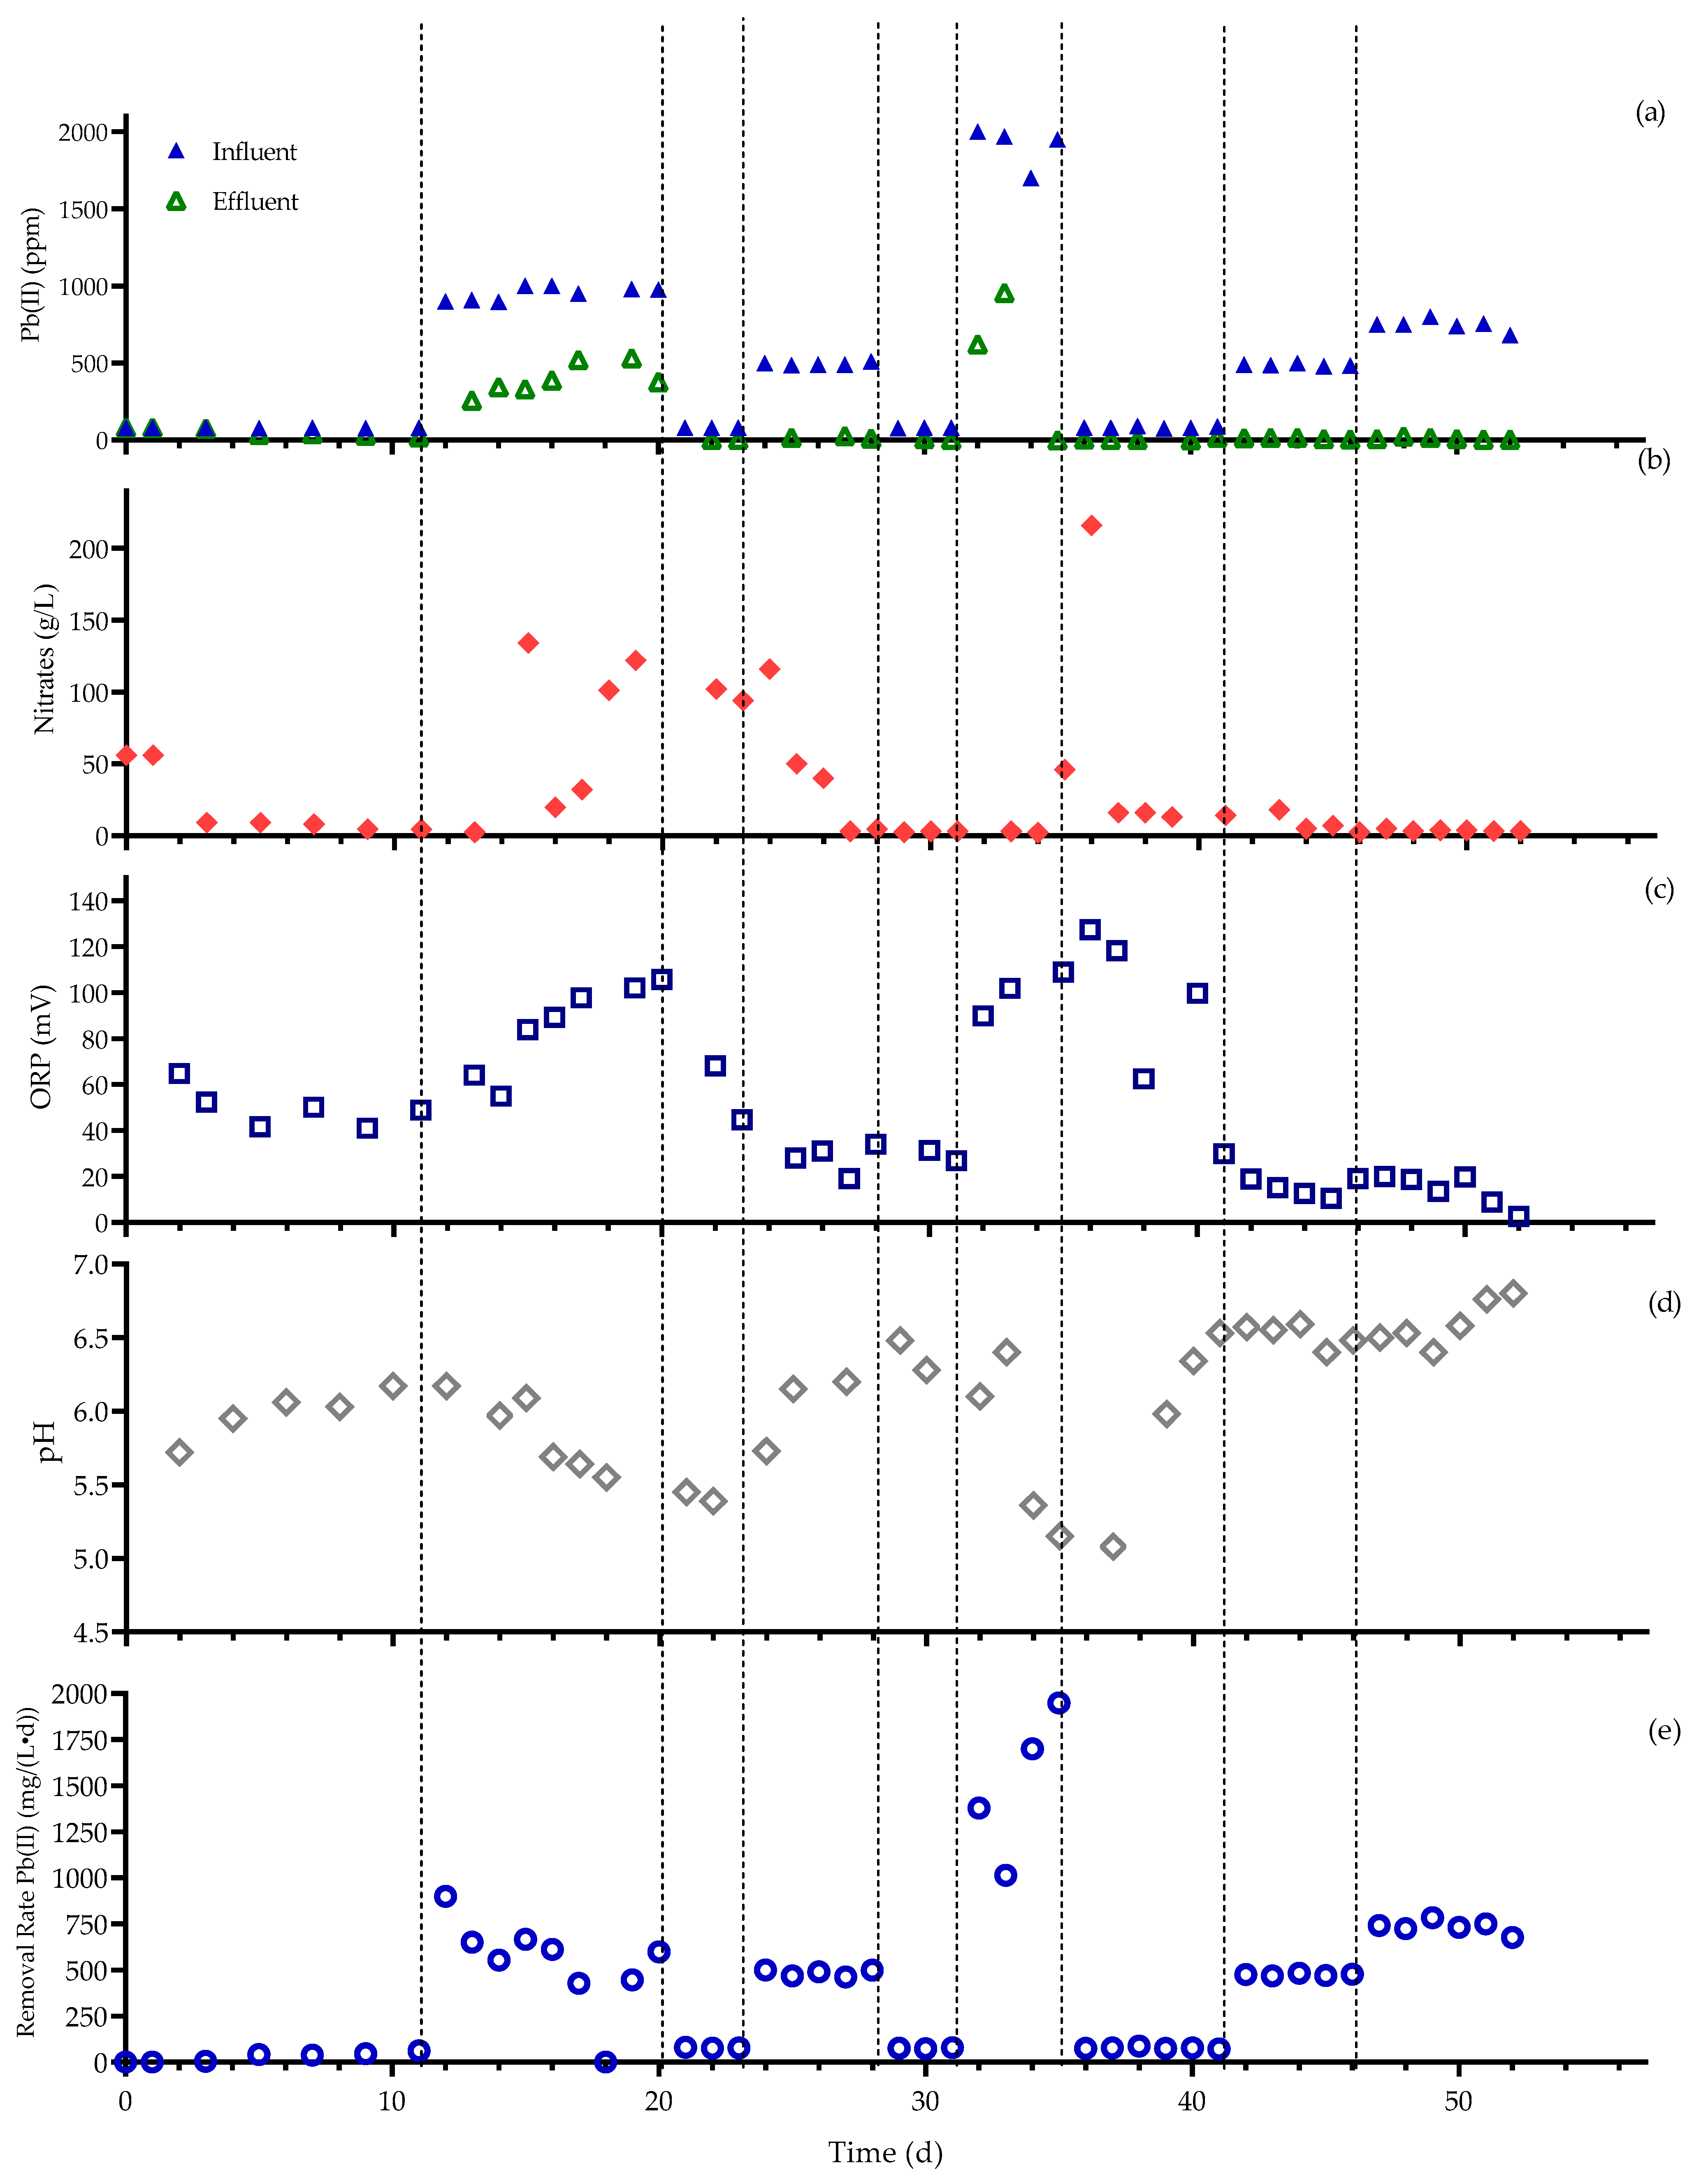
2.1.4. Run 3b
Run 3b, shown in Figure 5, was a continuation of run 3a, which was commenced by unsealing the sealed run 3a reactor and initiating feeding after the South African lockdown of March–Jun 2020 was lifted. This run continued for 52 days. No metabolic activity measurements were taken for this run, as laboratory movement was limited at the time. The run started with a concentration of 80 ppm Pb(II), followed by an increase to 1000 ppm on day 11, 80 ppm on day 20, 500 ppm on day 23, 80 ppm on day 28, 2000 ppm on day 31, 80 ppm on day 35, 500 ppm on day 35 and 750 ppm on day 46. The highest amount of lead removed for 80 ppm was observed on day 38 at 98%, 71.6% for 1000 ppm on day 13, 98.7% for 500 ppm on day 46, 99.9% for 2000 ppm on day 35 and a maximum amount of 99.4% for 750 ppm on day 52. From this run, it was the most apparent that the system was highly robust, with the ability to continue Pb removal and reduction after being sealed with no external nutrition for ≈3 months. In addition, the system easily adapted to certain lower concentrations of lead after being exposed to a higher concentration. The system was exposed to 80 ppm on four occasions. It only removed 75% of 80 ppm the first round, but almost 100% of lead was removed every round thereafter following exposure to a 1000 ppm Pb(II), indicating strong adaption capabilities from the microbial consortium and the system as a whole. The same trend was observed for 500 ppm and 750 ppm. The system removed a considerable amount of 2000 ppm Pb(II) at almost 100%, presenting an overall higher resistance to Pb. The increased resistance can be attributed to this run being a continuation from run 3a, which allowed for more adaption.
The ORP was measured between 2.6 and 127.3 mV, which was once again consistent with an anoxic environment. The pH ranged between a measurement of 5.08 and 6.80, indicating neutrophilic growth conditions for bacteria, as mentioned earlier, and the highest removal rate observed was a staggering 1948.4 mg/(L·d) Pb(II).
2.2. Precipitate Analysis
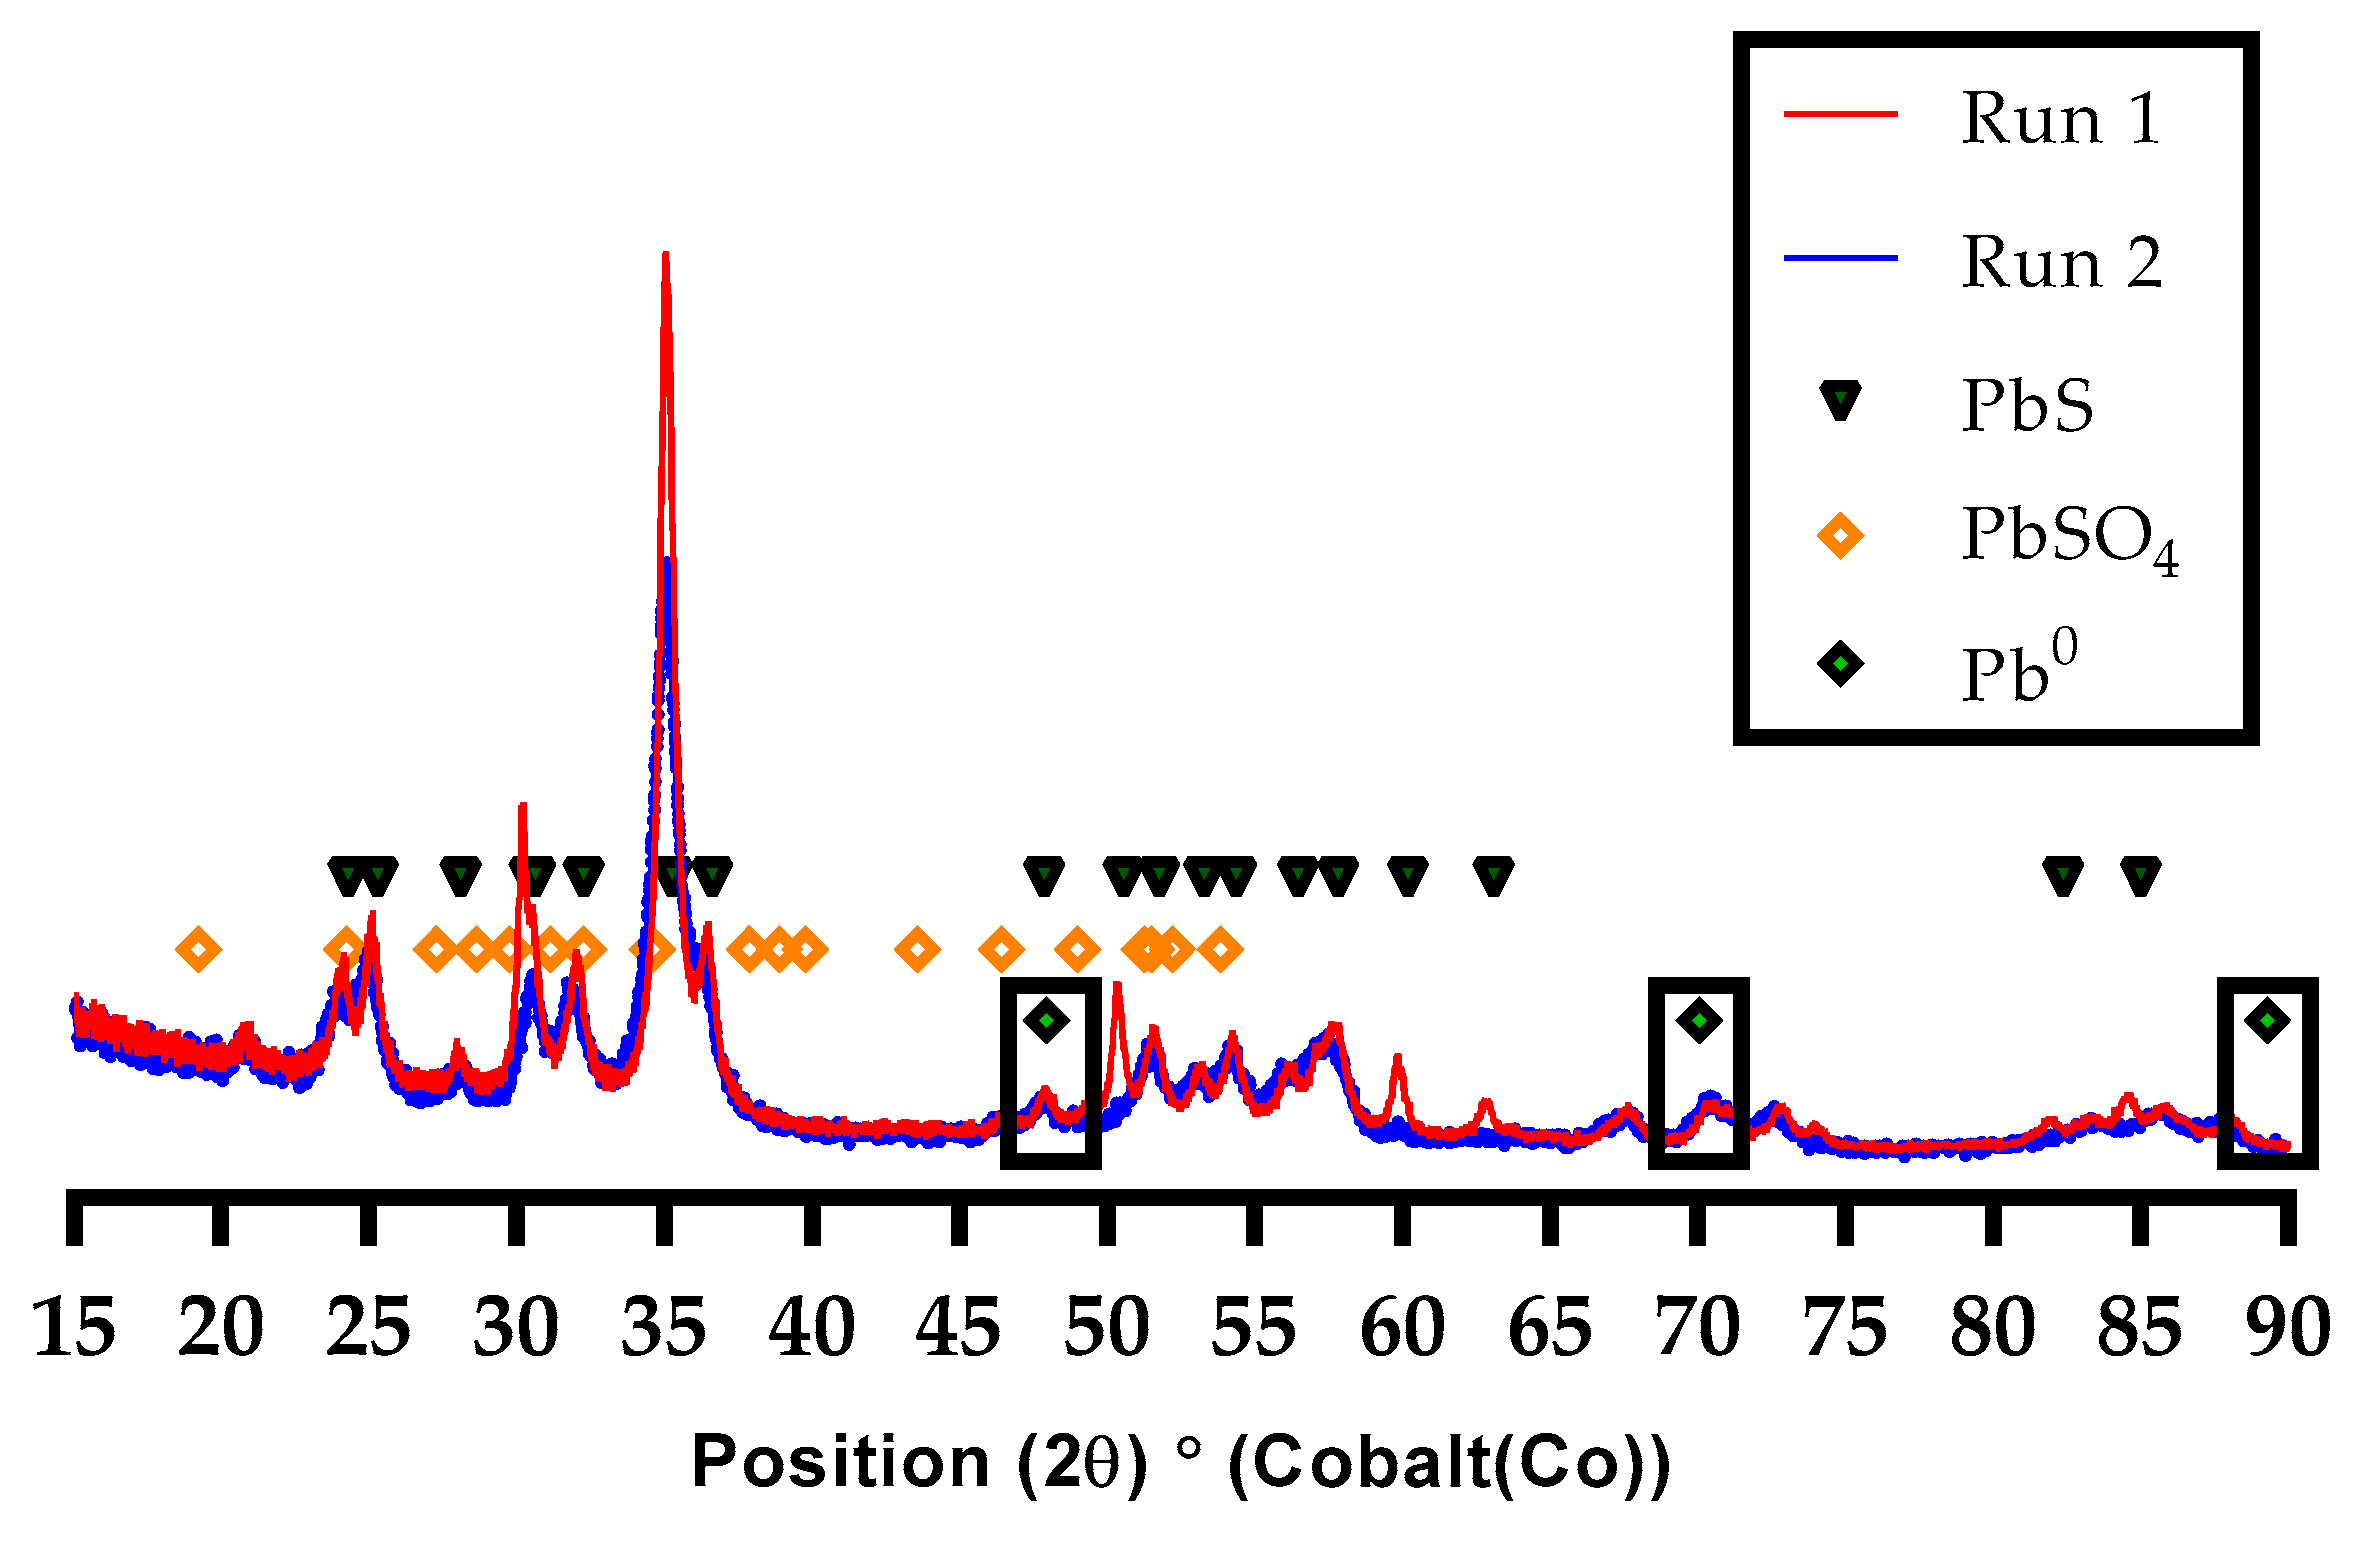
Precipitate analysis was conducted on samples that were collected upon the termination of selected runs with the aid of X-ray diffraction (XRD) (runs 1 and 2) and X-ray photoelectron spectroscopy (XPS) (runs 2 and 3b).
The results from the XRD analysis are presented in Figure 6 below. Both runs 1 and 2 exhibited similar results. Three predominant lead species were identified, namely, PbS, PbSO4 and Pb0. The results presented three peaks identified as Pb0, of which, one overlapped with PbS, as opposed to the other two, which were isolated from any of the other species, positively indicating the identity as elemental lead. The presence of PbS and PbSO4 was previously attributed to the probable release of sulphur by the microorganisms during an anaerobic denitrification metabolism. It was proposed that sulphur is released during anaerobic denitrification and the use of two sulphur-containing amino acids, cysteine and methionine, with the aid of the enzyme nitrate reductase. The free sulphur was in turn bound with Pb to form PbS and PbSO4 in the presence of oxygen [24].
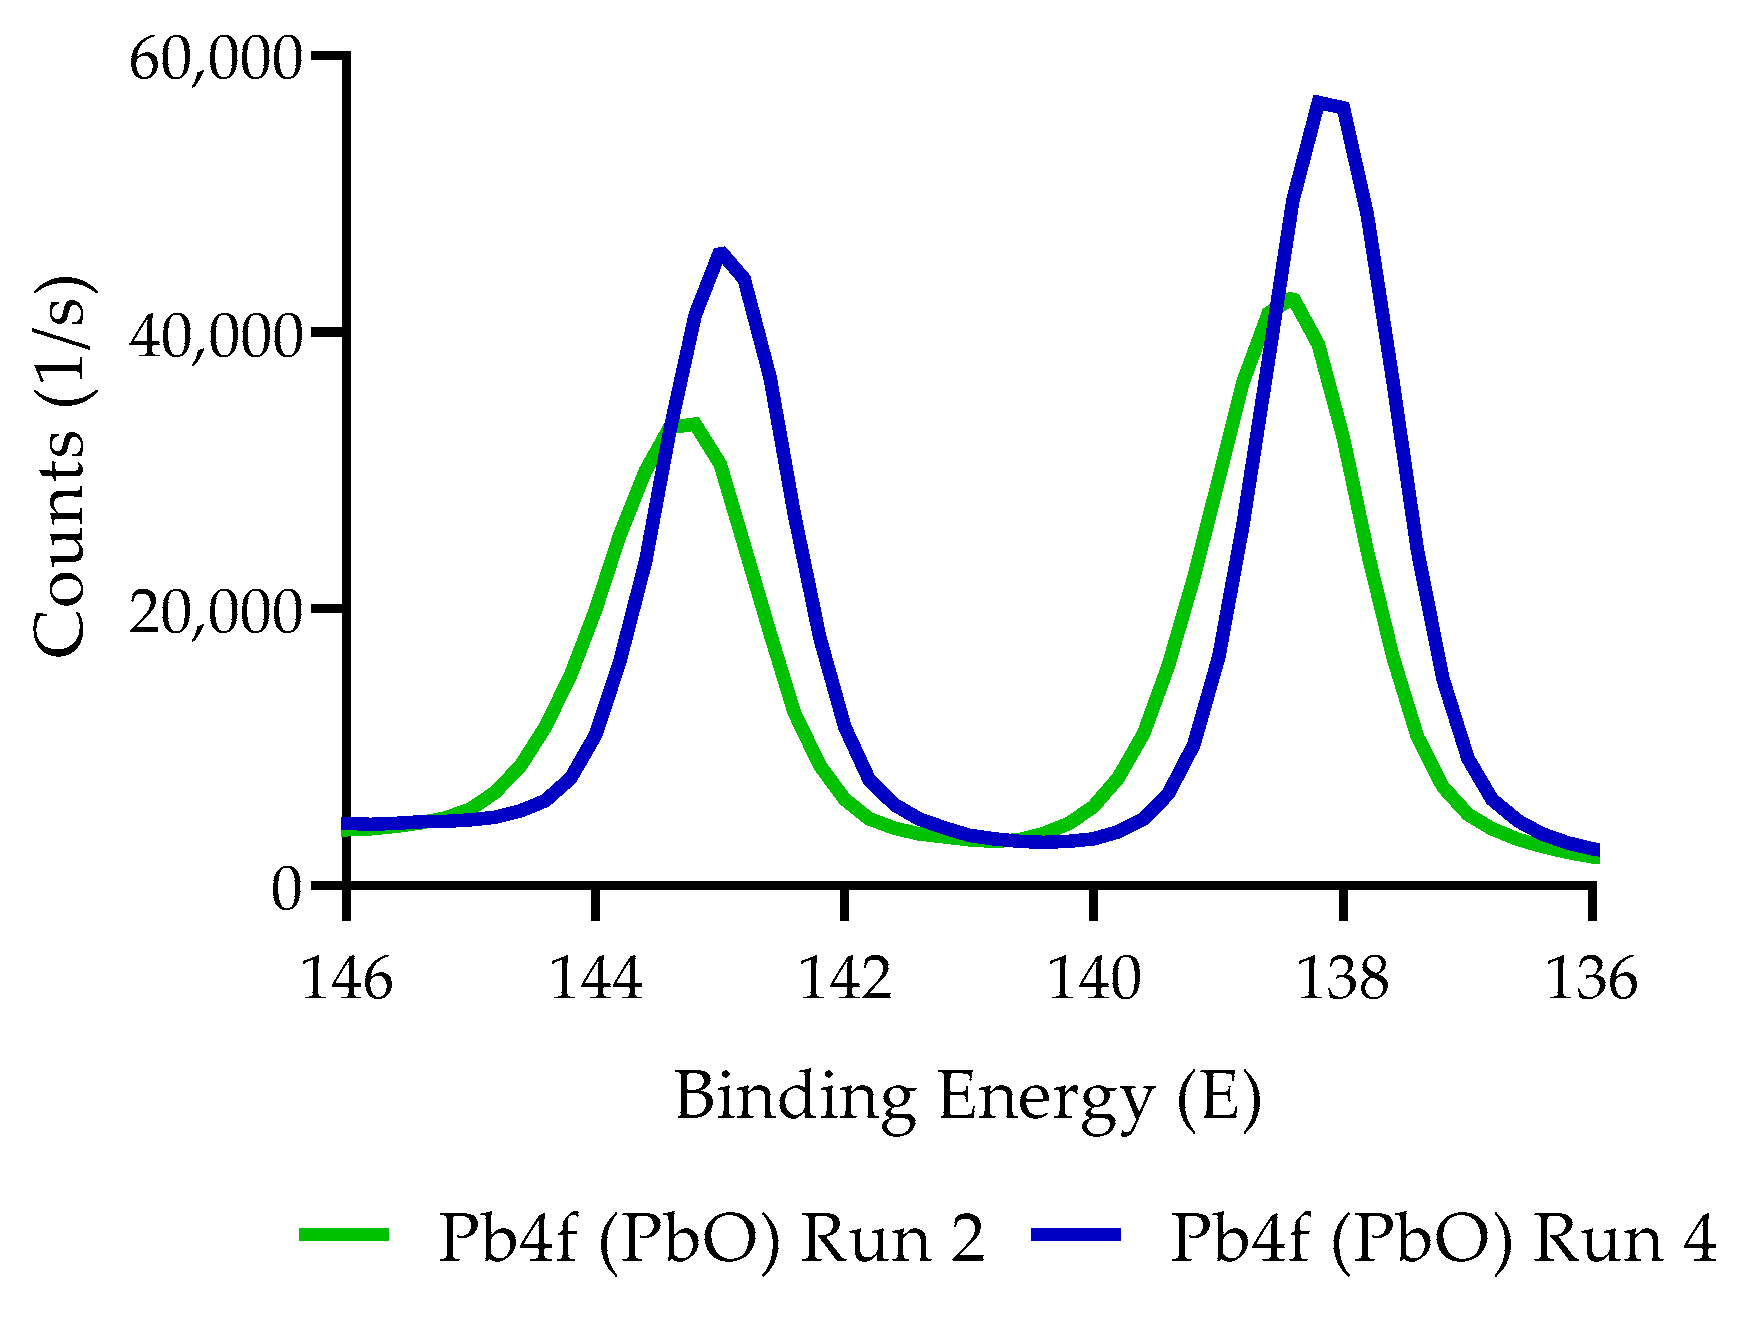
The results for the XPS analysis for runs 2 and 3b are presented in Figure 7 below. The presence of Pb0 was not detected in these samples, just like in the results found for XRD. It was reported in a previous study by this team that the oxidation of elemental lead to PbO is highly likely in a system containing any oxygen [30]. The ORP measurements throughout the experimentation suggested an anoxic system, as well as the possibility of oxygen ingress in the sample during sample preparation, which were both likely contributors to the oxidation of Pb0 to PbO. Run 2 was analysed using both XRD and XPS and was used as a link between the two analyses. Run 3b was additionally analysed with XPS to verify the repeatability. These findings positively indicated the presence of elemental lead that was produced by the continuous system.
2.3. Comparison with Other Studies
The percentage removal efficiencies and removal rates from this and other relevant studies are summarised and compared in Table 1 below. The removal rates were calculated from each of the studies using the reactor size, hydraulic retention time and maximum Pb(II) removed at any given time. The novelty of the current study rests on two factors, namely, the extreme Pb(II) concentrations that the system can not only withstand but also remove to minute levels (up to 99.9 % removal efficiency). Other studies exhibited removal rates that were considerably smaller compared to the current study, with removal rates ranging between 0.8 and 49.5 mg/(L·d) as opposed to the 1948.4 mg/(L·d) measured in the current study. The other key highlight of this study was that no other study to the authors’ knowledge presents evidence of continuous lead reduction to the zero valence state (Pb0).
3. Materials and Methods
3.1. Materials
Yeast extract (Sigma Aldrich, St Louis, MO, USA) was used as the sole carbon source and Pb(NO3)2 (Merck, Johannesburg, South Africa) as a Pb(II) source. The 3-(4,5-dimethylthiazol-2-yl)-2,5-diphenyl tetrazolium bromide (MTT) and dimethyl sulfoxide (DMSO) (Sigma Aldrich, St. Louis, MO, USA) was employed for the growth measurements (metabolic activity).
3.2. Preculture
An 80 ppm preculture was prepared by adding 8 mL of 10,000 ppm lead nitrate stock solution to a 992 mL yeast extract. The solution was inoculated by adding 1 mL preculture of the industrially obtained consortia by Brink et al. [21]. The preculture was cultured from a contaminated soil sample that was collected from a borehole at an automotive battery recycling plant in Gauteng, South Africa. The microbial consortium was analysed and characterised in a previous study, where Klebsiella pneumoniae and Clostridium bifermentans were identified as the two main species of bacteria that were responsible for the Pb(II) bioremoval and precipitation [24].
3.3. UASB Reactor Operation
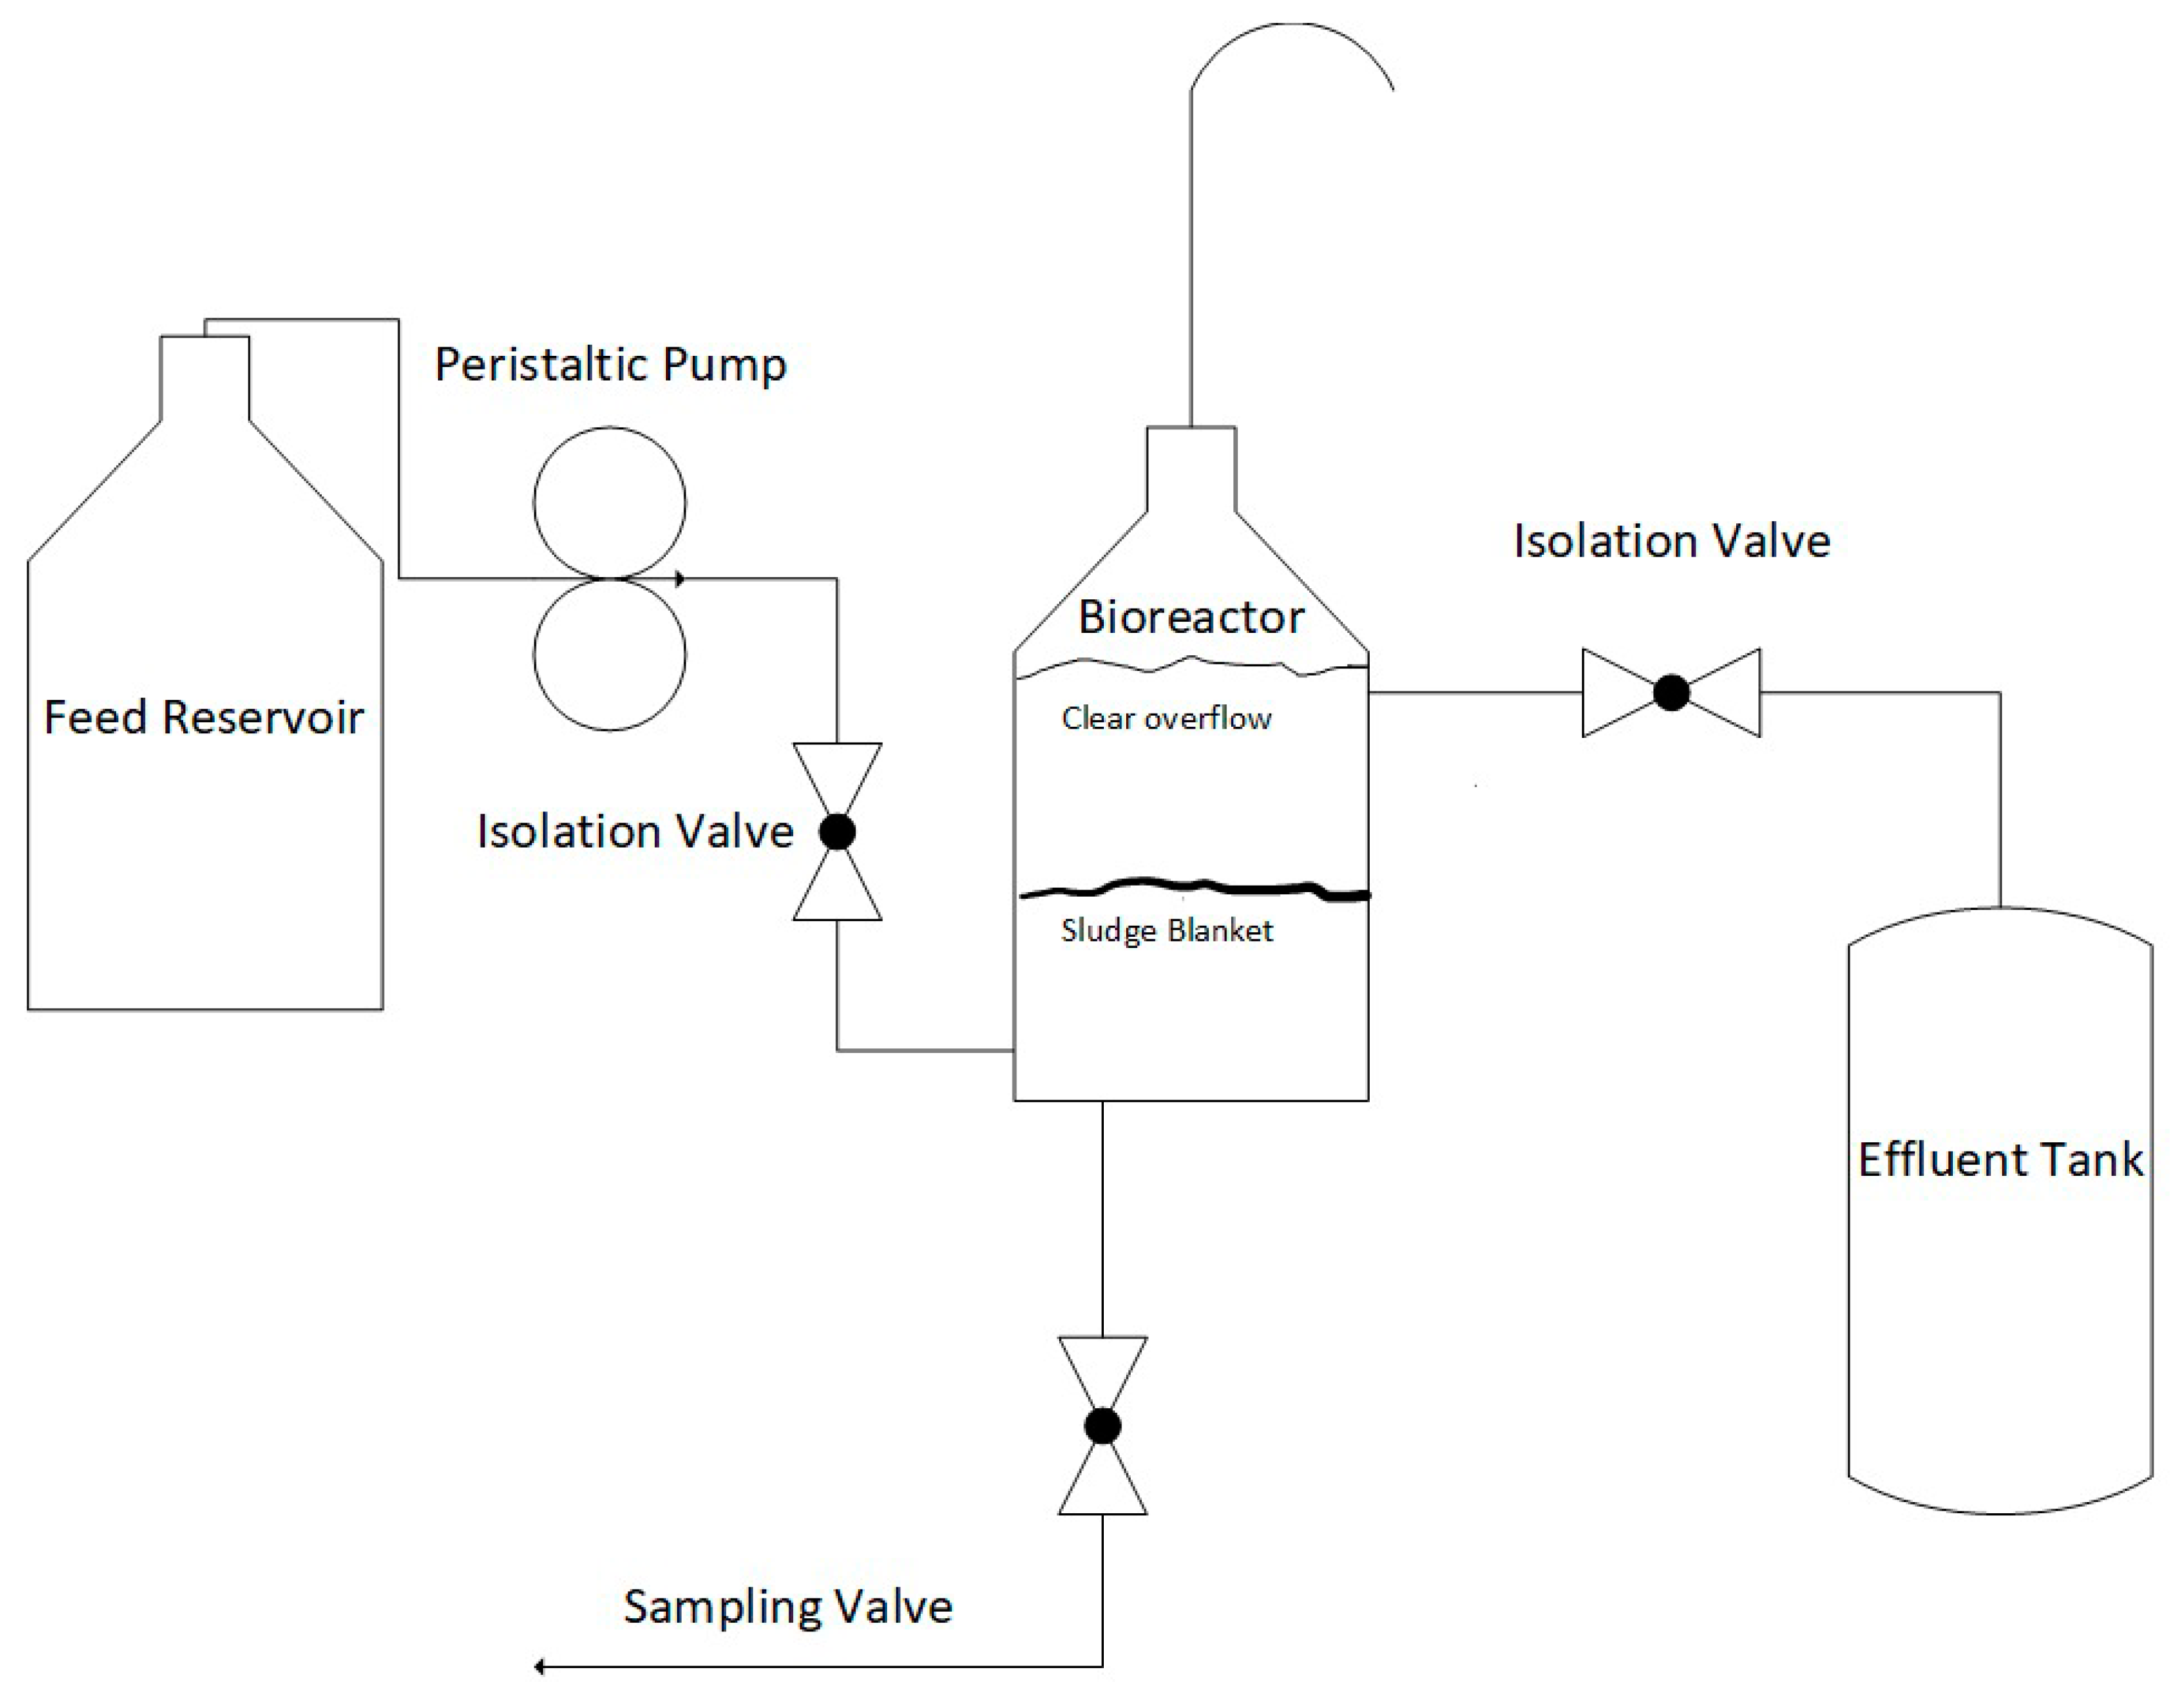
The components of the designed UASB reactor (shown in Figure 8 below) consisted of a 1 L supply tank, a 1 L production tank and a 5 L effluent tank. All the reactor runs were performed in a reactor box with a heater (magnetic stirrer: WiseStir MSG-20D Witeg Labortechnik GmbH, Wertheim, Germany) and a thermometer (Glassworld, Johannesburg, South Africa). Daily temperature checks were done to monitor the mesophilic condition in the range of 30 to 35 °C for a conducive microbial growth environment. The reactor runs were performed for a hydraulic retention time (HRT) of 1 day. The previous studies by Velasco et al. and Gopi Kiran et al. [31,36] made use of a 4-day HRT. However, for this research, a reduced HRT (1 day) was chosen to investigate whether the employed bacteria could give satisfactory results at this value and enhance the economic feasibility of the project by reducing the reactor size. A constant flow rate of 1 L/d was used and the reservoir feed consisted of a mixture of both yeast extract and Pb(II) stock solution at the desired concentration. All the plastic and glassware were autoclaved for sterilisation before the reactor setup.
The preculture at 80 ppm was initially prepared, as described earlier. The production reactor was then subjected to nitrogen purging for 3 min [8], placed in the reactor box and stirred at 120 rpm. A dark grey precipitate was observed after 72 h, signifying good microbial growth and significant Pb(II) bioremoval. To allow for the initial formation of the sludge blanket, the stirrer was stopped and the tank’s contents were given 10 h of settling time. Subsequently, the full system was connected and ran while different Pb(II) concentrations were periodically fed to the production reactor in upflow mode at a rate of 1 L/d.
3.4. Sampling and Analysis
Prior to sampling, the sampling tap was washed with ethanol and rinsed with distilled water. A 15 mL sample was collected daily and analysed for metabolic activity (MA), pH, ORP, nitrates and dissolved Pb(II) removal. Metabolic activity was measured at a wavelength of 550 nm using a spectrophotometer (Lightwave II, WPA Labotech, Johannesburg, South Africa). A PL-700 Series Bench Top meter (Labotech, Johannesburg, South Africa) was used to measure the pH and ORP of the samples. Nitrate reduction was photometrically analysed using Nitrate Test Kits (Merck, Darmstadt, Germany) and the Spectroquant Nova 600 (Merck, Darmstadt, Germany). An Atomic Absorption Spectrometer (Perkin Elmer AAnalyst 400, Waltham, MA, USA) was used to measure the dissolved Pb(II) concentrations of the samples as a measure of Pb(II) removal. The collected precipitate was subjected to X-ray diffraction analysis. Before the XRD analysis, the precipitate from experimental run 1 was normally dried and ground. However, for experimental run 2, the precipitate was split into two portions, with the one being normally dried and grounded and the other one being washed with ethanol, oven-dried and ground to determine whether a significant influence on the precipitate characterisation via the processing method could be observed. XPS (X-ray photoelectron spectroscopy) (Thermo ESCAlab 250 Xi, Waltham, MA, USA) analysis was also used to identify the species present in the precipitate. The collected precipitate was dried in a sterilised desiccator that was filled with silica crystals (Glassworld, Johannesburg, South Africa) 48 h before the analysis. The desiccator was set up anaerobically using an AnaeroGen pouch (Oxoid Ltd., Basingstoke, U.K.),
4. Conclusions
This paper describes the preliminary development of a UASB reactor that was operated under anoxic conditions with a yeast extract as the sole growth medium. It was confirmed that the yeast extract could be used for continuous Pb(II) bioremoval. The system was shown to be successful in the continuous removal of lead between 90 and 100% with concentrations of lead ranging between 80 and 2000 ppm. Concentrations as high as 2000 ppm Pb(II) were easily removed at an efficiency of 99.9% with a maximum Pb(II) removal rate of up to 1948.4 mg/(L·d), showing advanced removal and adaptive capabilities by the system. The design also presented resilience to harsh conditions, such as substrate limitation for prolonged periods, making it ideal for real industrial working conditions.
The growth was closely monitored and was shown to be highly adaptable to Pb inlet concentrations [24,37]. Initially, the growth decreased upon immediate exposure to lead, but rapidly recovered and increased dramatically. When the system reached the point of adaption, little to no decrease was observed in the initial growth, indicating resilience. The ORP measurements indicated an anoxic system rather than a strict anaerobic system, indicating more practical industrial application, as it is difficult to maintain an anaerobic system during large-scale operation, making the system more user friendly and hardy.
The presence of PbS, PbO, PbSO4 and elemental lead was found in the various precipitates that were analysed. The presence of PbO was indicative of Pb0 as the oxidation of elemental lead to lead oxide was shown to be highly likely.
The design and implementation of this system can be refined and optimised for future continuous industrial applications. The focus of future design should be on maximising the amount of elemental lead produced and, in doing so, proposing a novel concept for lead removal.
The authors have successfully demonstrated the first known continuous operation of a simultaneous Pb(II) bioprecipitation and bioreduction system using a microbial biocatalyst. The system was able to remove significantly high concentrations of Pb(II) at rapid removal rates with the aid of the industrially obtained microbial consortium.
Author Contributions
Conceptualisation, J.C. and H.G.B.; methodology, J.C.; investigation, J.C. and C.H.; resources, H.G.B.; data curation, J.C.; formal analysis, J.C., C.H., H.G.B. and E.M.N.C.; writing—original draft preparation, J.C., C.H. and H.G.B.; writing—review and editing, J.C., C.H. and H.G.B.; supervision, H.G.B. and E.M.N.C.; funding acquisition, J.C., H.G.B. and E.M.N.C. All authors have read and agreed to the published version of the manuscript.
Funding
This research was funded by the DAAD In-Region University of Pretoria, South Africa, 2019 program, grant number 57472283, and The National Research Foundation (NRF) of South Africa, grant number 121891.
Data Availability Statement
The data presented in this study are openly available in the University of Pretoria Research Data Repository at DOI:10.25403/UPresearchdata.14445597.
Acknowledgments
The authors would like to express gratitude to Wiebke Grote, the X-ray diffraction analyst at the University of Pretoria, for helping with the XRD analysis for the precipitate obtained in this research.
Conflicts of Interest
The authors declare no conflict of interest.
References
- Chatterjee, S.; Mukherjee, A.; Sarkar, A.; Roy, P. Bioremediation of lead by lead-resistant microorganisms, isolated from industrial sample. Adv. Biotechnol. 2014, 3, 290–295. [Google Scholar] [CrossRef] [Green Version]
- Kundu, D.; Mondal, S.; Dutta, D.; Haque, S.; Ghosh, A.R. Accumulation and contamination of lead in different trophic levels of food chain in sewage-fed East Kolkata Wetland, West Bengal, India. Int. J. Environ. Technol. Sci. 2016, 2, 61–68. [Google Scholar]
- Tiquia-Arashiro, S.M. Lead absorption mechanisms in bacteria as strategies for lead bioremediation. Appl. Microbiol. Biotechnol. 2018, 102, 5437–5444. [Google Scholar] [CrossRef]
- Brink, H.G.; Mahlangu, Z. Microbial Lead (II) precipitation: The influence of growth substrate. Chem. Eng. Trans. 2018, 64, 439–444. [Google Scholar]
- Naik, M.M.; Dubey, S.K. Ecotoxicology and Environmental Safety Lead resistant bacteria: Lead resistance mechanisms, their applications in lead bioremediation and biomonitoring. Ecotoxicol. Environ. Saf. 2013, 98, 1–7. [Google Scholar] [CrossRef] [PubMed]
- Arbabi, M.; Hemati, S.; Amiri, M. Removal of lead ions from industrial wastewater: A review of Removal methods. Int. J. Epidemiol. 2015, 2, 105–109. [Google Scholar]
- Mathee, A.; Khan, T.; Naicker, N.; Kootbodien, T. Lead exposure in young school children in South African subsistence fishing communities. Environ. Res. 2013, 126, 179–183. [Google Scholar] [CrossRef] [PubMed]
- Hörstmann, C.; Brink, H.G. Microbial lead (II) Precipitation: The Influence of Aqueous Zn (II) and Cu (II). Chem. Eng. Trans. 2019, 74, 1447–1452. [Google Scholar]
- Cleveland, L.M.; Minter, M.L.; Cobb, K.A.; Scott, A.A.; German, V.F. Lead Hazards for and Children: Part 1. Am. J. Nurs. 2008, 108, 40–50. [Google Scholar]
- Needleman, H. Lead poisoning. Annu. Rev. Med. 2004, 55, 209–222. [Google Scholar] [CrossRef] [PubMed] [Green Version]
- Wani, A.L.; Ara, A.; Usmani, J.A. Lead toxicity: A review. Interdiscip. Toxicol. 2015, 8, 55–64. [Google Scholar] [CrossRef] [Green Version]
- Patrick, L. Lead Toxicity, A Review of the Literature. Part 1: Exposure, Evaluation, and Treatment. Altern. Med. Rev. 2006, 11, 1–22. [Google Scholar]
- Radziemska, M. Phytostabilization—Management Strategy for Stabilizing Trace Elements in Contaminated Soils. Int. J. Environ. Res. Public Health 2017, 14, 958. [Google Scholar] [CrossRef] [PubMed] [Green Version]
- Zul, U.; Farooq, M.; Hussain, S.; Maqsood, M.; Hussain, M.; Ishfaq, M.; Ahmad, M.; Zohaib, M. Lead toxicity in plants: Impacts and remediation. J. Environ. Manag. 2019, 250, 1–21. [Google Scholar]
- Pourrut, B.; Shahid, M.; Dumat, C.; Winterton, P.; Pinelli, E. Lead Uptake, Toxicity, and Detoxification in Plants. Rev. Environ. Contam. Toxicol. 2012, 213, 113–136. [Google Scholar]
- ILA-International Lead Association. Available online: https://www.ila-lead.org/lead-facts/lead-production--statistics (accessed on 1 June 2020).
- Statista Lead Reserves Worldwide as of 2018. Available online: https://0-www-statista-com.brum.beds.ac.uk/statistics/273652/global-lead-reserves-by-selected-countries (accessed on 6 December 2020).
- Adeniji, A. Bioremediation of Arsenic, Chromium, Lead, and Mercury; US Enviromental Protection Agency Office of Solid Waste and Emergency Response Technology Innovation Office: Washington, DC, USA, 2004.
- Brink, H.G.; Hörstmann, C.; Feucht, C.B. Microbial Pb (II) Precipitation: Minimum Inhibitory Concentration and Precipitate Identity. Chem. Eng. Trans. 2019, 74, 1453–1458. [Google Scholar]
- Pan, X.; Zhang, D.; Fu, Q. Bioremediation of Pb-Contaminated Soil Based on Microbially Induced Calcite Precipitation. J. Microbiol. Biotechnol. 2012, 22, 244–247. [Google Scholar]
- Brink, H.G.; Lategan, M.; Naudé, K.; Chirwa, E.M.N. Lead removal using industrially sourced consortia: Influence of lead and glucose concentrations. Chem. Eng. Trans. 2017, 57, 409–414. [Google Scholar]
- Peens, J.; Wu, Y.W.; Brink, H.G. Microbial Pb (II) Precipitation: The Influence of Elevated Pb (II) Concentrations. Chem. Eng. Trans. 2018, 64, 583–588. [Google Scholar]
- Hörstmann, C.; Naidoo, S.; Brink, H.G.; Chirwa, E.M.N. Microbial Pb (II) Precipitation: Yeast Extract Autolyzed from Saccharomyces Cerevisiae as a Sustainable Growth Substrate. Chem. Eng. Trans. 2020, 74, 421–426. [Google Scholar]
- Hörstmann, C.; Brink, H.G.; Chirwa, E.M.N. Pb (II) bio-removal, viability, and population distribution of an industrial microbial consortium: The effect of Pb (II) and nutrient concentrations. Sustainability 2020, 12, 2511. [Google Scholar] [CrossRef] [Green Version]
- Dabkowski, B. Applying Oxidation Reduction Potential Sensors in Biological Nutrient Removal Systems. In Proceedings of the Water Environment Federation, WEFTEC, Washington, DC, USA, 29 October–2 November 2005. [Google Scholar]
- Blanc, F.C.; Molof, A.H.; Molof, H. Electrode electrolytic digestion potential control monitoring in anaerobic digestion. J. Water Pollut. Control Fed. 2015, 45, 655–667. [Google Scholar]
- Lee, S.J. Relationship between Oxidation Reduction Potential (ORP) and Volatile Fatty Acid (VFA) Production in the Acid-Phase Anaerobic Digestion. Master’s Thesis, The University of Canterbury, Christchurch, New Zealand, January 2008. [Google Scholar]
- Mauerhofer, L.; Pappenreiter, P.; Paulik, C.; Seifert, A.H.; Bernacchi, S.; Rittmann, S.K.R. Methods for quantification of growth and productivity in anaerobic microbiology and biotechnology. Folia Microbiol. 2019, 64, 321–360. [Google Scholar] [CrossRef] [PubMed] [Green Version]
- Jin, Q.; Kirk, M.F. pH as a Primary Control in Environmental Microbiology: 1. Thermodynamic Perspective. Front. Environ. Sci. 2018, 6, 21. [Google Scholar] [CrossRef]
- Brink, H.G.; Hörstmann, C.; Peens, J. Microbial Pb (II)-precipitation: The influence of oxygen on Pb (II)-removal from aqueous environment and the resulting precipitate identity. Int. J. Environ. Sci. Technol. 2019, 17, 409–420. [Google Scholar] [CrossRef]
- Velasco, A.; Ram, M.; Volke-sep, T.; Gonz, A. Evaluation of feed COD/sulfate ratio as a control criterion for the biological hydrogen sulfide production and lead precipitation. J. Hazard. Mater. 2008, 151, 407–413. [Google Scholar] [CrossRef] [PubMed]
- Villa-Gomez, D.; Ababneh, H.; Papirio, S.; Rousseau, D.P.; Lens, P.N.L. Batch and continuous removal of heavy metals from industrial effluents using microbial consortia. Int. J. Environ. Sci. Technol. 2017, 14, 1169–1180. [Google Scholar]
- Lens, P.N.L.; Pol, L.H. Principles and Engineering: Environmental Technologies to Treat. In Sulfur Pollution, 1st ed.; IWA Publishing: London, UK, 2000; pp. 156–169. [Google Scholar]
- Somlev, V.; Banov, M. Three stage process for complex biotechnological treatment of industrial wastewater from uranium mining. Biotechnol. Technol. 1998, 12, 637–639. [Google Scholar] [CrossRef]
- Steed, V.S.; Suidan, M.T.; Gupta, M.; Miyahara, T.; Carolyn, M.; Sayles, G.D. Development Biological Metals from of Process a Sulfate-Reducing to Remove Mine Drainage Heavy Acid. Water Environ. Res. 2016, 72, 530–535. [Google Scholar] [CrossRef]
- Kiran, M.G.; Pakshirajan, K.; Das, G. An overview of sulfidogenic biological reactors for the simultaneous treatment of sulfate and heavy metal rich wastewater. Chem. Eng. Sci. 2016, 158, 606–620. [Google Scholar] [CrossRef]
- Hörstmann, C.; Brink, H.G.; Chirwa, E.M.N. Microbial Pb (II) Precipitation: Kinetic modelling of Pb (II) removal and microbial growth. Comput. Aided Chem. Eng. 2020, 48, 661–666. [Google Scholar]
Figure 1.
Experimental timeline and loading conditions for each run.

Figure 2.
The lead level (a), metabolic activity (b), ORP (c), pH (d) and Pb(II) removal rate (e) over time for run 1.
Figure 2.
The lead level (a), metabolic activity (b), ORP (c), pH (d) and Pb(II) removal rate (e) over time for run 1.

Figure 3.
The lead level (a), metabolic activity (b), nitrate measurements (c), ORP (d), pH (e) and Pb(II) removal rate (f) over time for run 2.
Figure 3.
The lead level (a), metabolic activity (b), nitrate measurements (c), ORP (d), pH (e) and Pb(II) removal rate (f) over time for run 2.

Figure 4.
The lead level (a), metabolic activity (b), nitrate measurements (c), ORP (d), pH (e) and Pb(II) removal rate (f) over time for run 3a.
Figure 4.
The lead level (a), metabolic activity (b), nitrate measurements (c), ORP (d), pH (e) and Pb(II) removal rate (f) over time for run 3a.

Figure 5.
The lead level (a), nitrate measurements (b), ORP (c), pH (d) and Pb(II) removal rate (e) over time for run 3b.
Figure 5.
The lead level (a), nitrate measurements (b), ORP (c), pH (d) and Pb(II) removal rate (e) over time for run 3b.

Figure 6.
Comparison of the XRD profiles of precipitates harvested from runs 1 and 2.

Figure 7.
XPS analysis of the precipitate harvested from runs 2 and 3b.

Figure 8.
The UASB reactor.


Table 1.
Percentage removal efficiencies, removal rates and system types of various known studies.
| Mechanism | System | Maximum Pb(II) Concentration Tested (mg/L) | Maximum Pb(II) Removal Efficiency (%) | Maximum Pb(II) Removal Rate (mg/(L·d)) | References |
|---|---|---|---|---|---|
| Lead-reducing microbial consortium | UASB reactor with a throughflow | 2000 | 99.9 | 1948.4 | Current study |
| Sulphate-reducing bacteria | UASB reactor with recirculation | 200 | 99.0 | 49.5 | [31] |
| Sulphate-reducing bacteria | Inversed fluidised bed reactor | 10 | 97.3 | 9.73 | [32] |
| Sulphate-reducing bacteria | Anaerobic filter with plastic pall rings | 18 | 90 | 32.4 | [33] |
| Sulphate-reducing bacteria | Three-stage system with recirculation | 0.2 | 90 | 0.64 | [34] |
| Sulphate-reducing bacteria | Anaerobic filter reactor | 1.5 | 99.9 | 0.18 | [35] |
Publisher’s Note: MDPI stays neutral with regard to jurisdictional claims in published maps and institutional affiliations. |
© 2021 by the authors. Licensee MDPI, Basel, Switzerland. This article is an open access article distributed under the terms and conditions of the Creative Commons Attribution (CC BY) license (https://creativecommons.org/licenses/by/4.0/).
Share and Cite
MDPI and ACS Style
Chimhundi, J.; Hörstmann, C.; Chirwa, E.M.N.; Brink, H.G. Microbial Removal of Pb(II) Using an Upflow Anaerobic Sludge Blanket (UASB) Reactor. Catalysts 2021, 11, 512. https://0-doi-org.brum.beds.ac.uk/10.3390/catal11040512
AMA Style
Chimhundi J, Hörstmann C, Chirwa EMN, Brink HG. Microbial Removal of Pb(II) Using an Upflow Anaerobic Sludge Blanket (UASB) Reactor. Catalysts. 2021; 11(4):512. https://0-doi-org.brum.beds.ac.uk/10.3390/catal11040512
Chicago/Turabian StyleChimhundi, Jeremiah, Carla Hörstmann, Evans M. N. Chirwa, and Hendrik G. Brink. 2021. "Microbial Removal of Pb(II) Using an Upflow Anaerobic Sludge Blanket (UASB) Reactor" Catalysts 11, no. 4: 512. https://0-doi-org.brum.beds.ac.uk/10.3390/catal11040512
Note that from the first issue of 2016, this journal uses article numbers instead of page numbers. See further details here.