Article

Influence of Bio-Based Surfactants on TiO2 Thin Films as Photoanodes for Electro-Photocatalysis

by
Fanny Duquet
1,
Amr Ahmed Nada
1,2,
Matthieu Rivallin
1,
Florence Rouessac
1,
Christina Villeneuve-Faure
3 and
Stéphanie Roualdes
1,*
1
Institut Européen des Membranes (IEM), UMR-5635, University Montpellier, ENSCM, CNRS, 34095 Montpellier, France
2
Department of Analysis and Evaluation, Egyptian Petroleum Research Institute, Cairo 11727, Egypt
3
LAPLACE, Université de Toulouse, UPS, CNRS, INPT, 31062 Toulouse, France
*
Author to whom correspondence should be addressed.
Submission received: 3 September 2021 / Revised: 29 September 2021 / Accepted: 5 October 2021 / Published: 12 October 2021

Abstract

:
Photocatalytic water splitting into hydrogen is considered as one of the key solutions to the current demand for eco-responsible energy. To improve the efficiency and sustainability of this process, the development of a TiO2-based photoanode by adding bio-sourced surfactants to the sol–gel preparation method has been considered. Three different polymeric biosurfactants (GB, GC, and BIO) have been tested, giving rise to three different materials being structurally and morphologically characterized by XRD, Rietveld refinement, BET, SEM, AFM, and XPS, which was completed by light absorption, photocatalytic (Pilkington test), electronic (EIS and C-AFM), and photoelectrochemical (cyclic voltammetry) measurements. Correlations between the structure/morphology of materials and their functional properties have been established. One specific surfactant has been proven as the most suitable to lead to materials with optimized photoelectrochemical performance in direct relation with their photocatalytic properties essentially controlled by their specific surface area.

1. Introduction

The planet’s need for energy has been increasing for years, but today, we can no longer meet it with the same energy sources. For this reason, an energy transition is underway in order to supply our needs while respecting the ecological impact. By analogy with the photosynthesis of vegetables, research on the electrolysis of water using light energy appears to be a good idea for producing green hydrogen [1,2]. Hydrogen is an ideal storage medium or energy carrier essentially due to its high energy yield (122 kJ × g−1) compared to other fuels such as gasoline (40 kJ × g−1). Issued from photo-activated water splitting, it is environmentally friendly due to its production having no emission of pollutants or greenhouse gases [3].
Photo-activated water splitting must be implemented in a photoelectrochemical cell (PEC); the operating principle established by Fujishima and Honda in 1972 is as follows [4]. A PEC is composed of three different active media. First, there are two electrodes; between their anode and cathode, electrons can be transported through an electrical wire outside of the cell. Then, there is an electrolyte enabling the transport of ions between both electrodes inside the cell. Generally, the anode is a photocatalyst that is able to produce electrons and holes under irradiation with light, electrons being transported to the cathode and holes being used in the oxidation reaction. This photocatalyst is usually a semi-conductor, whose band gap separating the vacant conduction band (CB) and the valence band (VB) is lower than the light source energy. The irradiation causes the excitation of electrons from the VB to the CB to lead to the formation of electron (e)–hole (h+) pairs. Electrons can flow through the external circuit to reduce protons to hydrogen at the cathode, and h+ oxidizes the water to oxygen at the anode. They can also recombine to give no net chemical reaction [2].
The semiconductor used as a photocatalyst in PEC must be chemically stable in aqueous electrolyte solutions and have a valence band positive enough to oxidize water into oxygen. To meet these expectations, Fujishima and Honda have investigated titanium oxide (TiO2), which still appears as one of the best candidates due to further advantages such as its versatility, low price, abundance, and non-toxicity [4]. Since this pioneer work on PEC, there has been a wide interest in TiO2, which has been developed by different synthesis routes and related improvement approaches [5,6,7,8,9].
In our case, we have chosen the sol–gel synthesis route to develop TiO2 thin films. Sol–gel is a soft, economical and simple chemistry. This process uses organic, inorganic, and metallic compounds as raw materials. In aqueous or organic solvents, two processes are involved: hydrolysis and polycondensation, which forms M-OH-M or M-O-M bonds leading to hydroxide or oxide compounds. Its ability to prepare high-purity catalysts with controlled morphology is an advantage for our application [8,10]. To enhance the control of morphology, it is quite usual to combine sol–gel chemistry with the use of inorganic, organic, or biological templates that allow tuning the size, the shape, and the architecture of the pores [11,12,13,14,15]. Recently, with the aim of focusing on an environmental approach, the use of bio-sourced and biodegradable surfactants as a template seems relevant, inducing a reduction of pollution at the origin. Biosurfactants are amphiphilic compounds produced in living surfaces, including animal-based and herbal-based. They are inexpensive, biocompatible, and abundant. They are classified according to their chemical structure and their microbial origin. The main classes of biosurfactants are glycolipids, phospholipids, polymeric biosurfactants, and lipopeptides [16,17]. They are diverse, multidimensional, and give different structures to the synthesized materials whose optical and photocatalytic properties can be largely tuned and then optimized [18,19,20,21,22,23]. In this study, three different kinds of polymeric biosurfactants will be investigated for the preparation of TiO2-based photoanodes intended for PEC integration.

2. Materials and Methods

2.1. Experimental Reagents

Titanium (IV) isopropoxyde (TTIP, 99.999% trace metal basis) and nitric acid (HNO3, ACS reagent 70%) were both obtained from Sigma Aldrich (St. Louis, MO, USA). Three different polymeric biosurfactants were used: GBACoco (lot PF345, Surfactgreen, France—named GC in this paper), GBAC18:1 (lot PF339, Surfactgreen, France—named GB in this paper), and Lansperse BIO868 (Bio-Loop Technology, Lankem, UK—named BIO in this paper). All surfactants are bio-based and 100% renewable.

2.2. Synthesis of TiO2 Solution

The TiO2 solutions were prepared via a sol–gel method according to the procedure described in previous works [12]. Firstly, 10 mL of TTIP were mixed with 16.85 mL of HNO3 (2 mol × L−1), and then, the solution was stirred until it became transparent and limpid (for approximatively 3 h) in order to obtain a stable sol. Afterwards, 1 g of surfactant was added, and the sol was stirred again for 30 min to produce three different sols (named TiO2-GB, TiO2-GC, and TiO2-BIO) depending on the kind of surfactant used. A fourth sol without surfactant (named TiO2) was also synthesized as a reference.

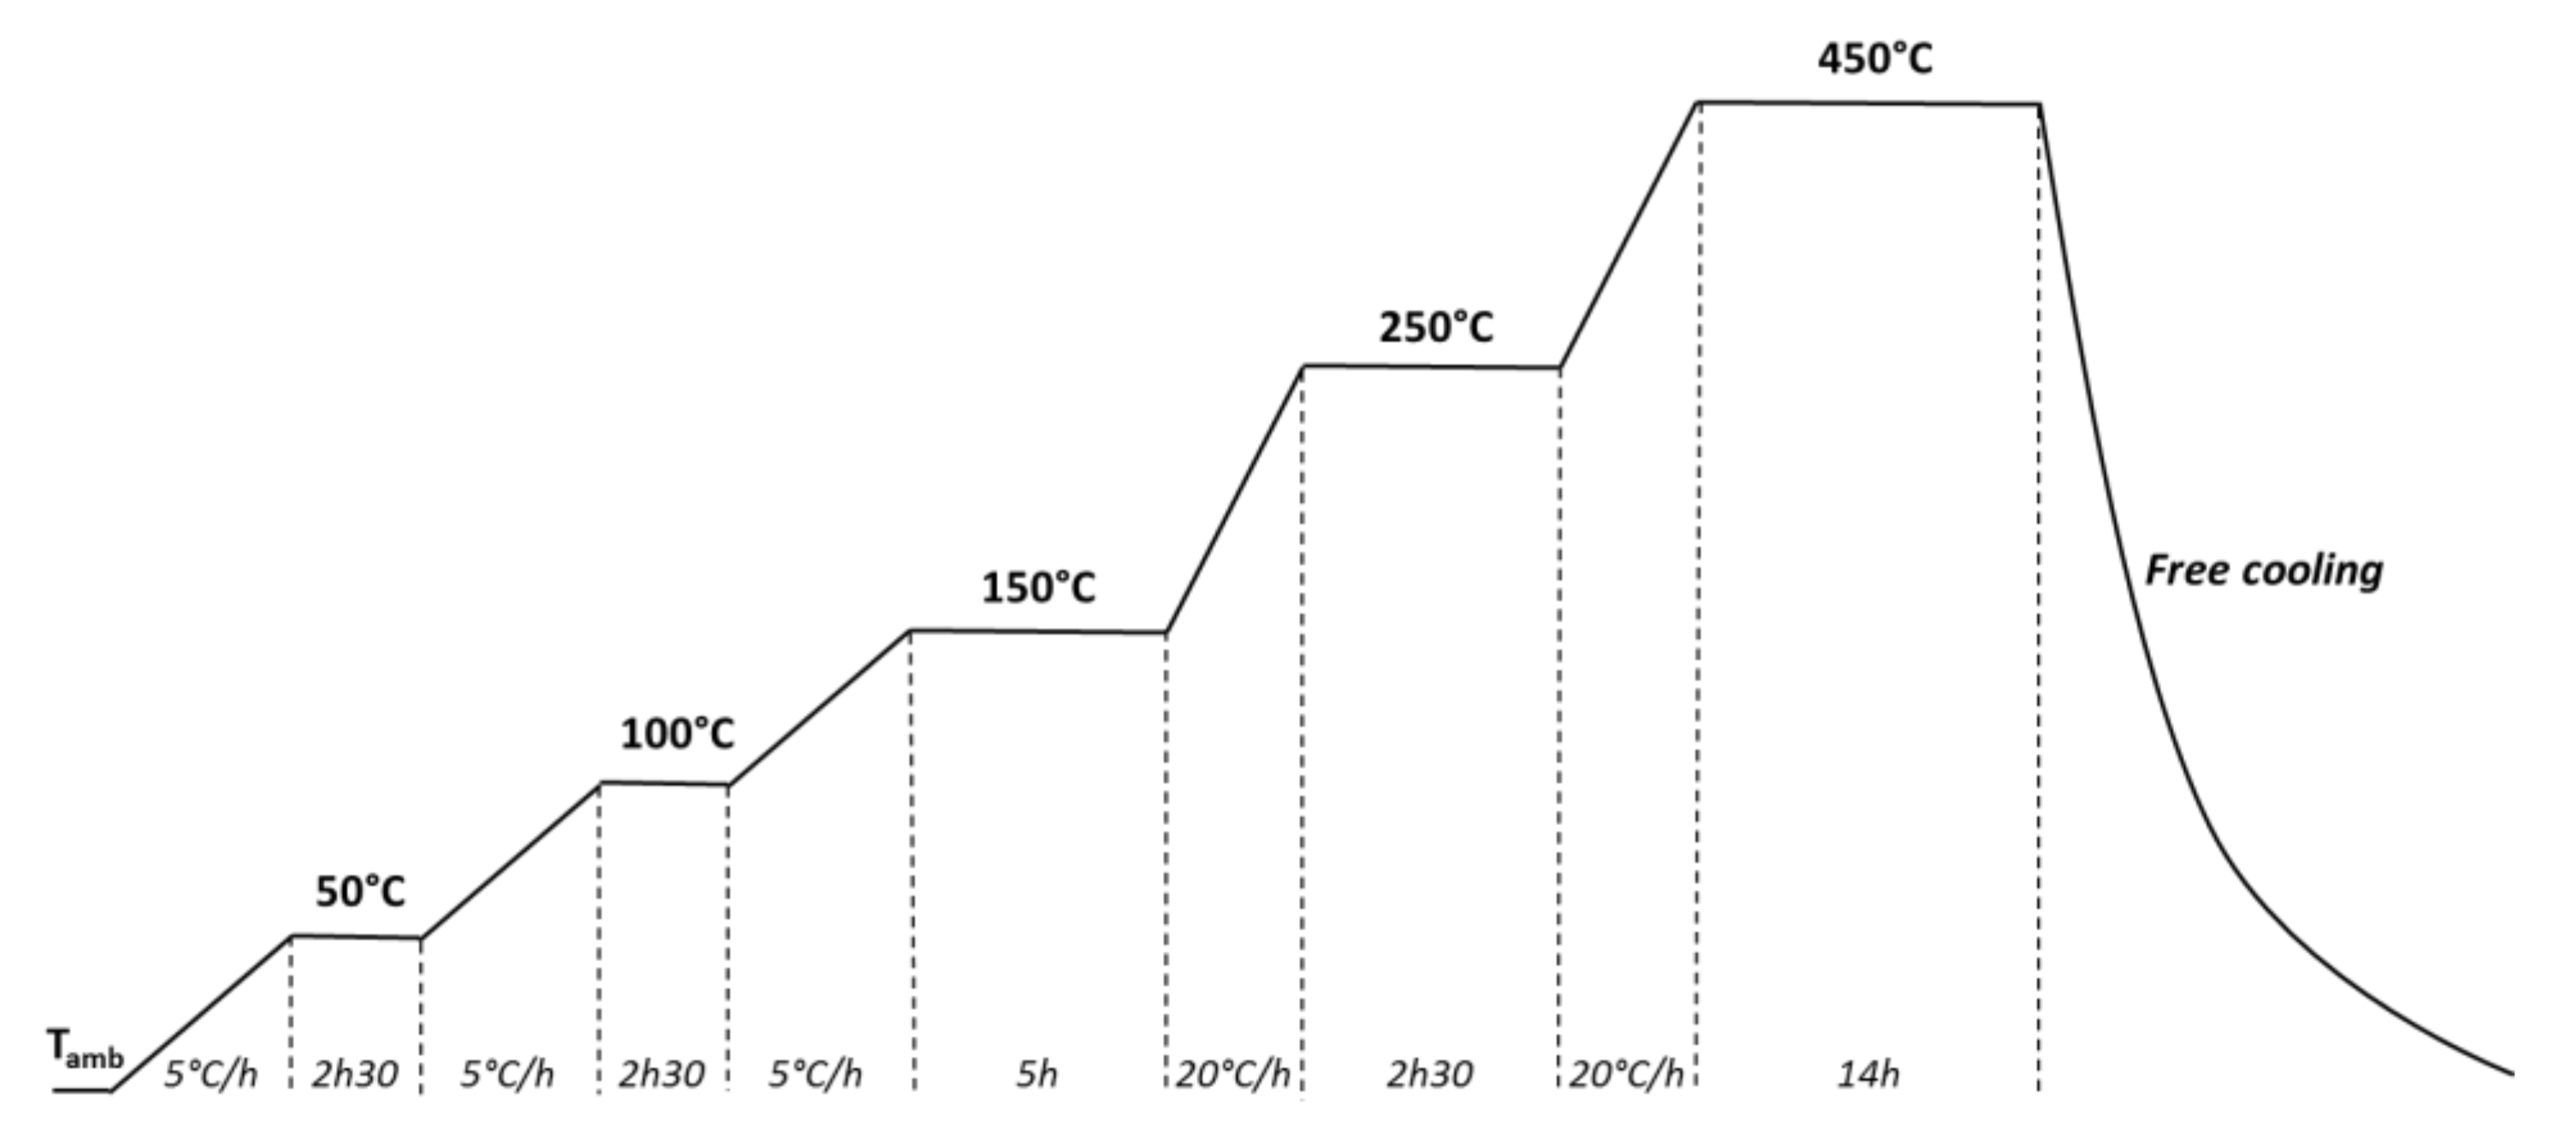
2.3. Preparation of TiO2 Materials

For structural and morphological characterizations, the sols were directly calcined to obtain powders. Calcination was performed in a tubular furnace (Eurotherm, Worthing, UK) at 450 °C for 14 h using the program shown in Figure 1. For functional characterizations, thin layers were obtained by using the dip-coating technique (Dip Master 201, Chemat Technology, INC, Northridge, CA, USA). The support used was an indium–tin–oxide (ITO)-coated substrate (product configuration: glass/SiO2 buffer (≈23 nm)/ITO, thickness 125 nm, optical transmission >85% at 555 nm, from KINTEC, Kowloon, Hong Kong). Pieces of the ITO support (1 × 3 cm2) were immersed in the different sols for 99 s in a dip-coater chamber. Then, the samples were drawn upward through the solutions with a speed of 5.08 cm × min−1. Finally, samples were dried at room temperature for 6 days in the dip-coater chamber and then calcined with the same procedure as the powders.

2.4. Morphological, Structural, and Optical Characterizations

The structure of materials was determined by a powder X-ray diffractometer (XRD) from 20° to 60° (Kα1 1.5405980 nm, Kα2 1.5444260 nm, ratio K-α1/Kα2 1.05, step size 0.0083556°, time per step 80.10 s, scan speed 0.013263° × s−1) using an X’pert Pro (Pan Analytical, Malvern, UK) apparatus and quantified by Rietveld refinement on FullProf with an ISCD file of anatase phase (CollCode 92363—Weirich T.E—2000) and rutile phase (CollCode 93097—Ballirano P—2001). BET (Brunauer, Emmett, and Teller) specific surface areas and the average pore diameters of the powders were measured using an adsorption analyzer (ASAP-2010, Micromeritics, Norcross, GA, USA). To depict the chemical composition of materials in the form of thin layers, the X-ray photoelectron spectroscopy (XPS) measurements were carried out with a monochromatic source, Al Kα, as the excitation source, and photoelectron spectra were calibrated as binding energy relative to the energy of C-C of C1s at 284.8 eV (ESCALAB 250, Thermo Electron, Waltham, MA, USA). The error on XPS atomic percentages is 10% relative. To determine the thickness of the thin layers, sample cross-sections were observed by scanning electron microscopy (SEM, Hitachi S4800, Tokyo, Japan). The error on thickness measurement is estimated at 10–20%. Moreover, UV absorption and the band gap of thin layers were investigated using a UV-visible-NIR spectrometer (JASCO V-570, Tokyo, Japan). Finally, analysis of thin films was completed by surface topography measurement using a Bruker multimode 8 AFM in tapping mode. For characterizations on thin layers, only materials prepared using surfactants could be analyzed due to the default of adherence on the ITO substrate for TiO2 without surfactant addition. It is not only the case for XPS, SEM, light absorption, and AFM, but also for the functional characterizations described below.

2.5. Photocatalytic, Electronic, and (Photo)Electrochemical Characterizations

The standardized Pilkington test was chosen to investigate the photocatalytic activity of the films [24]. The samples were immersed in a stearic acid solution (8.8 × 10⁻³ mol × L−1 in ethanol) for 5 min. They were exposed to a 75 W UV light (Eurosolar lamp, ratio UV-B/UV-A 1.2%, wavelength range 280–400 nm); the light source was placed away from the sample at a distance such that a power density of 7 mW × cm−2 could be applied. The stearic acid degradation was followed by observation of the absorption bands in the range of 2800–3000 cm−1 corresponding to the maximum of the vibrational band, ν (C-H), of stearic acid. The observation was carried out on FTIR analysis (Nicolet iS50 FT-IR, Thermo Scientific, Waltham, MA, USA) every 20 min of irradiation.
All (photo)electrochemical experiments were monitored on 1 cm2 samples with an electrochemical interface (Solartron, SI 1287) and an impedance/gain-phase analyzer (Solartron, SI 1260) in a photoelectrochemical cell equipped with a quartz window (Pine Research Co, Durham, NC, USA). The electrolyte was a solution of 0.01 mol × L−1 NaOH—0.1 mol × L−1 Na2SO4, the Ag/AgCl electrode was used as the reference electrode, and glass carbon was used as the counter electrode. The same conditions of irradiation as for the Pilkington test were applied. The cyclic voltammetry (CV) curves were measured from 0.0 to 2.0 V/RHE at a scan rate of 50 mV × s−1 during three cycles, the last one (similar to the second one) being selected as representative. To depict the electronic conduction properties of films, Electrochemical Impedance Spectroscopy (EIS) was performed under UV illumination at 0.0 V over the frequency range of 0.1 Hz to 106 Hz using an AC voltage of 10 mV amplitude. EIS enabled depicting the macroscopic electronic conduction property (charge transfer resistance) of materials at the interface with the electrolyte.
In addition, with the aim of characterizing the nanoscale conductive ability of materials, transversal current measurements at nanoscale were performed with an AFM Bruker Multimode 8 setup equipped with a PtSi tip (curvature radius Rc = 27 nm and spring constant k = 1.8 N/m) using conductive AFM mode (C-AFM). A negative DC voltage was applied on a conductive silicon substrate, and current was collected by a PtSi tip. The measurements were performed owing to the 100 nA × V−1 module sensitivity using a contact force of 33 nN. The current was probed over a 2 µm × 0.5 µm area at three different localizations of each sample, with good consistency. A 384 pixel-by-line was used for mapping, which implies a pixel size of 5.2 nm.

3. Results

3.1. Morphological, Structural, and Optical Properties of Materials
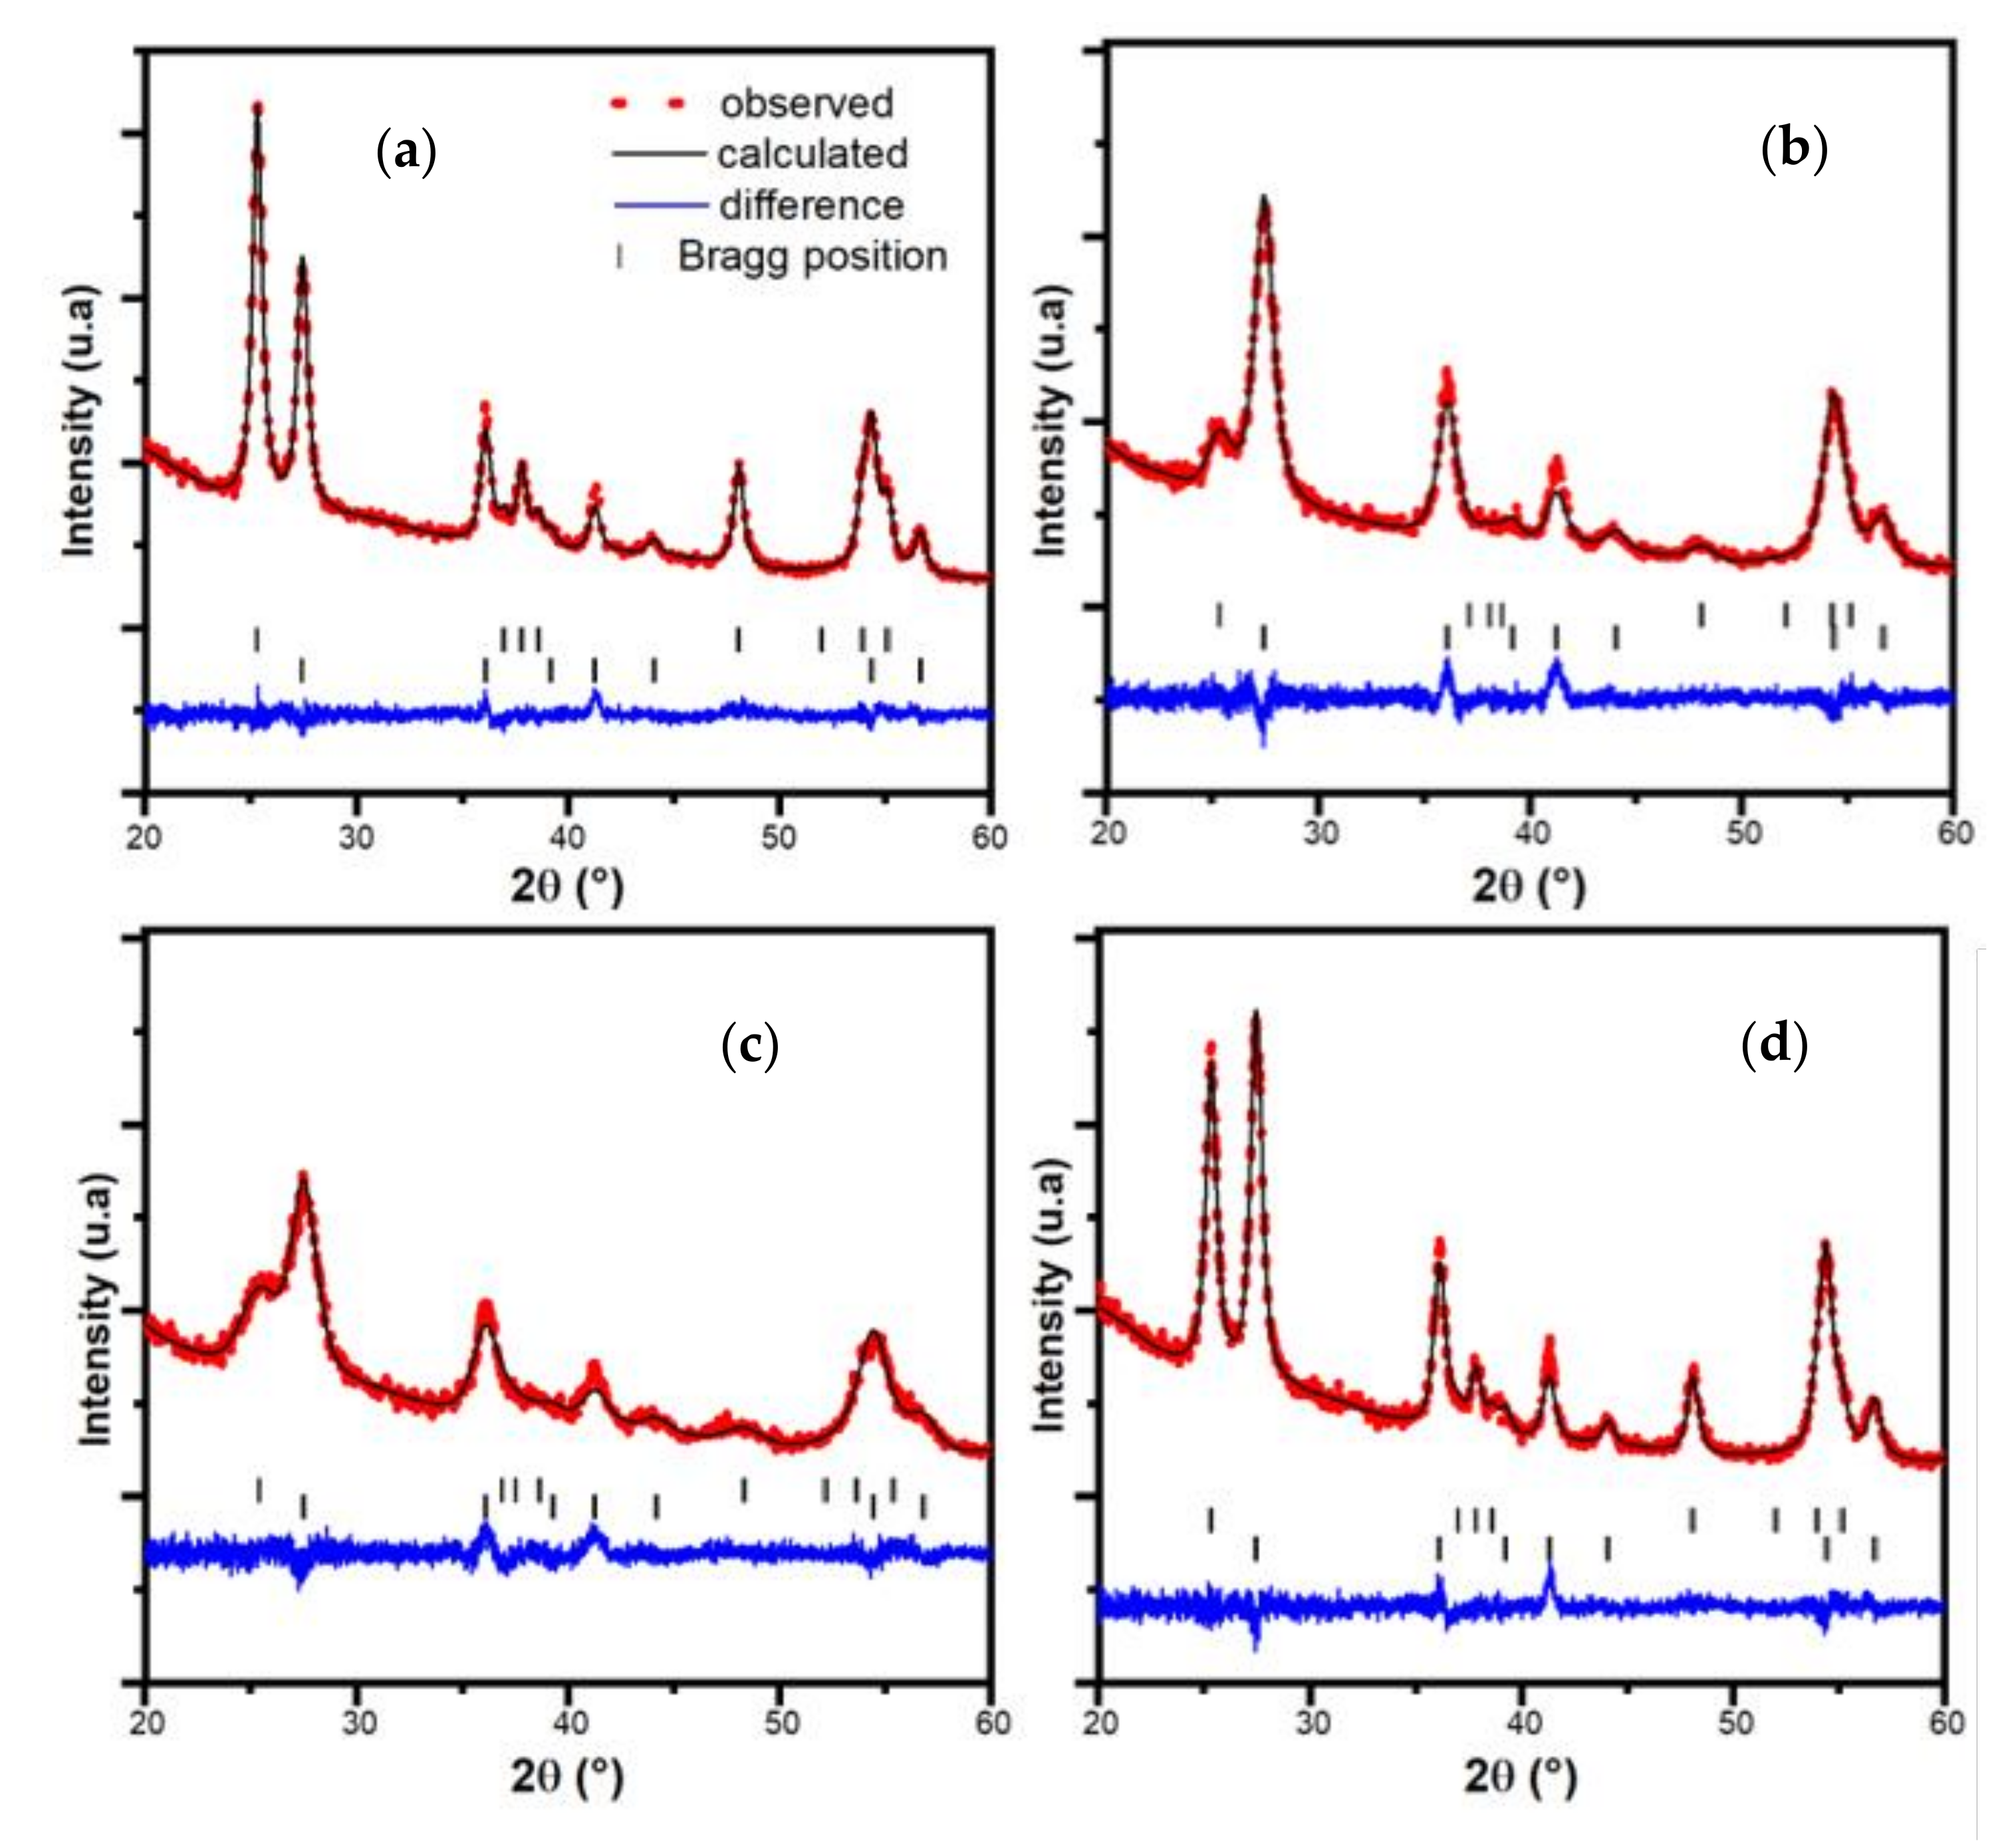
3.1.1. XRD Analysis

Figure 2 shows XRD data for the four different samples. To determine the proportion of each crystalline phase in materials, a Rietveld refinement was performed [25].
In Figure 2, the dashed red line corresponds to the experimental diffractograms, the black full lines show the diffractograms calculated by the Rietveld refinement, the blue lines are the difference between the observed and calculated data (the straighter they are, the better the refinement is), and the green sticks indicate the Bragg position of anatase and rutile phases. Considering the experimental data (dashed red lines), we can see at 25.2° the most intense characteristic peak of the anatase phase and at 27.4° that of the rutile phase [26]. This gives an idea of the proportions of the TiO2 phases before performing the refinement. The quantities of the anatase and rutile phases are shown in Table 1. The Bragg R-factor is a confidence factor from a structural point of view, while Rwp indicates the overall agreement of the refinement including peak profiles and intensity. To have a successful refinement, these factors must be as small as possible. The refinement is defined as correct if both factors are below 10, which is the case here. For the TiO2 sample (without surfactant), the proportions of anatase and rutile phases are almost 50/50. For all other samples, the addition of a surfactant promotes the formation of the rutile phase to the detriment of the anatase one. Therefore, in the case of TiO2-GB, TiO2-GC, and TiO2-BIO, the rutile phase is in majority, representing at least 60% (and up to around 90% in the case of TiO2-GB).

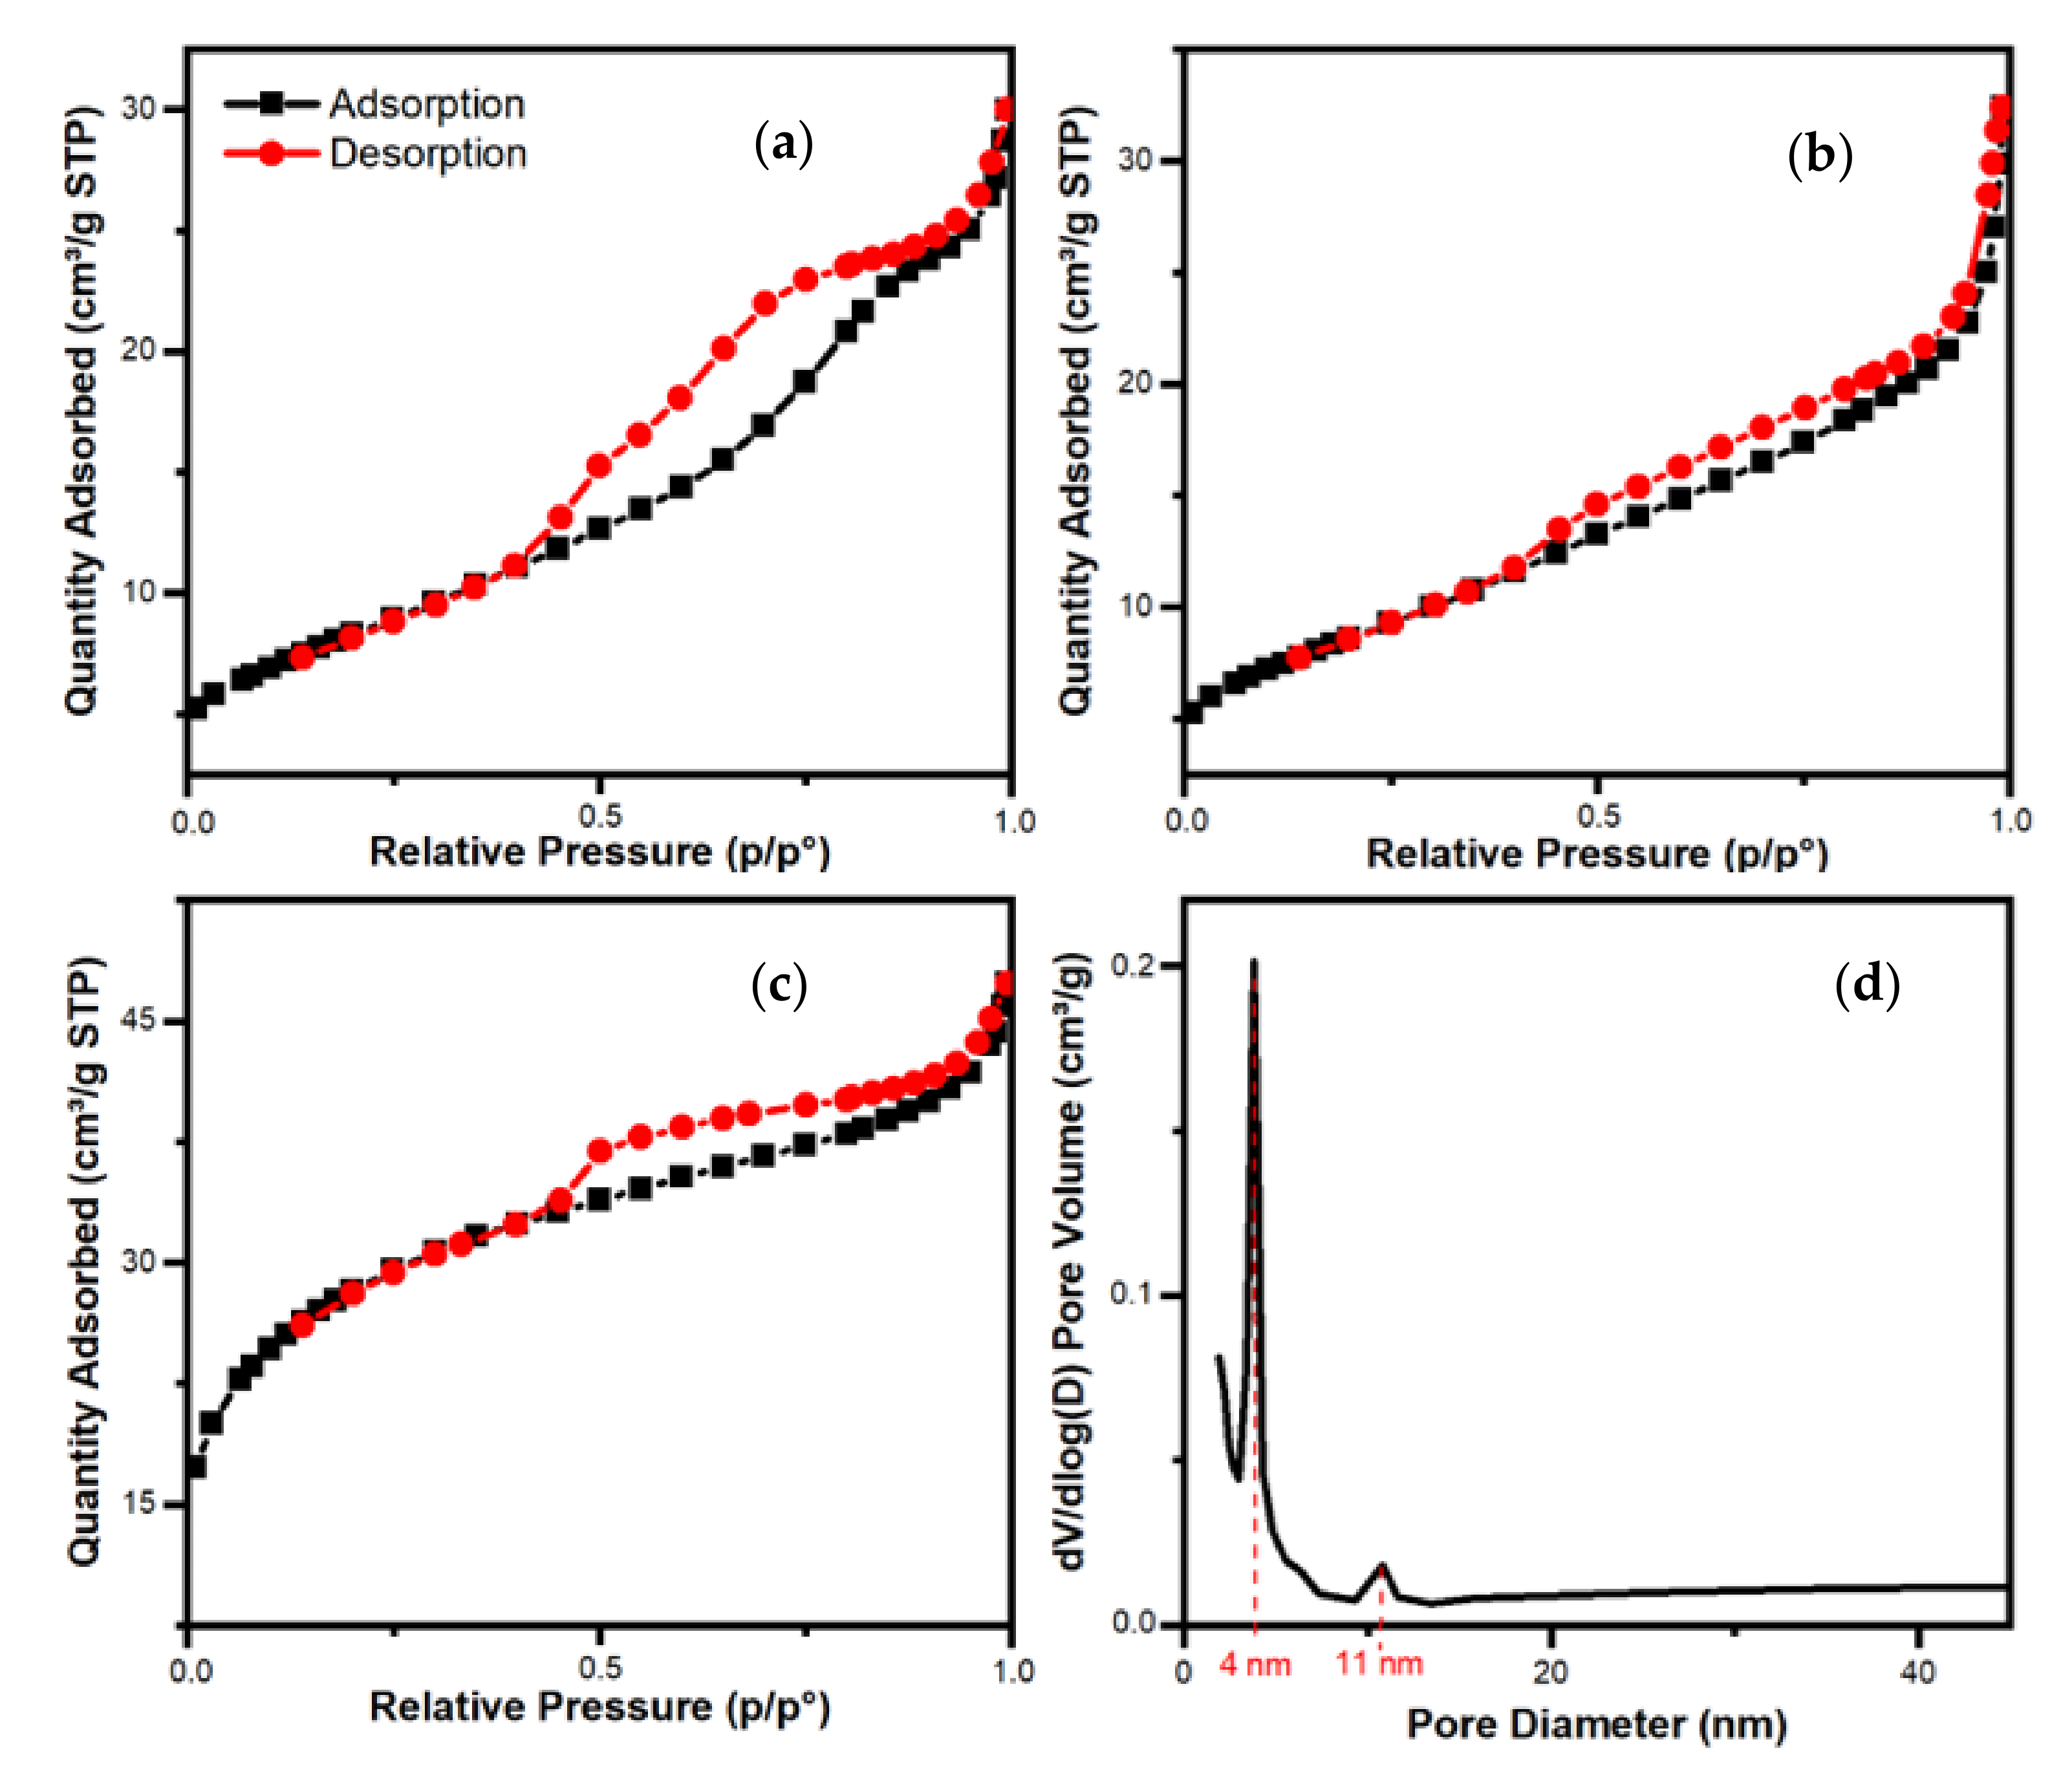
3.1.2. BET Characterizations
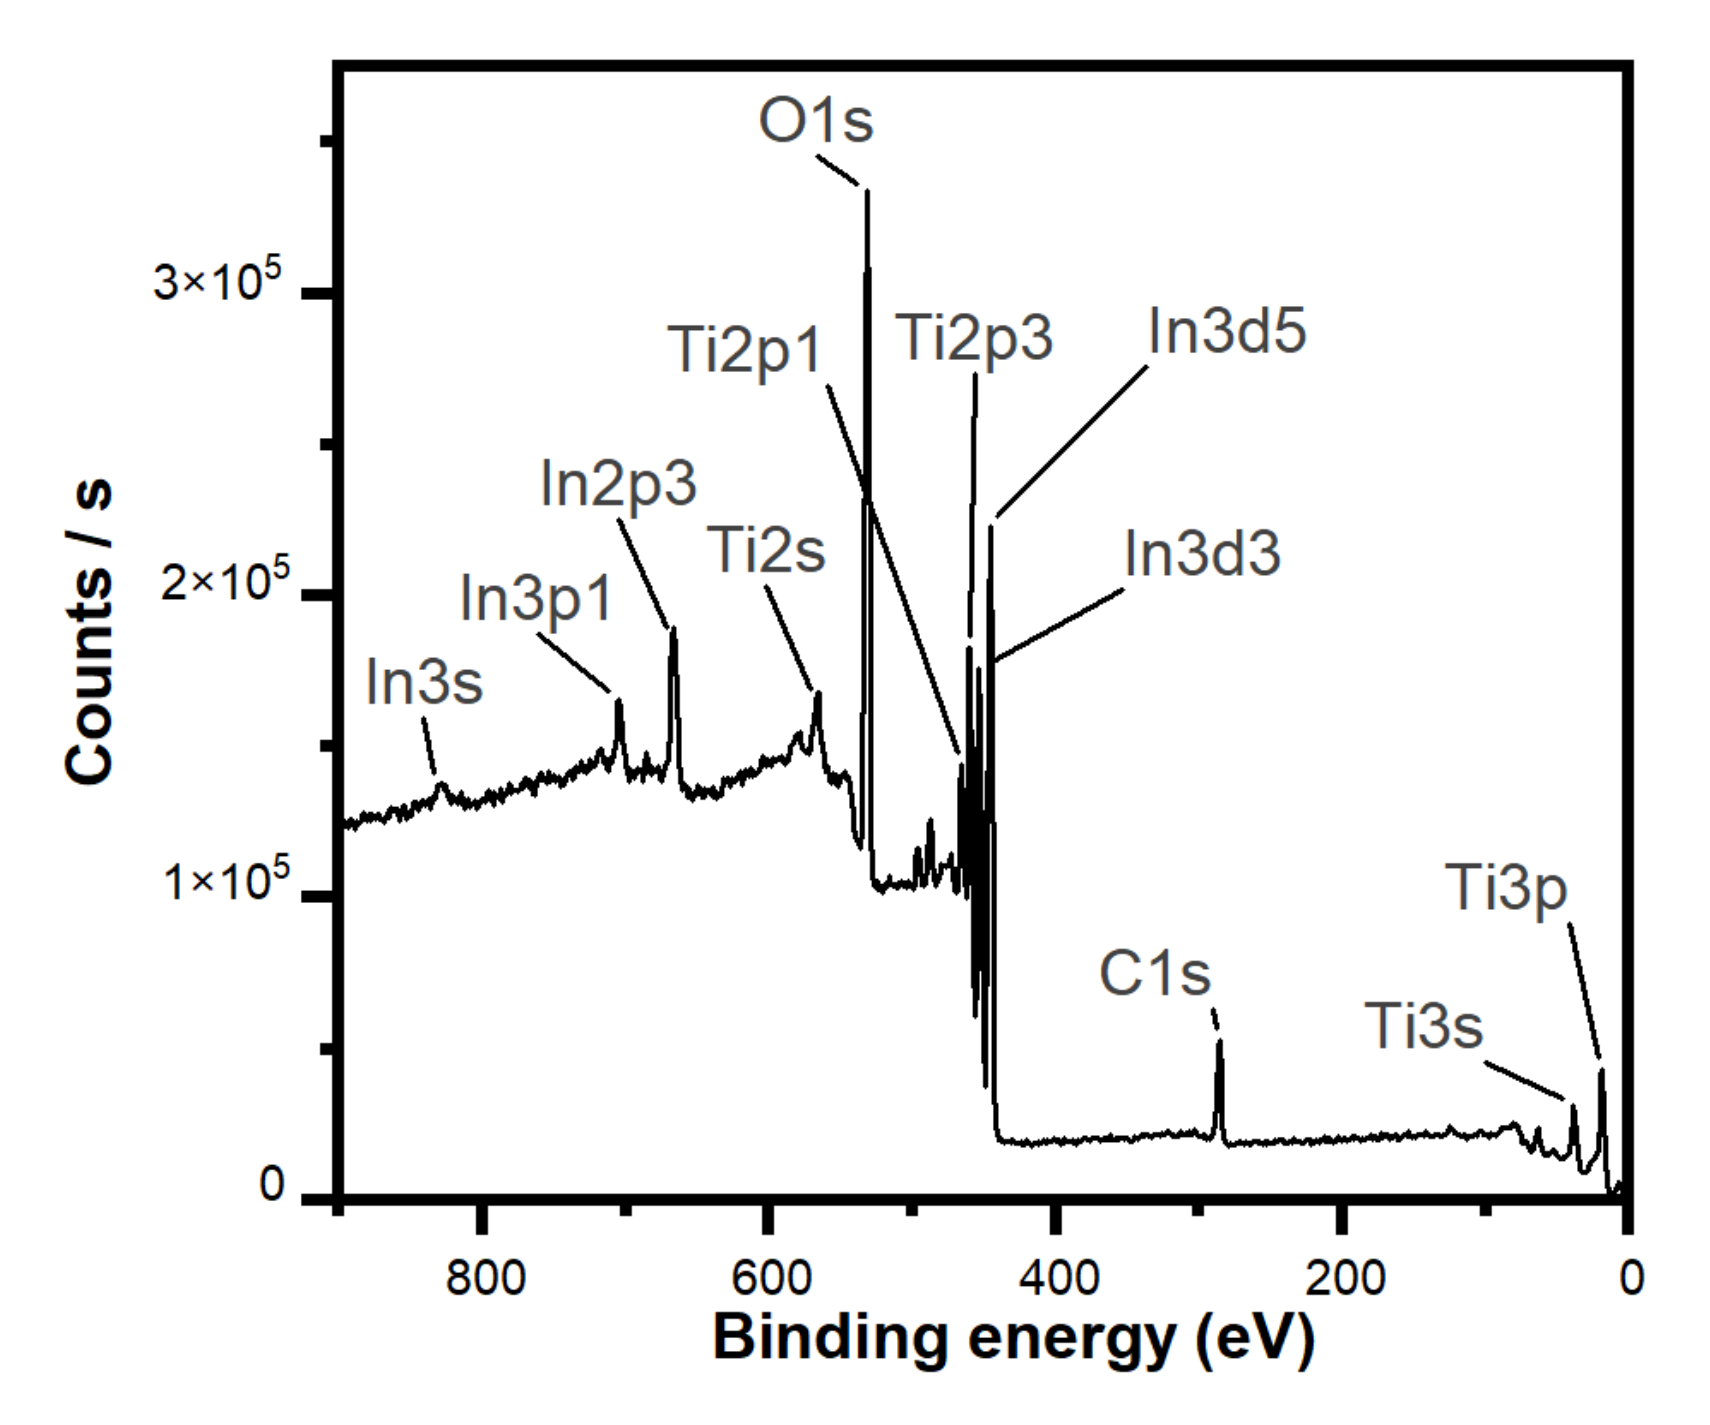
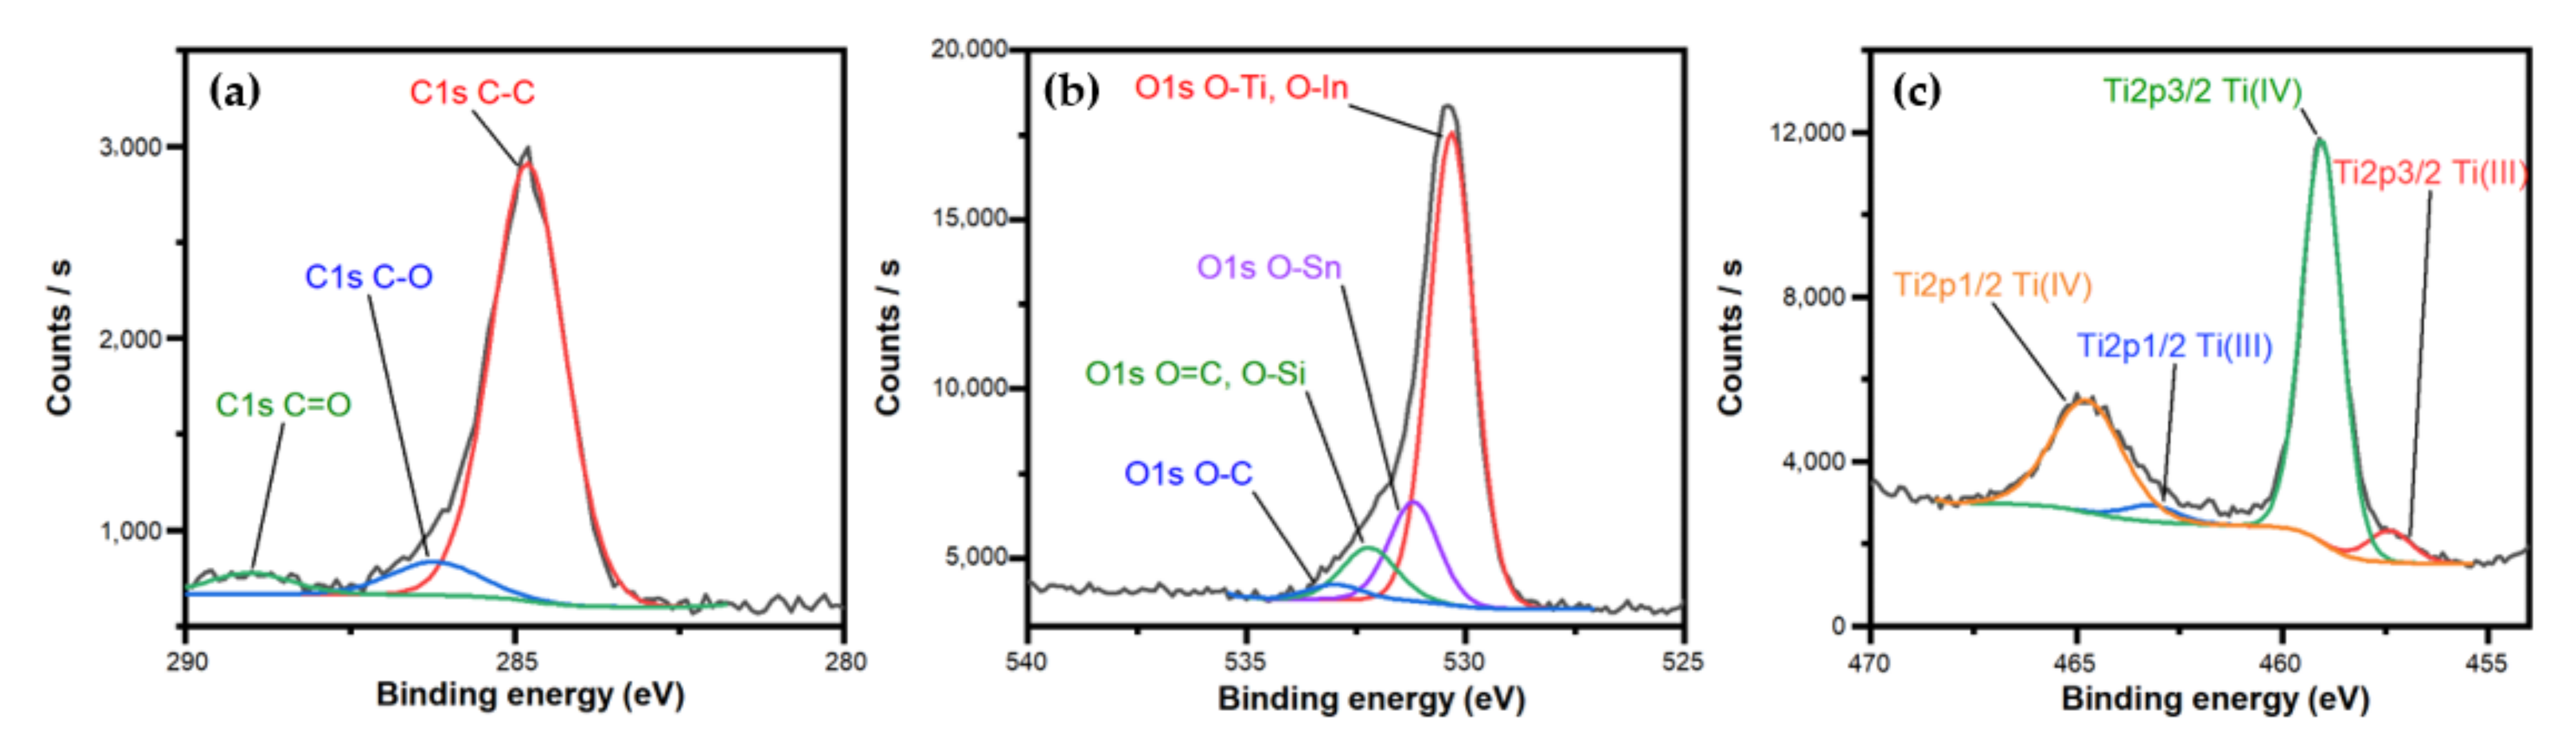
Two main parameters representative of the porous structure of powders were obtained from nitrogen adsorption–desorption isotherms (Figure 3): the specific surface area (SBET, m2 × g−1) and the average pore diameter (nm), which are presented in Table 2. The BJH method (Barrett, Joyner, and Halenda), used to determine the average pore diameter, is based on the link between thermodynamic data and a physical characteristic of the solid. The principle of the BJH method is based on an analysis of the desorption branch, starting from the highest relative pressure reached [27,28]. For all samples, the presence of two different types of porosity can be noticed: microporosity and mesoporosity [29]. The TiO2 and TiO2-BIO samples have the same isotherm shape (Figure 3a). They have an identical pore size distribution, it is a bimodal distribution centered around 3 nm and 7 nm, so the addition of the BIO surfactant had no significant effect on the pore size distribution of TiO2. Concerning TiO2-GC, the pore size distribution, also bimodal, is centered around 4 nm and 11 nm (Figure 3c,d), but in this case, the sample is more microporous, as we can see with the noticeable quantity of N2 adsorbed at low p/p° (<0.2). For TiO2-GB (Figure 3b), the pore size distribution is unimodal and centered around 4 nm.
Concerning the specific surface area, only the addition of GC has enabled increasing this parameter, from 30 (for TiO2 without surfactant) to 101 m2 × g−1 (for TiO2-GC). For the two other samples, there is no enhancement of this parameter: no significant effect for TiO2-GB (31 m2 × g−1) and a slight decrease for TiO2-BIO (16 m2 × g−1). The BET specific surface area is in accordance with the average pore width; a smaller pore size necessarily results in a higher specific surface area. The mean pore diameters reported in Table 2 are average diameters given by calculations in BET. No uncertainties are given for this kind of measurement. The fitting errors are generally given for the diameter calculated using NLDFT or QSDFT methods.
For our application, a larger specific surface area should allow better accessibility of photons from irradiation and of adsorbed reactive molecules in contact with materials, which should lead to a better photocatalytic activity [30,31]. Therefore, we expect to obtain better results in the Pilkington experiment for the TiO2-GC sample, which has the highest specific surface area. Nevertheless, a larger specific surface area could decrease the intrinsic density of the material and thus decline its electronic conduction ability, which would be detrimental to the (photo)electrochemical properties [32]. From this second point of view, the TiO2-BIO sample having the lowest specific surface area should be the best. These effects will be discussed in Section 3.2.

3.1.3. XPS Analysis

Only the three samples with the surfactants (TiO2-GB, TiO2-GC, and TiO2-BIO) were analyzed by XPS. For this analysis, we present the results for TiO2-GC only because the results of the three samples are identical. X-ray photoelectron spectroscopy (XPS) gives us the chemical composition of the deposit through the bond energies. In the XPS spectrum (Figure 4), all the bond energies between 0 and 900 eV were recorded. We can see four different chemical elements: carbon (C1s), oxygen (O1s), titanium (Ti2s, Ti2p1, Ti2p3, Ti3s, and Ti3p), and indium (In3s, In3p1, In2p3, In3d5, and In3d3). The indium comes from the support used for the coating, which is indium-tin oxide (tin is not visible here, because its characteristic binding energies are higher than 900 eV).
In order to know more about the chemical environment, a high-resolution deconvolution of the peaks corresponding to C, O, and Ti has been performed (Figure 5). The scan of C1s shows three different bonds with mainly the C-C bond at 284.8 eV. It corresponds to the presence of the surfactant mainly composed of carbon type C12 and C14 (around 60%); there is also a second C=O bond visible at 289.1 eV of the glycine betaine amine molecule. The C-O contribution (286.2 eV) can also be observed.
For the O1s, it is a little more complex to define the bonds, because the peak has a non-symmetric shape. The major peak is at 530.3 eV, corresponding to the O-In bond of the support and the O-Ti bond characteristic of TiO2-based thin layers. The O-Sn bond (531.2 eV) is the one of the tin oxide also bound to the support. Then, we find the bonds O-C (533.0 eV) and O=C (532.2 eV), as also depicted in the C1s signal.
Moreover, the presence of an O-Si bond (at the same energy as O=C) may be surprising, but in fact, it comes once again from the support due to the presence of SiO2 in the substrate (below the superficial tin and indium oxides). Concerning the last scan, which corresponds to titanium, the major bond is Ti2p3/2 Ti(IV) at 459.0 eV; we can also see another peak at 464.7 eV corresponding to Ti2p1/2 Ti(IV). A deviation between these two bonds corresponding to 5.7 eV indicates the presence of TiO2 [33]. Indeed, TiO2 is essentially present in a Ti4+ oxidation state but also in a Ti3+ oxidation state at 457.4 and 463.2 eV. The presence of a Ti3+ oxidation state comes from the surface erosion of the layer made by the photoelectron gun in order to remove the contamination layer of the samples. The atomic percentages of all different bonds are summarized in Table 3. By subtracting the amount of indium from the O-Ti bond, we obtain the stoichiometry of the titanium oxide TiO2 also proving its presence.

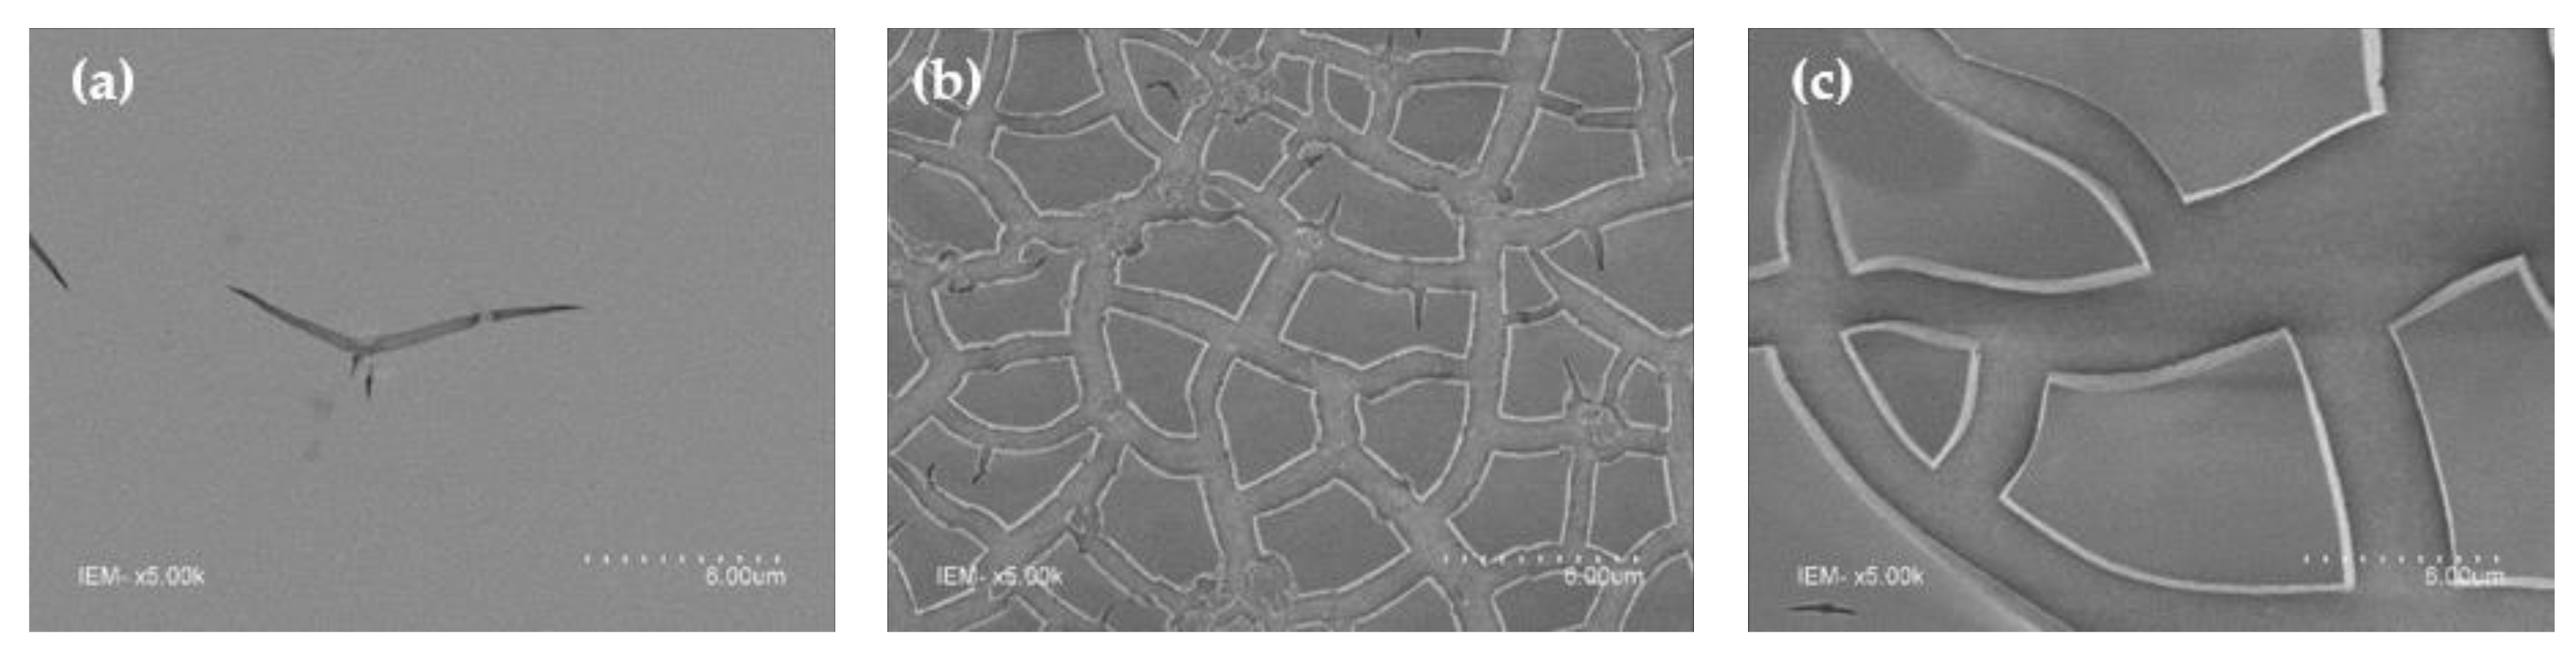
3.1.4. SEM and AFM Characterizations

On the SEM surface pictures of the three samples synthesized using surfactants (Figure 6), we can clearly differentiate the TiO2-GC layer from the two others because only TiO2-GC has a smooth surface, with only a small amount of cracks and without any inhomogeneity apart from that. In the case of both TiO2-GB and TiO2-BIO, noticeable cracks are the consequence of the surfactant imprint and its effect during the drying step, which is also probably influenced by the specific surface nature of the ITO substrate (wettability). The distribution of cracks is different for both samples, with cracks being narrower and more numerous in the case of TiO2-GB, inducing smaller and closer flakes on the ITO substrate surface than for TiO2-BIO. Such a heterogeneity is not necessarily a problem; indeed, it could not be detrimental to the functional properties of materials; moreover, the ITO substrate will not be the definitive support for such photo-anode materials intended to be integrated in a photoelectrochemical cell without any ITO substrate.
As a complement to the morphological investigation, AFM measurements in tapping mode have shown a root mean square roughness of 0.55 nm ± 0.11 nm for TiO2-GC, 0.89 nm ± 0.15 nm for TiO2-GB, and 3.24 nm ± 0.22 nm for TiO2-BIO, which confirms a flat and homogeneous surface apart from cracks.
The thin film thicknesses measured by cross-section SEM observation are given in Table 2. Whatever the surfactant, films are some hundred nanometers, as expected considering the chosen dip-coating deposition conditions.

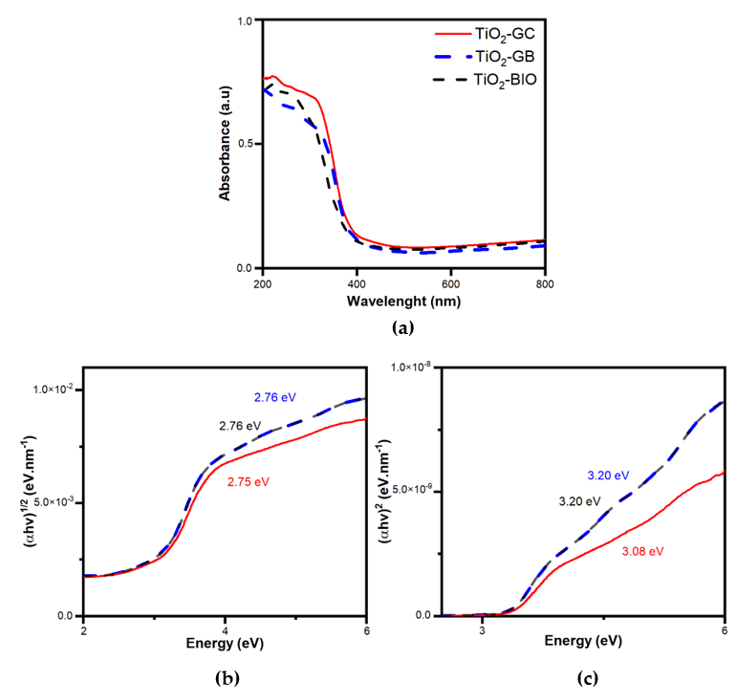
3.1.5. Optical Properties of the Films

The absorption of the films synthesized using surfactants was determined by UV-visible spectroscopy in transmission mode over a range from 200 to 800 nm. The spectra of the three samples have the same appearance with an intense absorption in the UV from 200 to 400 nm (Figure 7a), which is representative of the optical characteristics of TiO2 [34,35,36]. For a semiconductor, the first optical absorption threshold corresponds to the electronic transition between the valence band and the conduction band, i.e., the band gap. To determine this band gap, we have made a plot of Tauc, which is represented by the coefficient ( α h v ) n as a function of energy in electron volts [37]. In this coefficient, α represents the absorption coefficient (cm−1), h is the Plank’s constant (6.63 × 10⁻³⁴ J × s), and ν is the frequency corresponding to the rapport between the velocity of light (3 × 10⁸ m × s−1) and the wavelength (m). The coefficient n corresponds to the type of band gap of the semiconductors; if the band gap is direct, n = 2, and if it is indirect, n = ½ [38]. In the case of TiO2, the rutile phase has a direct band gap, while the anatase has an indirect band gap. In our case and according to the Rietveld refinement, we are in the presence of both phases, which is why the Tauc plot has been made in both cases.
The indirect band gap of anatase is equal to 3.2 eV [9,39,40]. We can see on the corresponding Tauc plot (Figure 7b) that the values for thin films are equal to 2.75–2.76 eV, which is quite far from the theoretical value. By observing the direct band gap values in the rutile case (Figure 7c), we obtain 3.20 eV for TiO2-GB and TiO2-BIO and 3.08 eV for TiO2-GC. These values are consistent with the theoretical value for rutile [9,39,40]. We conclude that to define the band gap of thin films, the Tauc model must take into account a direct rutile band gap rather than an indirect anatase band gap to be the most representative of our samples, which is in accordance with the higher proportion of rutile in materials (as proved by XRD).

3.2. Photocatalytic, Electronic, and (Photo)Electrochemical Properties

3.2.1. Photocatalytic Properties

To study the photocatalytic activity of the thin films, an analysis of the photodegradation of stearic acid under UV light and static conditions was performed. Applying the Pilkington test [41], the rate of stearic acid degradation (Rst) could be calculated using Equation (1), where A0 and A are the IR-TF absorbance peaks at 2916.806 cm−1 at the initial time (before irradiation) and at any time (after irradiation), respectively.
R s t = 1 A / A 0 × 100
Table 4 indicates the Rst values for an irradiation time of 100 min. TiO2-GC is the sample with the best degradation rate; it is 61% after 100 min, while it is noticeably lower for TiO2-GB (28%) and even less for TiO2-BIO (13%). This hierarchy (Rst(TiO2-GC) > Rst(TiO2-GB) > Rst(TiO2-BIO)) is the same as the one for the specific surface area investigated previously, as expected. Indeed, a larger specific surface area certainly allows better accessibility of photons from UV irradiation and of adsorbed stearic acid, which leads to a better photocatalytic activity [42]. The supremacy of TiO2-GC in terms of photocatalytic ability can also be explained by the homogeneous morphology of this film previously shown by SEM, which enables developing a material active surface that is much larger and smoother than that of other films. One can suppose that the more homogeneous the material surface, the higher the stearic acid absorption and degradation abilities [43].

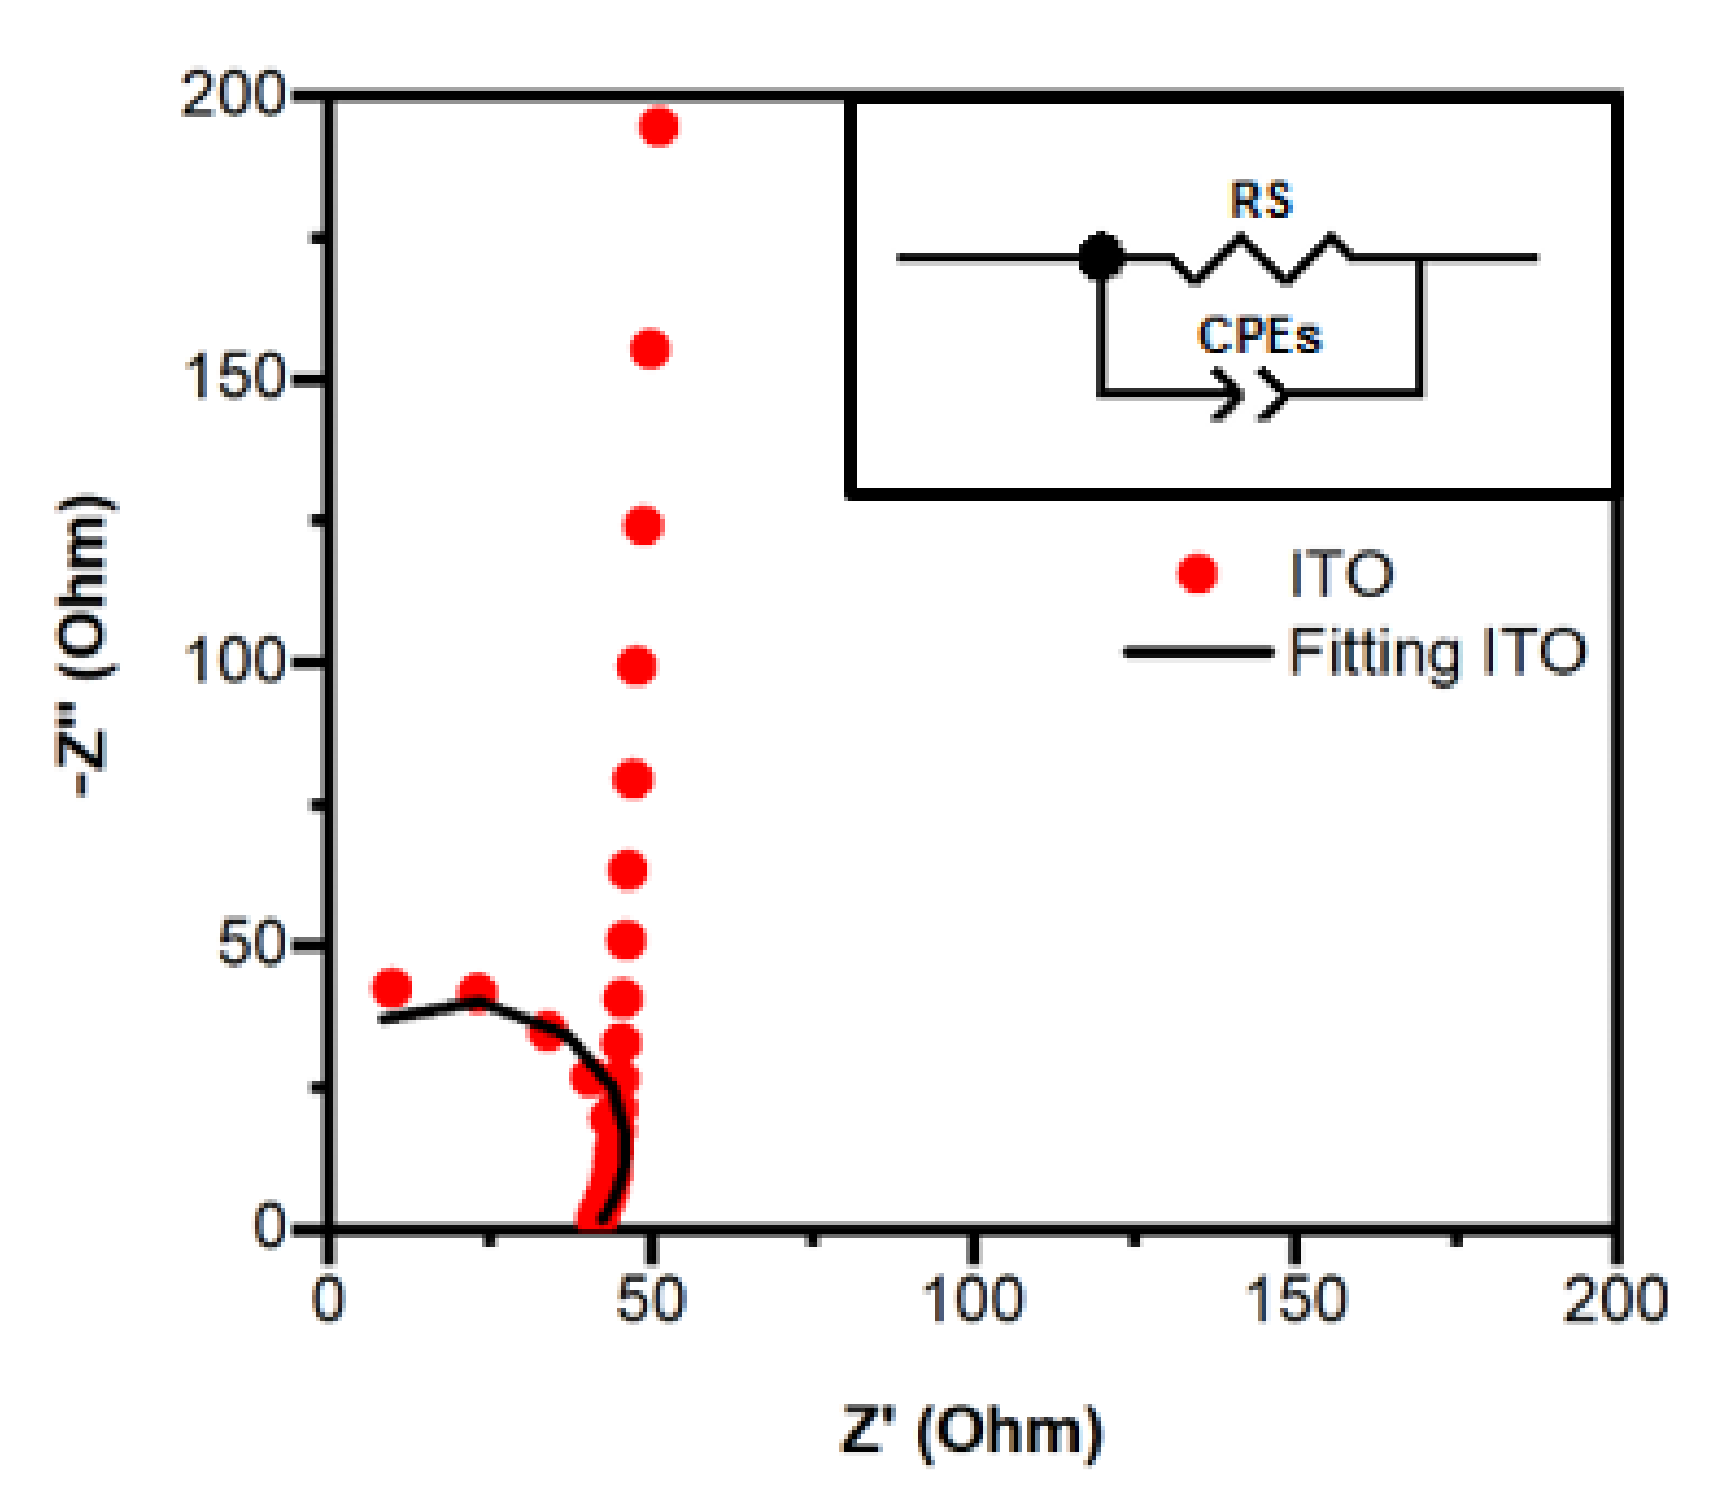
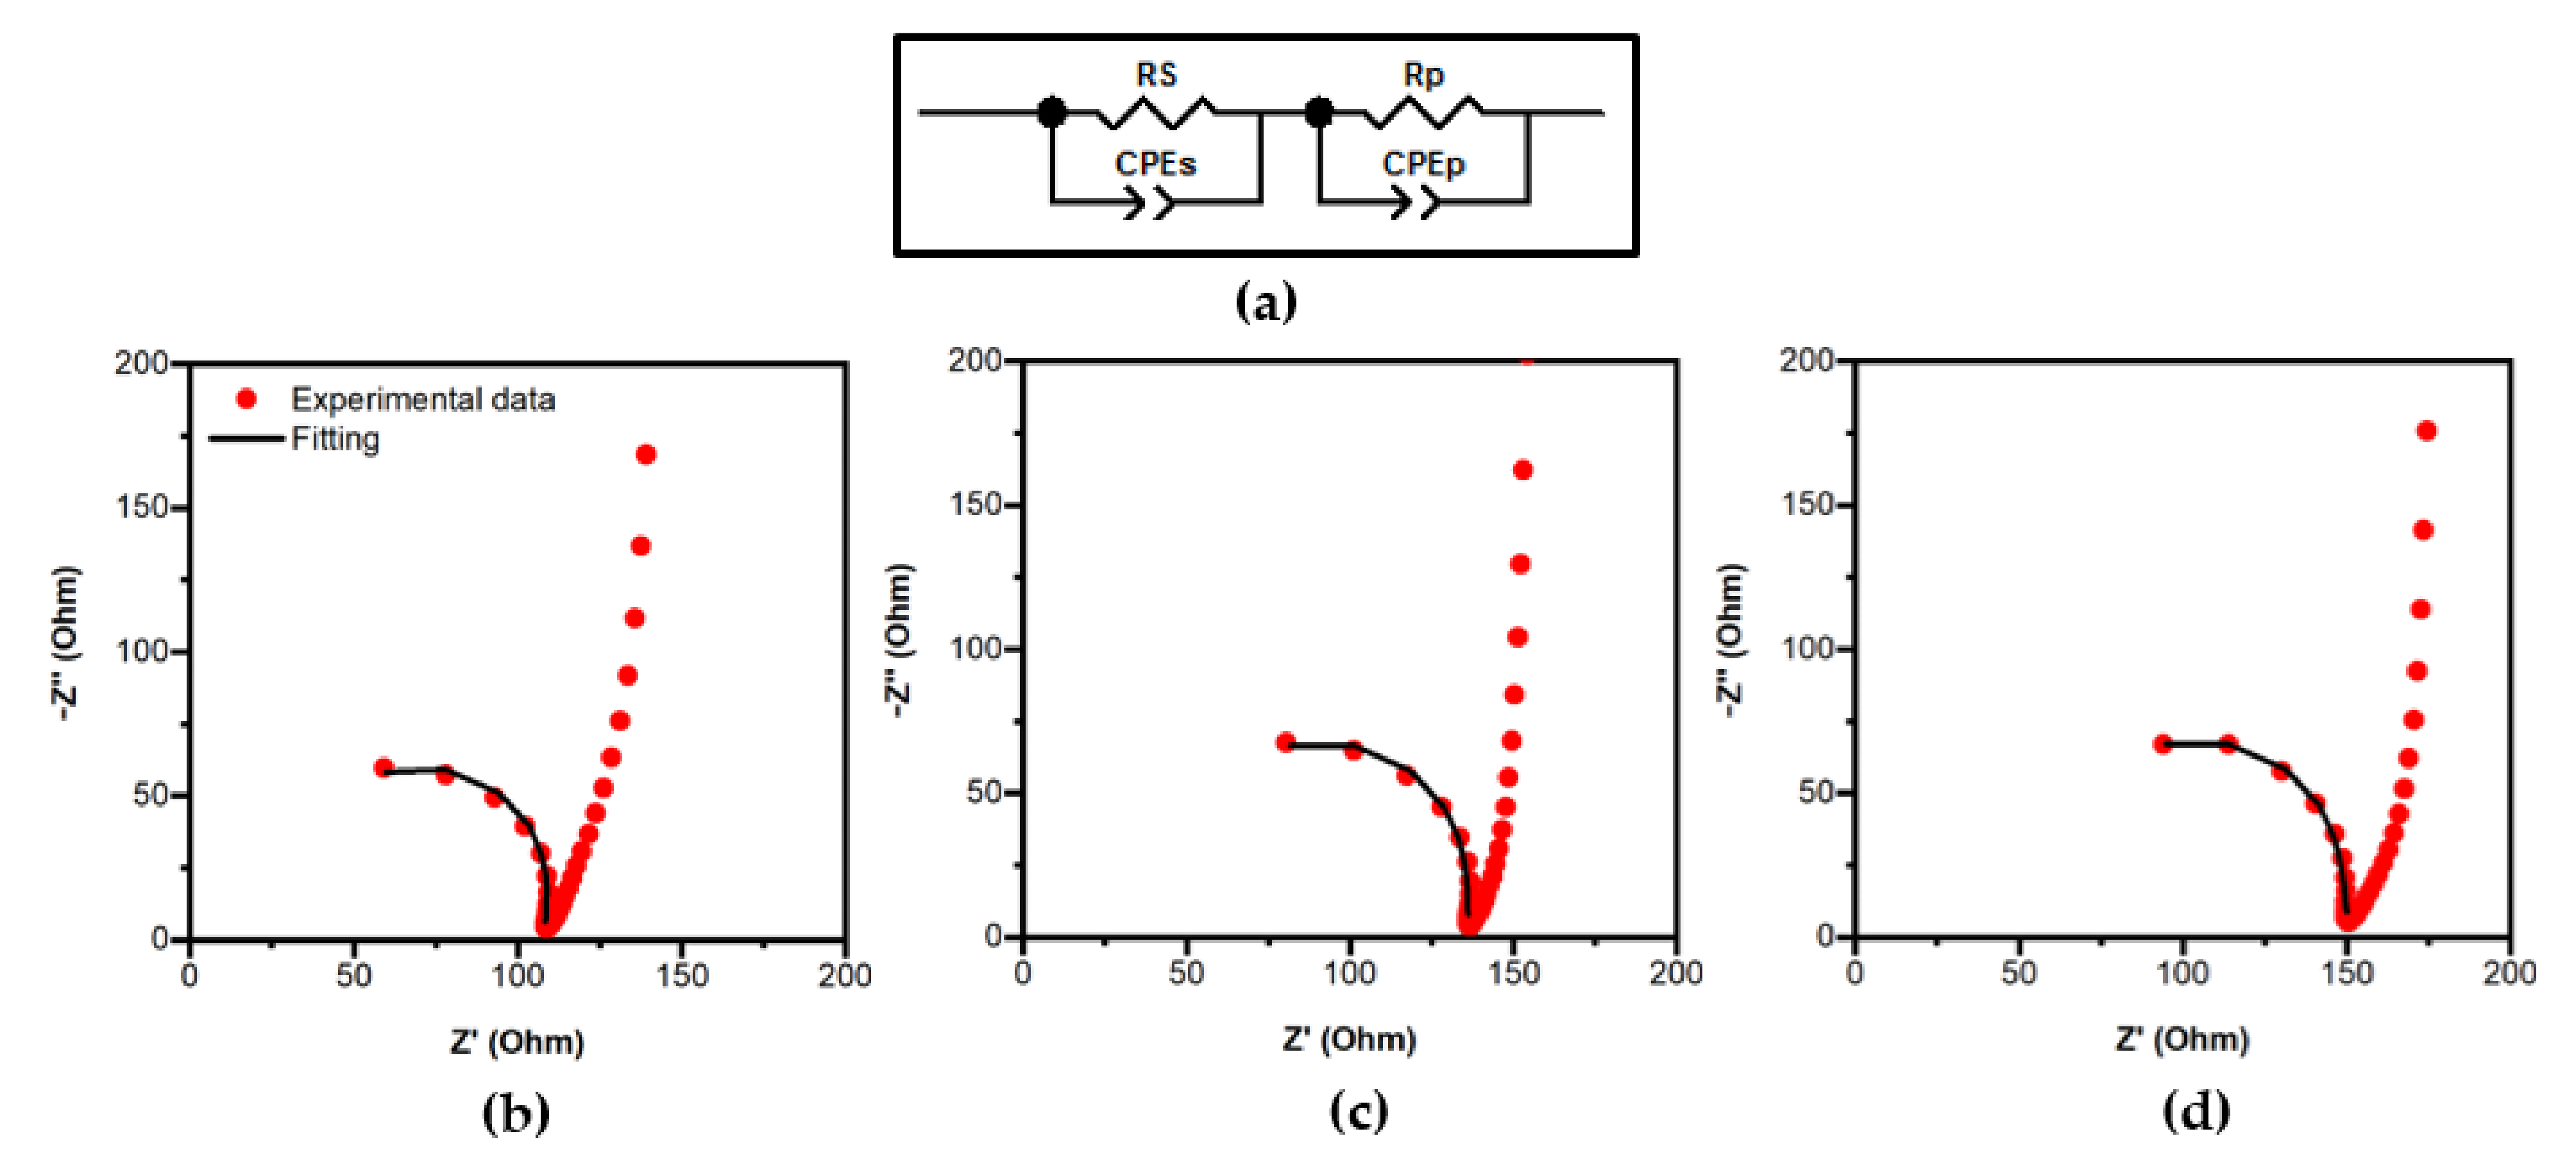
3.2.2. Electronic Conduction Properties

To investigate the electronic conductivity properties of the thin films, the measurement of charge transfer resistance by EIS was performed as a first approach. To better reflect the reality, equivalent electrical models were used to fit the Nyquist plots issued from EIS measurements. Equivalent electrical models include two different kinds of components: a resistor R representing the charge transfer resistance of the studied material, and a constant phase element, CPE, representing the material–electrolyte interface assimilated to a capacitance in the case of a non-perfectly homogeneous material surface. The CPE contribution is defined by two components CPE-T and CPE-P. CPE-T is the parameter containing the capacitance information, and CPE-P is an empirical constant related to the semicircle of the Nyquist plot, ranging from 0 to 1. When CPE-P = 1, the CPE behaves as a pure capacitor, while when CPE-P = 0, the CPE behaves as a pure resistor, and when CPE-P is between 0 and 1, it is a pseudo-capacitor also called the Warburg element [44,45,46,47,48,49].
Figure 8 shows the Nyquist plot and corresponding equivalent electrical model for the ITO substrate only. In this case (one single material in contact with the electrolyte solution), the model is a resistor (named RS for the substrate) in parallel with a CPE (named CPES for the substrate) [50].
In the case of thin TiO2-based layers deposited on the ITO substrate (Figure 9), the corresponding equivalent electrical model combines in a series two sets of resistance in parallel with CPE: one set for the substrate (RS ∥ CPES) with RS and CPES values deduced from the model applied on the substrate only, and one set for the deposit (RP ∥ CPEP).
Table 4 contains R, CPE-P, and CPE-T values for the ITO substrate and the three thin films synthesized using surfactants. In terms of charge transfer resistance, we find the hierarchy RP(TiO2-GC) < RP(TiO2-GB) < RP(TiO2-BIO). Now, the resistance determined by EIS is impacted by film thickness. To overcome this dependence, the electrical resistivity ρ can be extracted using Equation (2), and then, the electrical conductivity is deduced from Equation (3):
ρ = (R.S)/d
σ = d/(R.S)
where R is the resistance, S is the surface, and d is the thickness of the TiO2 films.
Considering the same surface S for all sample (equal to 1 cm2), and taking into account the thicknesses given in Table 2, we find the following hierarchy for the electronic conductivity: σ(TiO2-BIO) > σ(TiO2-GB) > σ(TiO2-GC), whose values are given in Table 4. Logically, the lower the specific surface area, the higher the conductivity, which is certainly directly related to the highest intrinsic material density favorable to the transport of electrons well known to operate by percolation. Therefore, TiO2-BIO, which was previously proved to have the lowest specific surface area, presents the best electronic conductivity. In terms of CPE, no noticeable difference appears between the different materials, which means that the interface between each material and the electrolyte solution is always quite the same (at least from an electric point of view).
In addition, with the aim of deepening our knowledge related to the conductive ability of materials, a nanoscale measurement by C-AFM has been envisaged. Figure 10 presents the C-AFM results for TiO2-GC and TiO2-BIO films. Concerning TiO2-GC, the comparison of the surface topography (Figure 10a) and the current map at −8 V (Figure 10b) shows that the current presents a heterogeneous distribution over the surface with a non-conductive area and low conductive area. The occurrence diagram (Figure 10c) that represents the statistical distribution of current values on the material surface highlighted this. The conductive zone (depicted in gray in Figure 10c) is reduced. It represents only 20% of the material with a current ranging from −0.05 to −0.1 nA for an applied bias voltage of −8 V. Concerning TiO2-BIO, the comparison of the surface topography (Figure 10d) and the current map at −10 V (Figure 10e) shows that the current presents a heterogeneous distribution over the surface with a more or less conductive area. Indeed, the occurrence diagram shows that the conductive area (depicted in gray in Figure 10f) represents 92% of the material with a current ranging from −0.05 to −6 nA for an applied bias voltage of −10 V. For the TiO2-GB, no results could be obtained, because no current could be collected.
As TiO2 samples have different thicknesses, the applied electric field should be considered for comparison. Considering the film thickness determined by SEM (Table 2), an applied electric field of −18.0 × 10⁶ V × m−1 and −10.7 × 10⁶ V × m−1 was determined for TiO2-GC and TiO2-BIO, respectively. These results show that the TiO2-BIO sample presents better conductive properties at nanoscale than TiO2-GC does. Indeed, it presents a conductive area of 97% and a current ranging from −0.05 to −6 nA for an applied electric field of −10.7 × 10⁶ V × m−1. In contrast, the conductive area represents only 20% of the surface for the TiO2-GC films (current ranging from −0.05 to −1.5 nA for an applied electric field of −18.0 × 10⁶ V × m−1). To explain this, we have to consider the specific surface of the samples. As previously mentioned, the specific surface of TiO2-BIO is noticeably lower than that of TiO2-GC, which means that the layer is intrinsically denser. Then, the electrons must flow better through the TiO2-BIO layer at the nanoscale. These results are consistent with those obtained at the macroscale using EIS.

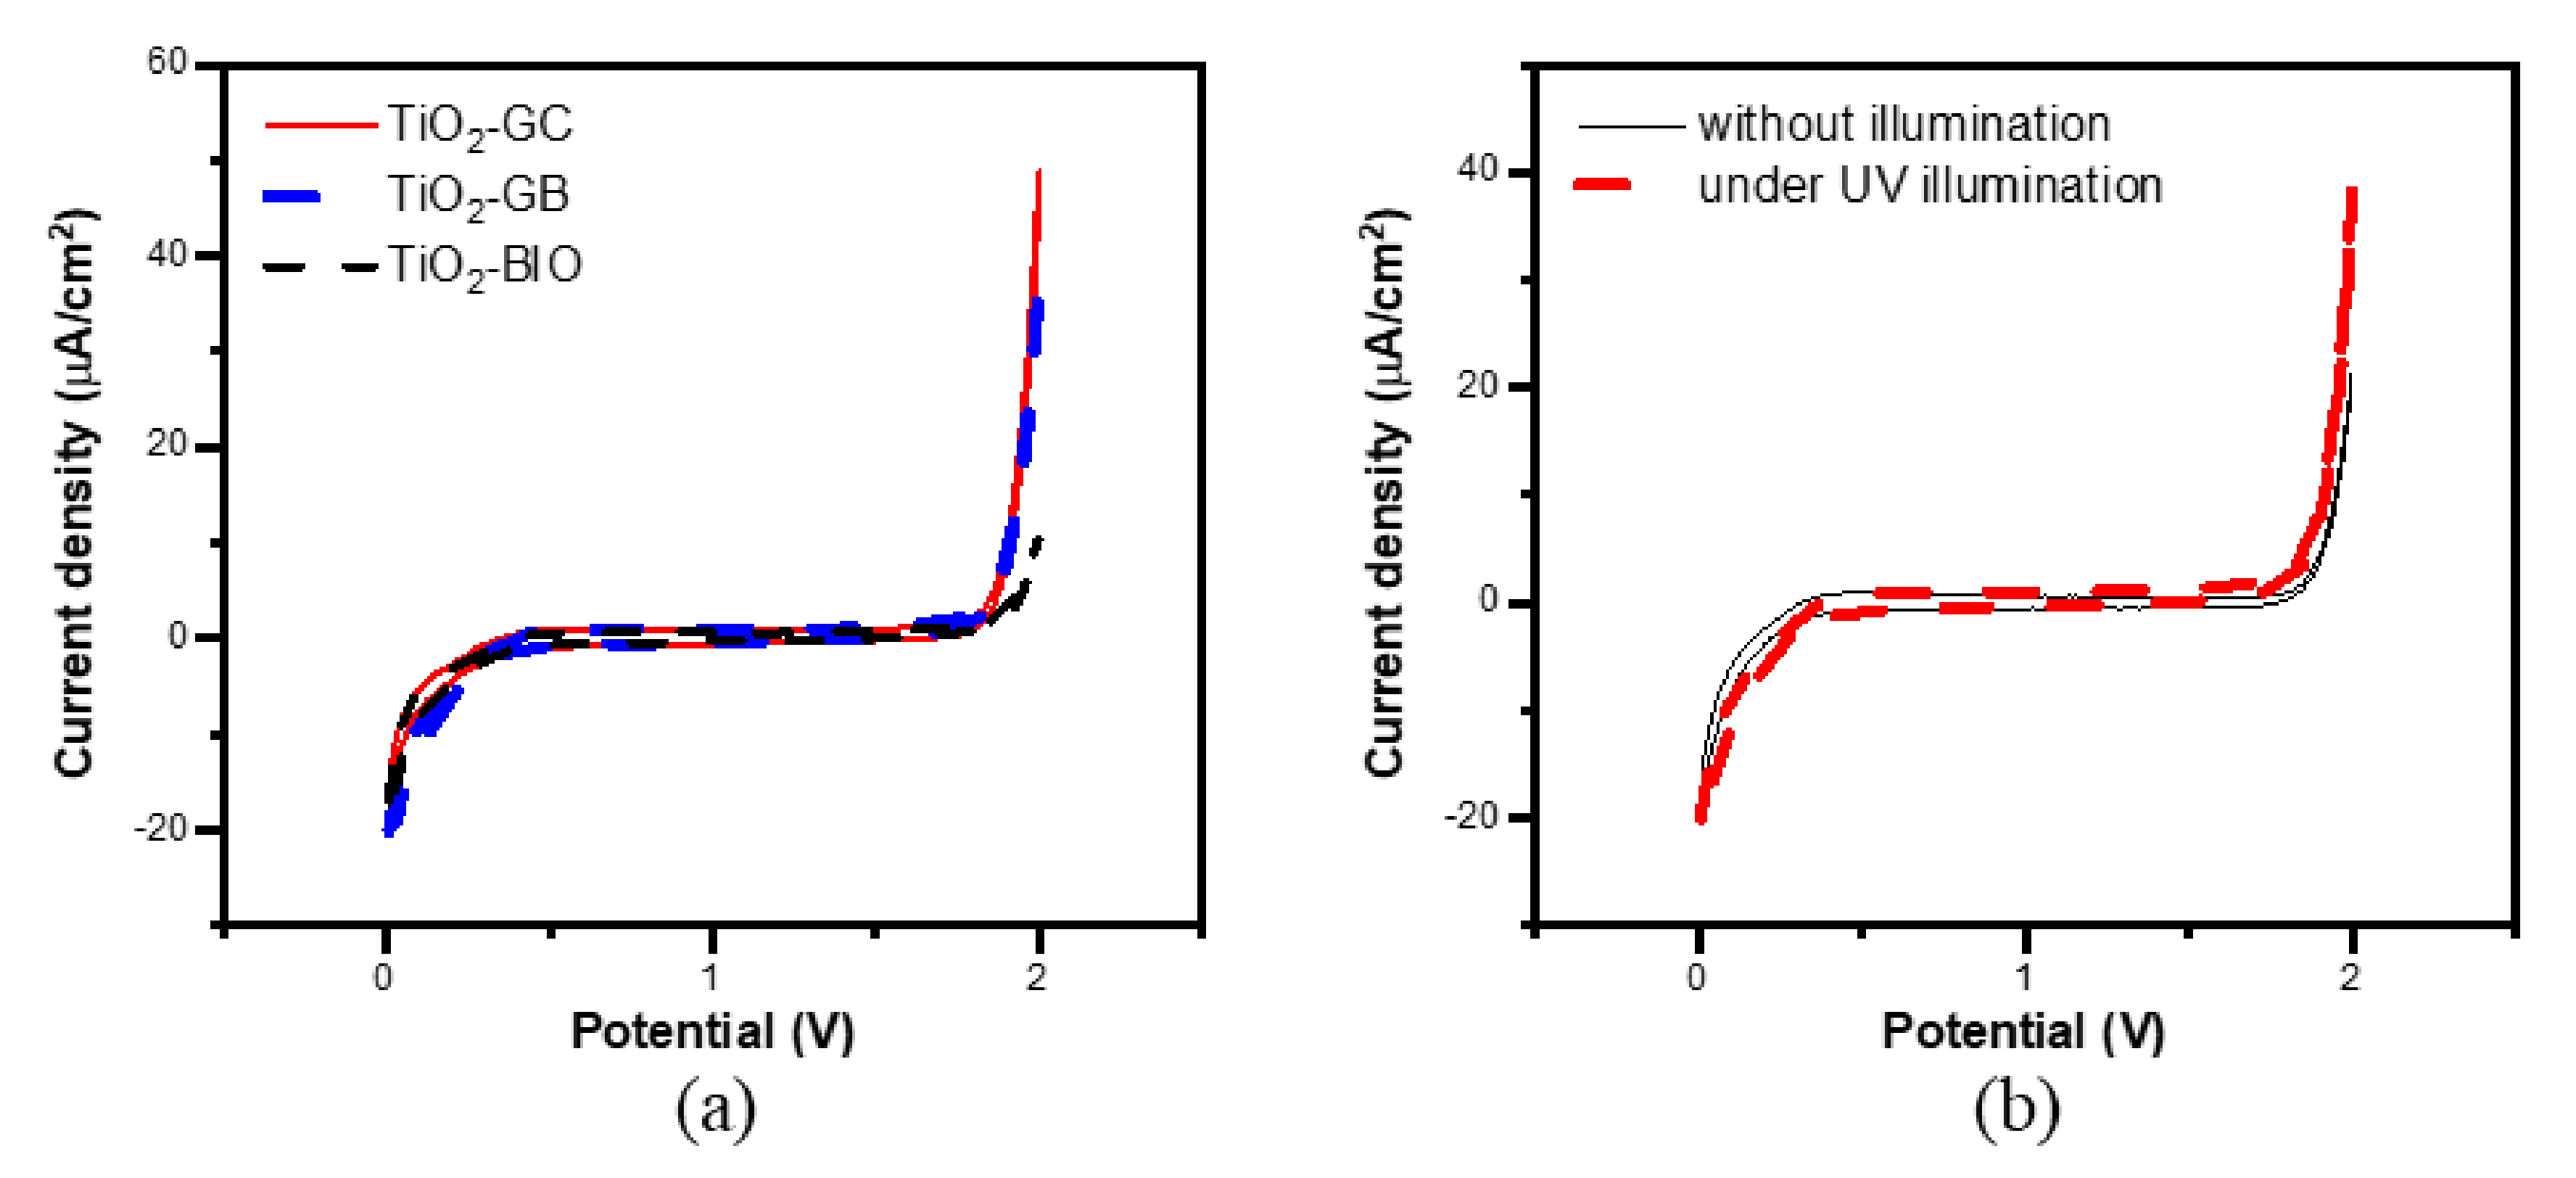
3.2.3. Cyclic Voltammetry

Cyclic voltammetry measurements are used to probe the current flowing in the circuit as a function of the applied potential. These measurements were carried out from 0 to 2 V without illumination and under UV illumination to observe the photo response of our material. This analysis provides information on the global efficiency of the photo anode, because it brings together the photocatalysis aspect and the electrical conductivity. In our case, considering an alkaline medium with a pH equal to 12, there are two reactions: the reduction of water into H2 at the cathode at an equilibrium potential of 0.1 V, and the oxidation of water into O2 at the anode at an equilibrium potential of 1.1 V (Equations (4) and (5)). Due to kinetic overvoltage at the anode, the observed potentials are 0.1 V and 1.8 V at the cathode and anode, respectively [51].
Cathode :   4   H 2 O + 4 e 2   H 2 + 4   OH
Anode :   4   OH O 2 + 2   H 2 O + 4 e
Figure 11a represents the voltammogram of TiO2-GB (as representative of all samples independently on the surfactant used) under UV illumination and without illumination. The current density is higher under illumination because the anode absorbs photons, so it can generate more electron/hole pairs: the material is photoactive. The voltammogram presented in Figure 11b compares the three samples under UV illumination; the data issued from these voltammograms are in Table 4.
All three samples have the same onset potential equal to 1.84–1.85 V, which means that they require the same voltage (i.e., energy) to be kinetically active as a photoanode. Moreover, TiO2-GC induces a higher current density (up to 50 µA × cm−2, as can be seen at 2 V more clearly than at the onset potential) than TiO2-GB and TiO2-BIO, which is due to its previously highlighted supremacy in terms of photocatalytic properties. Although having the highest electronic conductivity, TiO2-BIO show the lowest current density (no more than 10 µA × cm−2 at 2 V). Therefore, the photoelectrochemical performance seems to be essentially controlled by photocatalytic properties.

4. Conclusions

In this work, we synthesized sol–gel TiO2 thin films using three types of bio-sourced surfactants, TiO2-GC, TiO2-GB, and TiO2-BIO as porous agents. By Rietveld refinement, the amount of anatase and rutile phase was determined; the presence of surfactants promoted the formation of a rutile phase (in the range of 60–90% depending on the surfactant). Only the GC surfactant allowed increasing the specific surface area of the films (up to 101 m2 × g−1 when compared to 30 m2 × g−1 without surfactant), leading to the best photocatalytic properties under UV light according to the Pilkington test. On the contrary, the BIO surfactant made the specific surface area decrease (down to 16 m2 × g−1), giving rise to the most dense material being the best electronic conductive one (7.1 × 10⁻⁷ S × cm−1 measured by EIS), whatever the measurement scale may be (macro by EIS or nano by C-AFM). Finally, it was shown that the TiO2-GC sample with the best photocatalytic properties led to the UV-activated photoproduction of a higher current density (up to 50 µA × cm−2 at 2 V) than the other two samples, proving the control of the photoelectrochemical performance by the photocatalytic process in direct relation with the film specific surface area. To get more information, we will continue to study the effect of surfactants on the photocatalytic properties with the degradation of orange acid 7. Hydrogen production tests will also be performed. Last but not the least, TiO2 materials will be associated to other oxides to get heterojunctions, and UV light will be replaced by solar light to take a further step forward in a sustainable approach.

Author Contributions

F.D. performed the experiments, data analysis, discussed the results, and wrote and revised the manuscript. A.A.N. took part in the photoelectrochemical tests and revised the manuscript. C.V.-F. did C-AFM experiments, discussed the related results, wrote the related part, and revised the manuscript. M.R., F.R. and S.R. discussed the results, wrote and revised the manuscript, and supervised and validated the work. All authors have read and agreed to the published version of the manuscript.

Funding

This research received no external funding.

Institutional Review Board Statement

Not applicable.

Informed Consent Statement

Not applicable.

Data Availability Statement

The data supporting the reported results can be made available upon request.

Acknowledgments

Thanks to Surfactgreen and Lankem for supplying the surfactants. Thanks to Arie Van der Lee and Didier Cot at IEM for expertise in XRD and SEM, respectively. Thanks to Valérie Flaud at ICGM Montpellier for XPS analysis. Thanks to Philippe Deniard and the team of the good permanent training “Diffraction by polycrystalline materials” at INM Nantes.

Conflicts of Interest

The authors declare no conflict of interest.

References

  1. Fujishima, A.; Rao, T.N.; Tryk, D.A. Titanium dioxide photocatalysis. J. Photochem. Photobiol. C Photochem. Rev. 2000, 1, 1–21. [Google Scholar] [CrossRef]
  2. Walter, M.G.; Warren, E.L.; McKone, J.R.; Boettcher, S.W.; Mi, Q.; Santori, E.A.; Lewis, N.S. Solar water splitting cells. Chem. Rev. 2010, 110, 6446–6473. [Google Scholar] [CrossRef]
  3. Liao, C.-H.; Huang, C.-W.; Wu, J.C.S. Hydrogen Production from Semiconductor-based Photocatalysis via Water Splitting. Catalysts 2012, 2, 490–516. [Google Scholar] [CrossRef] [Green Version]
  4. Wen, J.; Li, X.; Liu, W.; Fang, Y.; Xie, J.; Xu, Y. Photocatalysis fundamentals and surface modification of TiO2 nanomaterials. Chin. J. Catal. 2015, 36, 2049–2070. [Google Scholar] [CrossRef]
  5. Ni, M.; Leung, M.K.H.; Leung, D.Y.C.; Sumathy, K. A review and recent developments in photocatalytic water-splitting using TiO2 for hydrogen production. Renew. Sustain. Energy Rev. 2007, 11, 401–425. [Google Scholar] [CrossRef]
  6. Nah, Y.C.; Paramasivam, I.; Schmuki, P. Doped TiO2 and TiO2 nanotubes: Synthesis and applications. ChemPhysChem 2010, 11, 2698–2713. [Google Scholar] [CrossRef]
  7. Joy, J.; Mathew, J.; George, S.C. Nanomaterials for photoelectrochemical water splitting—Review. Int. J. Hydrog. Energy 2018, 43, 4804–4817. [Google Scholar] [CrossRef]
  8. Singh, R.; Dutta, S. A review on H2 production through photocatalytic reactions using TiO2/TiO2-assisted catalysts. Fuel 2018, 220, 607–620. [Google Scholar] [CrossRef]
  9. Pelaez, M.; Nolan, N.T.; Pillai, S.C.; Seery, M.K.; Falaras, P.; Kontos, A.G.; Dunlop, P.S.M.; Hamilton, J.W.J.; Byrne, J.A.; O’Shea, K.; et al. A review on the visible light active titanium dioxide photocatalysts for environmental applications. Appl. Catal. B Environ. 2012, 125, 331–349. [Google Scholar] [CrossRef] [Green Version]
  10. Brinker, C.J.; Frye, G.C.; Hurd, A.J.; Ashley, C.S. Fundamentals of sol-gel dip coating. Thin Solid Films 1991, 201, 97–108. [Google Scholar] [CrossRef]
  11. Belleville, P. Functional coatings: The sol-gel approach. Comptes Rendus Chim. 2010, 13, 97–105. [Google Scholar] [CrossRef]
  12. Bosc, F.; Lacroix-Desmazes, P.; Ayral, A. TiO2 anatase-based membranes with hierarchical porosity and photocatalytic properties. J. Colloid Interface Sci. 2006, 304, 545–548. [Google Scholar] [CrossRef] [PubMed]
  13. Ren, T.-Z.; Yuan, Z.-Y.; Su, B.-L. Surfactant-assisted preparation of hollow microspheres of mesoporous TiO2. Chem. Phys. Lett. 2003, 374, 170–175. [Google Scholar] [CrossRef]
  14. Yun, H.; Miyazawa, K.; Zhou, H.; Honna, I.; Kuwabara, M. Synthesis of mesopourous Thin TiO2 Films with hexagonal pore structures using triblock copolymer templates. Adv. Mater. 2001, 13, 1377–1380. [Google Scholar] [CrossRef]
  15. Estrada-Flores, S.; Martínez-Luévanos, A.; Perez-Berumen, C.M.; García-Cerda, L.A.; Flores-Guia, T.E. Relationship between morphology, porosity, and the photocatalytic activity of TiO2 obtained by sol-gel method assisted with ionic and nonionic surfactants. Bol. Soc. Esp. Ceram. Vidr. 2019. [Google Scholar] [CrossRef]
  16. Md, F. Biosurfactant: Production and Application. J. Pet. Environ. Biotechnol. 2012, 3. [Google Scholar] [CrossRef] [Green Version]
  17. Wu, Q.; Zhao, L.; Song, R.; Ma, A. Research progress of surfactant biodegradation. IOP Conf. Ser. Earth Environ. Sci. 2019, 227, 052023. [Google Scholar] [CrossRef]
  18. Najafidoust, A.; Allahyari, S.; Rahemi, N.; Tasbihi, M. Uniform coating of TiO2 nanoparticles using biotemplates for photocatalytic wastewater treatment. Ceram. Int. 2020, 46, 4707–4719. [Google Scholar] [CrossRef]
  19. Cui, J.; He, W.; Liu, H.; Liao, S.; Yue, Y. Ordered hierarchical mesoporous anatase TiO2 from yeast biotemplates. Colloids Surf. B Biointerfaces 2009, 74, 274–278. [Google Scholar] [CrossRef]
  20. Li, J.; Shi, J.; Li, Y.; Ding, Z.; Huang, J. A biotemplate synthesized hierarchical Sn-doped TiO2 with superior photocatalytic capacity under simulated solar light. Ceram. Int. 2021, 47, 8218–8227. [Google Scholar] [CrossRef]
  21. Li, X.; Fan, T.; Zhou, H.; Chow, S.K.; Zhang, W.; Zhang, D.; Guo, Q.; Ogawa, H. Enhanced light-harvesting and photocatalytic properties in morph-TiO2 from green-leaf biotemplates. Adv. Funct. Mater. 2009, 19, 45–56. [Google Scholar] [CrossRef]
  22. Mohamed, M.A.; Wan Salleh, W.N.; Jaafar, J.; Rosmi, M.S.; Zul, Z.A.; Abd Mutalib, M.; Ismail, A.F.; Tanemura, M. Carbon as amorphous shell and interstitial dopant in mesoporous rutile TiO2: Bio-template assisted sol-gel synthesis and photocatalytic activity. Appl. Surf. Sci. 2017, 393, 46–59. [Google Scholar] [CrossRef]
  23. Bao, R.; Li, R.; Chen, C.; Wu, H.; Xia, J.; Long, C.; Li, H. Biotemplated synthesis of 3D rare earth–doped TiO2 hollow spheres for photocatalytic application. J. Phys. Chem. Solids 2019, 126, 78–84. [Google Scholar] [CrossRef]
  24. Ammerlaan, J.A.M.; Curdy, R.J.M.; Hurst, S.J. International Patent WO 00/75087 A1, Process for the production of photocatalytic coatings on substrates2000.
  25. Sakata, M.; Cooper, M.J. An analysis of the Rietveld refinement method. J. Appl. Crystallogr. 1979, 12, 554–563. [Google Scholar] [CrossRef]
  26. Thamaphat, K.; Limsuwan, P.; Ngotawornchai, B. Phase Characterization of TiO2 Powder by XRD and TEM. Kasetsart J. Nat. Sci. 2008, 42, 357–361. [Google Scholar]
  27. Bardestani, R.; Patience, G.S.; Kaliaguine, S. Experimental methods in chemical engineering: Specific surface area and pore size distribution measurements—BET, BJH, and DFT. Can. J. Chem. Eng. 2019, 97, 2781–2791. [Google Scholar] [CrossRef]
  28. Fagerlund, G. Determination of specific surface by the BET method. Matériaux Constr. 1973, 6, 239–245. [Google Scholar] [CrossRef]
  29. Storck, S.; Bretinger, H.; Maier, W.F. Characterization of micro- and mesoporous solids by physisorption methods and pore-size analysis. Appl. Catal. A Gen. 1998, 174, 137–146. [Google Scholar] [CrossRef] [Green Version]
  30. Allen, N.S.; Mahdjoub, N.; Vishnyakov, V.; Kelly, P.J.; Kriek, R.J. The effect of crystalline phase (anatase, brookite and rutile) and size on the photocatalytic activity of calcined polymorphic titanium dioxide (TiO2 ). Polym. Degrad. Stab. 2018, 150, 31–36. [Google Scholar] [CrossRef]
  31. Kim, H.J.; Shul, Y.G.; Han, H. Photocatalytic properties of silica-supported TiO2. Top. Catal. 2005, 35, 287–293. [Google Scholar] [CrossRef]
  32. Zhu, K.; Kopidakis, N.; Neale, N.R.; Van De Lagemaat, J.; Frank, A.J. Influence of surface area on charge transport and recombination in dye-sensitǐzed TiO2 solar cells. J. Phys. Chem. B 2006, 110, 25174–25180. [Google Scholar] [CrossRef]
  33. Biesinger, M.C.; Lau, L.W.M.; Gerson, A.R.; Smart, R.S.C. Resolving surface chemical states in XPS analysis of first row transition metals, oxides and hydroxides: Sc, Ti, V, Cu and Zn. Appl. Surf. Sci. 2010, 257, 887–898. [Google Scholar] [CrossRef]
  34. Essalhi, Z.; Hartiti, B.; Lfakir, A.; Siadat, M.; Thevenin, P. Optical properties of TiO2 Thin films prepared by Sol Gel method. J. Mater. Environ. Sci. 2016, 7, 1328–1333. [Google Scholar]
  35. Ismail, A.A. Facile synthesis of mesoporous Ag-loaded TiO2 thin film and its photocatalytic properties. Microporous Mesoporous Mater. 2012, 149, 69–75. [Google Scholar] [CrossRef]
  36. Sonawane, R.S.; Kale, B.B.; Dongare, M.K. Preparation and photo-catalytic activity of Fe-TiO2 thin films prepared by sol-gel dip coating. Mater. Chem. Phys. 2004, 85, 52–57. [Google Scholar] [CrossRef]
  37. Makuła, P.; Pacia, M.; Macyk, W. How To Correctly Determine the Band Gap Energy of Modified Semiconductor Photocatalysts Based on UV-Vis Spectra. J. Phys. Chem. Lett. 2018, 9, 6814–6817. [Google Scholar] [CrossRef] [PubMed] [Green Version]
  38. Miquelot, A. Propriétés Structurales, Optiques et Electriques D’hétérojonctions Co3O4/TiO2 Déposées par MOCVD pour L’étude de la Production de H2 par Dissociation Photocatalytique de L’eau; Université de Toulouse: Toulouse, France, 2019. [Google Scholar]
  39. Nosaka, Y.; Nosaka, A.Y. Reconsideration of Intrinsic Band Alignments within Anatase and Rutile TiO2. J. Phys. Chem. Lett. 2016, 7, 431–434. [Google Scholar] [CrossRef] [PubMed]
  40. Szlachetko, J.; Pichler, M.; Pergolesi, D.; Sá, J.; Lippert, T. Determination of conduction and valence band electronic structure of La2Ti2O7 thin film. RSC Adv. 2014, 4, 11420–11422. [Google Scholar] [CrossRef]
  41. Zhou, M.; Roualdès, S.; Ayral, A. New photocatalytic contactors obtained by PECVD deposition of TiO2 thin layers on the surface of macroporous supports: PECVD TiO2-based membranes as photocatalytic contactors. Eur. Phys. J. Spec. Top. 2015, 224, 1871–1882. [Google Scholar] [CrossRef]
  42. Jang, H.D.; Kim, S.K.; Kim, S.J. Effect of particle size and phase composition of titanium dioxide nanoparticles on the photocatalytic properties. J. Nanopart. Res. 2001, 3, 141–147. [Google Scholar] [CrossRef]
  43. Zhang, Z.; Hossain, M.F.; Takahashi, T. Photoelectrochemical water splitting on highly smooth and ordered TiO2 nanotube arrays for hydrogen generation. Int. J. Hydrog. Energy 2010, 35, 8528–8535. [Google Scholar] [CrossRef]
  44. Metrohm AutoLab. Fundamental Electrochemical Impedance Spectroscopy (EIS) Part 3—Data Analysis. 2007; AN-EIS-003.
  45. Jovic, V.D. Determination of the Correct Value of Cdl from the Impedance Results Fitted by the Commercially Available Software. 2003, pp. 9–11. Available online: https://www.researchgate.net/profile/Vladimir-Jovic/publication/242424693_Determination_of_the_Correct_Value_of_Cdl_from_the_Impedance_Results_Fitted_by_the_Commercially_Available_Software/links/57c569c008ae496e421271f9/Determination-of-the-Correct-Value-of-Cdl-from-the-Impedance-Results-Fitted-by-the-Commercially-Available-Software.pdf (accessed on 16 July 2021).
  46. Yan, Z.; Zhu, L.; Li, Y.C.; Wycisk, R.J.; Pintauro, P.N.; Hickner, M.A.; Mallouk, T.E. The balance of electric field and interfacial catalysis in promoting water dissociation in bipolar membranes. Energy Environ. Sci. 2018, 11, 2235–2245. [Google Scholar] [CrossRef]
  47. Irvine, J.T.S.; Sinclair, D.C.; West, A.R. Electroceramics: Characterization by Impedance Spectroscopy. Adv. Mater. 1990, 2, 132–138. [Google Scholar] [CrossRef]
  48. Kim, C.H.; Kisiel, K.; Jung, J.; Ulanski, J.; Geffroy, B.; Bonnassieux, Y.; Horowitz, G.; Kim, C.H.; Kisiel, K.; Jung, J.; et al. Persistent photoexcitation effect on the poly (3-hexylthiophene) film: Impedance measurement and modeling. Synth. Met. 2012, 162, pp460. [Google Scholar] [CrossRef] [Green Version]
  49. Gönüllü, Y.; Kelm, K.; Mathur, S.; Saruhan, B. Equivalent circuit models for determination of the relation between the sensing behavior and properties of undoped/Cr doped TiO2 NTs. Chemosensors 2014, 2, 69–84. [Google Scholar] [CrossRef]
  50. Chang, B.Y. Conversion of a constant phase element to an equivalent capacitor. J. Electrochem. Sci. Technol. 2020, 11, 318–321. [Google Scholar] [CrossRef]
  51. Zhang, B.; He, L.; Yao, T.; Fan, W.; Zhang, X.; Wen, S.; Shi, J.; Li, C. Simultaneous Photoelectrocatalytic Water Oxidation and Oxygen Reduction for Solar Electricity Production in Alkaline Solution. ChemSusChem 2019, 12, 1026–1032. [Google Scholar] [CrossRef] [PubMed]
Figure 1. Scheme of the calcination program.
Catalysts 11 01228 g001
Figure 2. XRD data including Rietveld refinement approach. (a) TiO2 powder without surfactant; (b) TiO2-GB powder with GBAC18:1; (c) TiO2-GC powder with GBACoco; and (d) TiO2-BIO powder with Lansperse BIO868.
Catalysts 11 01228 g002
Figure 3. BET results with p/p° being the ratio of the applied N2 pressure over the N2 relative vapor pressure. (a) Isotherm of TiO2 and TiO2-BIO; (b) Isotherm of TiO2-GB; (c) Isotherm of TiO2-GC; and (d) BJH pore diameter desorption of TiO2-GC (dV/dlog(D)) in ordinate represents the ratio of the derivative of the absorbed volume and the derivative of the log of the pore diameter).
Catalysts 11 01228 g003
Figure 4. XPS survey of TiO2-GC, representative of all samples including surfactants.
Catalysts 11 01228 g004
Figure 5. XPS results after deconvolution: (a) C1s scan; (b) O1s scan; (c) Ti2p scan.
Catalysts 11 01228 g005
Figure 6. SEM pictures: (a) TiO2-GC; (b) TiO2-GB; and (c) TiO2-BIO.
Catalysts 11 01228 g006
Figure 7. UV-visible spectroscopy data: (a) Absorption spectra of the three samples; (b) Tauc plot with an anatase band gap for the three samples; (c) Tauc plot with a rutile band gap for the three samples.
Catalysts 11 01228 g007
Figure 8. Nyquist plot and electrical equivalent circuit for the ITO substrate.
Catalysts 11 01228 g008
Figure 9. Nyquist plot and electrical equivalent circuit for substrate–layers samples: (a) Equivalent circuit; (b) Nyquist plot for TiO2-GC/ITO; (c) Nyquist plot for TiO2-GB/ITO; and (d) Nyquist plot for TiO2-BIO/ITO.
Catalysts 11 01228 g009
Figure 10. C-AFM results over 1 µm × 0.5 µm surface. (a) Topography, (b) current map, and (c) corresponding occurrence diagrams for TiO2-GC with an applied voltage of −8 V; (d) Topography, (e) current map, and (f) corresponding occurrence diagrams for TiO2-BIO with an applied voltage of −10 V.
Catalysts 11 01228 g010
Figure 11. Cyclic voltammetry under UV light: (a) All the samples under UV illumination; (b) Difference between with and without UV illumination for TiO2-GB as example.
Catalysts 11 01228 g011
Table 1. Rietveld refinement results.
Sample NameAnatase Phase (%)Bragg R-Factor Anatase PhaseRutile Phase (%)Bragg R-Factor Rutile PhaseRwp
TiO253.26 (±0.41)2.0446.74 (±0.42)3.004.05
TiO2-GB10.30 (±1.35)3.7589.70 (±1.74)2.756.50
TiO2-GC22.42 (±0.85)3.7077.58 (±2.02)2.746.01
TiO2-BIO38.49 (±0.47)2.0461.51 (±0.60)2.925.98
Table 2. BET results and thicknesses from SEM cross-section pictures.
Sample NameBET Surface Area (m2 × g−1)Adsorption Average Pore Width BET (nm)Films Thickness (nm)
TiO2305.40-
TiO2-GC1012.66400
TiO2-GB314.95600
TiO2-BIO168.77780
Table 3. Peaks bonding energy and atomic percentages from XPS.
Name of the BondPeak Bonding Energy (eV)Atomic Percentages (%)
O1s O-C533.02.0
O1s O=C 532.23.8
O1s O-In531.38.7
O1s O-Ti, O-Sn530.339.3
Sn3d5/2486.60.6
Ti2p3/2 Ti(IV)459.016.2
Ti2p3/2 Ti(III)457.41.4
In3d5/2444.56.7
C1s C=O289.01.0
C1s C-O286.32.0
C1s C-C284.818.3
Table 4. Degradation of stearic acid after 100 min, R and CPE data from EIS fitting, and data from cyclic voltammetry under UV light.
Sample NamePilkington TestEISCyclic Voltammetry
Rst (%)σ (S × cm−1)R (Ω)CPE-PCPE-T (sCPE-P/Ω)Onset Potential (V)Current Density at Onset Potential (μA × cm−2)Current Density at 2 V (μA × cm−2)
TiO2-GC61 ± 86.0 × 10⁻⁷Rp = 670.8310−81.84437
TiO2-GB28 ± 16.3 × 10⁻⁷Rp = 960.8310−81.84312
TiO2-BIO13 ± 17.1 × 10⁻⁷Rp = 1100.7810−81.8529
ITO support--Rs = 41~110−11---
Publisher’s Note: MDPI stays neutral with regard to jurisdictional claims in published maps and institutional affiliations.

