
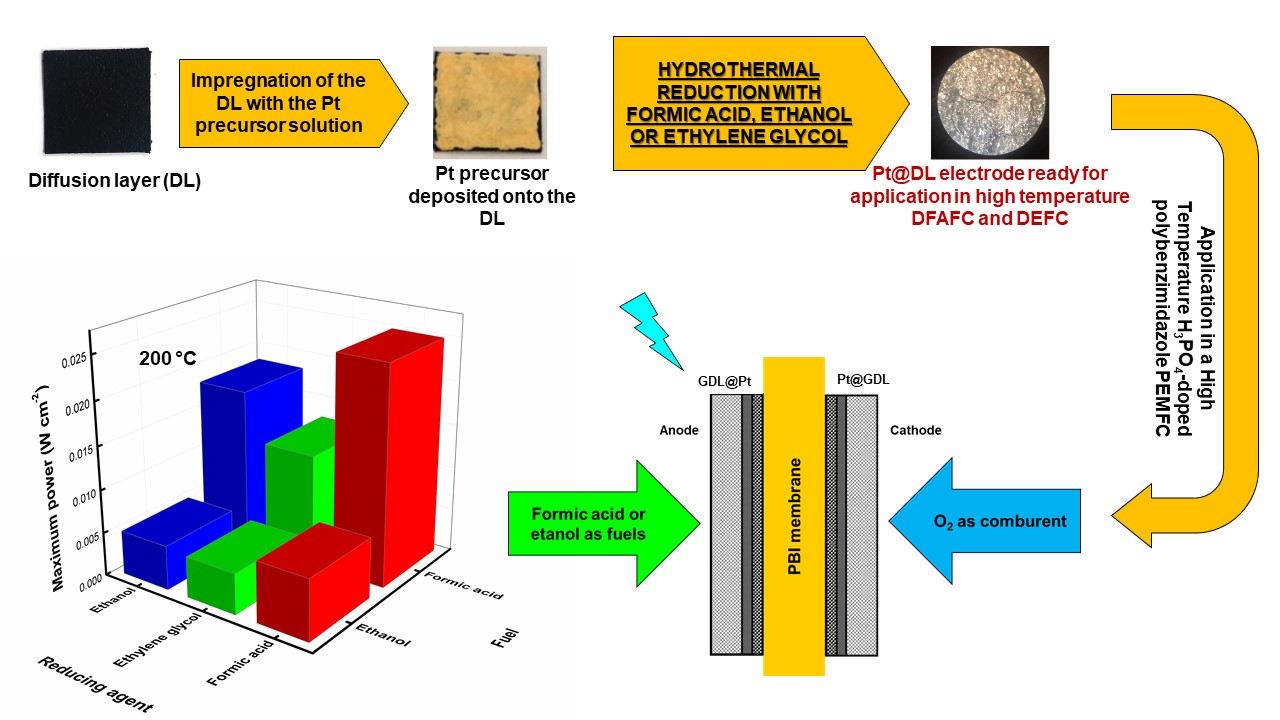
Pt Electrocatalyst Prepared by Hydrothermal Reduction onto the Gas Diffusion Layer for High-Temperature Formic Acid and Ethanol Fuel PEMFC


 , , and
Abstract
:
1. Introduction
2. Results and Discussion
2.1. Physical Characterization of the Prepared Electrodes
2.1.1. Estimation of the Platinum Loading
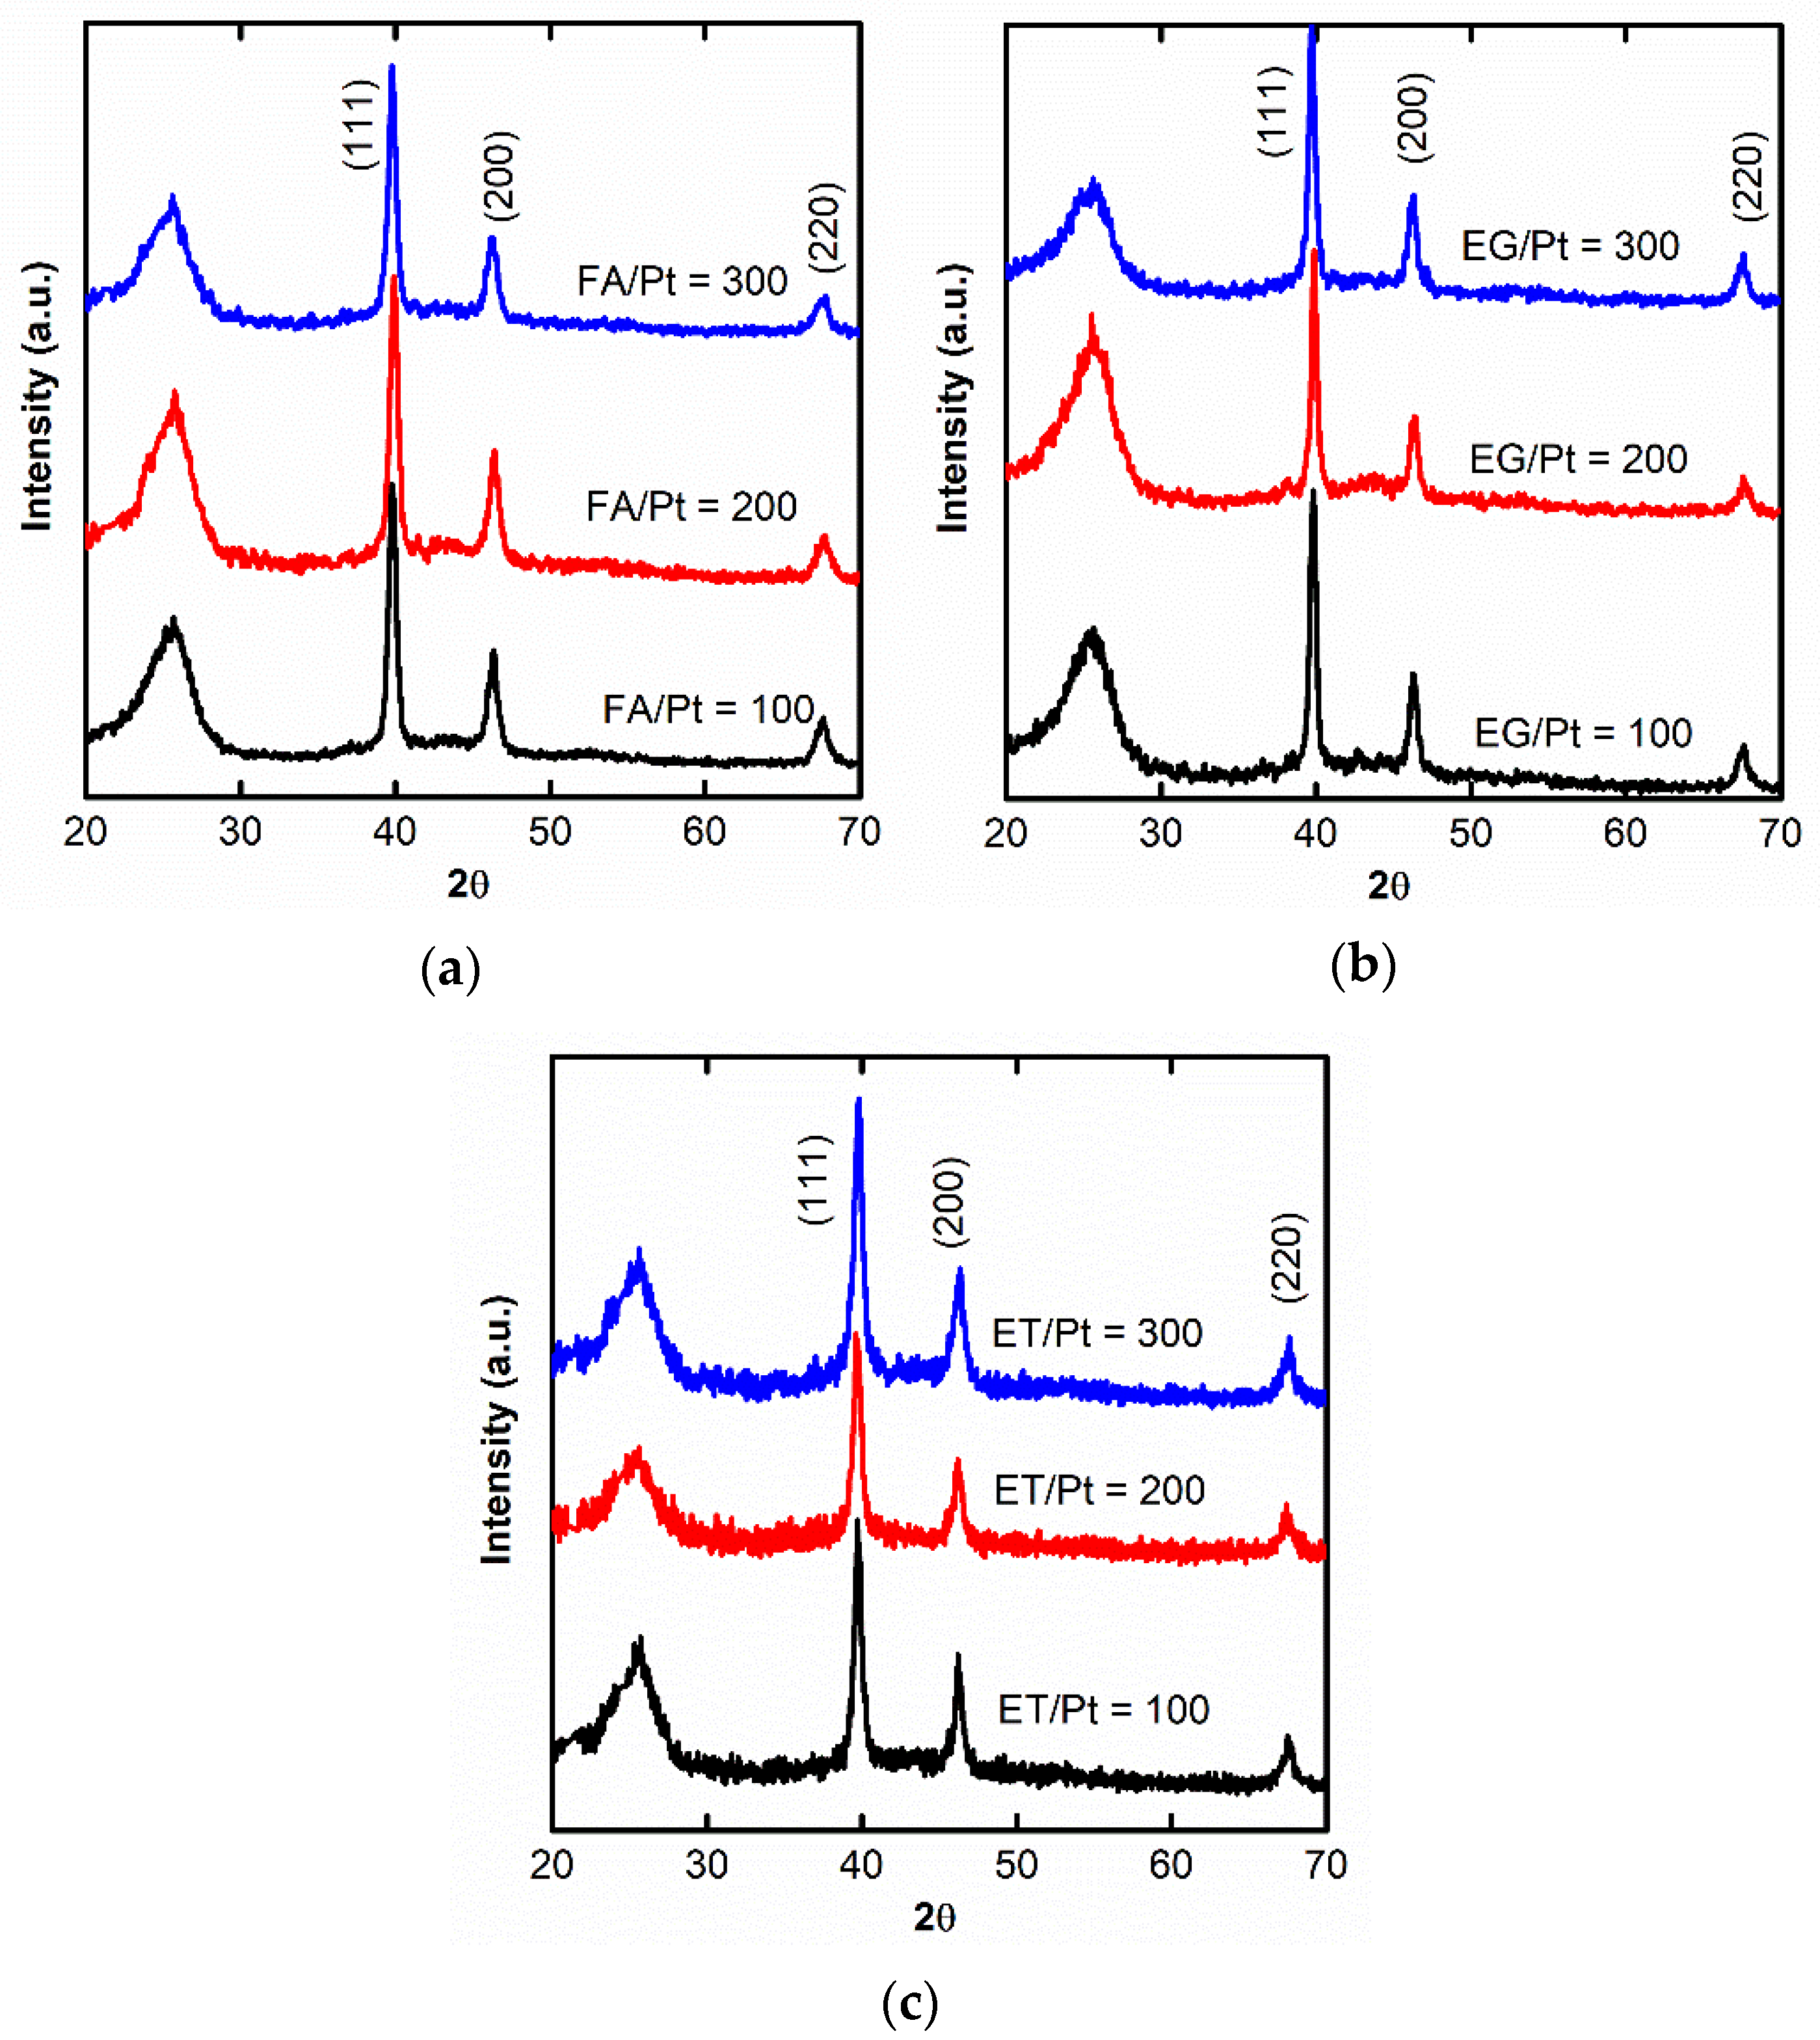
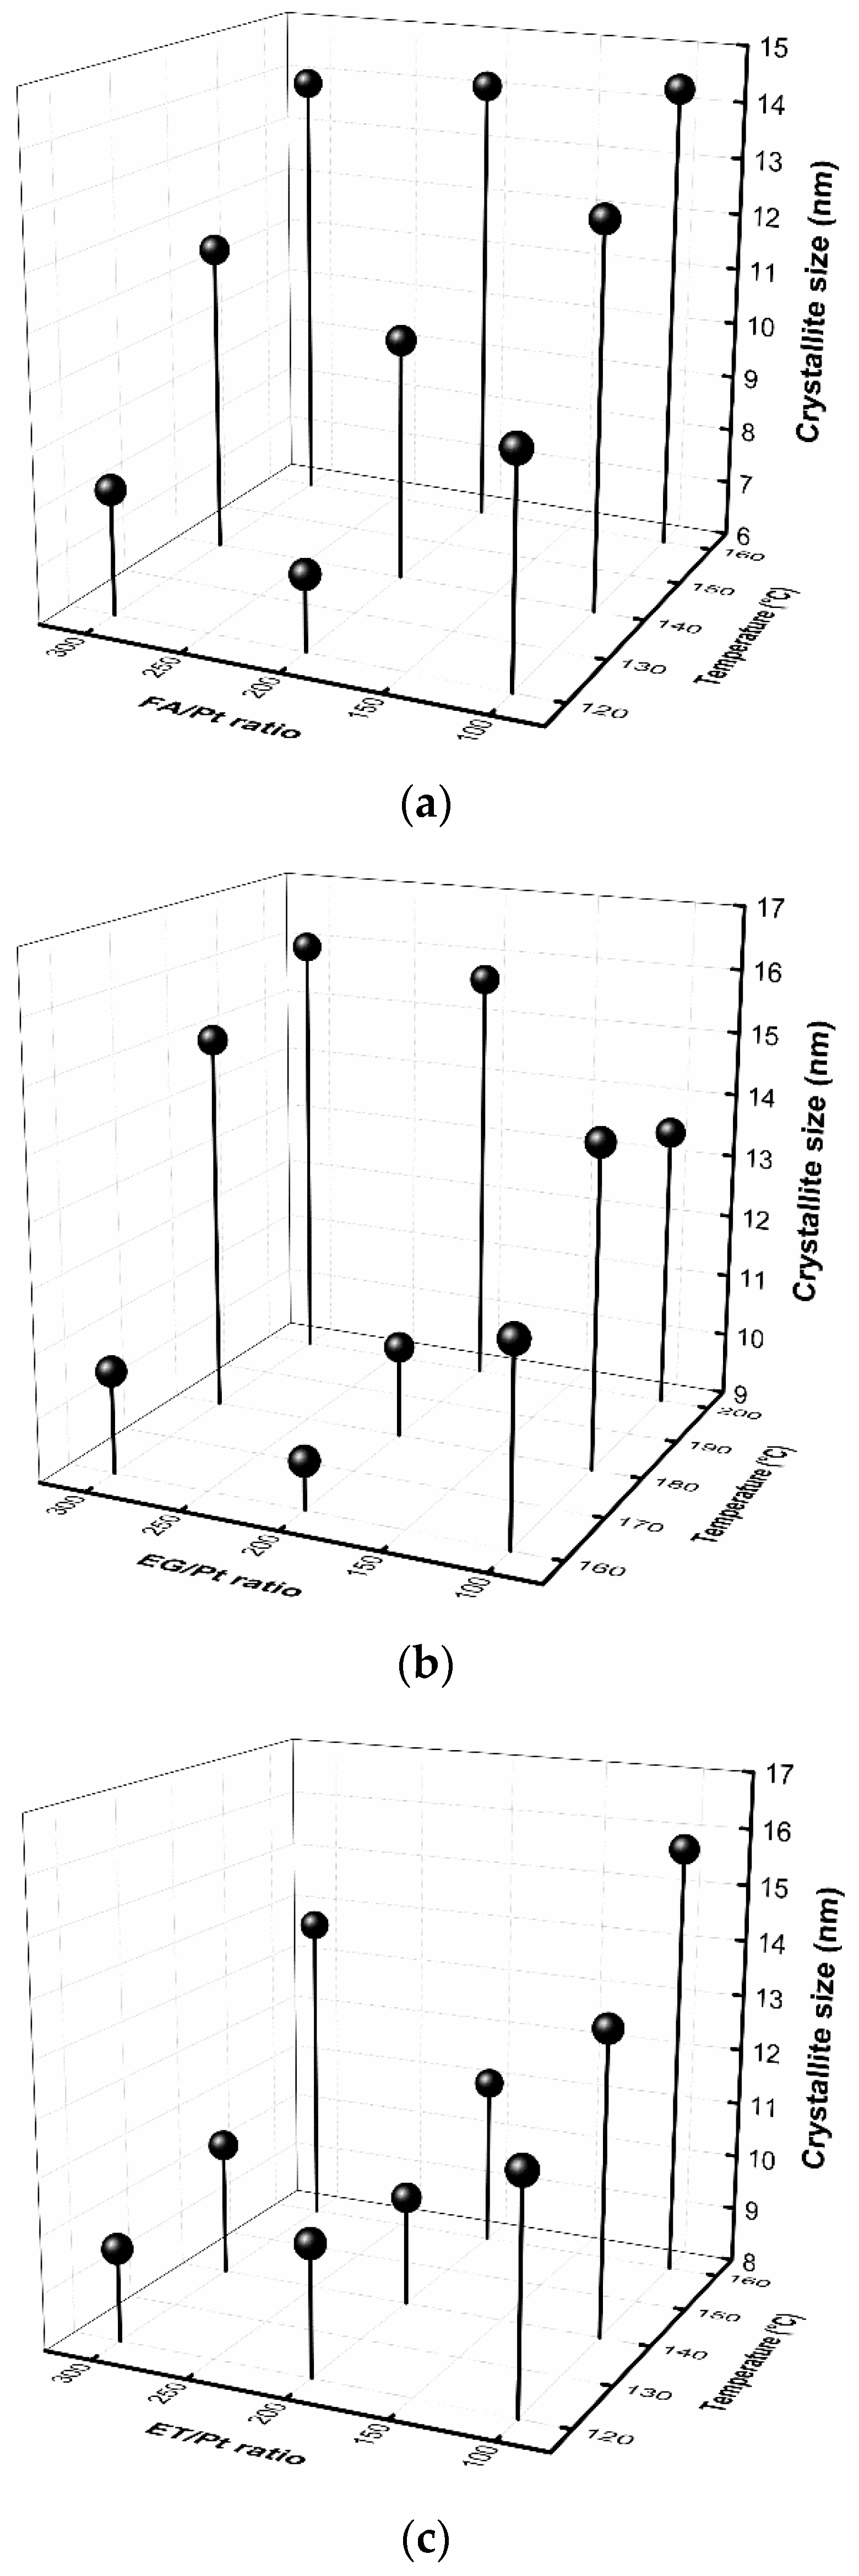
2.1.2. X-ray Diffractograms of the Samples
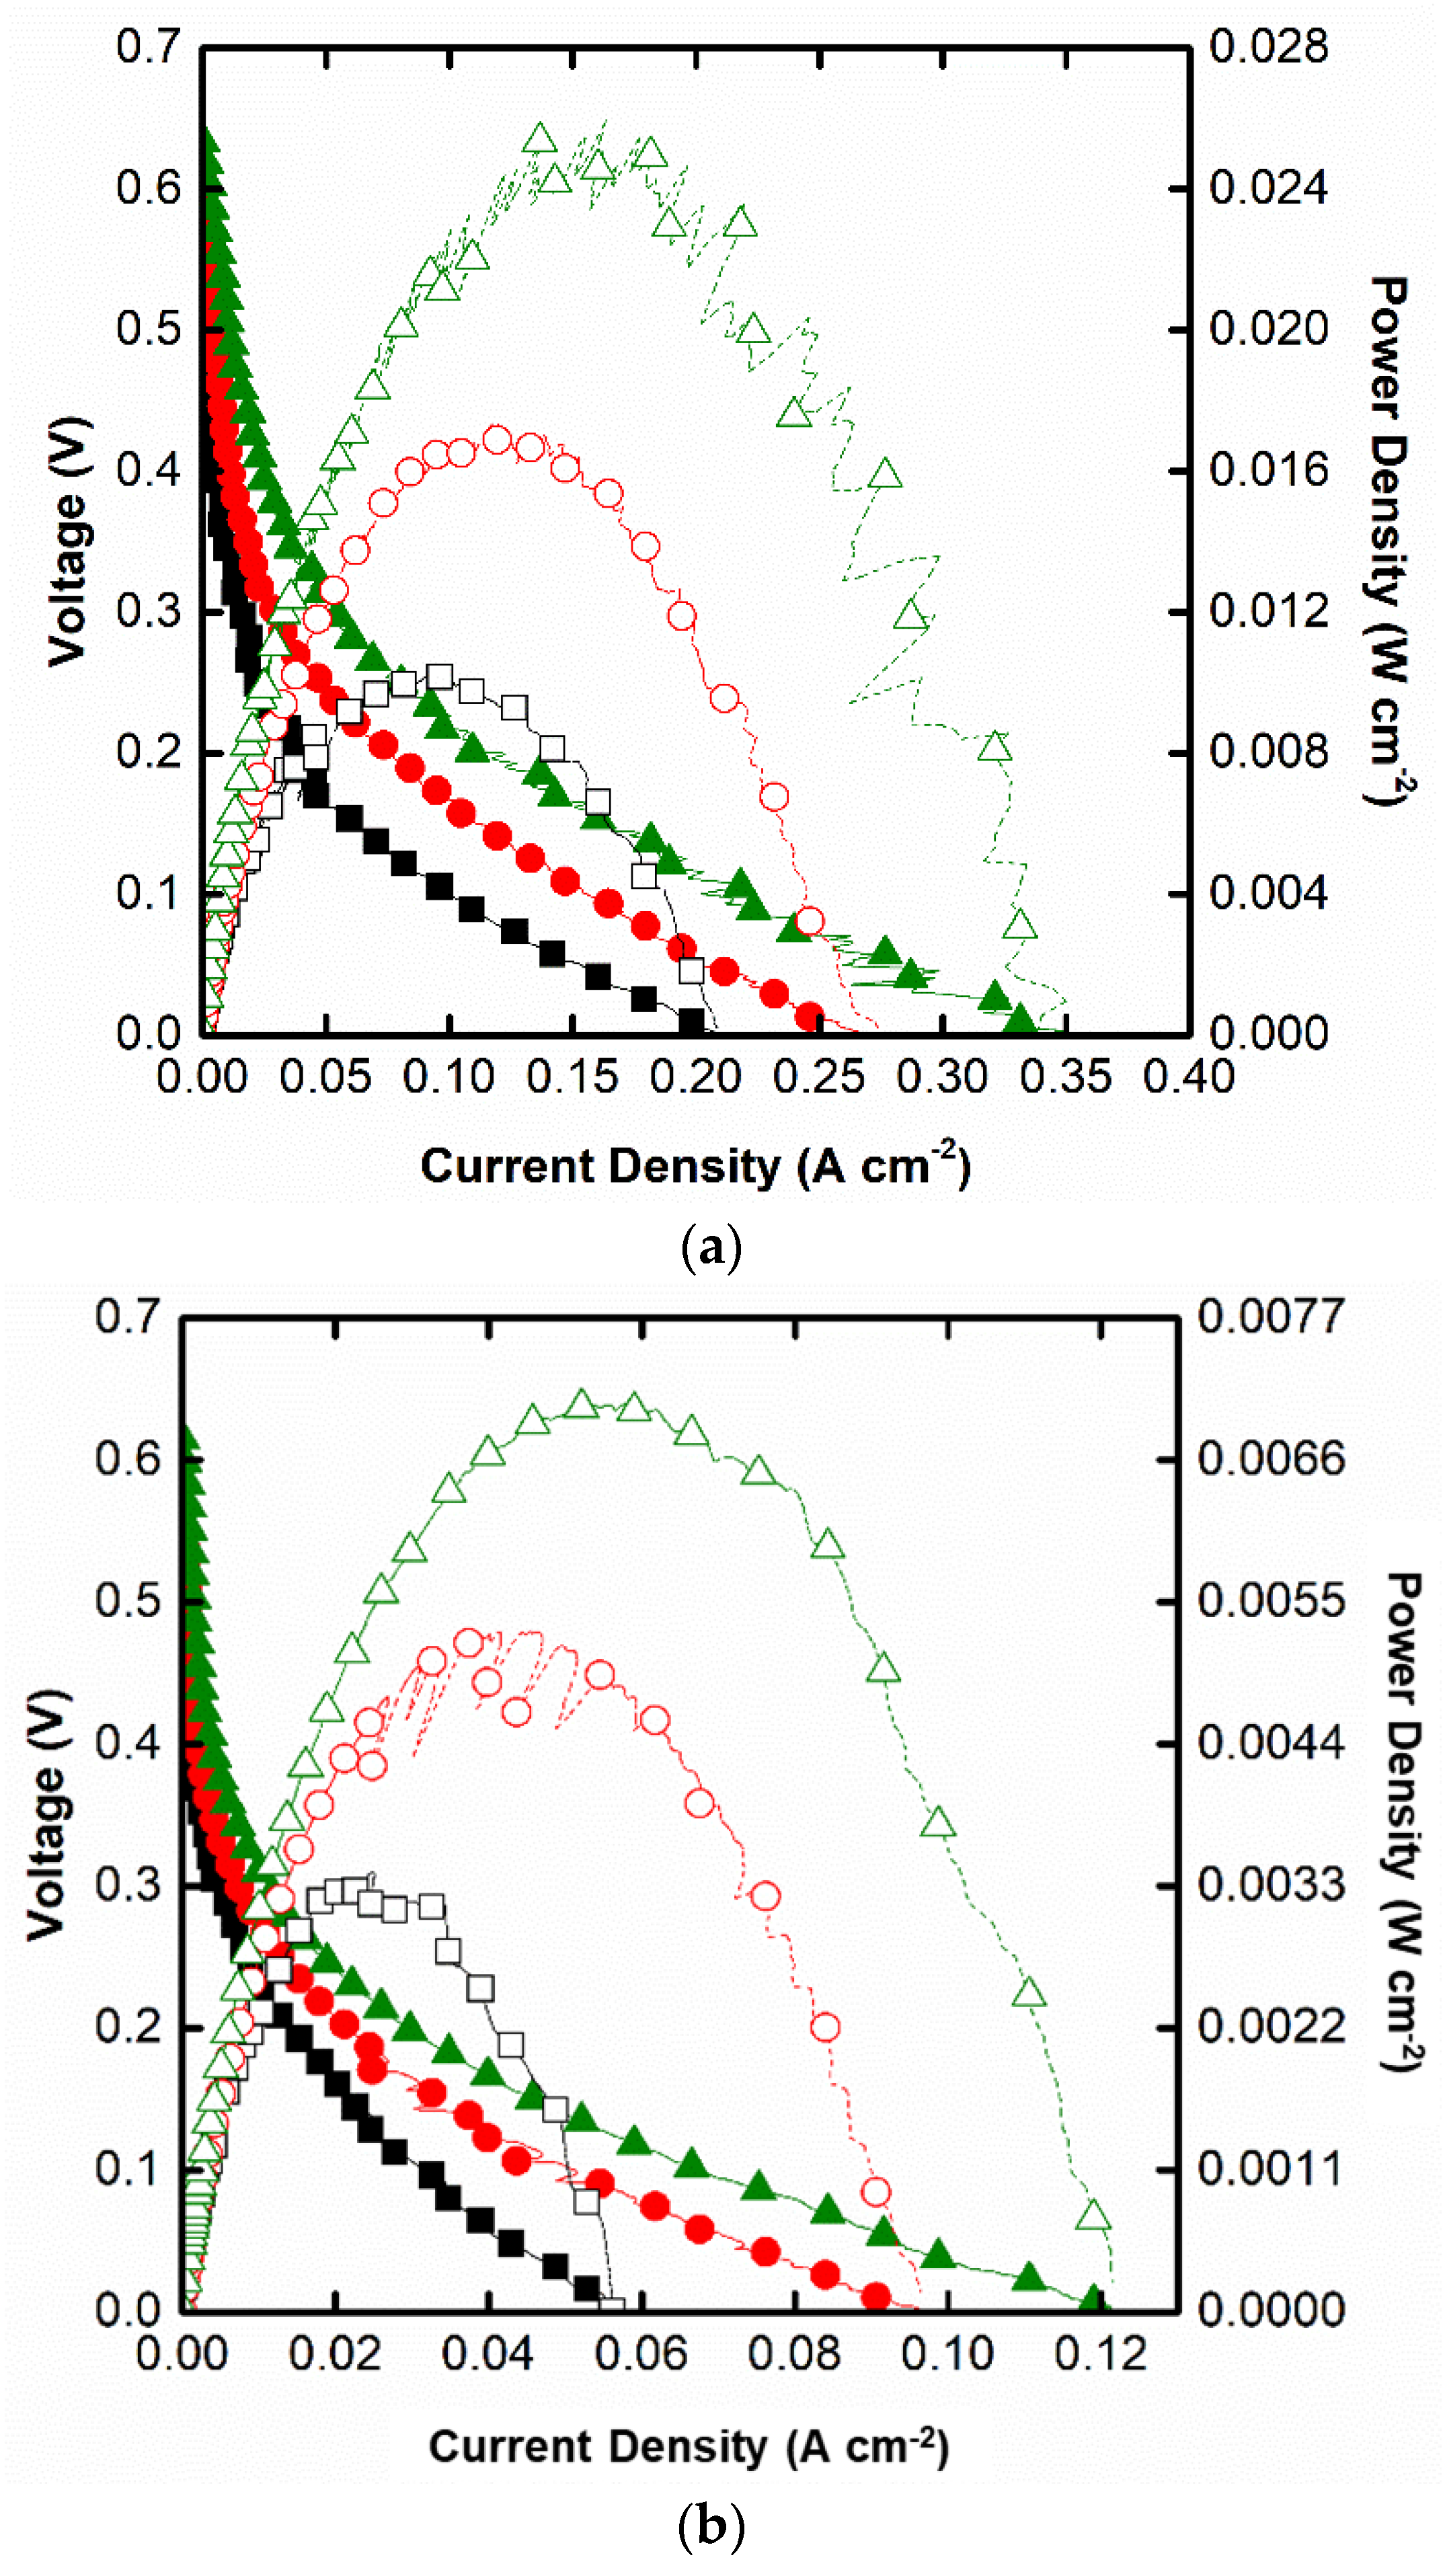
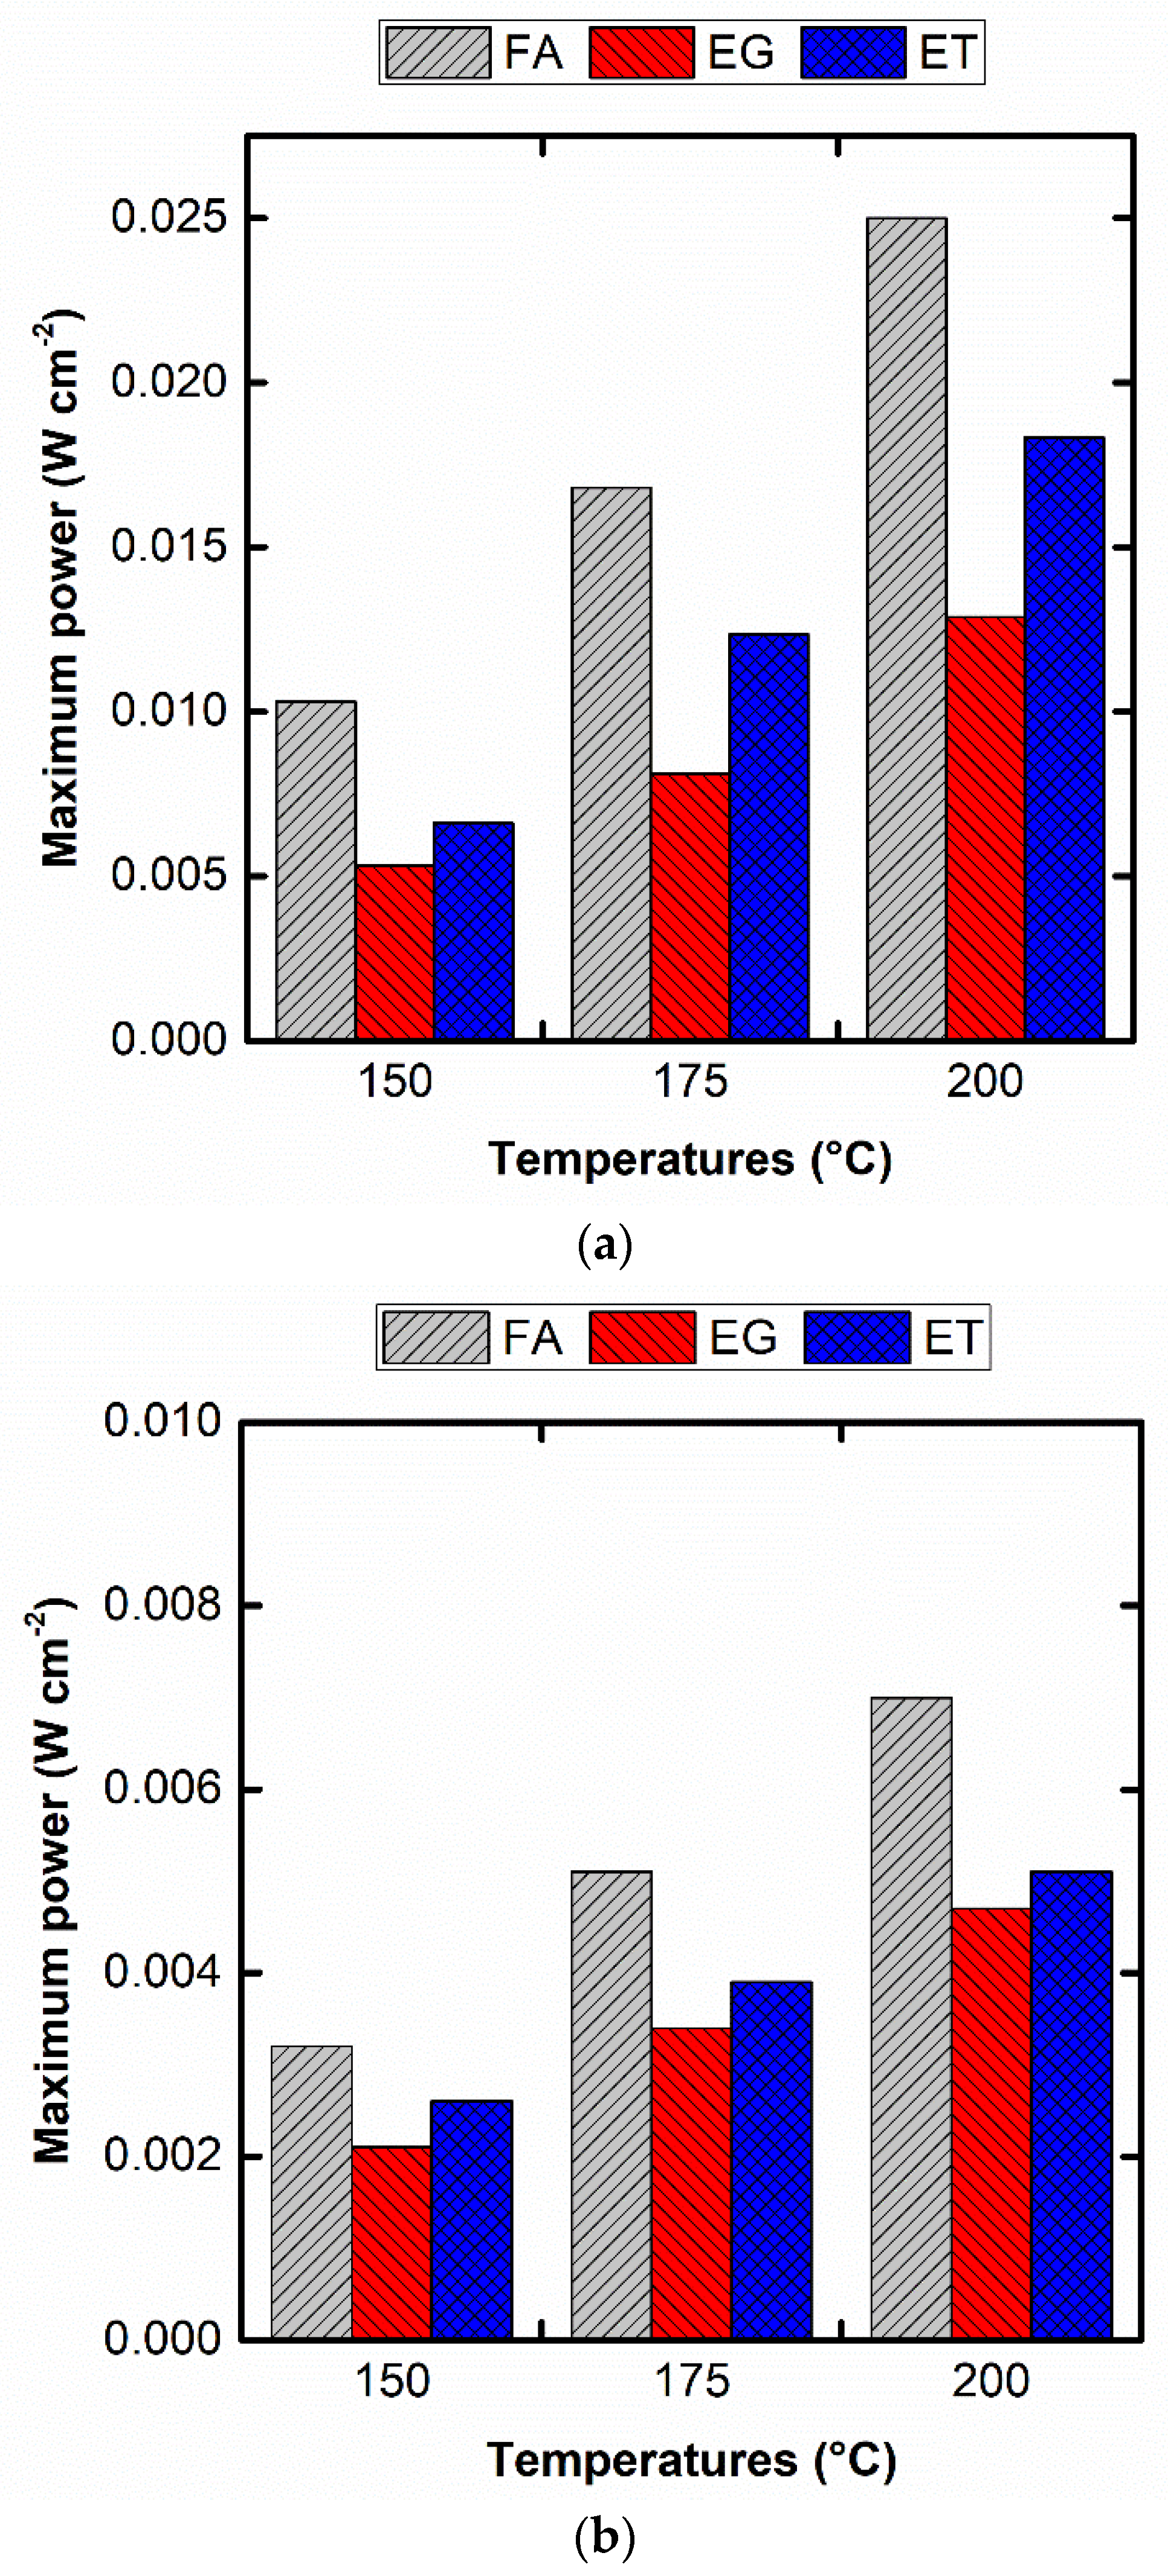
2.2. Single-Cell Results
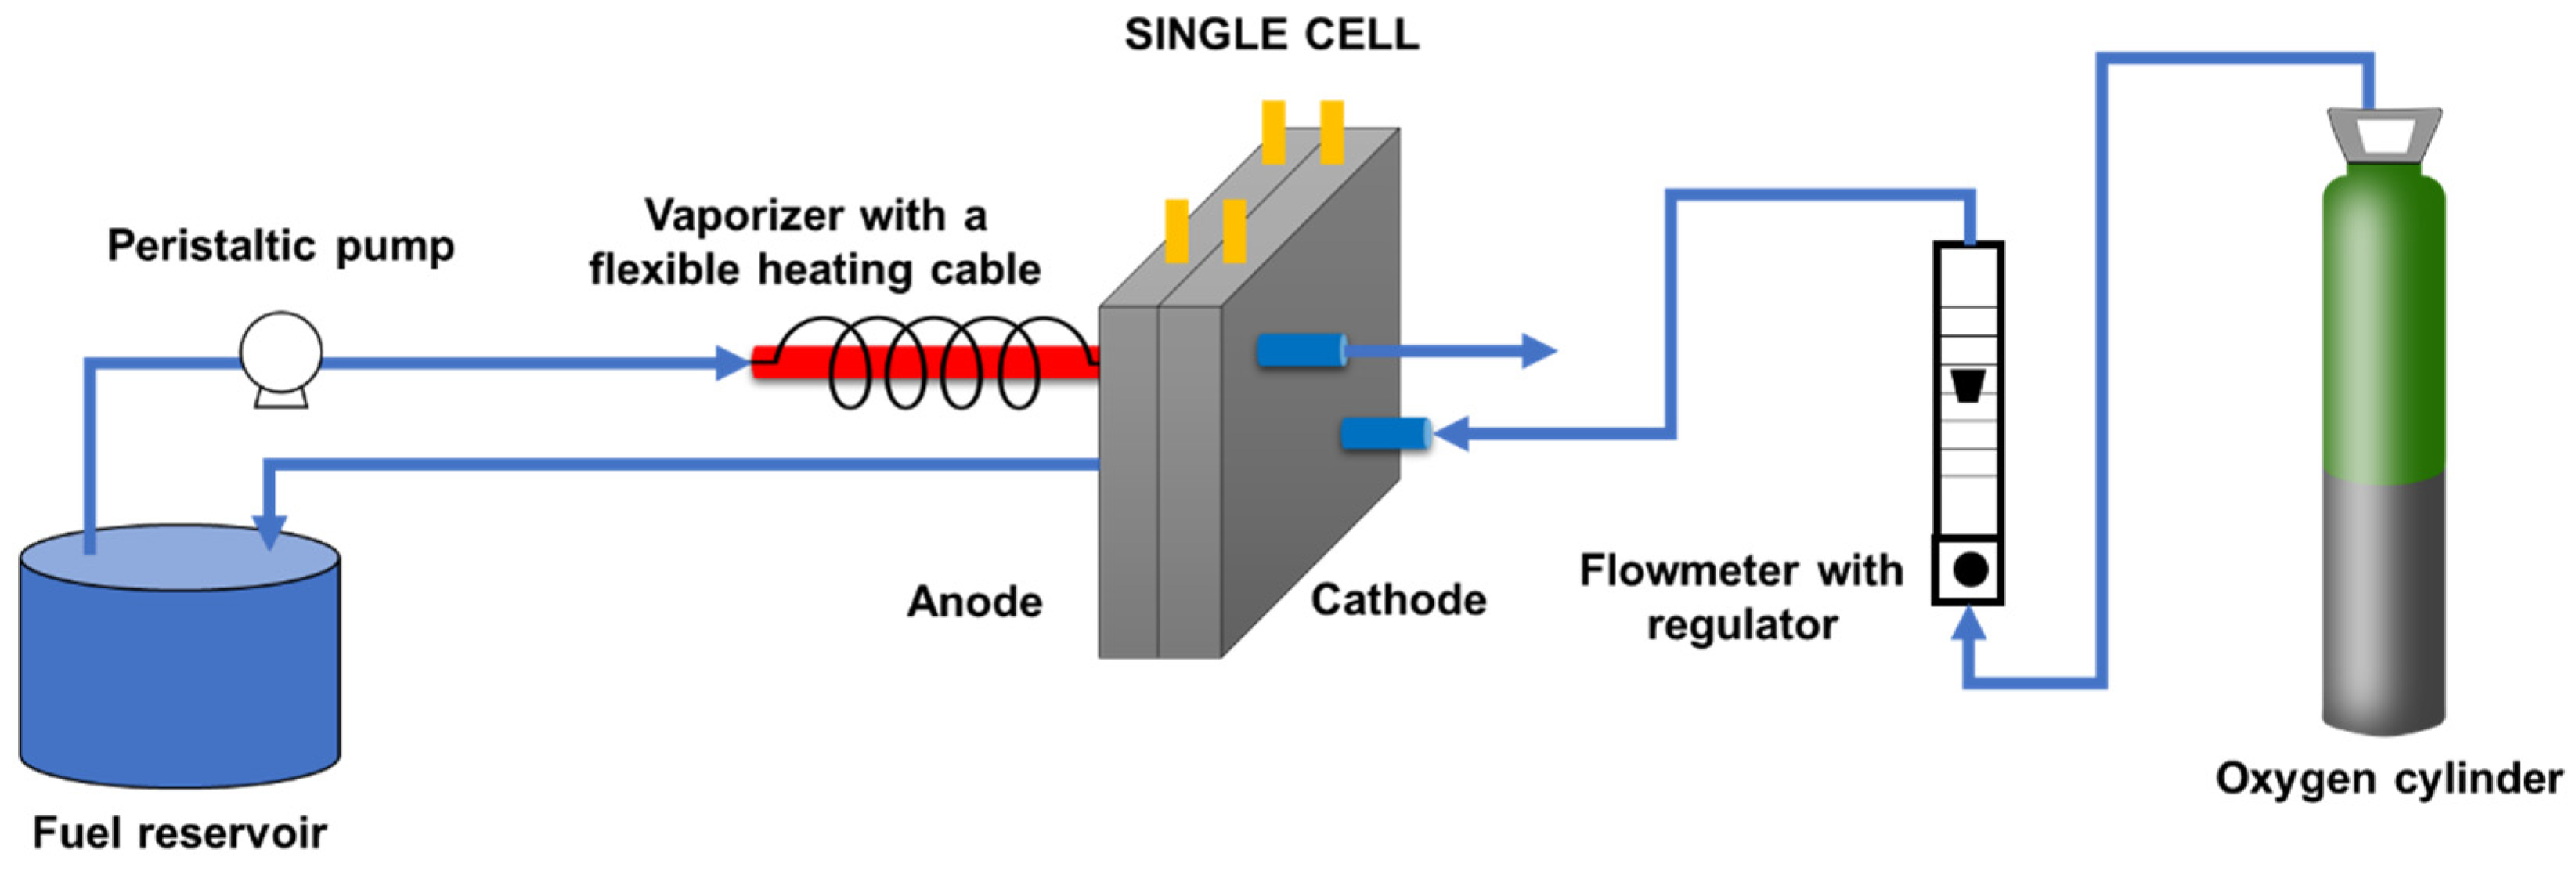
3. Materials and Methods
4. Conclusions
Supplementary Materials
Author Contributions
Funding
Data Availability Statement
Acknowledgments
Conflicts of Interest
References
- Bigerna, S.; Bollino, C.A.; Polinori, P. Convergence in Renewable Energy Sources Diffusion Worldwide. J. Environ. Manag. 2021, 292, 112784. [Google Scholar] [CrossRef]
- Edeh, I. Bioethanol Production: An Overview. In Bioethanol [Working Title]; IntechOpen: London, UK, 2020. [Google Scholar]
- Chen, X.; Liu, Y.; Wu, J. Sustainable Production of Formic Acid from Biomass and Carbon Dioxide. Mol. Catal. 2020, 483, 110716. [Google Scholar] [CrossRef]
- Fuel Ethanol Production in Major Countries 2020. Available online: https://0-www-statista-com.brum.beds.ac.uk/statistics/281606/ethanol-production-in-selected-countries/ (accessed on 11 August 2021).
- Friedl, J.; Stimming, U. Model Catalyst Studies on Hydrogen and Ethanol Oxidation for Fuel Cells. Electrochim. Acta 2013, 101, 41–58. [Google Scholar] [CrossRef] [Green Version]
- Müller, K.; Brooks, K.; Autrey, T. Hydrogen Storage in Formic Acid: A Comparison of Process Options. Energy Fuels 2017, 31, 12603–12611. [Google Scholar] [CrossRef]
- Singh, A.K.; Singh, S.; Kumar, A. Hydrogen Energy Future with Formic Acid: A Renewable Chemical Hydrogen Storage System. Catal. Sci. Technol. 2015, 6, 12–40. [Google Scholar] [CrossRef]
- Kawanami, H.; Himeda, Y.; Laurenczy, G. Formic Acid as a Hydrogen Carrier for Fuel Cells Toward a Sustainable Energy System. In Advances in Inorganic Chemistry; van Eldik, R., Hubbard, C.D., Eds.; Inorganic Reaction Mechanisms; Academic Press: Cambridge, MA, USA, 2017; Volume 70, pp. 395–427. [Google Scholar]
- Barbir, F. Fuel Cell Applications. In PEM Fuel Cells, 2nd ed.; Barbir, F., Ed.; Academic Press: Boston, MA, USA, 2013; pp. 373–434. ISBN 978-0-12-387710-9. [Google Scholar]
- Shaari, N.; Kamarudin, S.K.; Bahru, R.; Osman, S.H.; Md Ishak, N.A.I. Progress and Challenges: Review for Direct Liquid Fuel Cell. Int. J. Energy Res. 2021, 45, 6644–6688. [Google Scholar] [CrossRef]
- Yaqoob, L.; Noor, T.; Iqbal, N. A Comprehensive and Critical Review of the Recent Progress in Electrocatalysts for the Ethanol Oxidation Reaction. RSC Adv. 2021, 11, 16768–16804. [Google Scholar] [CrossRef]
- Lobato, J.; Cañizares, P.; Rodrigo, M.A.; Linares, J.J. Testing a Vapour-Fed PBI-Based Direct Ethanol Fuel Cell. Fuel Cells 2009, 9, 597–604. [Google Scholar] [CrossRef]
- Linares, J.J.; Rocha, T.A.; Zignani, S.; Paganin, V.A.; Gonzalez, E.R. Different Anode Catalyst for High Temperature Polybenzimidazole-Based Direct Ethanol Fuel Cells. Int. J. Hydrogen Energy 2013, 38, 620–630. [Google Scholar] [CrossRef]
- Linares, J.J.; Zignani, S.C.; Rocha, T.A.; Gonzalez, E.R. Ethanol Oxidation on a High Temperature PBI-Based DEFC Using Pt/C, PtRu/C and Pt3Sn/C as Catalysts. J. Appl. Electrochem. 2013, 43, 147–158. [Google Scholar] [CrossRef]
- Lobato, J.; Cañizares, P.; Rodrigo, M.A.; Linares, J.J. Study of Different Bimetallic Anodic Catalysts Supported on Carbon for a High Temperature Polybenzimidazole-Based Direct Ethanol Fuel Cell. Appl. Catal. B Environ. 2009, 91, 269–274. [Google Scholar] [CrossRef]
- Weber, M. Formic Acid Oxidation in a Polymer Electrolyte Fuel Cell. J. Electrochem. Soc. 1996, 143, L158–L160. [Google Scholar] [CrossRef]
- Rath, R.; Kumar, P.; Unnikrishnan, L.; Mohanty, S.; Nayak, S.K. Current Scenario of Poly (2,5-Benzimidazole) (ABPBI) as Prospective PEM for Application in HT-PEMFC. Polym. Rev. 2020, 60, 267–317. [Google Scholar] [CrossRef]
- Escorihuela, J.; Olvera-Mancilla, J.; Alexandrova, L.; del Castillo, L.F.; Compañ, V. Recent Progress in the Development of Composite Membranes Based on Polybenzimidazole for High Temperature Proton Exchange Membrane (PEM) Fuel Cell Applications. Polymers 2020, 12, 1861. [Google Scholar] [CrossRef]
- Aili, D.; Henkensmeier, D.; Martin, S.; Singh, B.; Hu, Y.; Jensen, J.O.; Cleemann, L.N.; Li, Q. Polybenzimidazole-Based High-Temperature Polymer Electrolyte Membrane Fuel Cells: New Insights and Recent Progress. Electrochem. Energy Rev. 2020, 3, 793–845. [Google Scholar] [CrossRef]
- Zhou, Z.; Zholobko, O.; Wu, X.-F.; Aulich, T.; Thakare, J.; Hurley, J. Polybenzimidazole-Based Polymer Electrolyte Membranes for High-Temperature Fuel Cells: Current Status and Prospects. Energies 2021, 14, 135. [Google Scholar] [CrossRef]
- Fouzaï, I.; Gentil, S.; Bassetto, V.C.; Silva, W.O.; Maher, R.; Girault, H.H. Catalytic Layer-Membrane Electrode Assembly Methods for Optimum Triple Phase Boundaries and Fuel Cell Performances. J. Mater. Chem. A 2021, 9, 11096–11123. [Google Scholar] [CrossRef]
- Schröder, J.; Mints, V.A.; Bornet, A.; Berner, E.; Fathi Tovini, M.; Quinson, J.; Wiberg, G.K.H.; Bizzotto, F.; El-Sayed, H.A.; Arenz, M. The Gas Diffusion Electrode Setup as Straightforward Testing Device for Proton Exchange Membrane Water Electrolyzer Catalysts. JACS Au 2021, 1, 247–251. [Google Scholar] [CrossRef] [PubMed]
- Salomé, S.; Rego, R.; Oliveira, M.C. Development of Silver-Gas Diffusion Electrodes for the Oxygen Reduction Reaction by Electrodeposition. Mater. Chem. Phys. 2013, 143, 109–115. [Google Scholar] [CrossRef]
- Pacquets, L.; Irtem, E.; Neukermans, S.; Daems, N.; Bals, S.; Breugelmans, T. Size-Controlled Electrodeposition of Cu Nanoparticles on Gas Diffusion Electrodes in Methanesulfonic Acid Solution. J. Appl. Electrochem. 2021, 51, 317–330. [Google Scholar] [CrossRef]
- Nguyen, T.N.; Dinh, C.-T. Gas Diffusion Electrode Design for Electrochemical Carbon Dioxide Reduction. Chem. Soc. Rev. 2020, 49, 7488–7504. [Google Scholar] [CrossRef]
- Kim, Y.; Karuppannan, M.; Sung, Y.-E.; Lim, T.; Kwon, O.J. Direct Formation of Pt Catalyst on Gas Diffusion Layer Using Sonochemical Deposition Method for the Application in Polymer Electrolyte Membrane Fuel Cell. Int. J. Hydrogen Energy 2018, 43, 10431–10439. [Google Scholar] [CrossRef]
- Nores-Pondal, F.J.; Vilella, I.M.J.; Troiani, H.; Granada, M.; de Miguel, S.R.; Scelza, O.A.; Corti, H.R. Catalytic Activity vs. Size Correlation in Platinum Catalysts of PEM Fuel Cells Prepared on Carbon Black by Different Methods. Int. J. Hydrogen Energy 2009, 34, 8193–8203. [Google Scholar] [CrossRef]
- Gago, A.S.; Habrioux, A.; Alonso-Vante, N. Tailoring Nanostructured Catalysts for Electrochemical Energy Conversion Systems. Nanotechnol. Rev. 2012, 1, 427–453. [Google Scholar] [CrossRef]
- Almeida, T.S.; Palma, L.M.; Leonello, P.H.; Morais, C.; Kokoh, K.B.; Andrade, A.R.D. An Optimization Study of PtSn/C Catalysts Applied to Direct Ethanol Fuel Cell: Effect of the Preparation Method on the Electrocatalytic Activity of the Catalysts. J. Power Sources 2012, 215, 53–62. [Google Scholar] [CrossRef]
- Hornyak, G.L.; Tibbals, H.F.; Dutta, J.; Moore, J.J. Chemical Nanoengineering. In Introduction to Nanoscience and Nanotechnology; CRC Press: Boca Raton, FL, USA, 2008; ISBN 978-0-429-14151-5. [Google Scholar]
- Sarma, L.S.; Chen, C.-H.; Kumar, S.M.S.; Wang, G.-R.; Yen, S.-C.; Liu, D.-G.; Sheu, H.-S.; Yu, K.-L.; Tang, M.-T.; Lee, J.-F.; et al. Formation of Pt−Ru Nanoparticles in Ethylene Glycol Solution: An in Situ X-Ray Absorption Spectroscopy Study. Langmuir 2007, 23, 5802–5809. [Google Scholar] [CrossRef] [Green Version]
- Bock, C.; Paquet, C.; Couillard, M.; Botton, G.A.; MacDougall, B.R. Size-Selected Synthesis of PtRu Nano-Catalysts: Reaction and Size Control Mechanism. J. Am. Chem. Soc. 2004, 126, 8028–8037. [Google Scholar] [CrossRef] [Green Version]
- Deivaraj, T.C.; Lee, J.Y. Preparation of Carbon-Supported PtRu Nanoparticles for Direct Methanol Fuel Cell Applications—A Comparative Study. J. Power Sources 2005, 142, 43–49. [Google Scholar] [CrossRef]
- Kashyout, A.B.; Youssef, B.A.B. Electrooxidation of Methanol on Carbon Supported Pt- Ru Nanocatalysts Prepared by Ethanol Reduction Method. Int. J. Electrochem. Sci. 2011, 6, 15. [Google Scholar]
- Toshima, N.; Hirakawa, K. Polymer-Protected PtRu Bimetallic Cluster Catalysts for Visible-Light-Induced Hydrogen Generation from Water and Electron Transfer Dynamics. Appl. Surf. Sci. 1997, 121–122, 534–537. [Google Scholar] [CrossRef]
- Balcerzak, M.; Pergół, K. Selective Determination of Platinum and Palladium in Iodide Media by Derivative Spectrophotometry. Chem. Anal. 2003, 48, 87–95. [Google Scholar]


| Reducing Agent | Reducing Agent/Pt Molar Ratio in the Hydrothermal Treatment | Temperature (°C) | Identification | Final Weight (mg) |
|---|---|---|---|---|
| Formic acid | 100 | 120 | FA120100 | 1.92 ± 0.06 |
| 140 | FA140100 | 1.89 ± 0.12 | ||
| 160 | FA160100 | 1.91 ± 0.05 | ||
| 200 | 120 | FA120200 | 1.92 ± 0.02 | |
| 140 | FA140200 | 1.89 ± 0.15 | ||
| 160 | FA160200 | 1.91 ± 0.03 | ||
| 300 | 120 | FA120300 | 1.92 ± 0.04 | |
| 140 | FA140300 | 1.89 ± 0.02 | ||
| 160 | FA160300 | 1.91 ± 0.02 | ||
| Ethylene glycol | 100 | 160 | EG120100 | 2.02 ± 0.10 |
| 180 | EG140100 | 1.99 ± 0.15 | ||
| 200 | EG160100 | 1.93 ± 0.02 | ||
| 200 | 160 | EG120200 | 1.96 ± 0.03 | |
| 180 | EG140200 | 1.85 ± 0.18 | ||
| 200 | EG160200 | 1.96 ± 0.08 | ||
| 300 | 160 | EG120300 | 2.06 ± 0.03 | |
| 180 | EG140300 | 2.01 ± 0.06 | ||
| 200 | EG160300 | 1.96 ± 0.07 | ||
| Ethanol | 100 | 120 | ET120100 | 2.08 ± 0.12 |
| 140 | ET140100 | 1.86 ± 0.03 | ||
| 160 | ET160100 | 1.94 ± 0.04 | ||
| 200 | 120 | ET120200 | 1.95 ± 0.06 | |
| 140 | ET140200 | 1.98 ± 0.11 | ||
| 160 | ET160200 | 2.03 ± 0.04 | ||
| 300 | 120 | ET120300 | 1.89 ± 0.13 | |
| 140 | ET140300 | 1.99 ± 0.08 | ||
| 160 | ET160300 | 1.92 ± 0.09 |
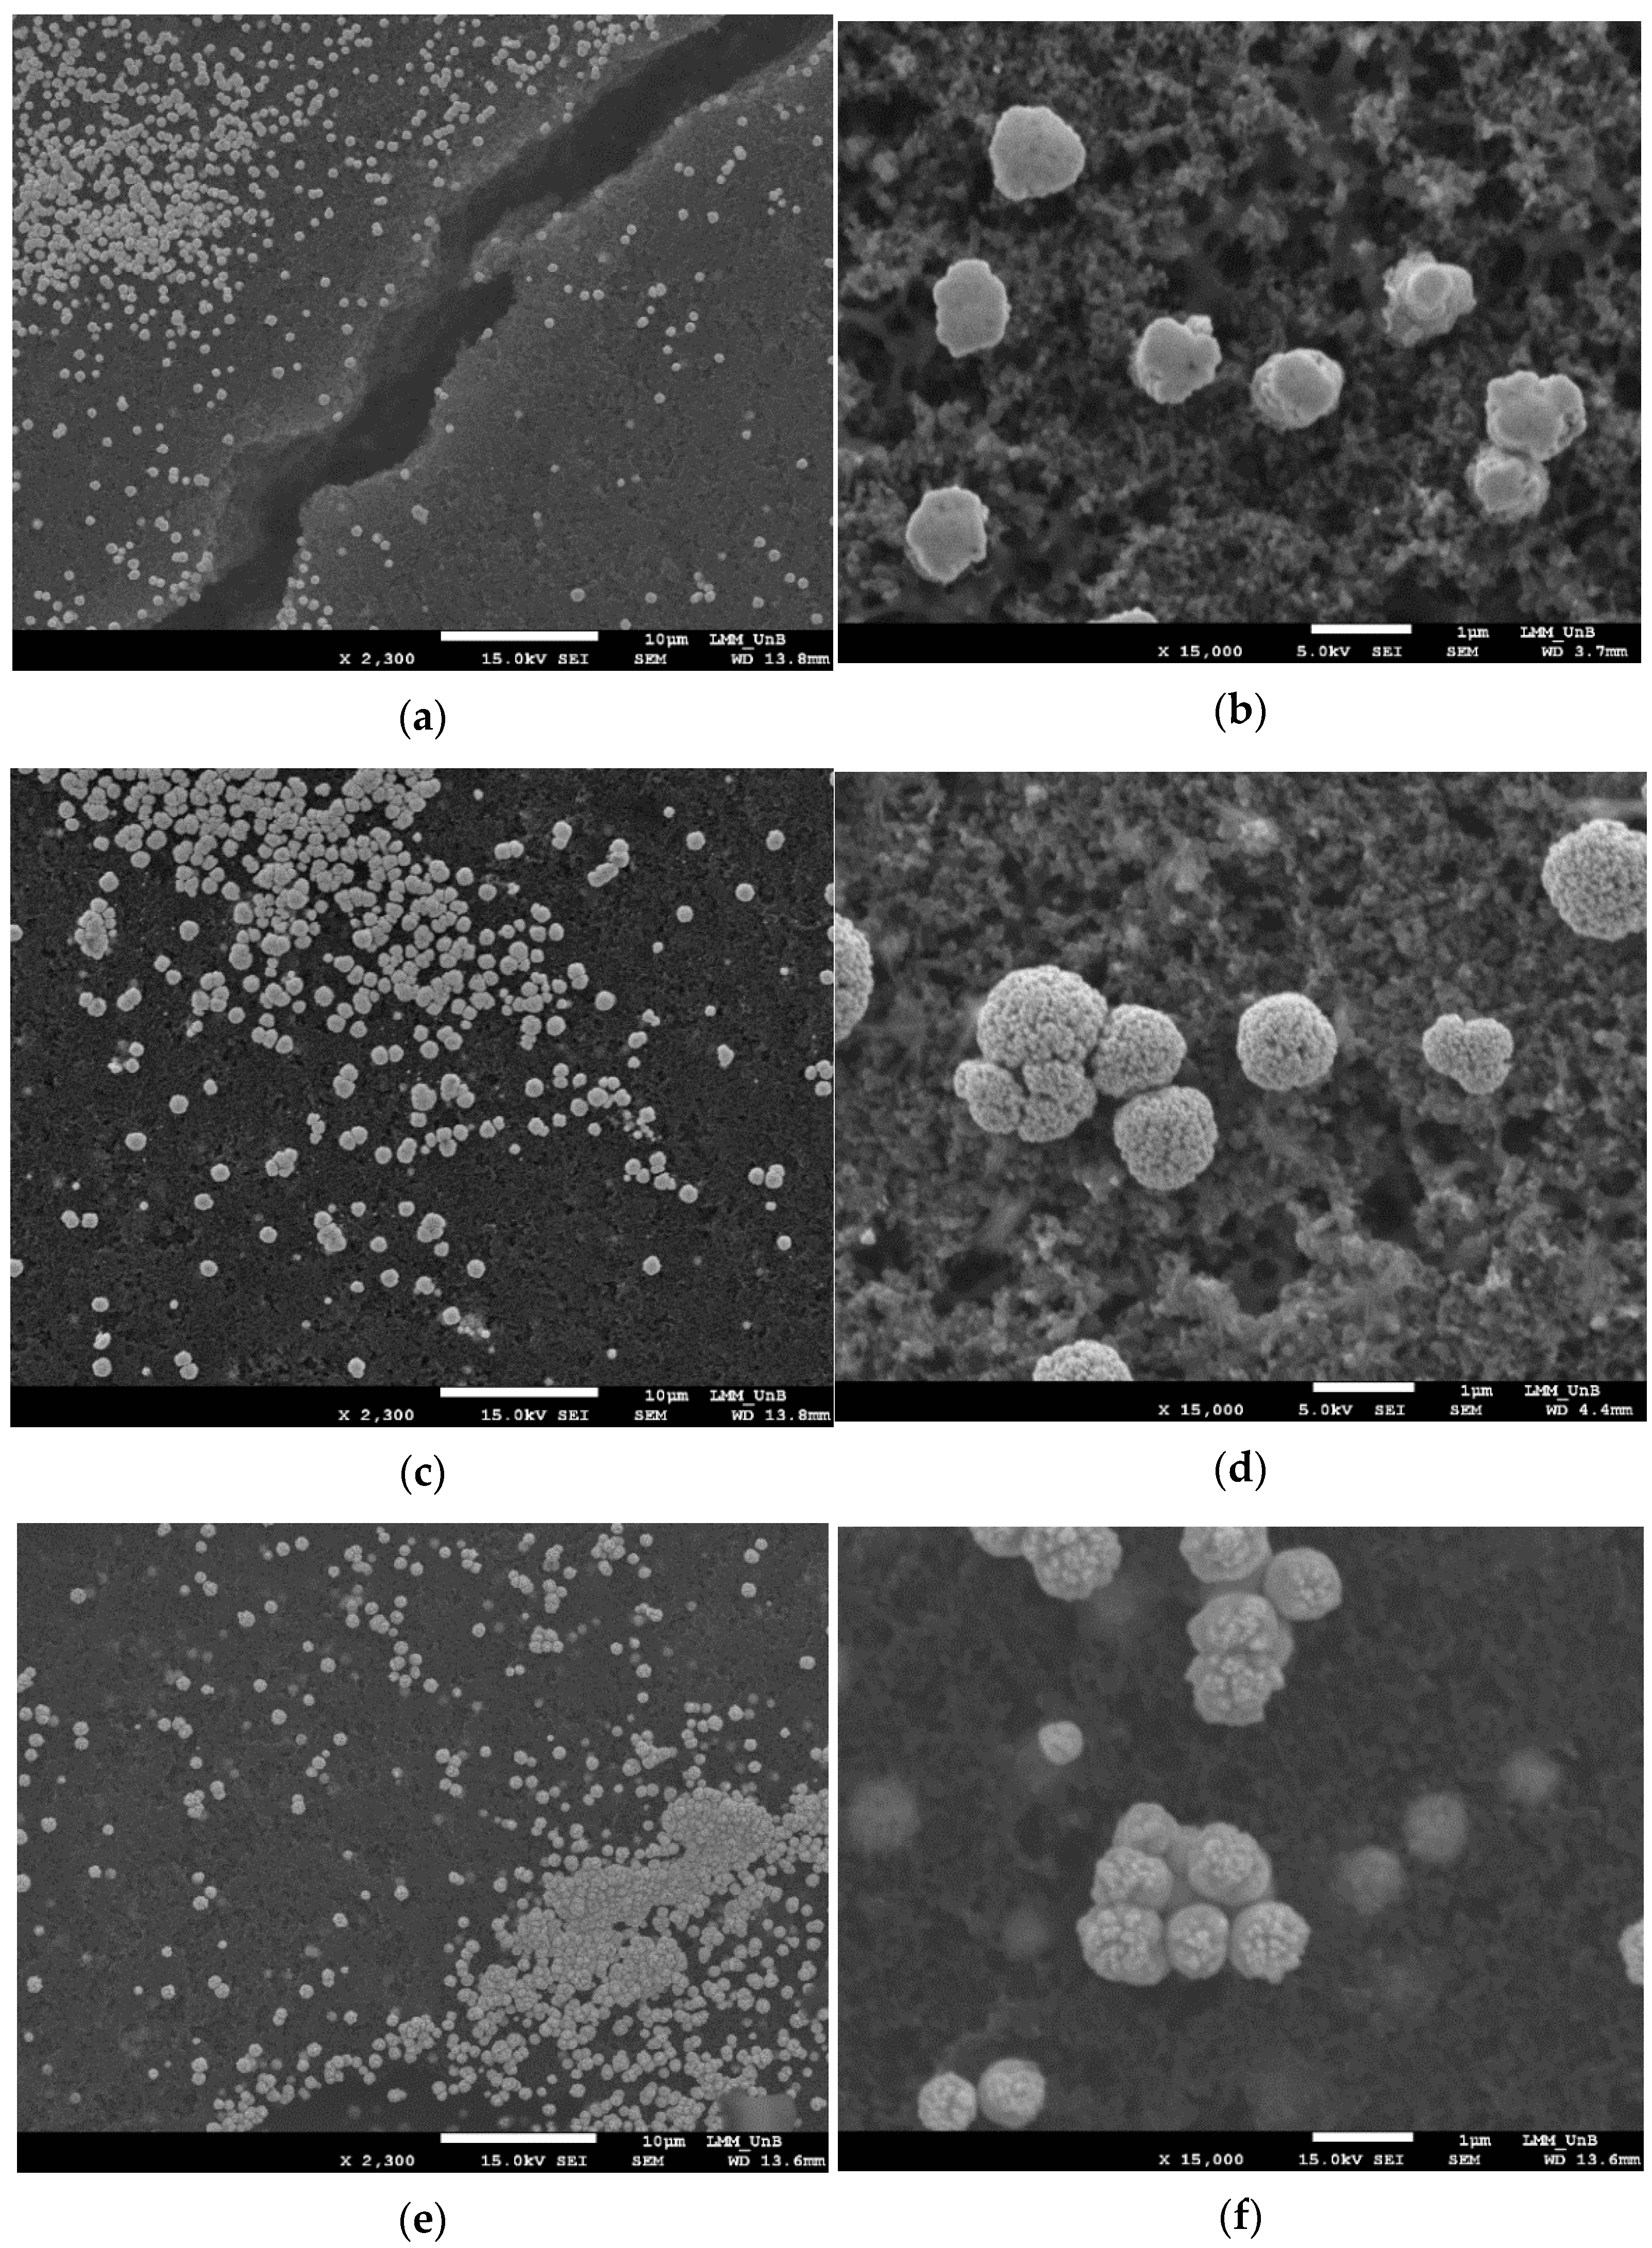
| Electrode | Average Particle Size (nm) |
|---|---|
| FA120200 | 669 ± 191 |
| EG160200 | 895 ± 249 |
| ET120300 | 761 ± 385 |
Publisher’s Note: MDPI stays neutral with regard to jurisdictional claims in published maps and institutional affiliations. |
© 2021 by the authors. Licensee MDPI, Basel, Switzerland. This article is an open access article distributed under the terms and conditions of the Creative Commons Attribution (CC BY) license (https://creativecommons.org/licenses/by/4.0/).
Share and Cite
da Silva Cardoso, R.; Sartório de Castro, B.; de Andrade Dias, S.; H. Clemente, M.C.; Dias, S.C.L.; A. Dias, J.; Crisafulli, R.; Linares, J.J.; Veloso Martins, G.A. Pt Electrocatalyst Prepared by Hydrothermal Reduction onto the Gas Diffusion Layer for High-Temperature Formic Acid and Ethanol Fuel PEMFC. Catalysts 2021, 11, 1246. https://0-doi-org.brum.beds.ac.uk/10.3390/catal11101246
da Silva Cardoso R, Sartório de Castro B, de Andrade Dias S, H. Clemente MC, Dias SCL, A. Dias J, Crisafulli R, Linares JJ, Veloso Martins GA. Pt Electrocatalyst Prepared by Hydrothermal Reduction onto the Gas Diffusion Layer for High-Temperature Formic Acid and Ethanol Fuel PEMFC. Catalysts. 2021; 11(10):1246. https://0-doi-org.brum.beds.ac.uk/10.3390/catal11101246
Chicago/Turabian Styleda Silva Cardoso, Rayane, Bruna Sartório de Castro, Sophya de Andrade Dias, Maria Clara H. Clemente, Sílvia C. L. Dias, José A. Dias, Rudy Crisafulli, José J. Linares, and Gesley A. Veloso Martins. 2021. "Pt Electrocatalyst Prepared by Hydrothermal Reduction onto the Gas Diffusion Layer for High-Temperature Formic Acid and Ethanol Fuel PEMFC" Catalysts 11, no. 10: 1246. https://0-doi-org.brum.beds.ac.uk/10.3390/catal11101246