
Evaluation of Au/ZrO2 Catalysts Prepared via Postsynthesis Methods in CO2 Hydrogenation to Methanol

 , ,
, ,
Abstract
:
1. Introduction
2. Results and Discussion
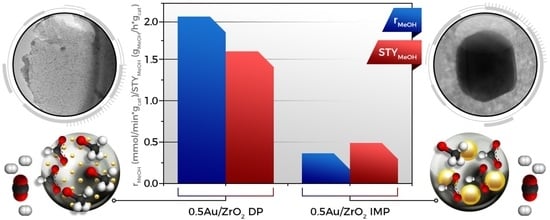
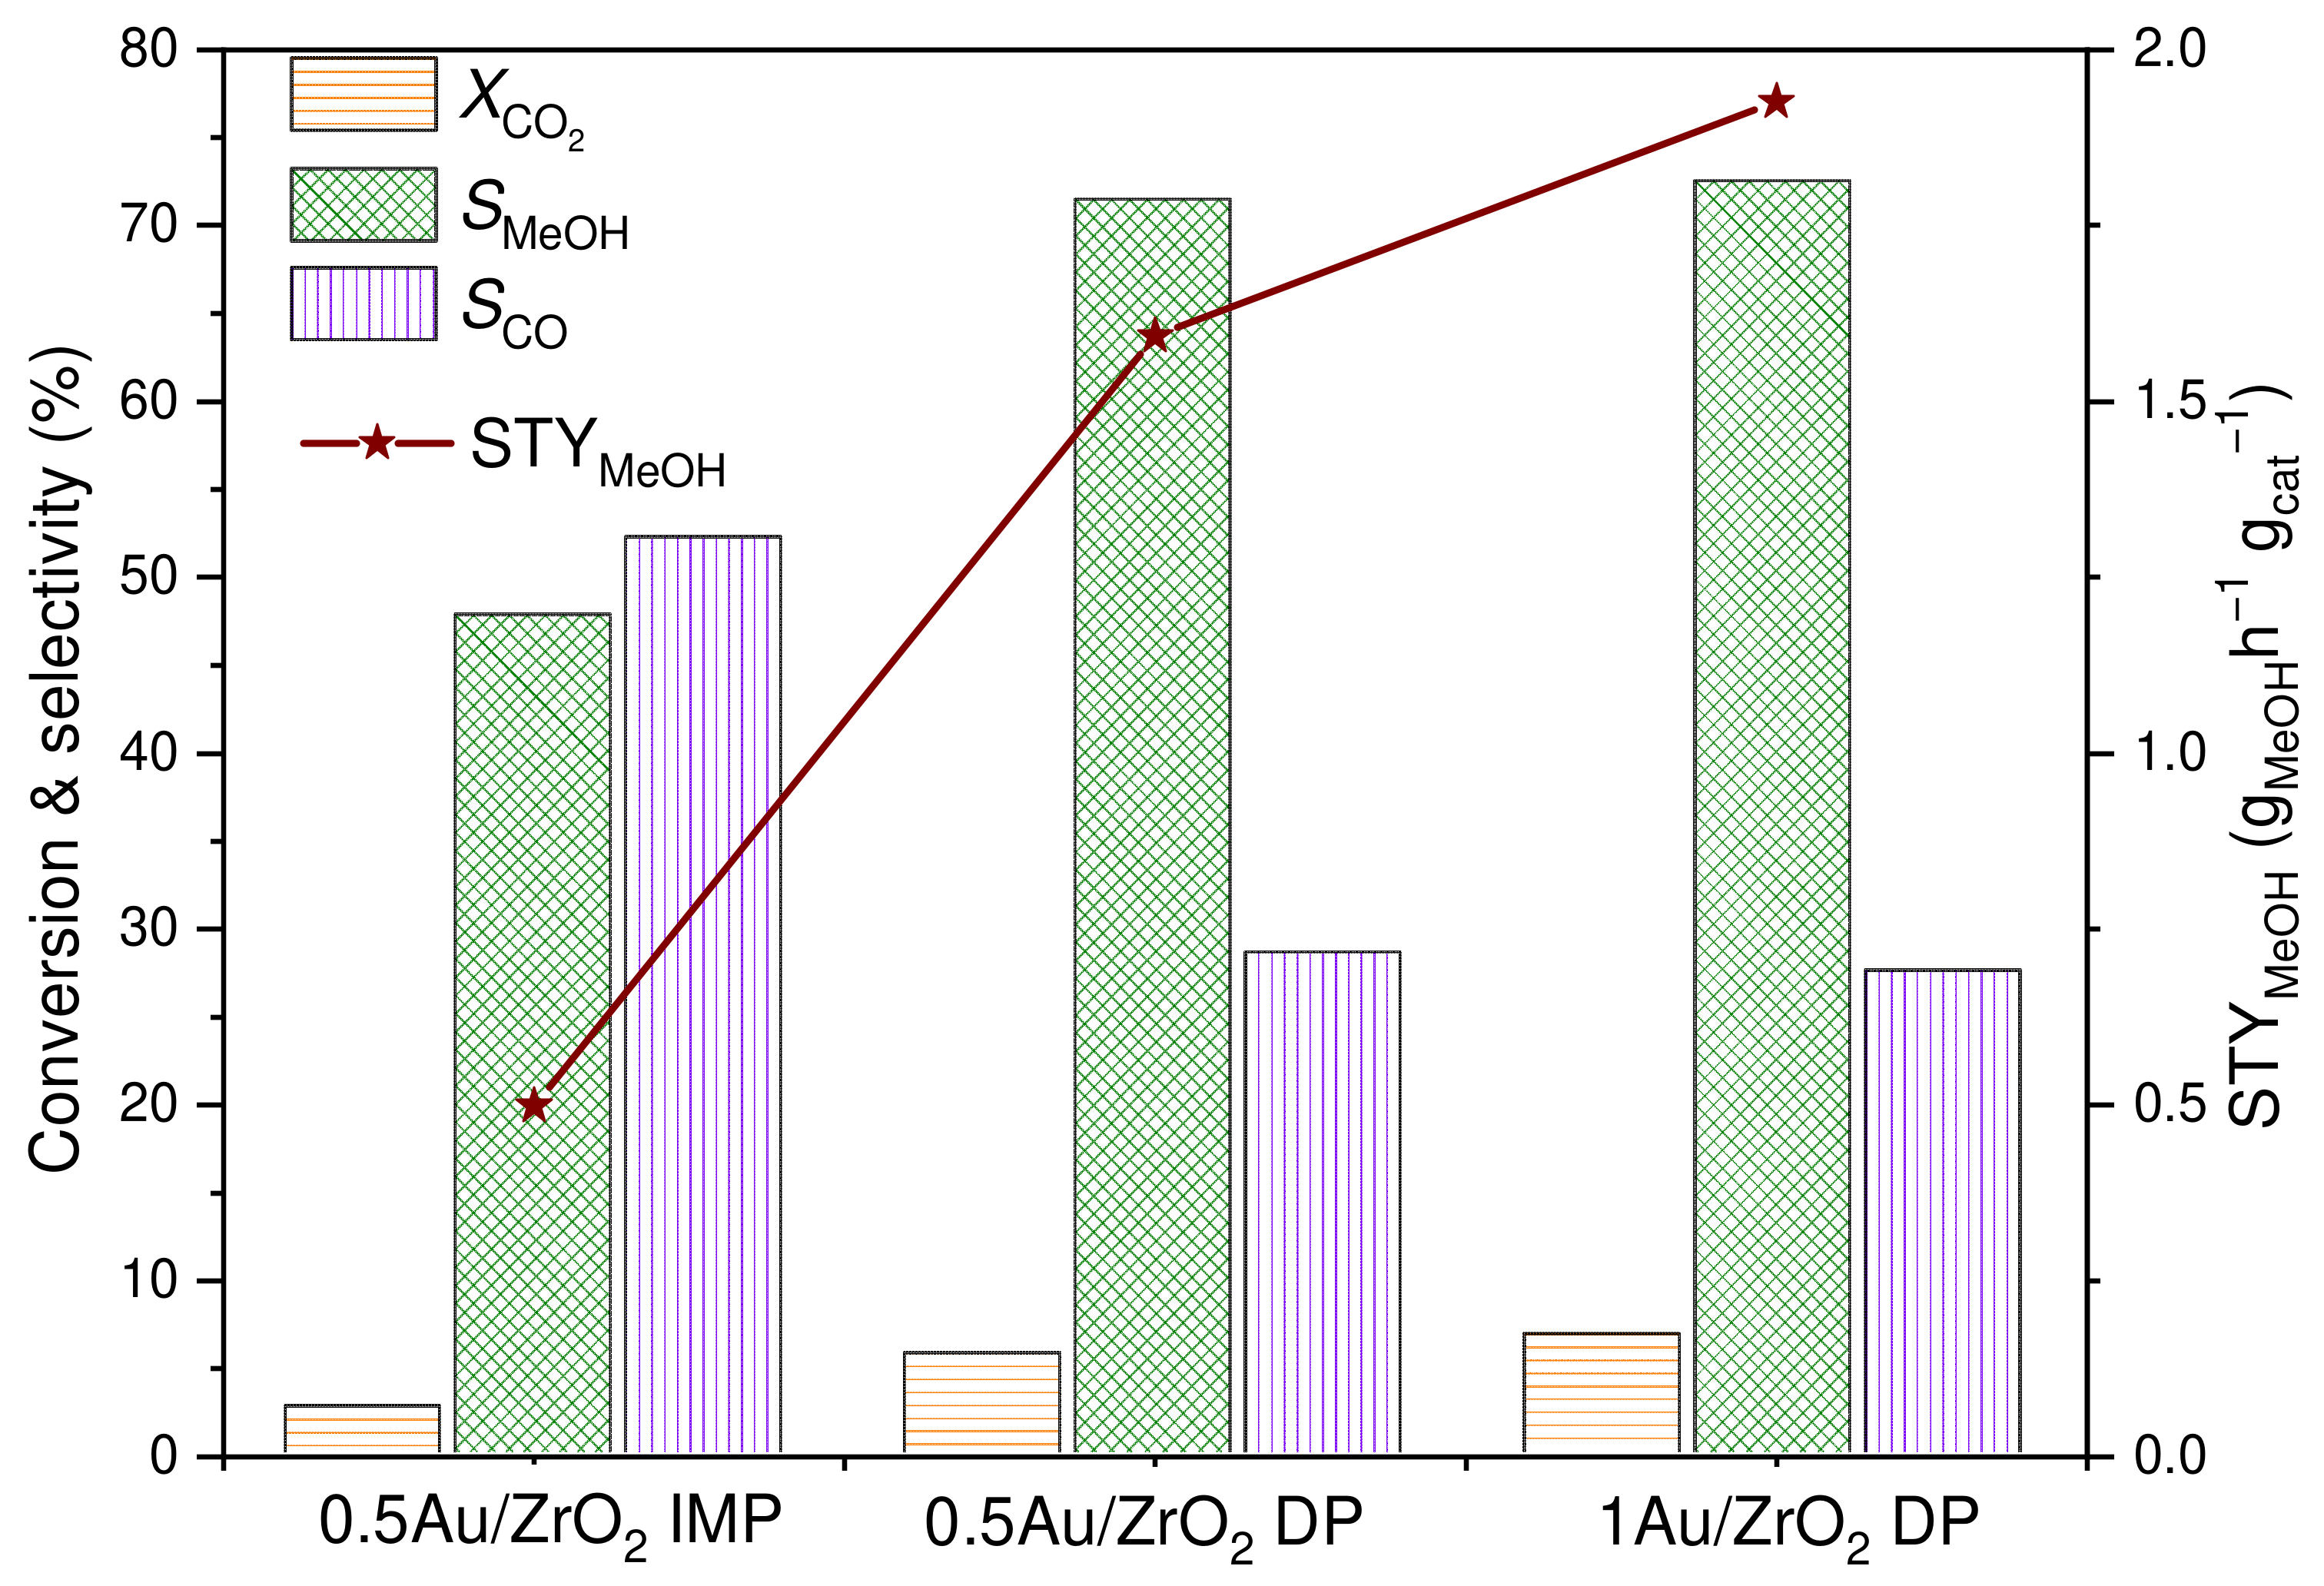
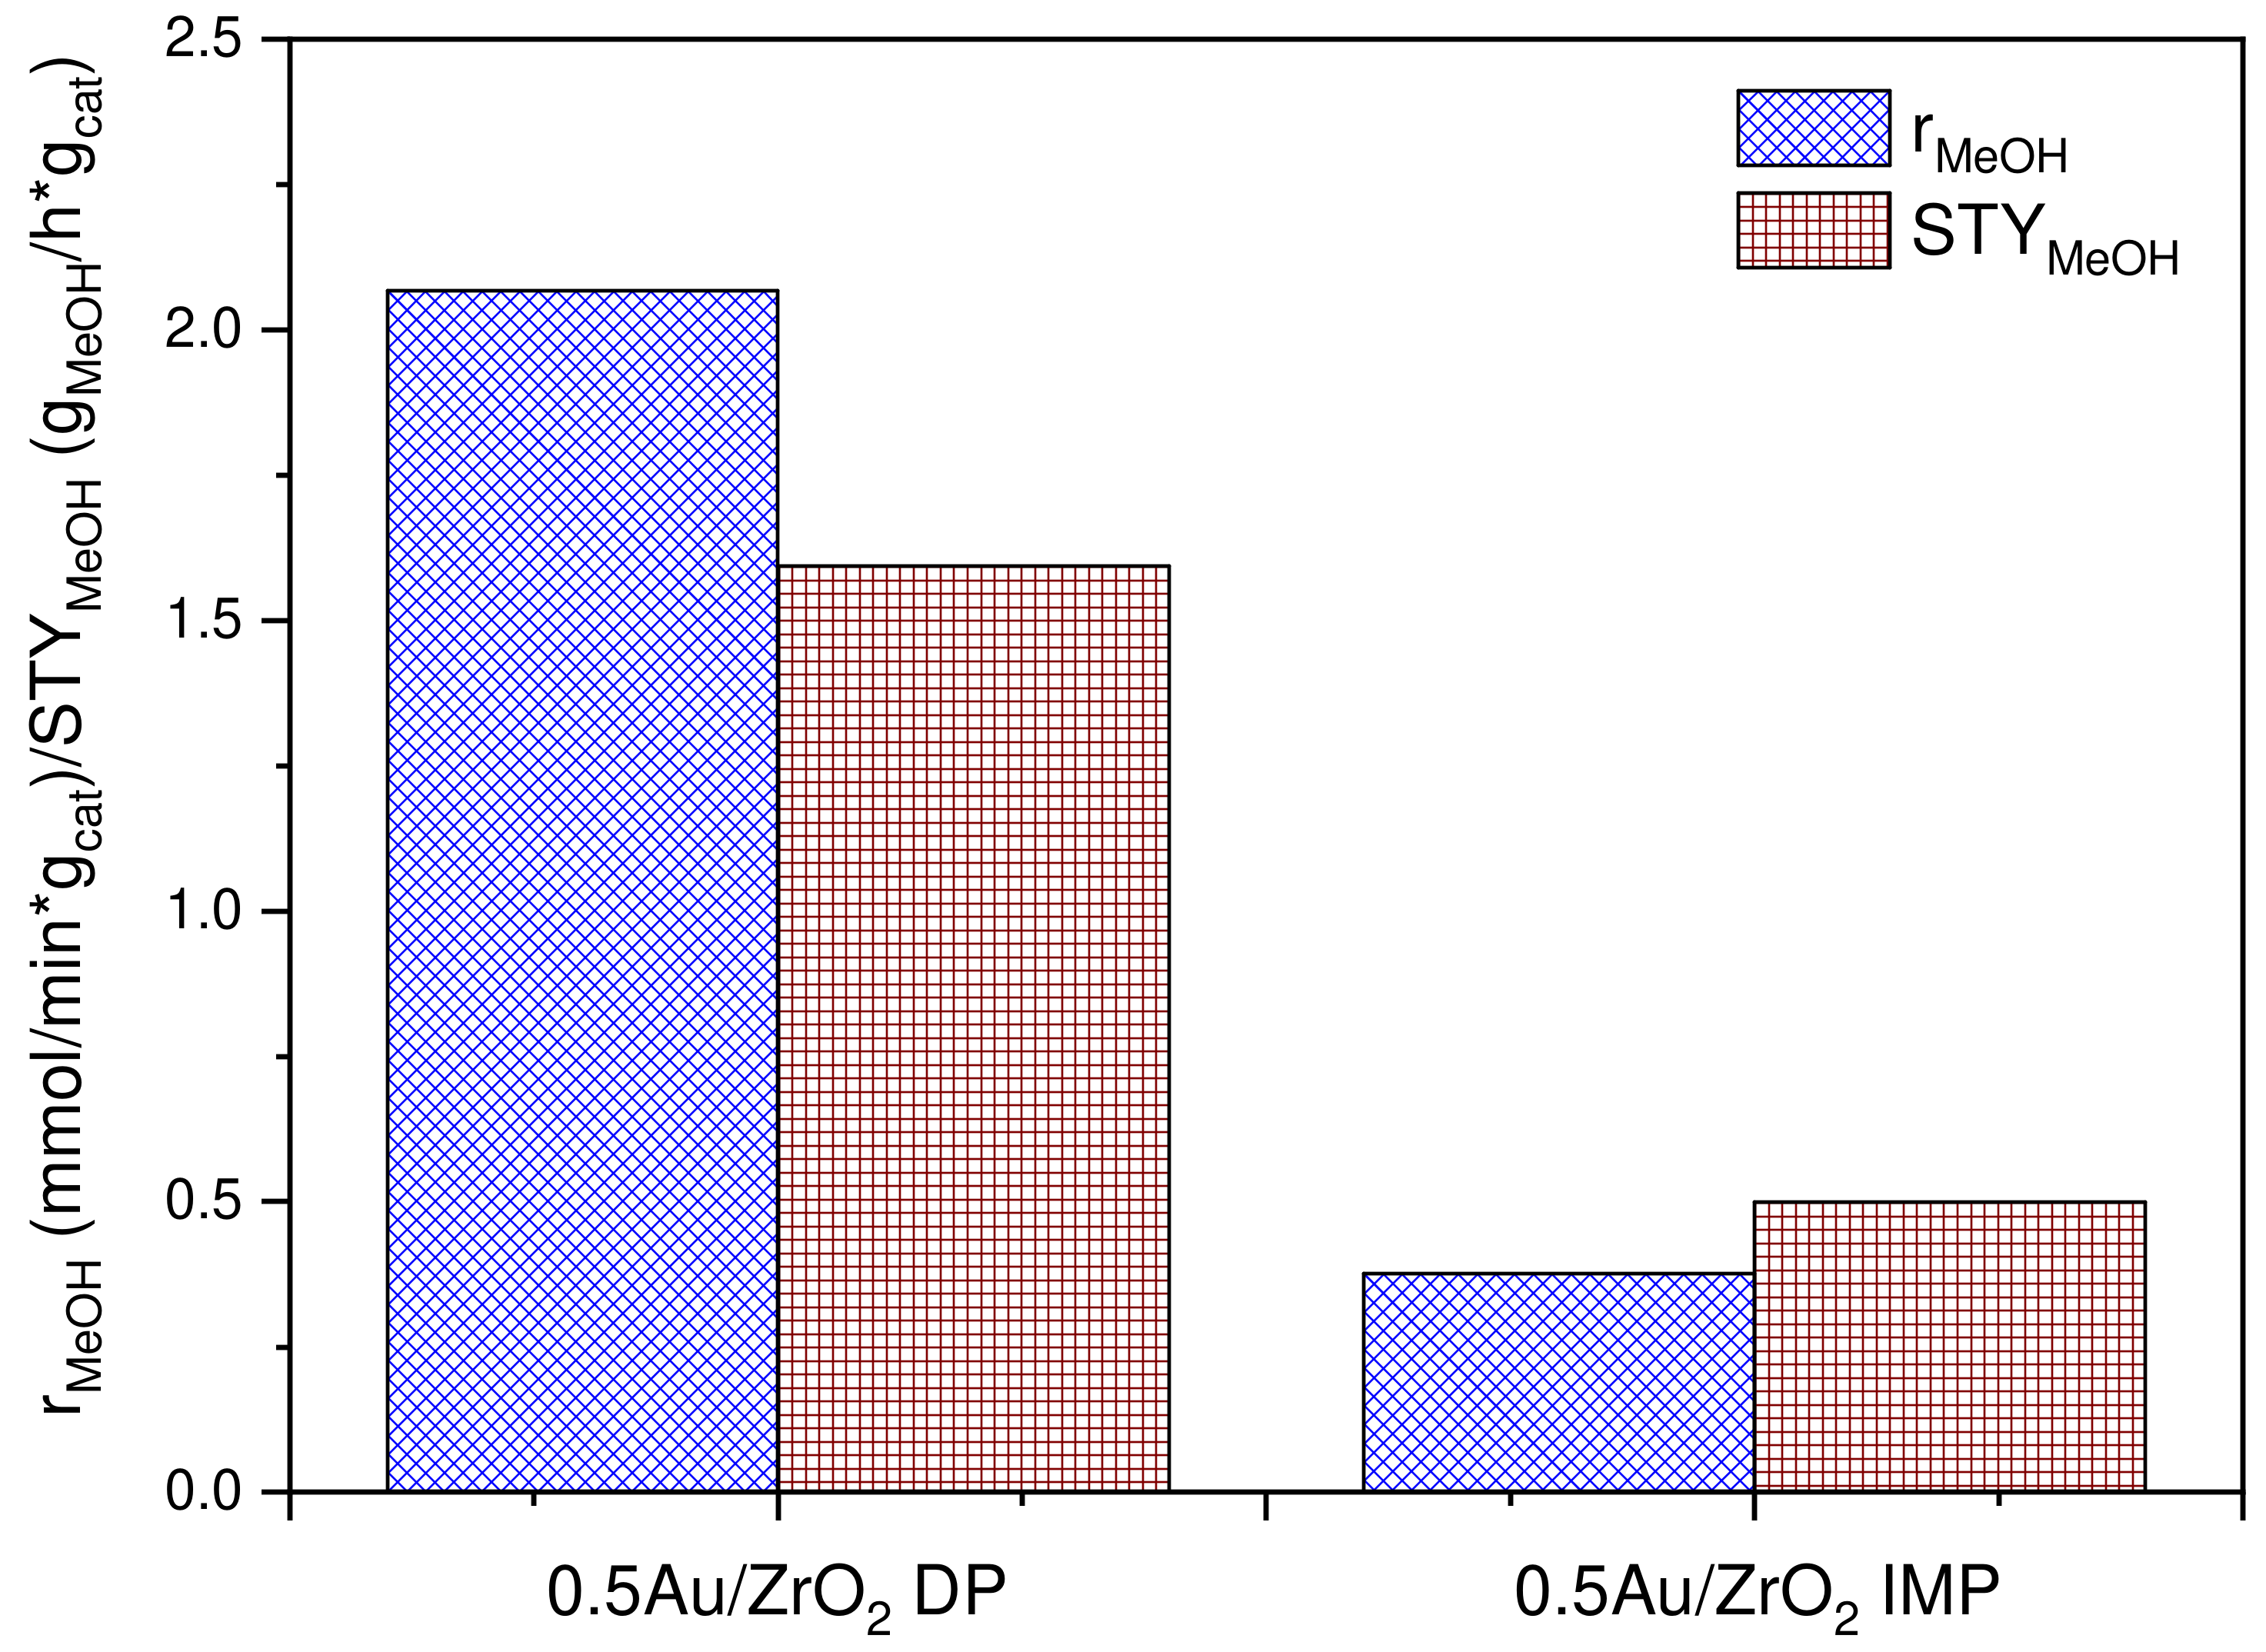
2.1. Catalytic Activity
2.2. Catalyst Characterization
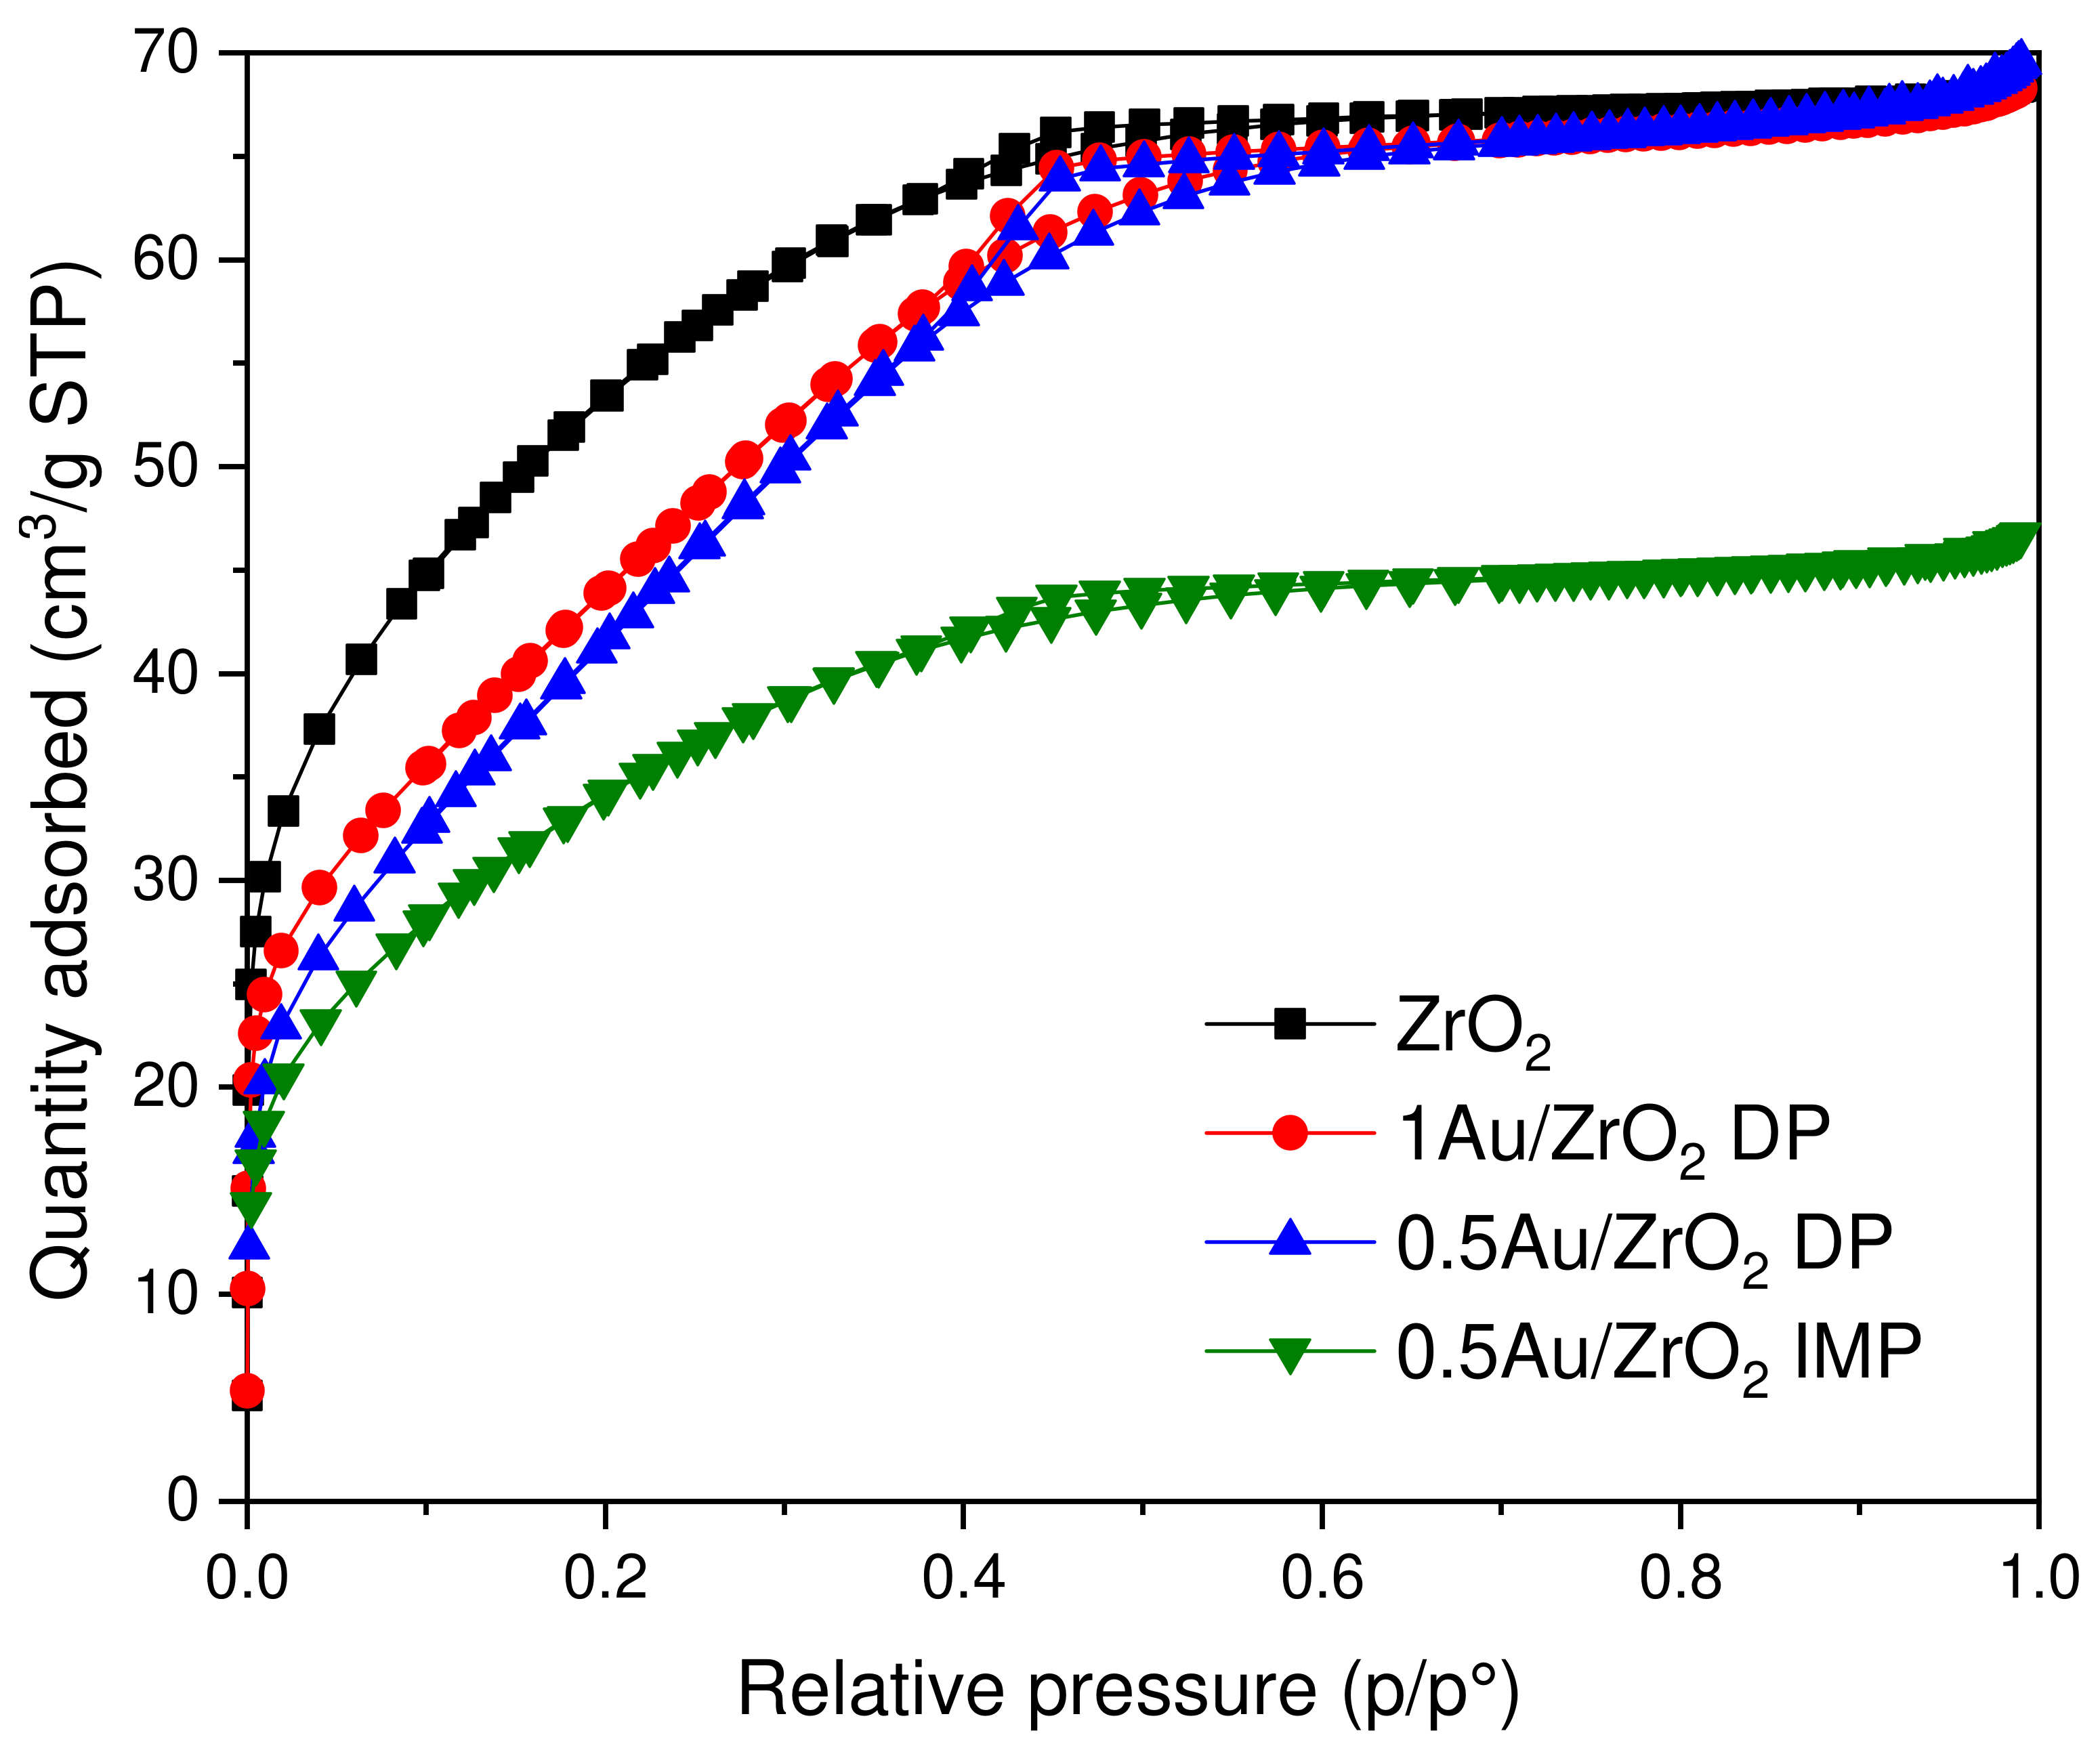
2.2.1. N2 Physisorption, Au Loading
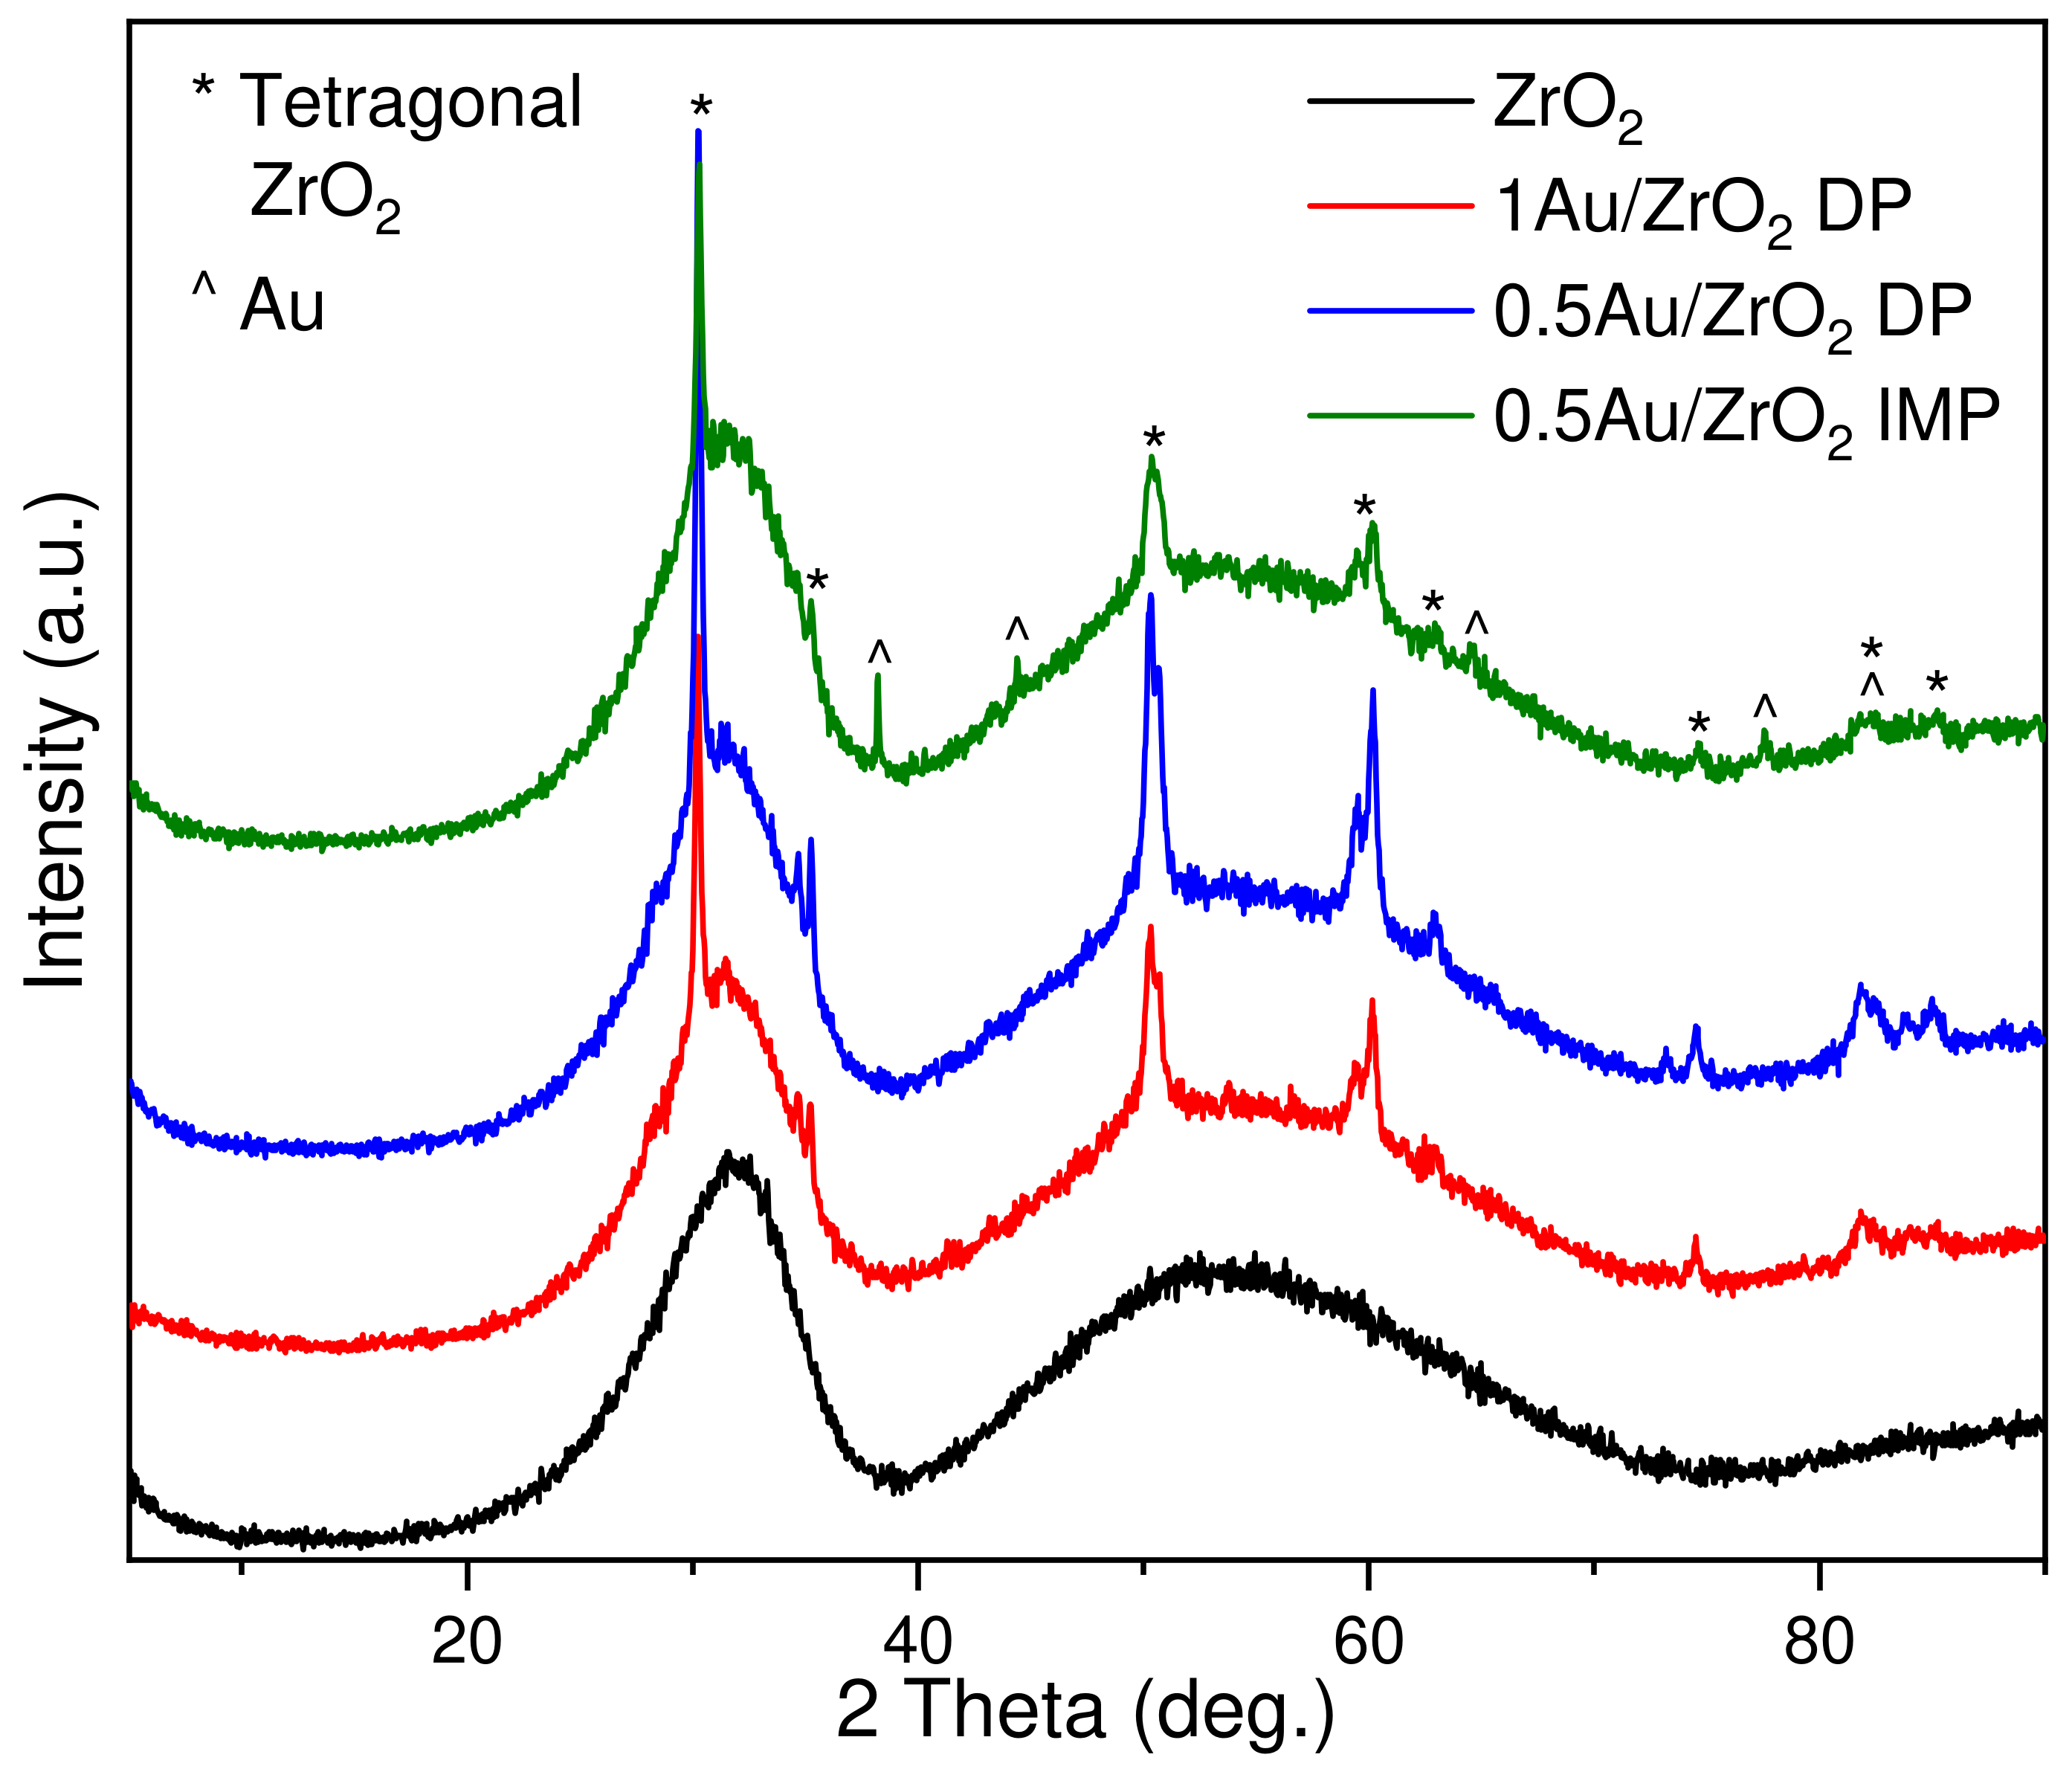
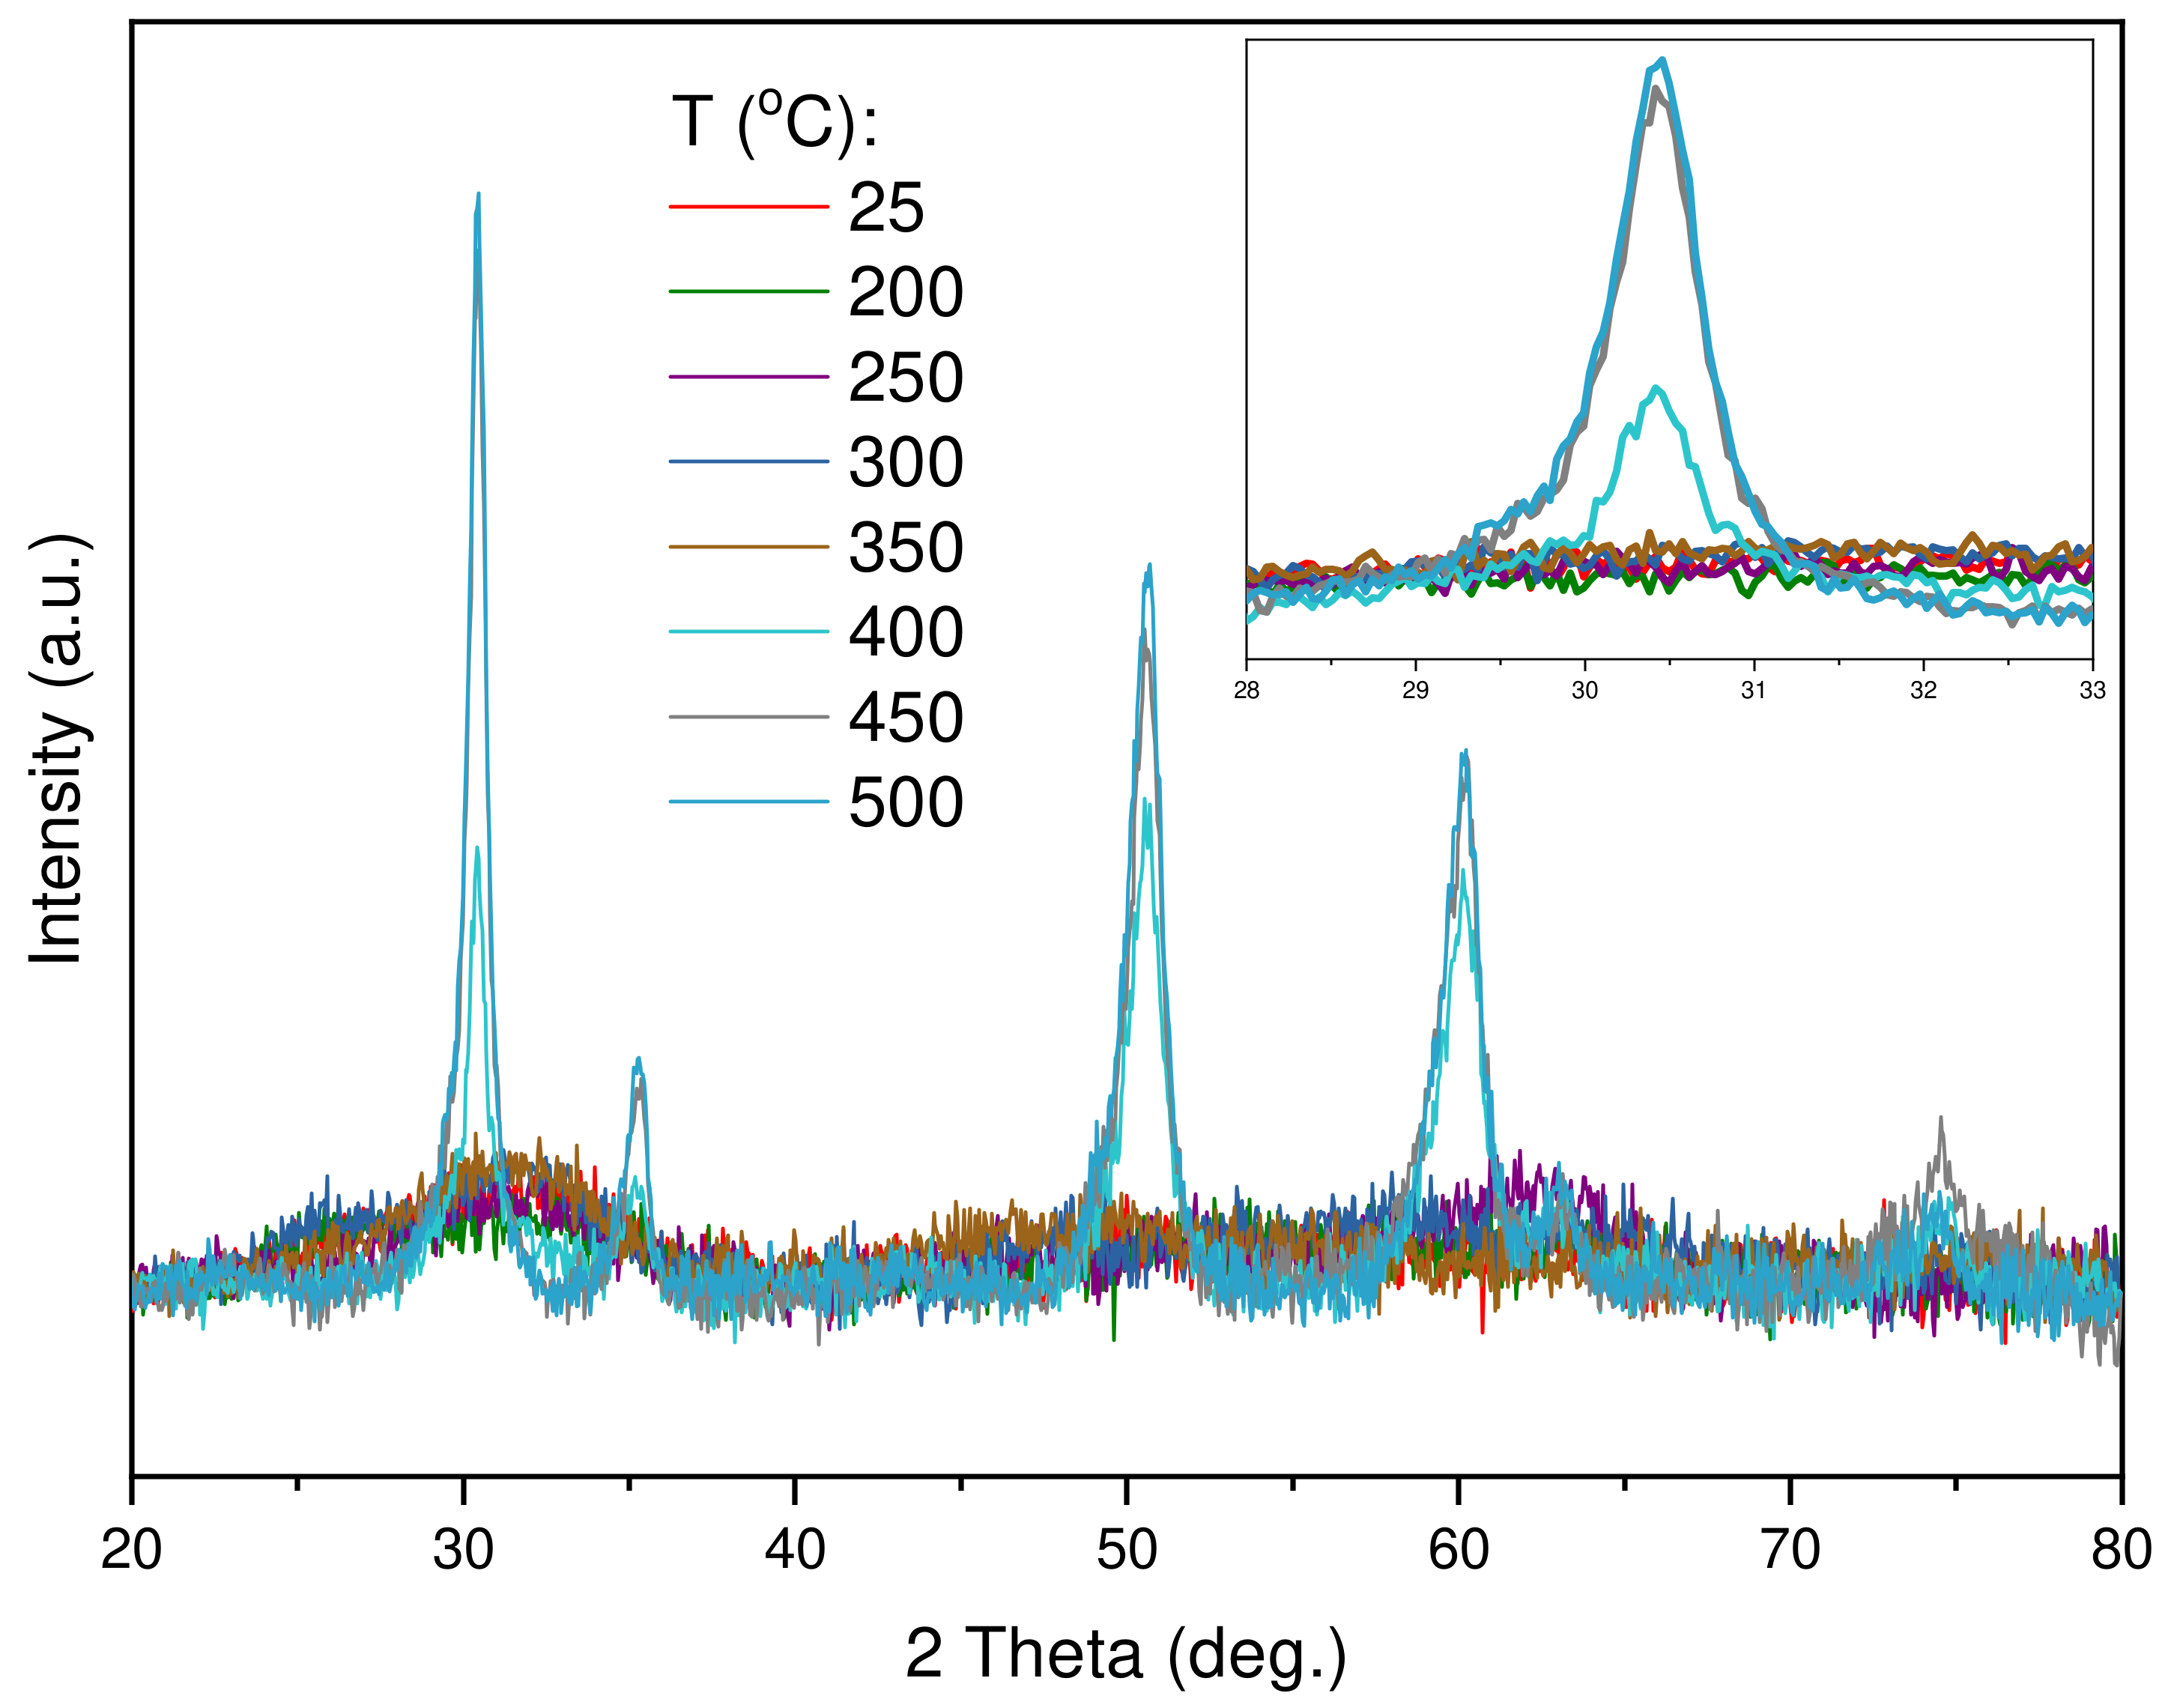
2.2.2. X-ray Powder Diffraction Analysis
2.2.3. Pyridine Temperature-Programmed Desorption (Py-TPD)
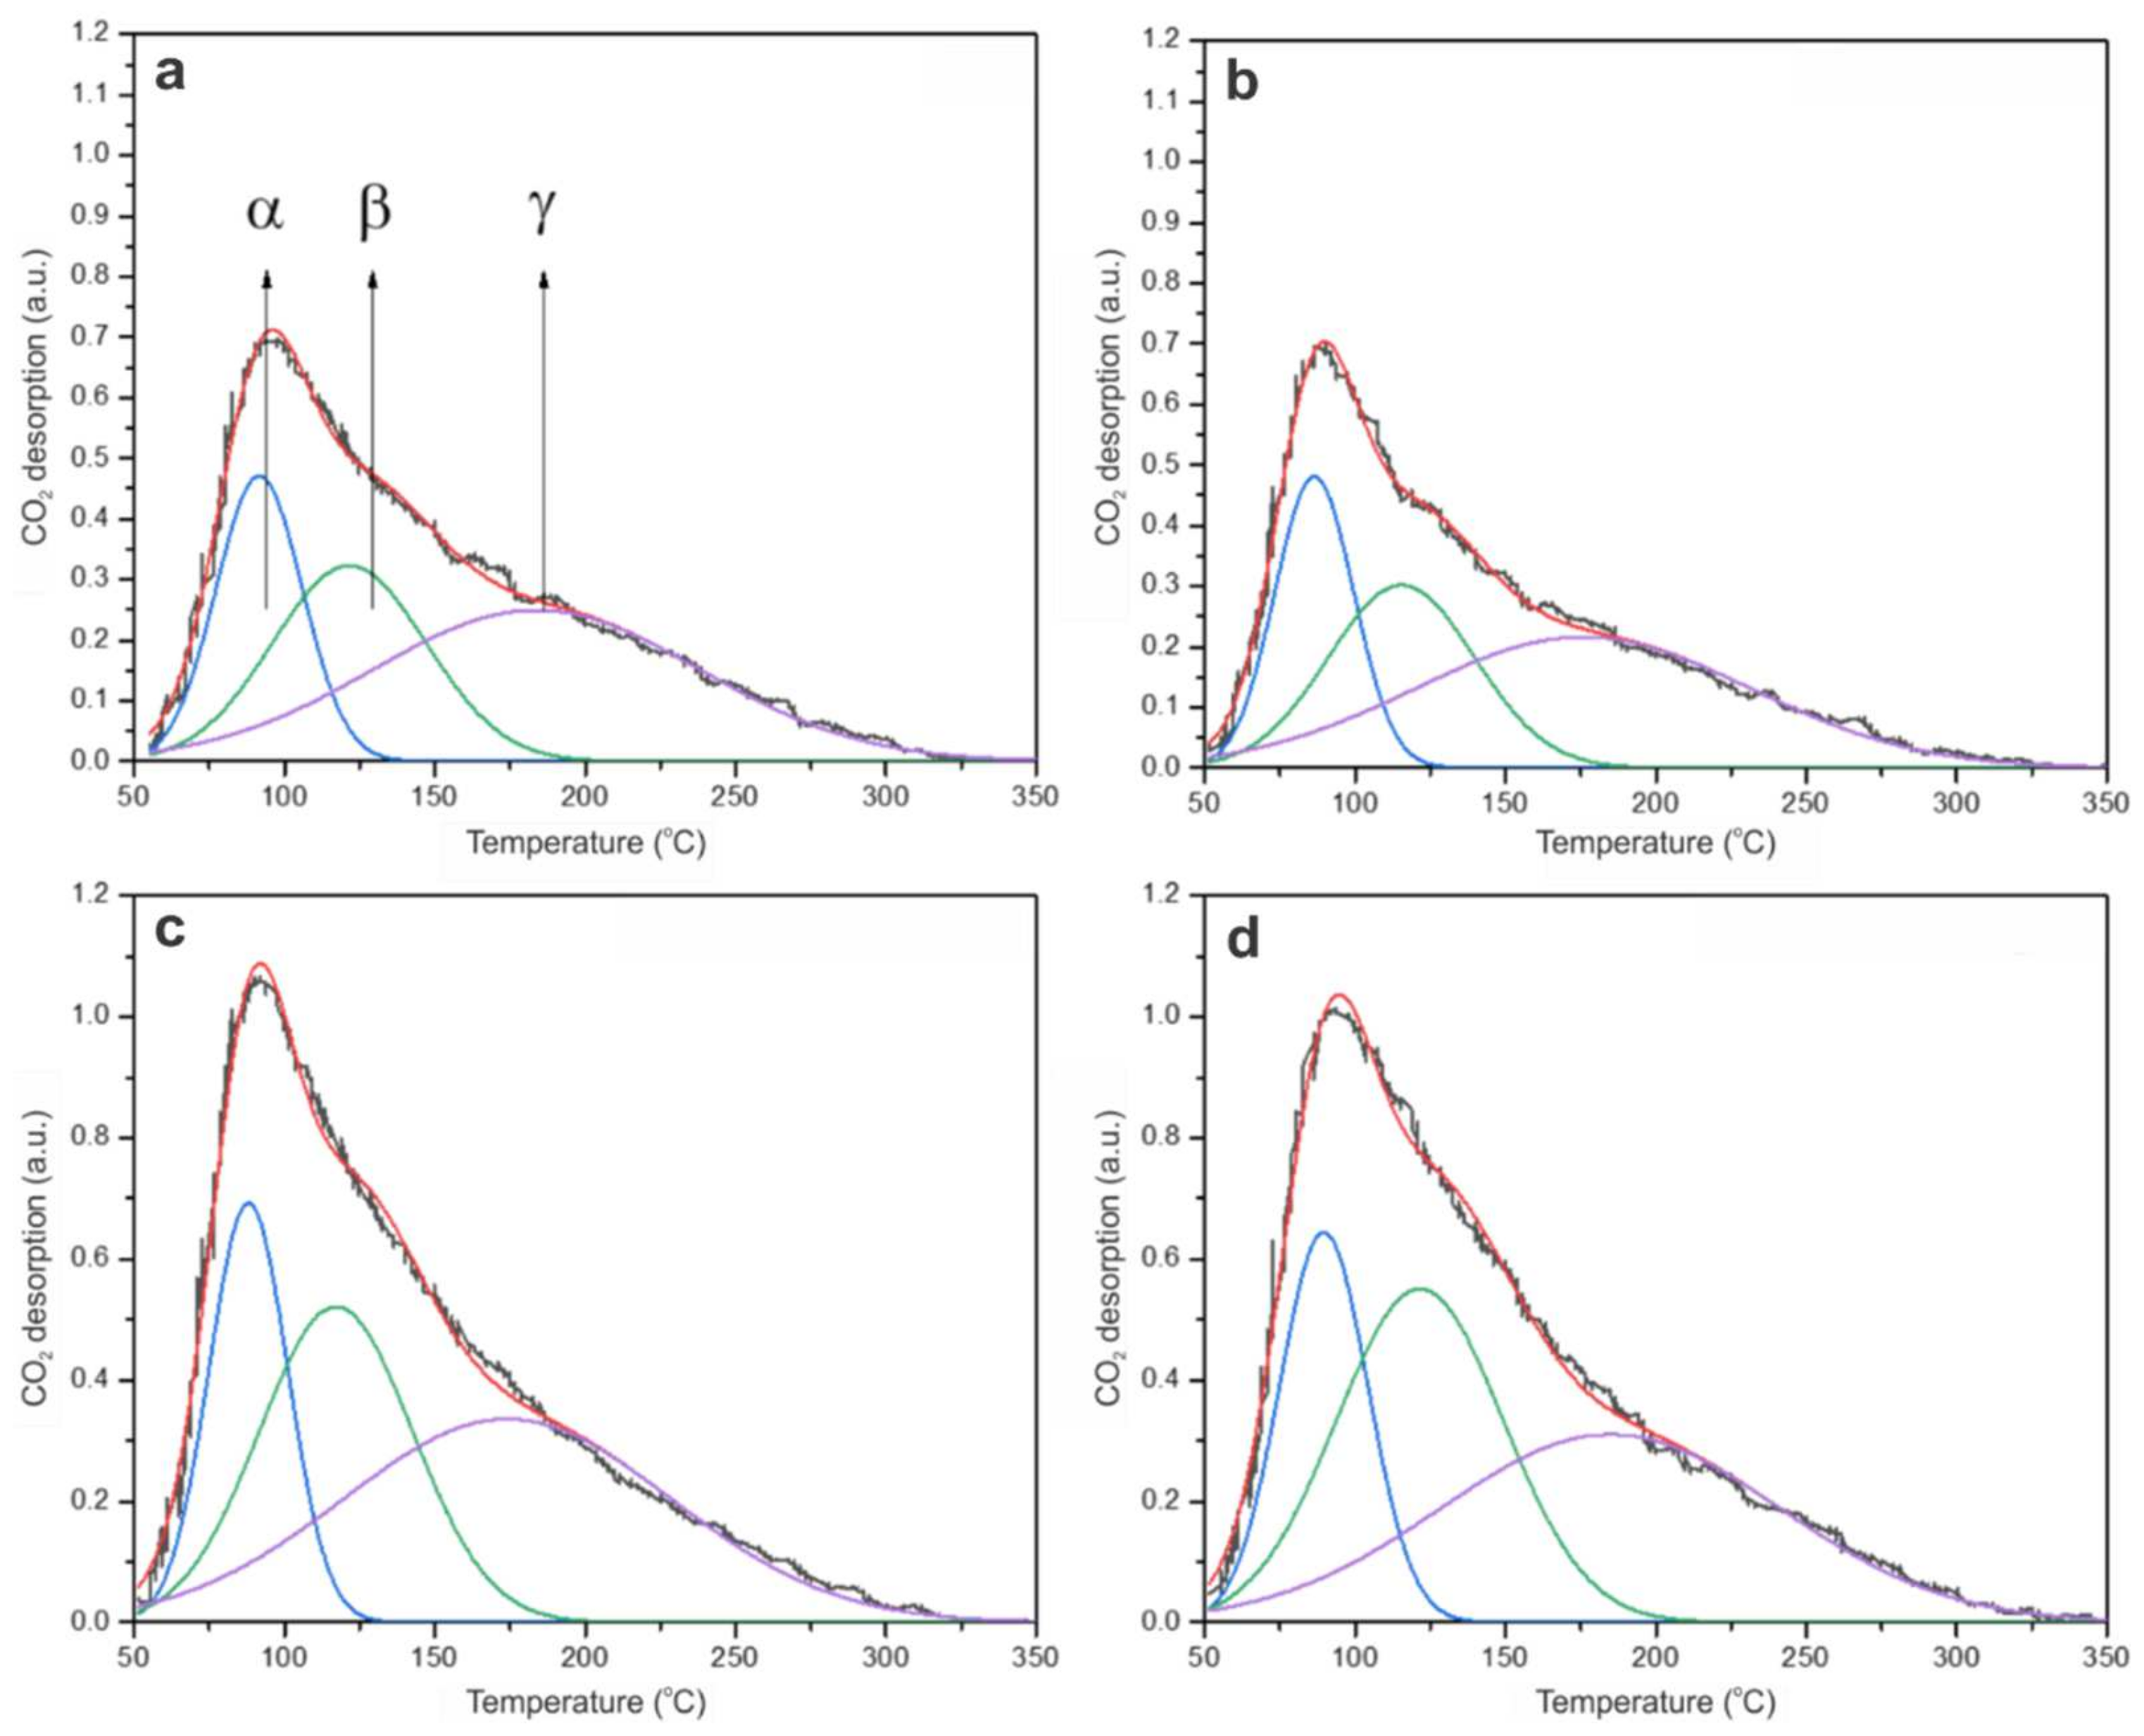
2.2.4. CO2 Temperature-Programmed Desorption (CO2-TPD)
2.2.5. UV-Vis Diffuse Reflectance Spectroscopy
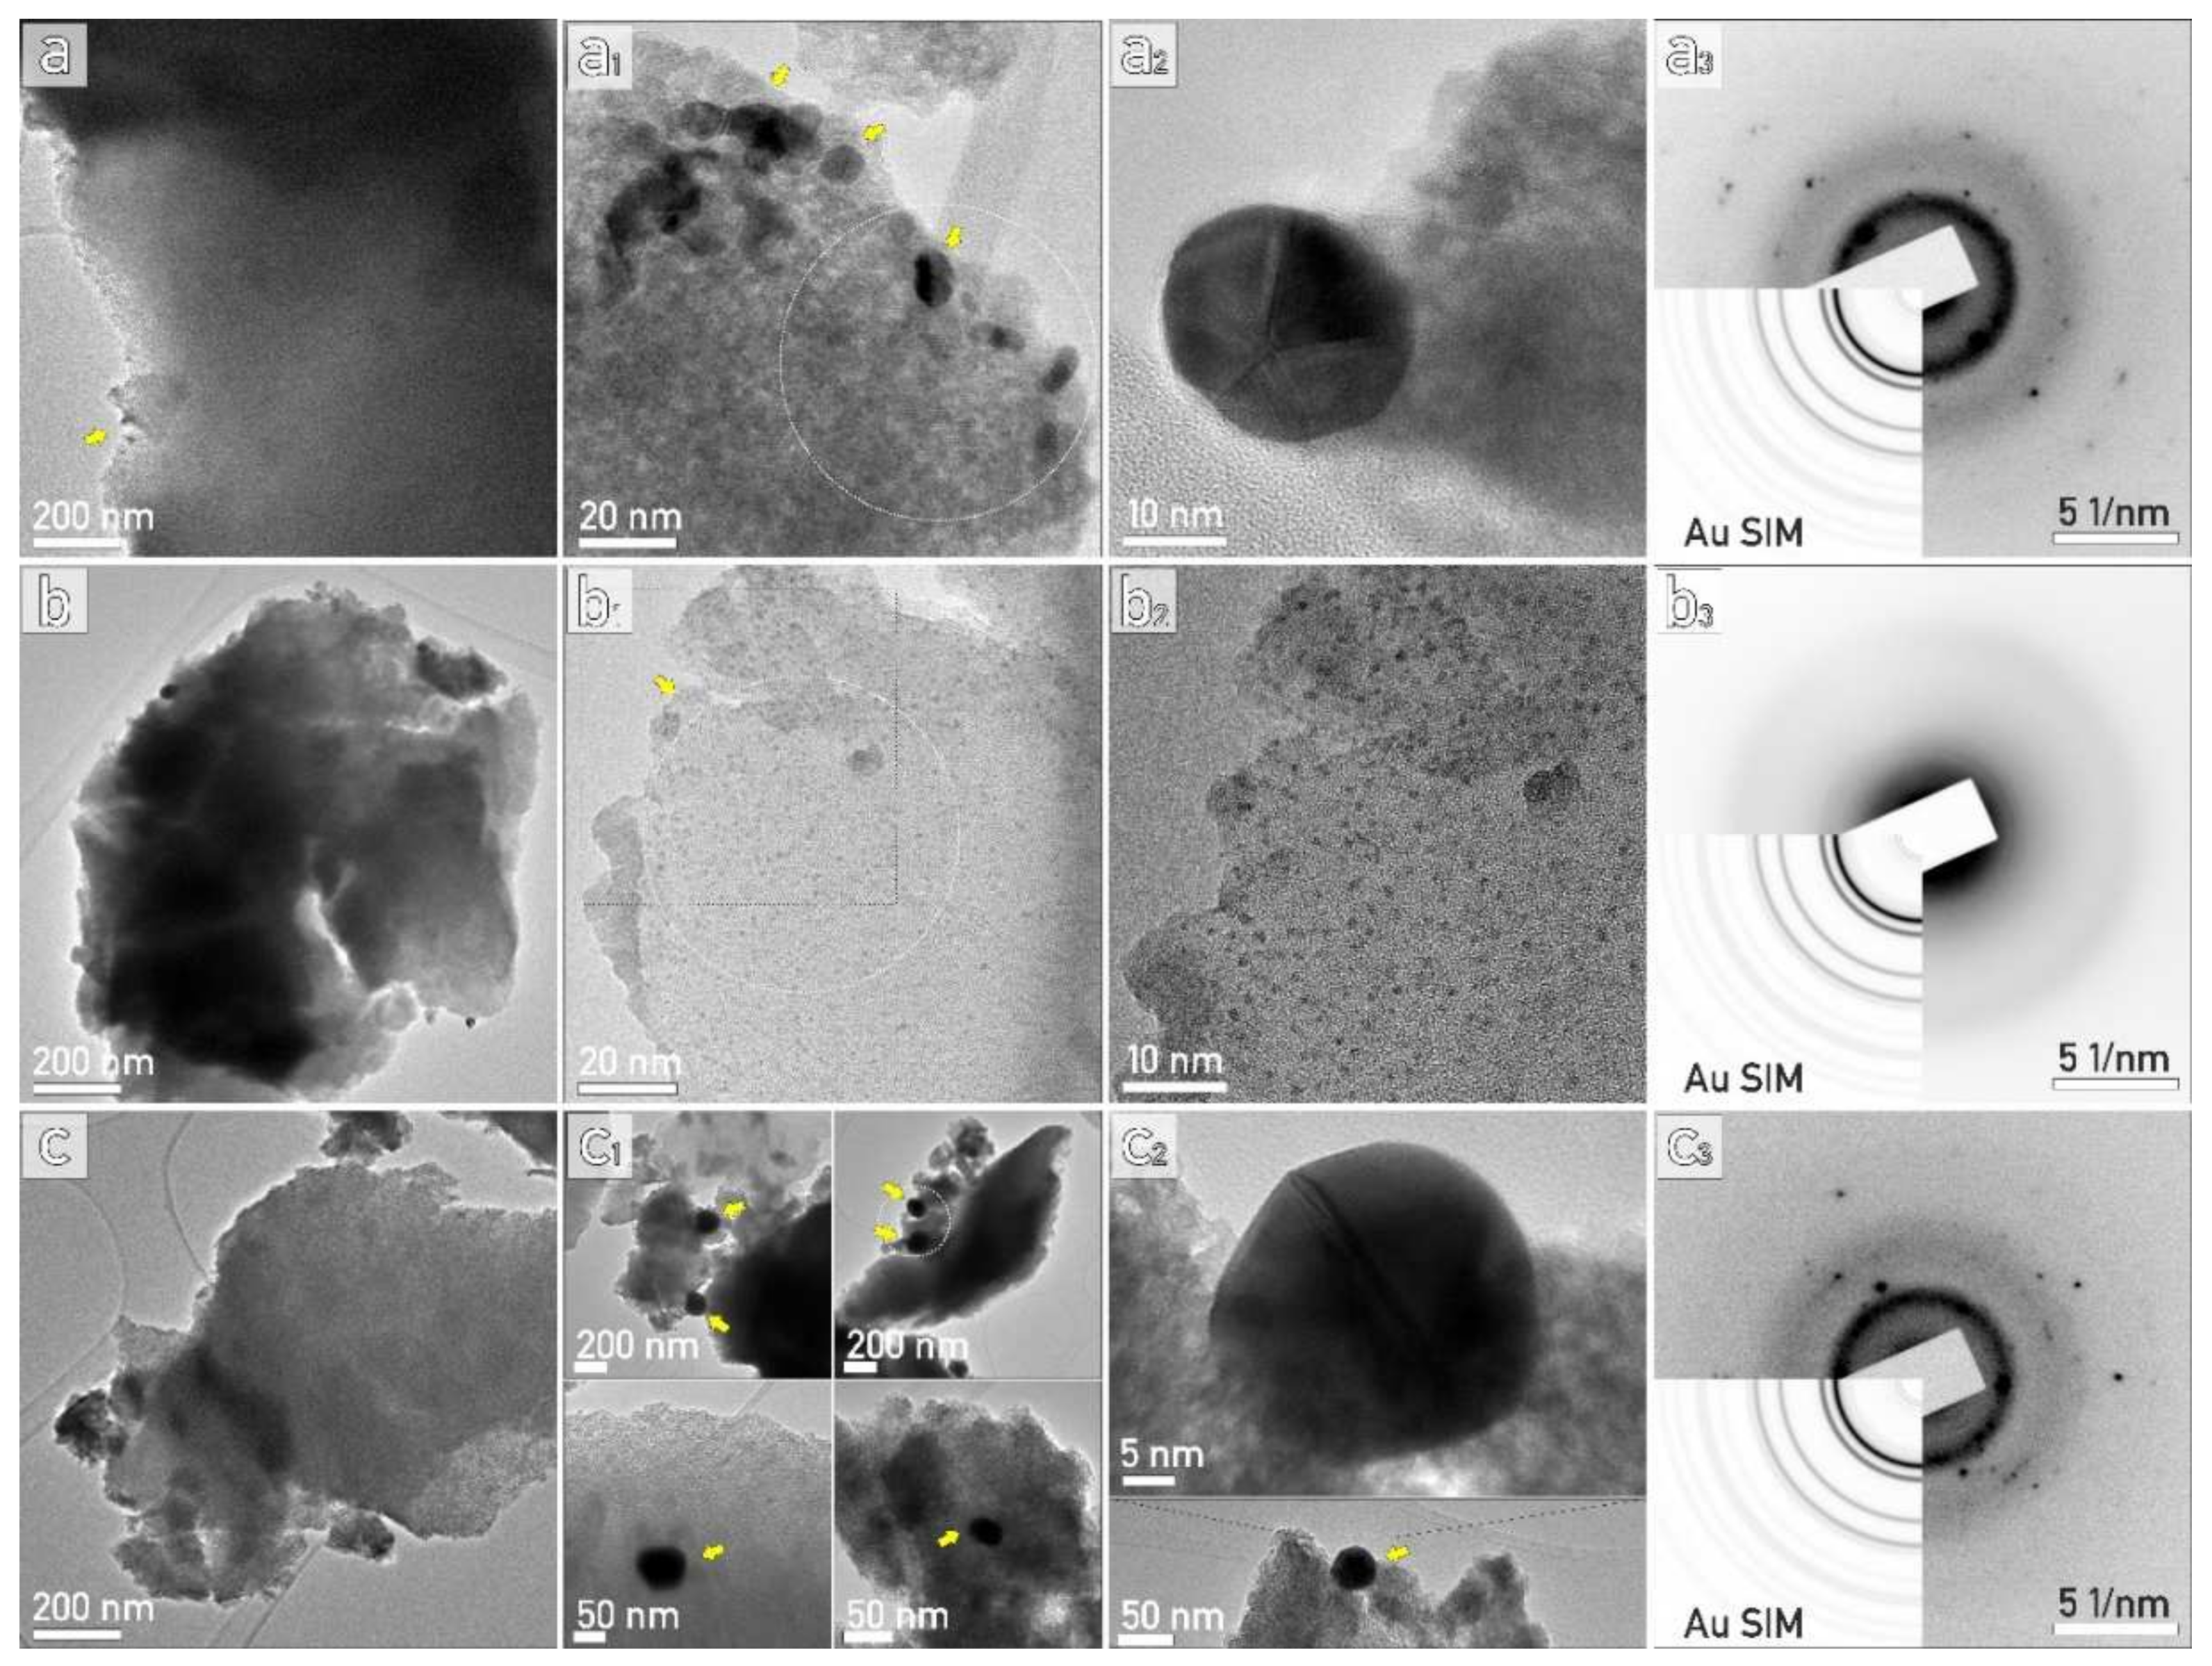
2.2.6. TEM Analysis
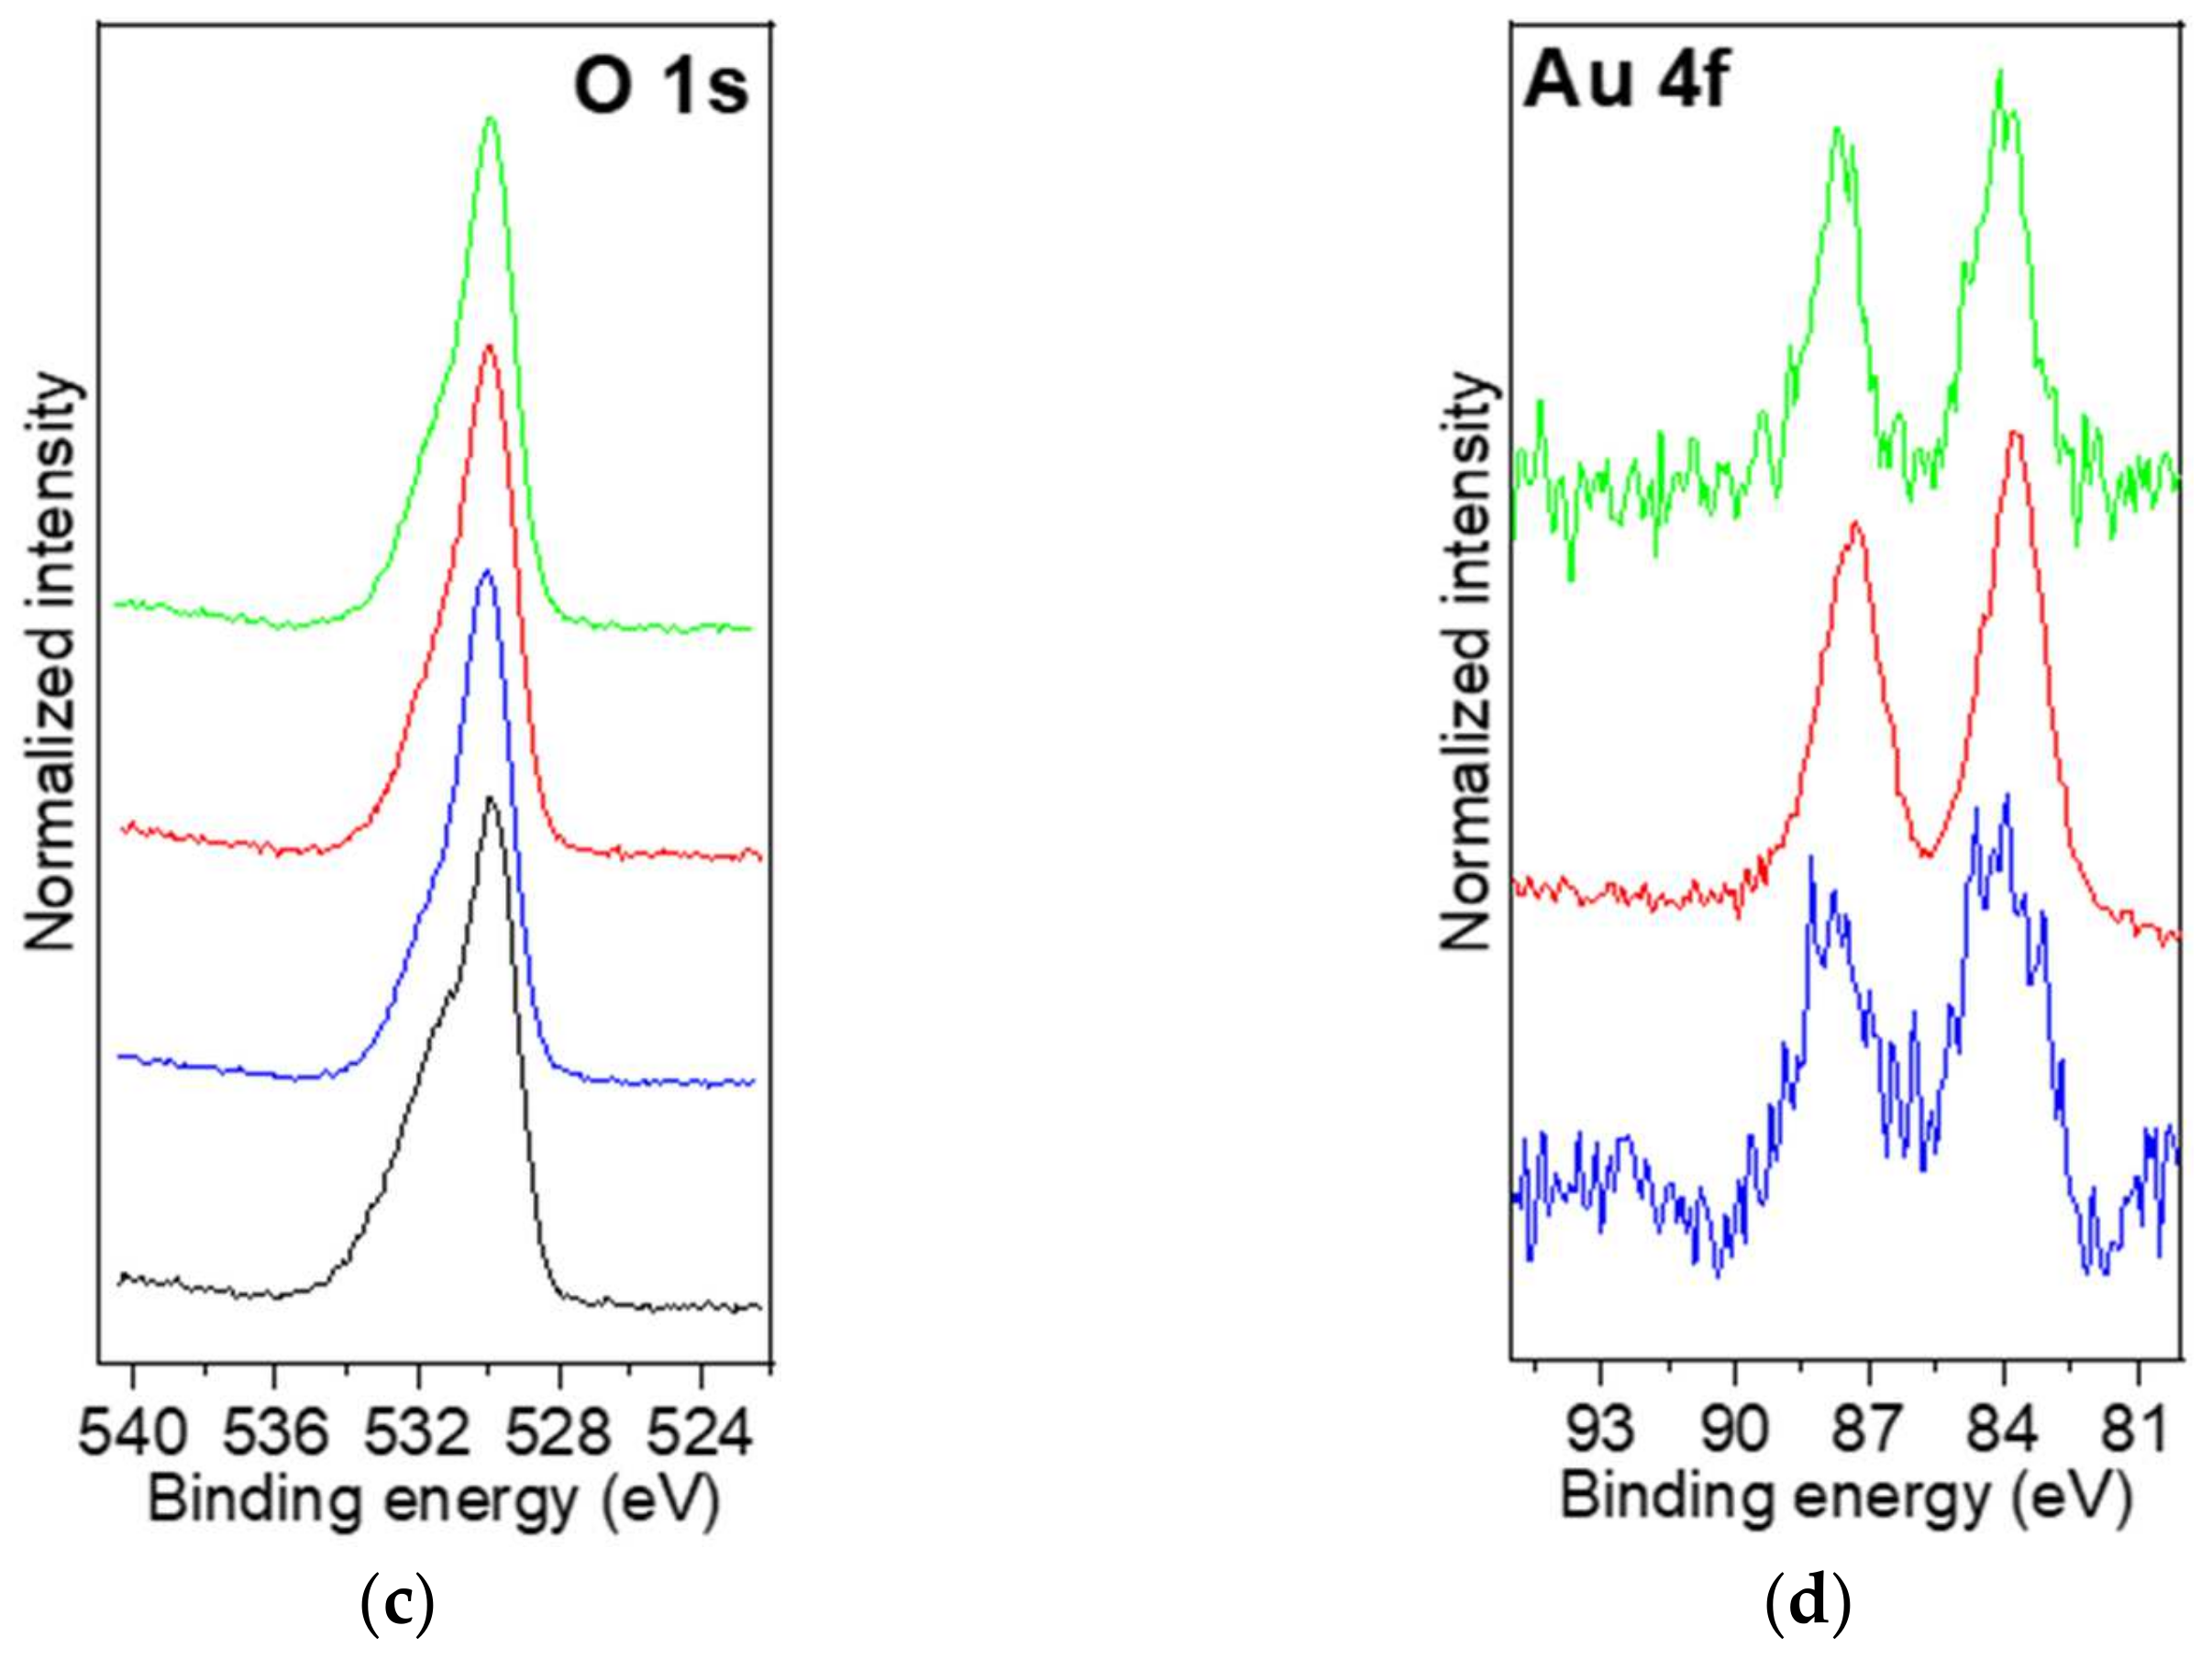
2.2.7. XPS Analysis
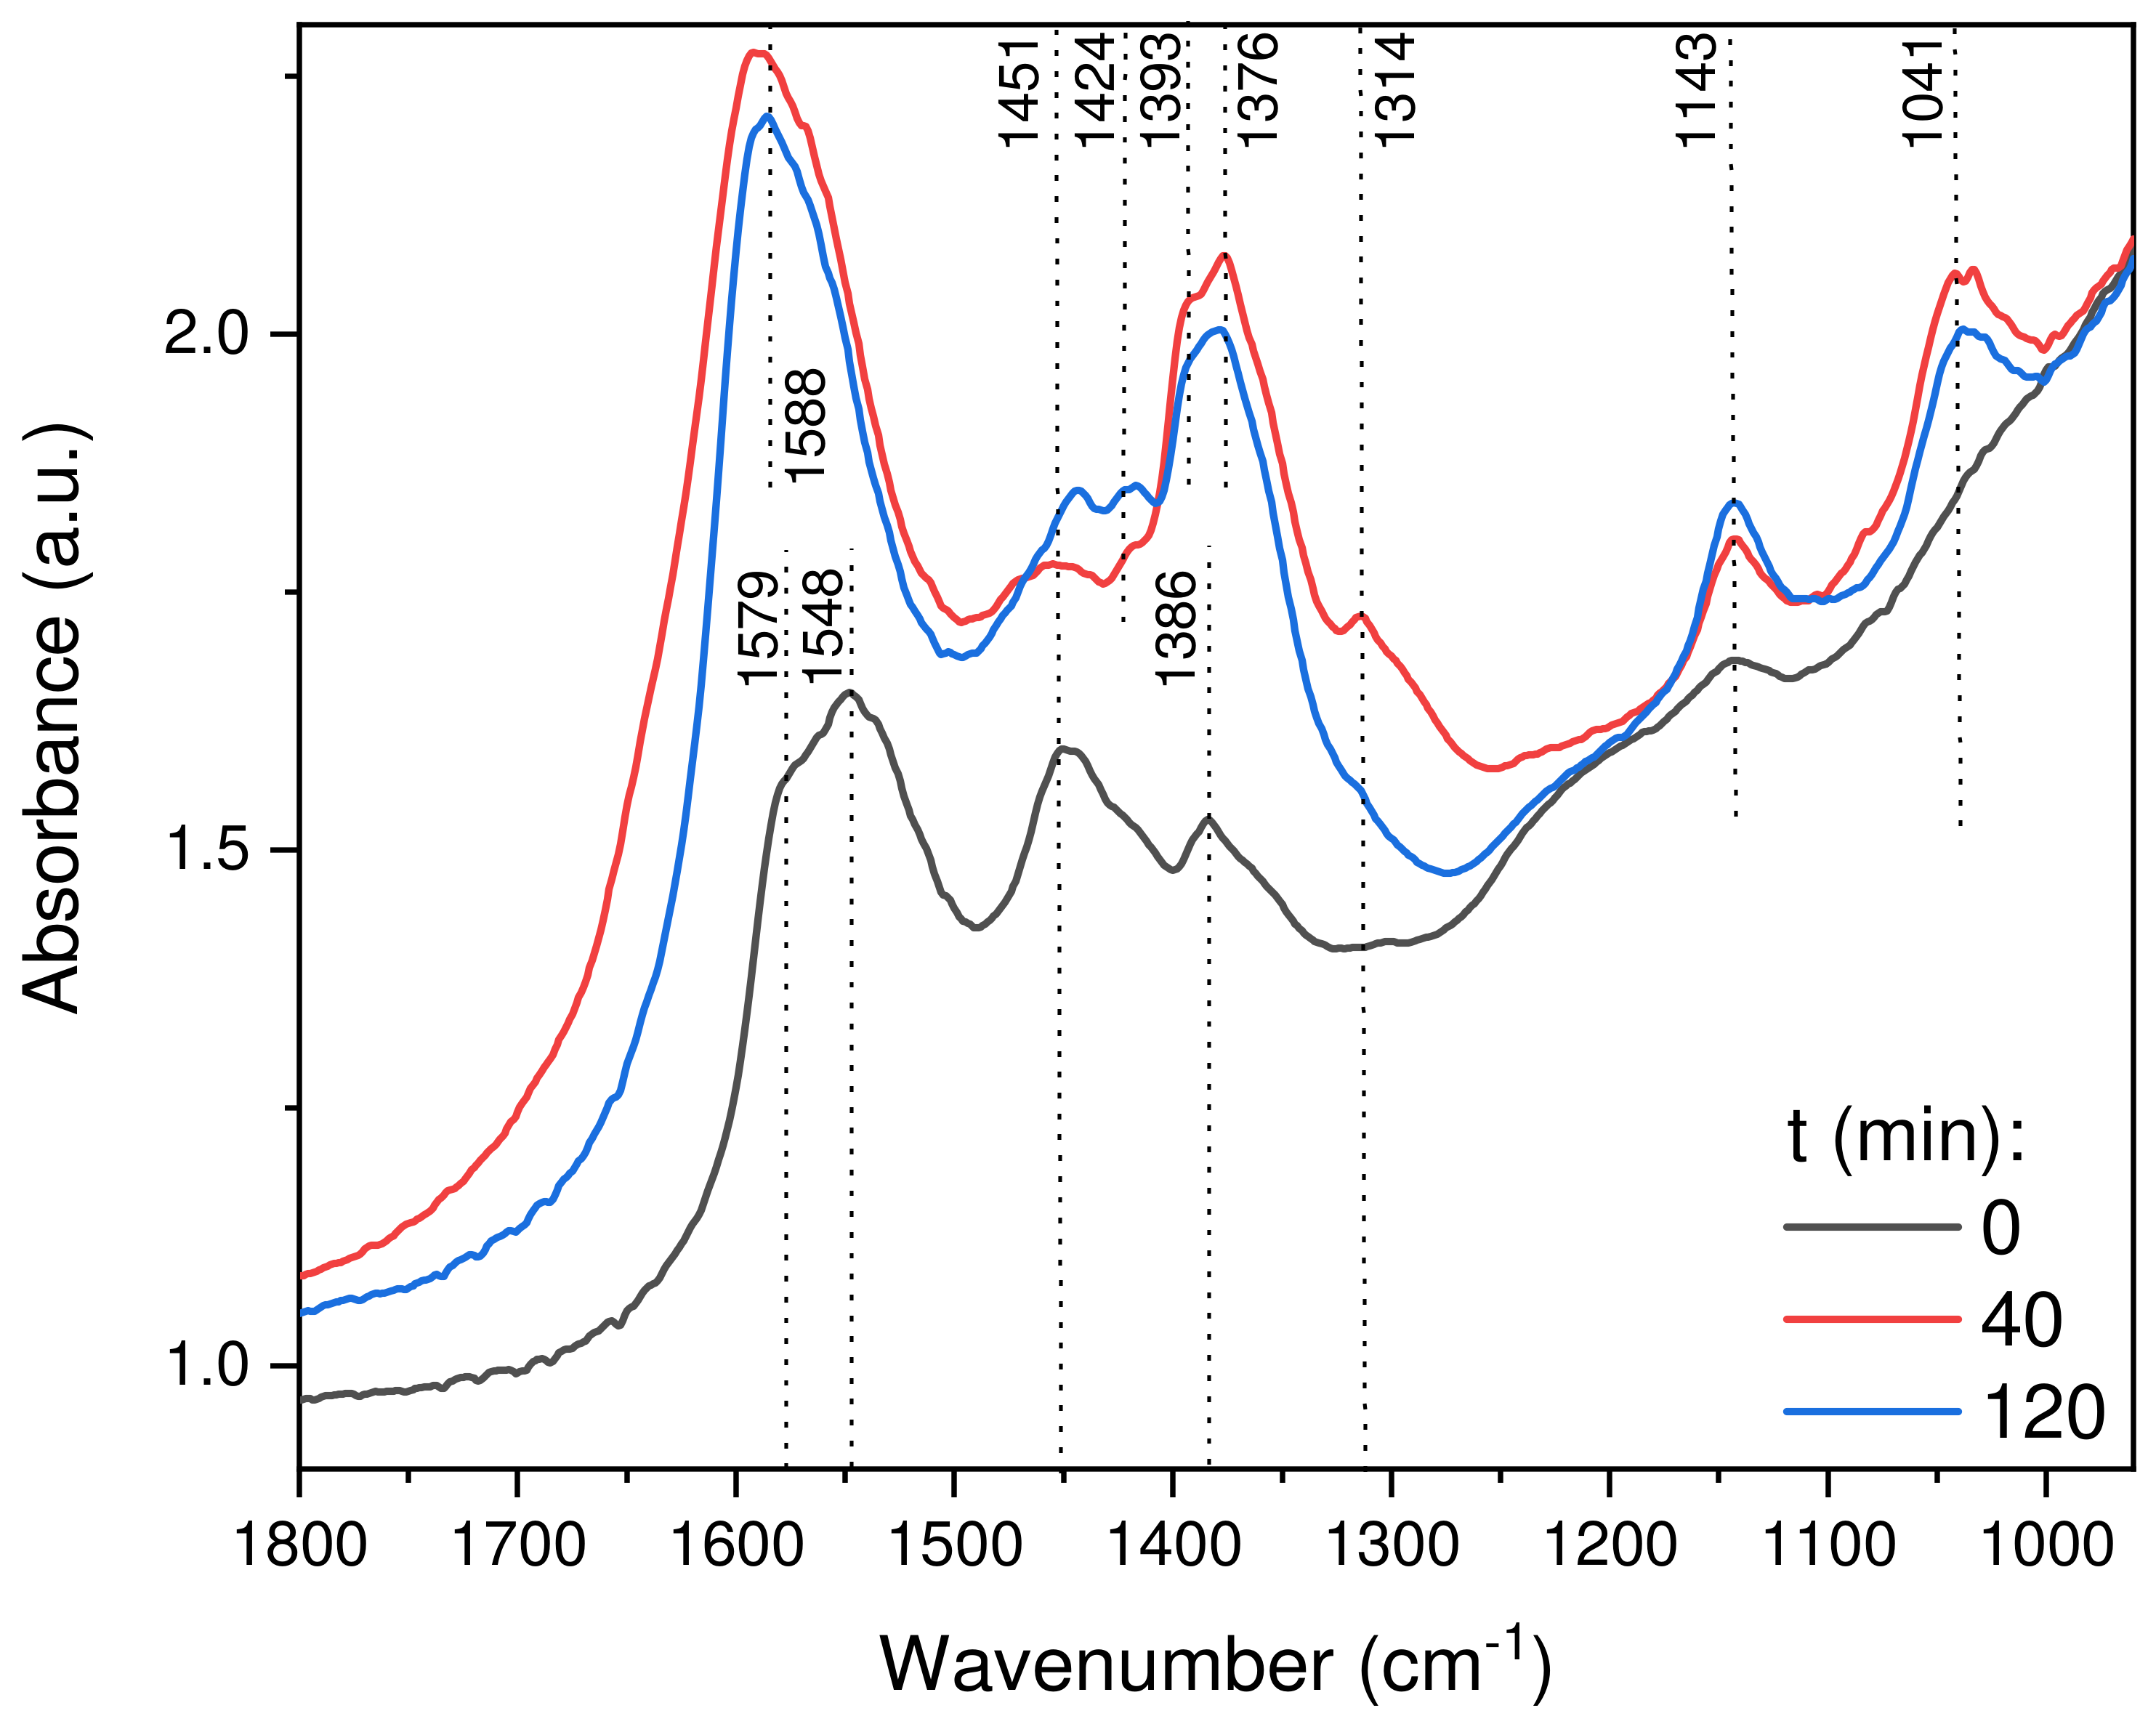
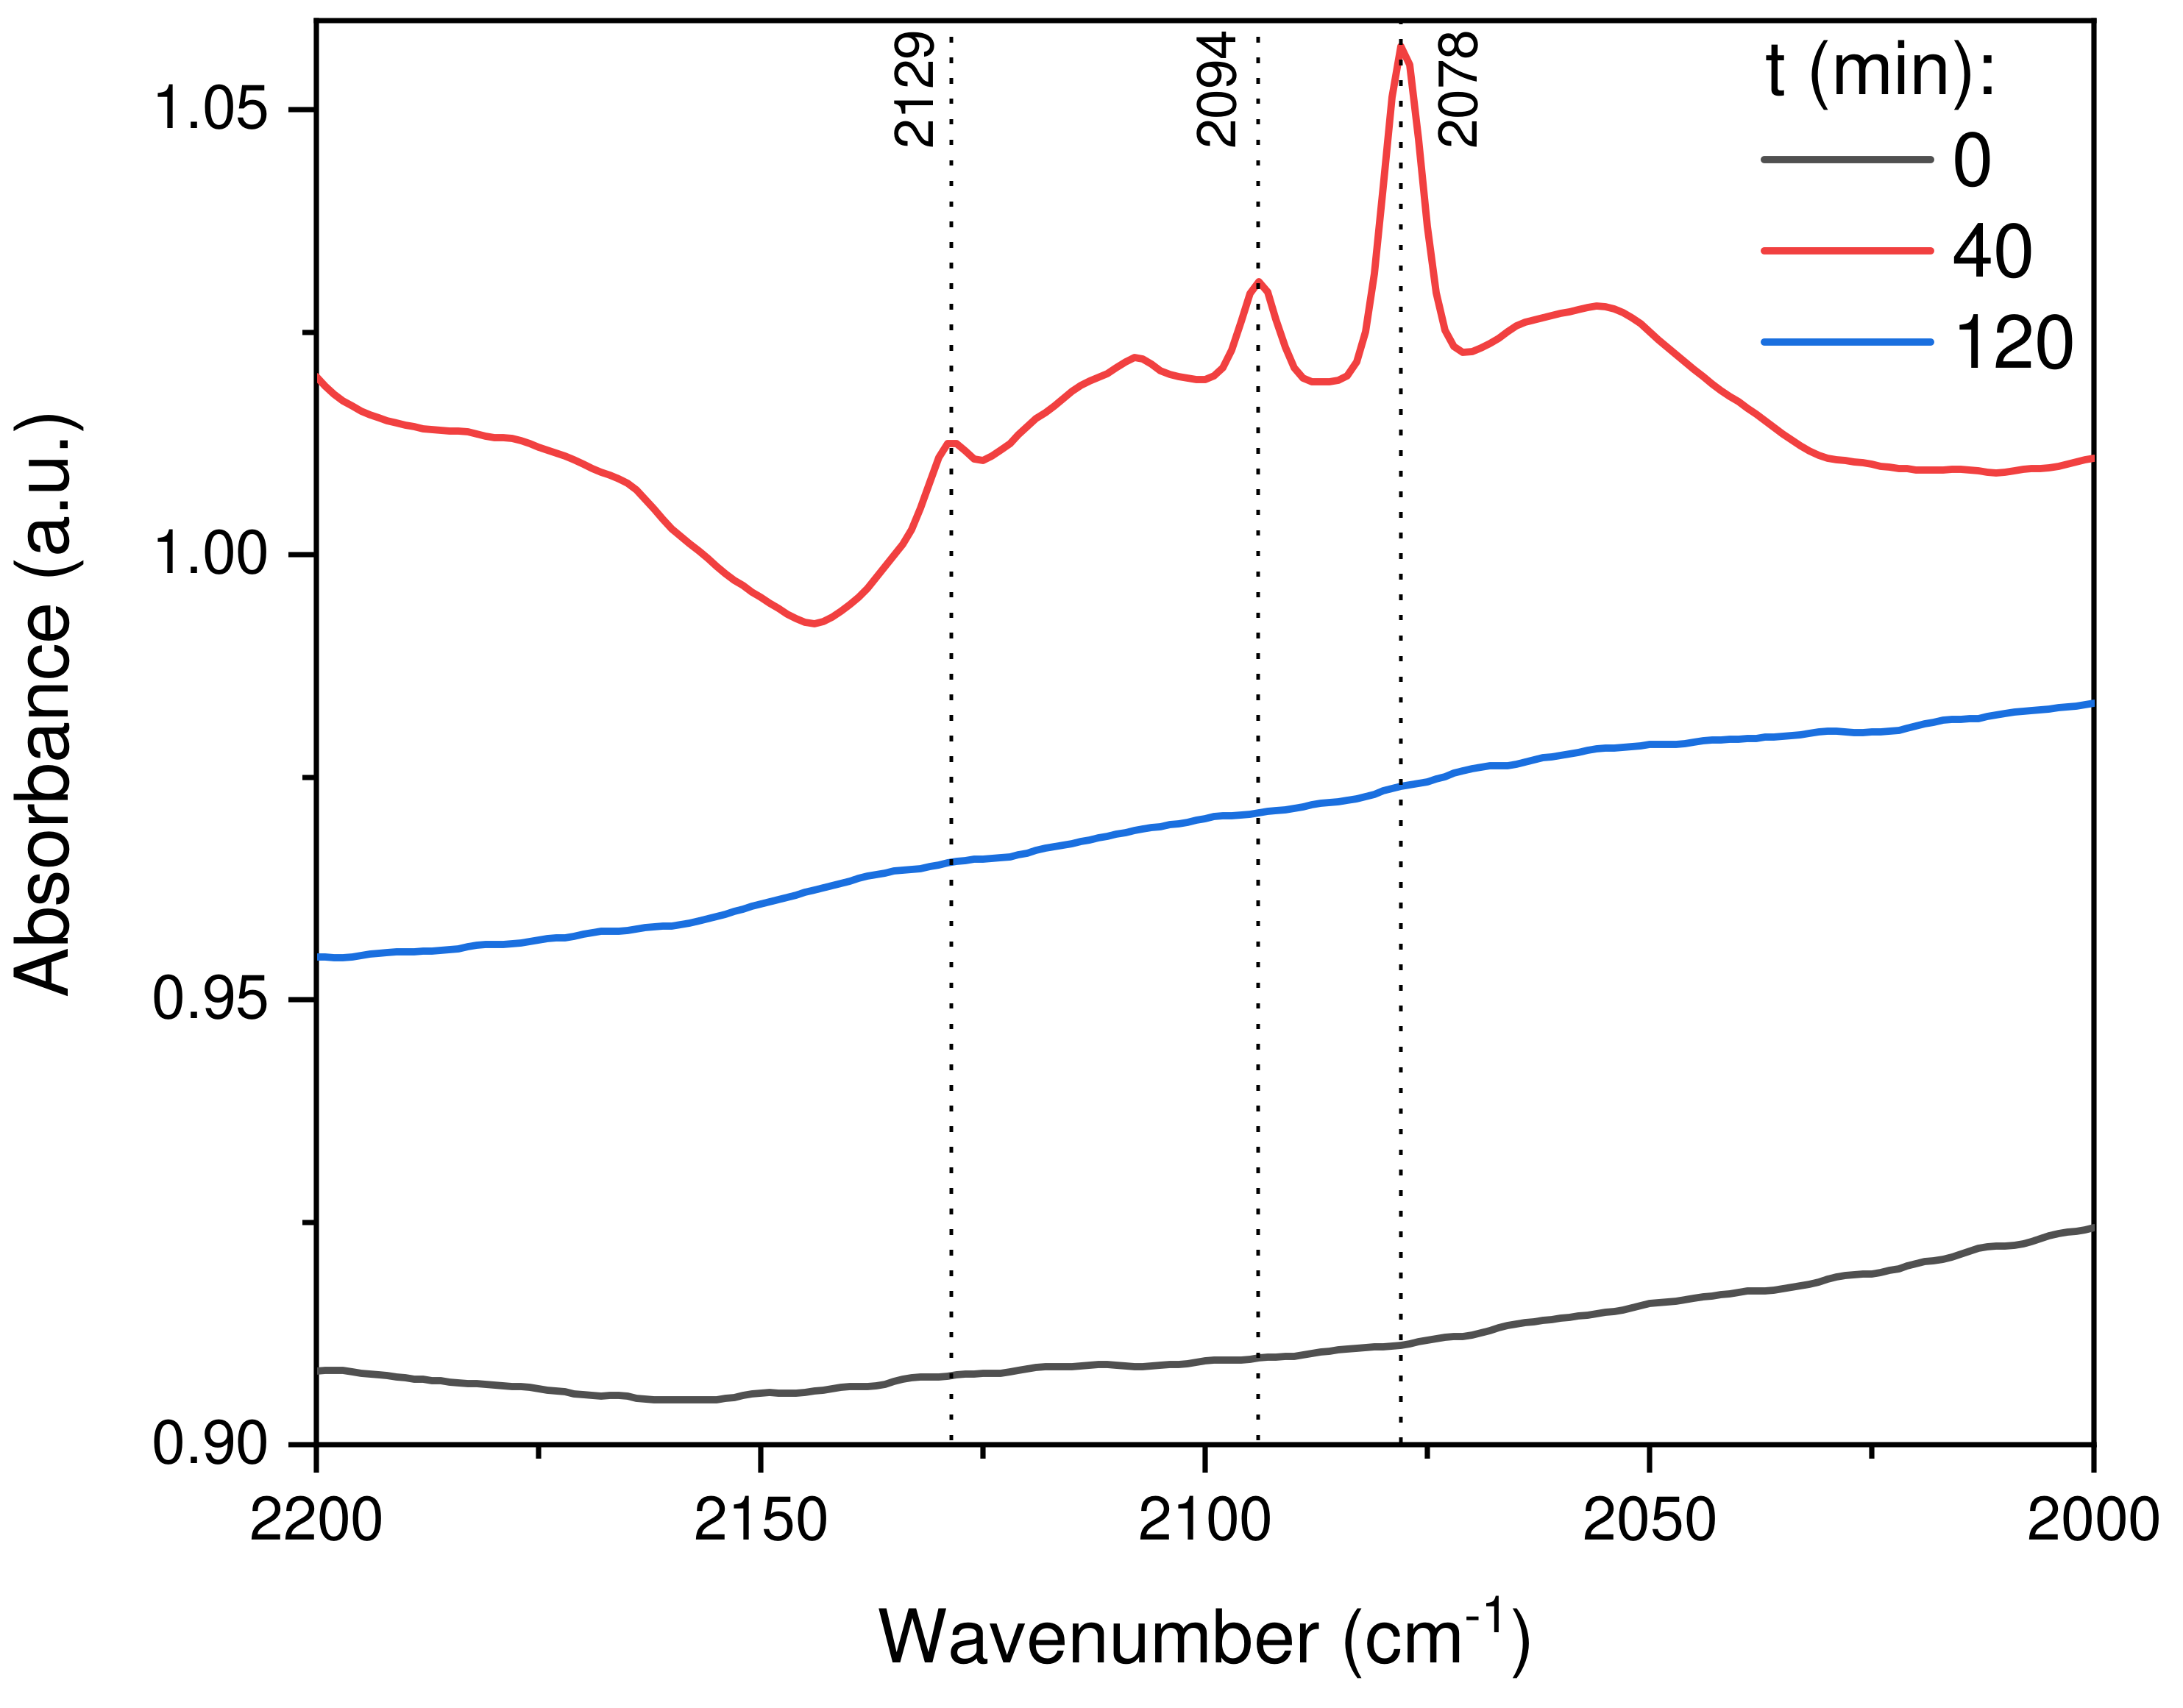
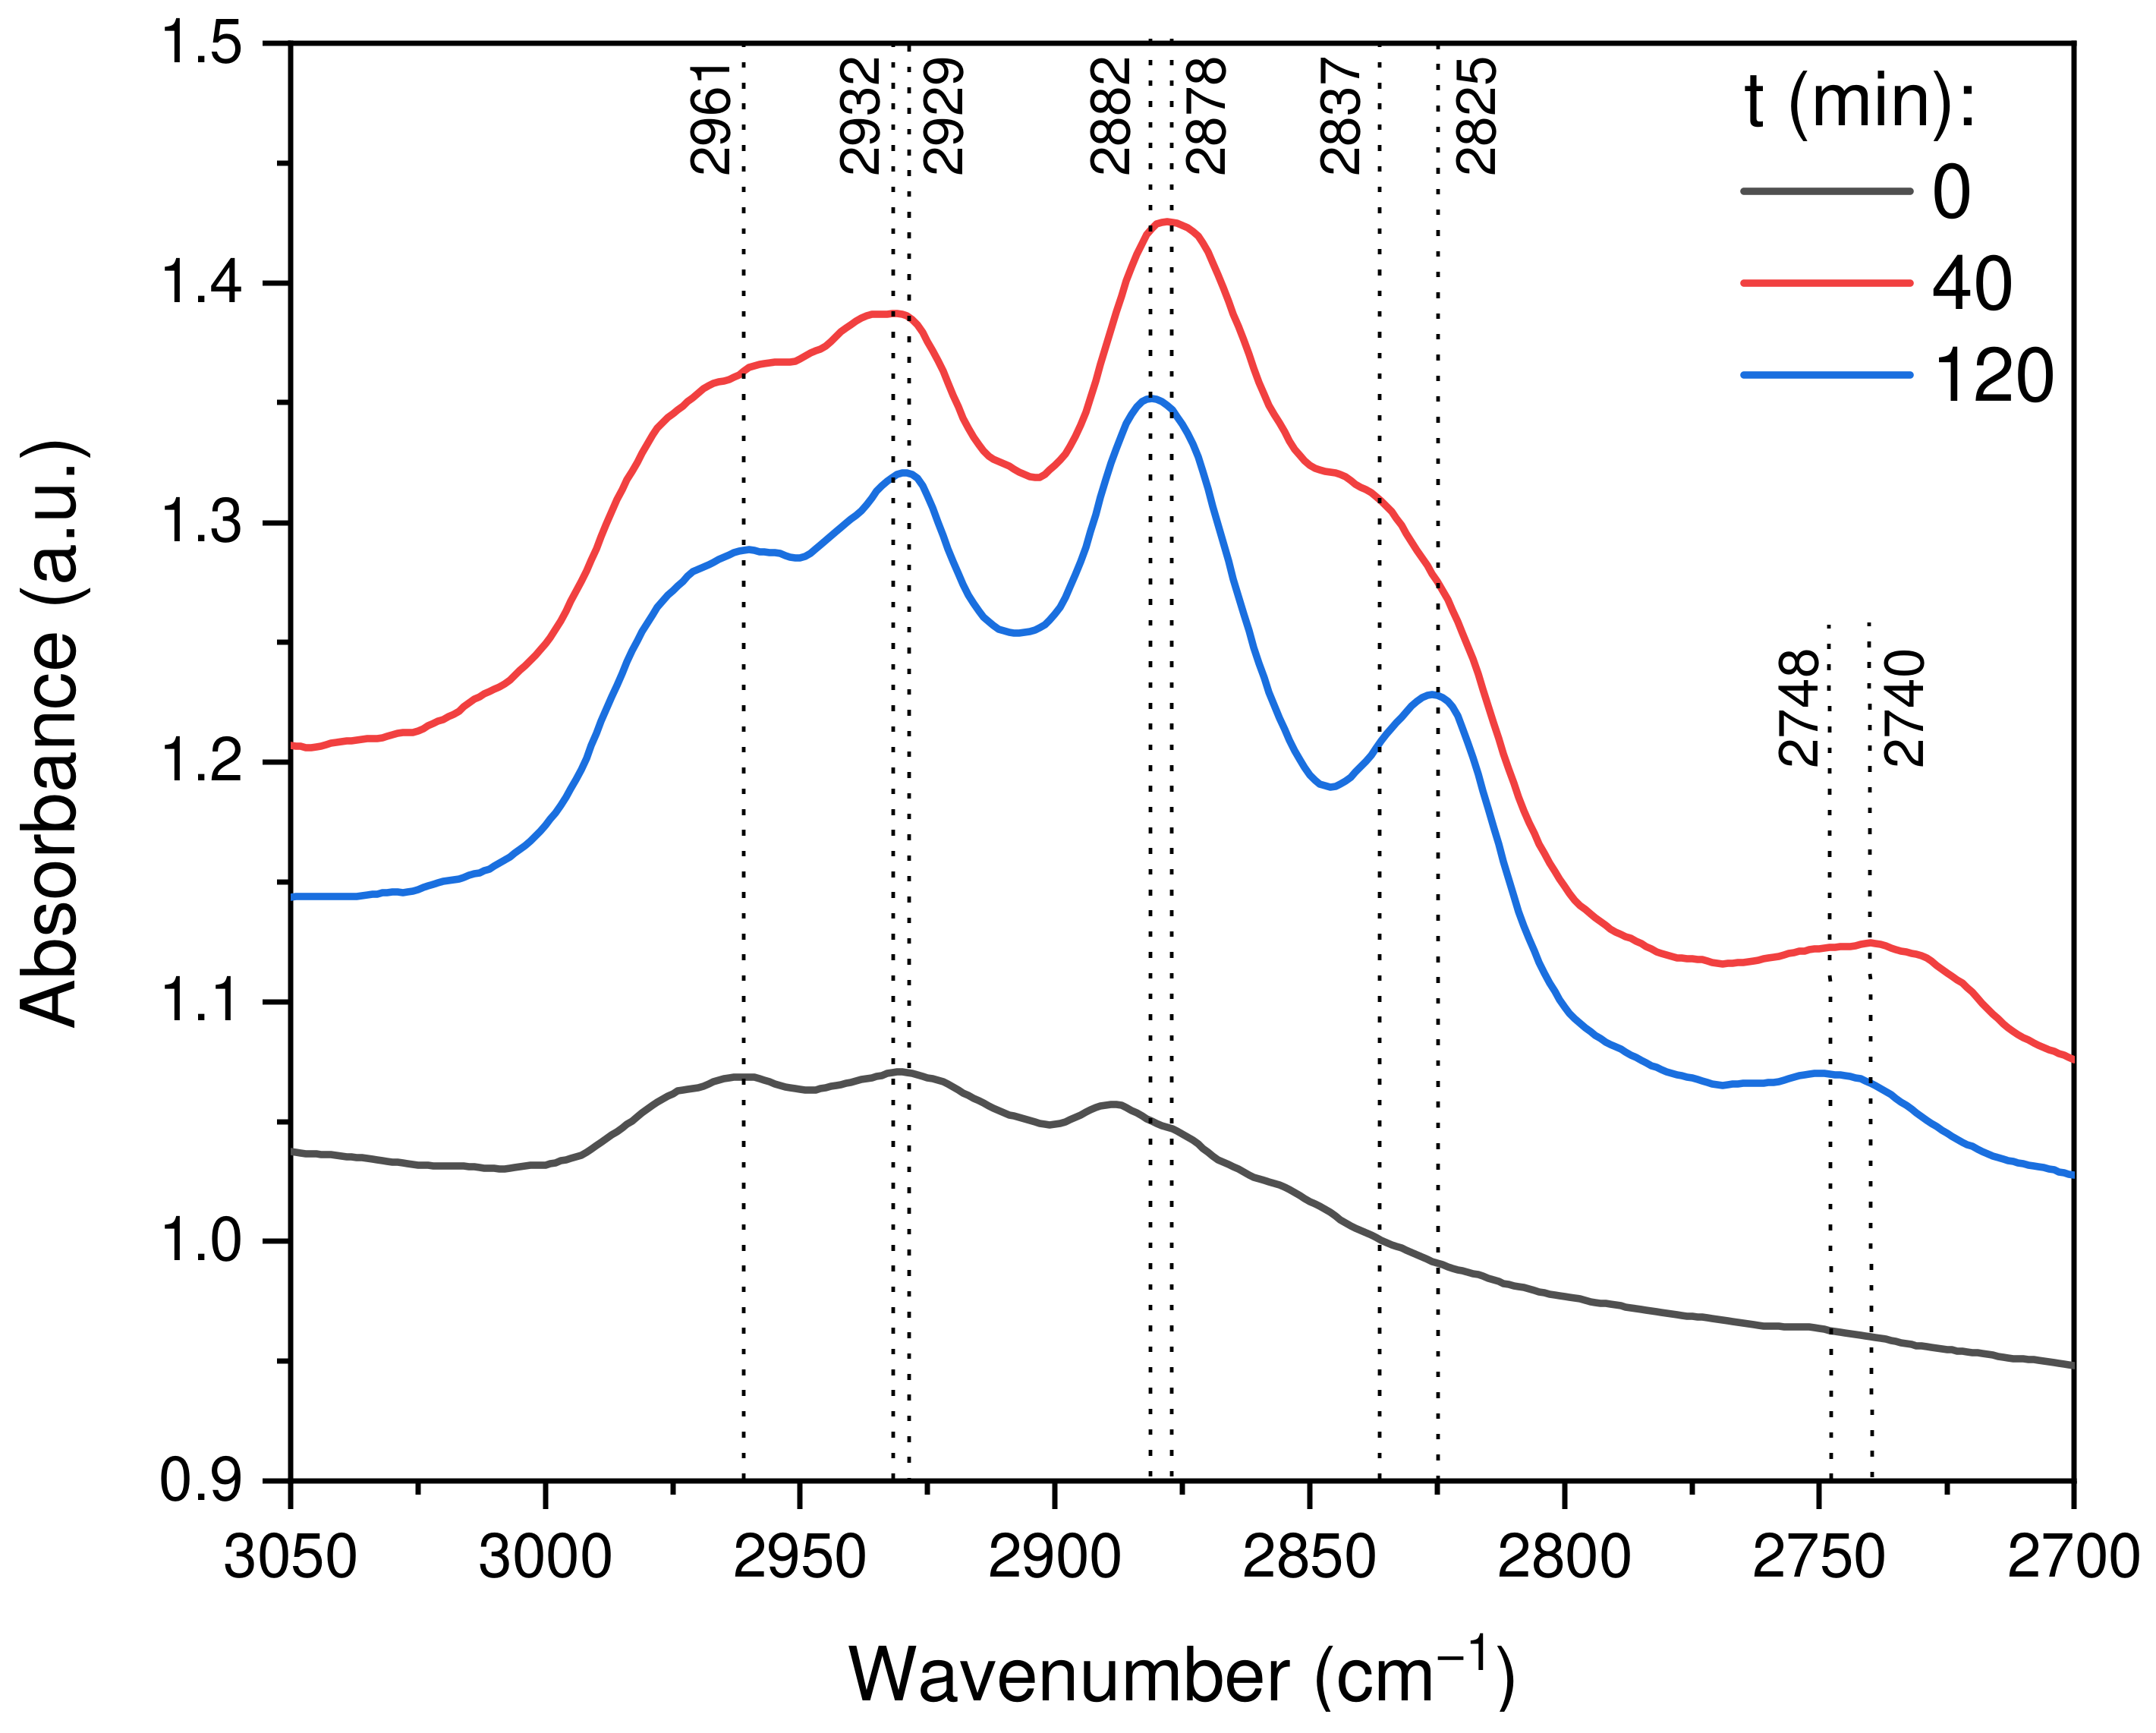
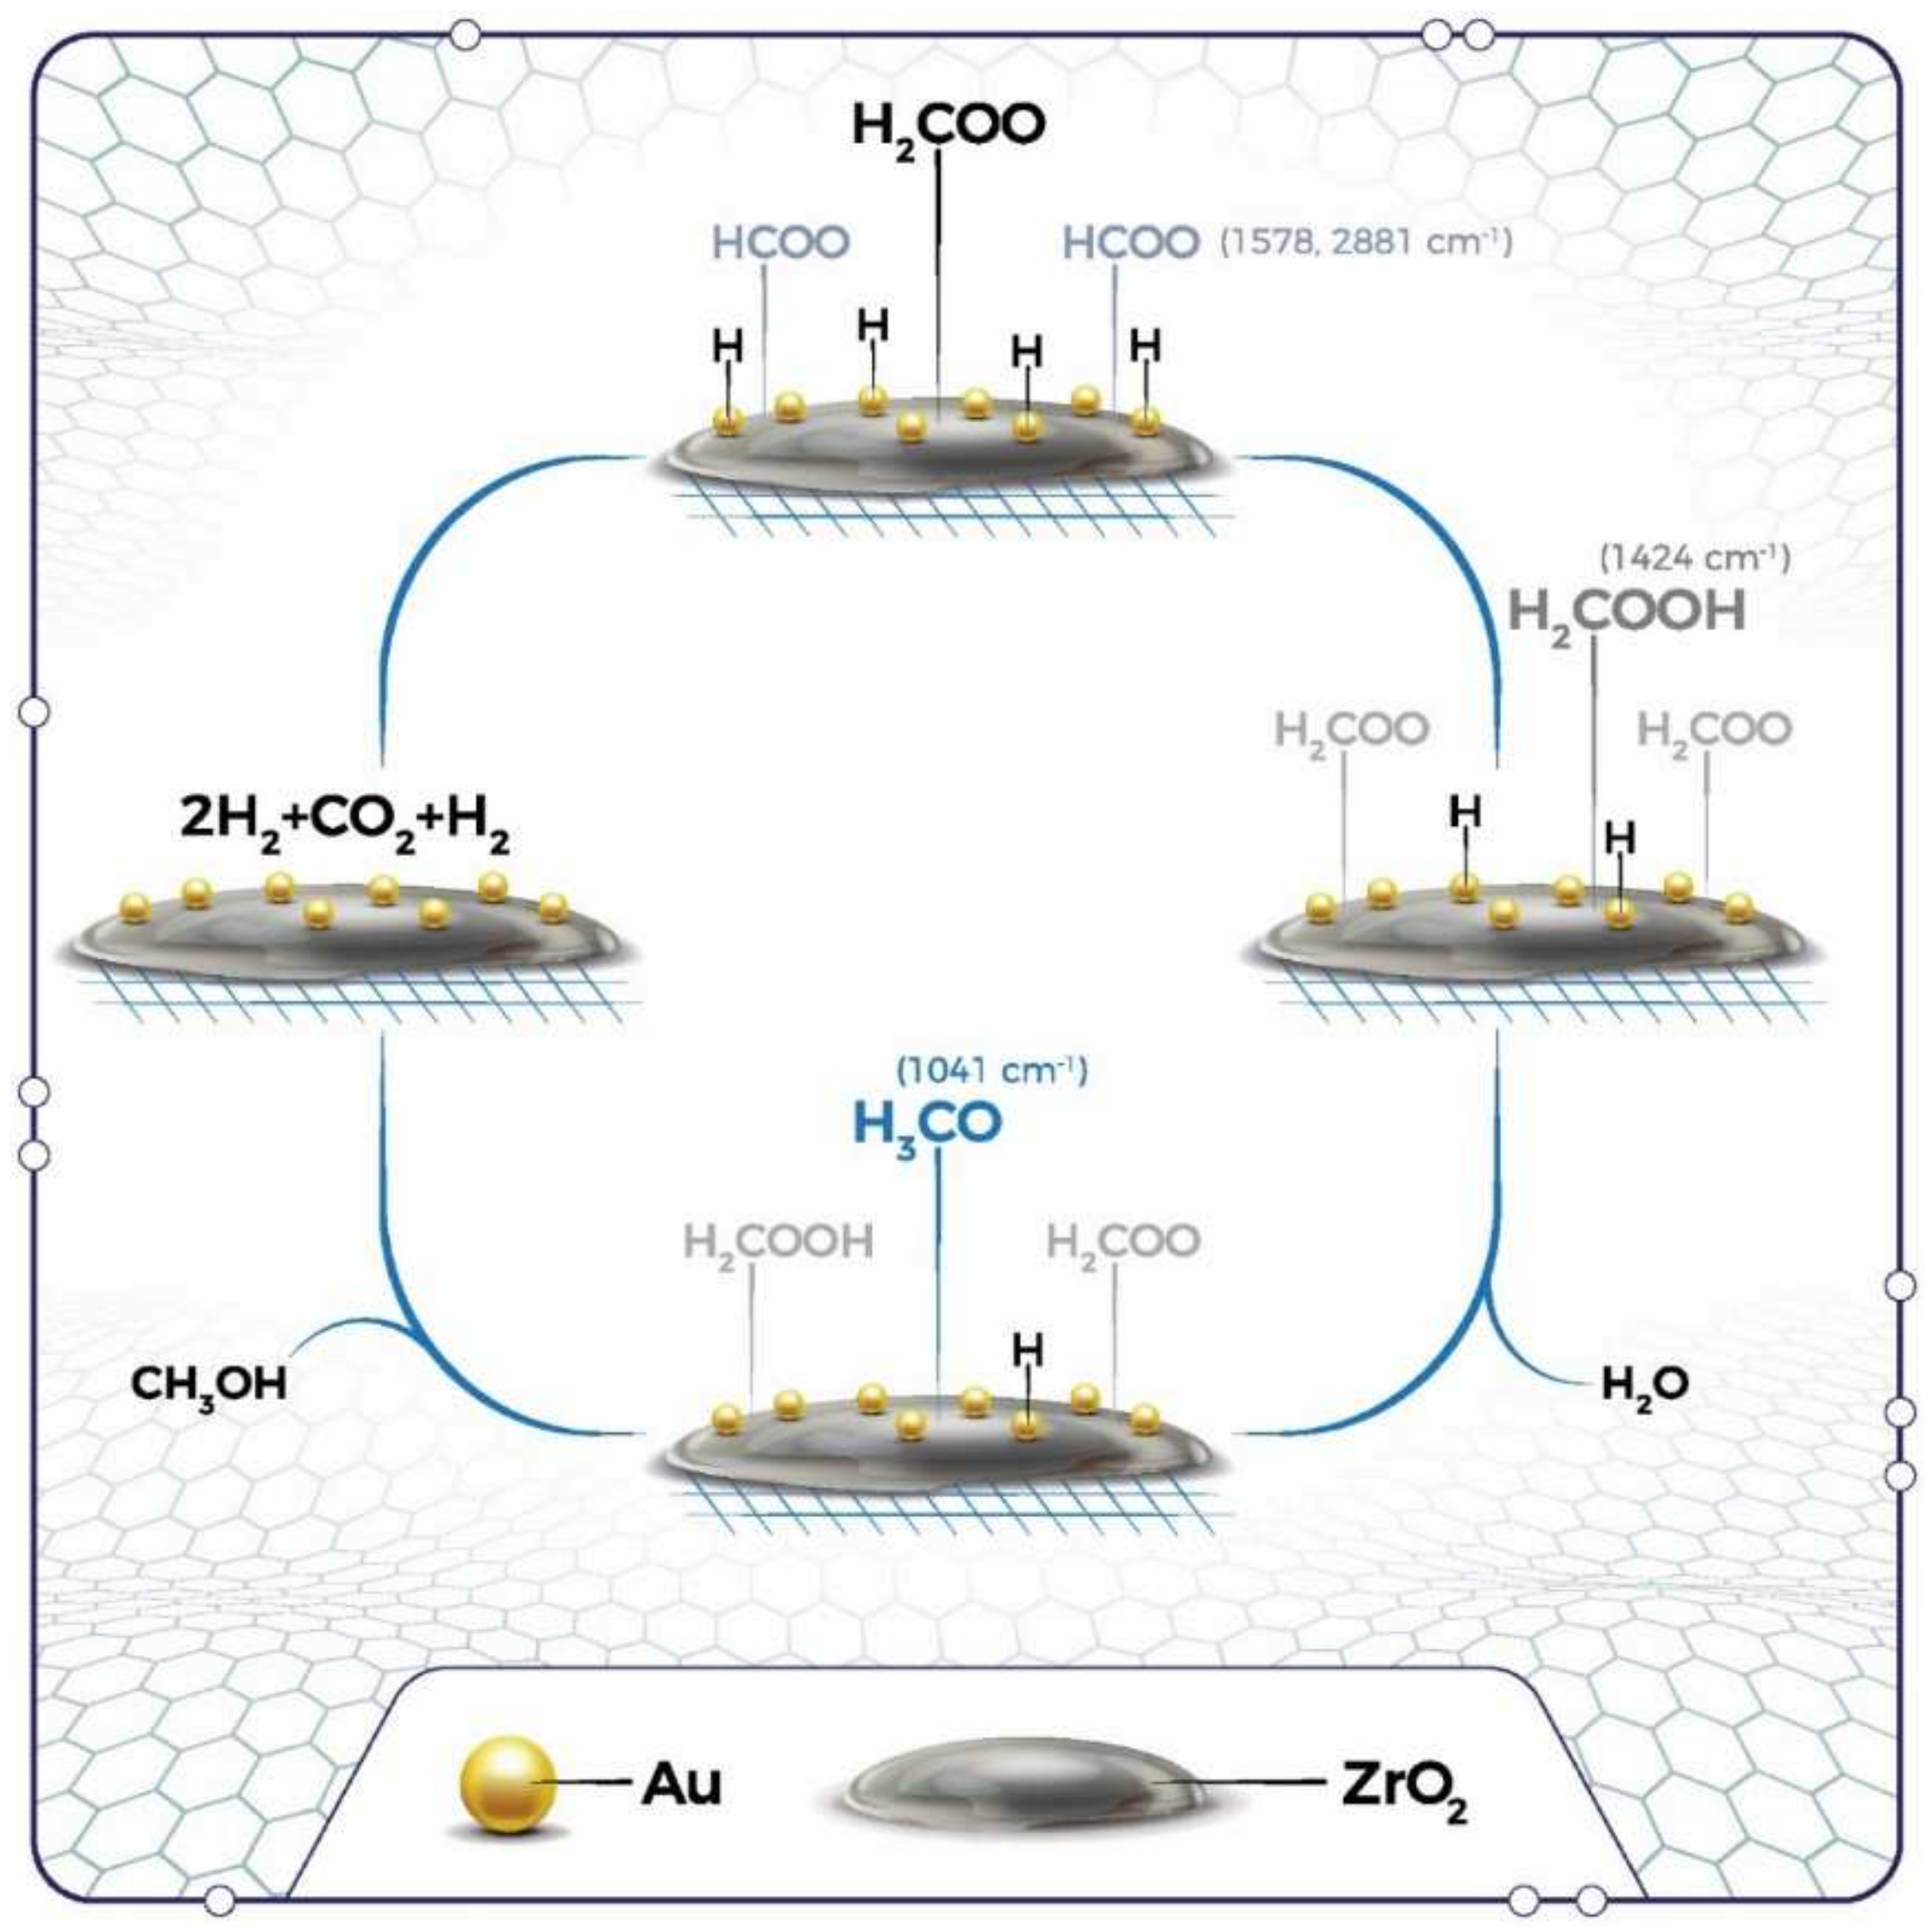
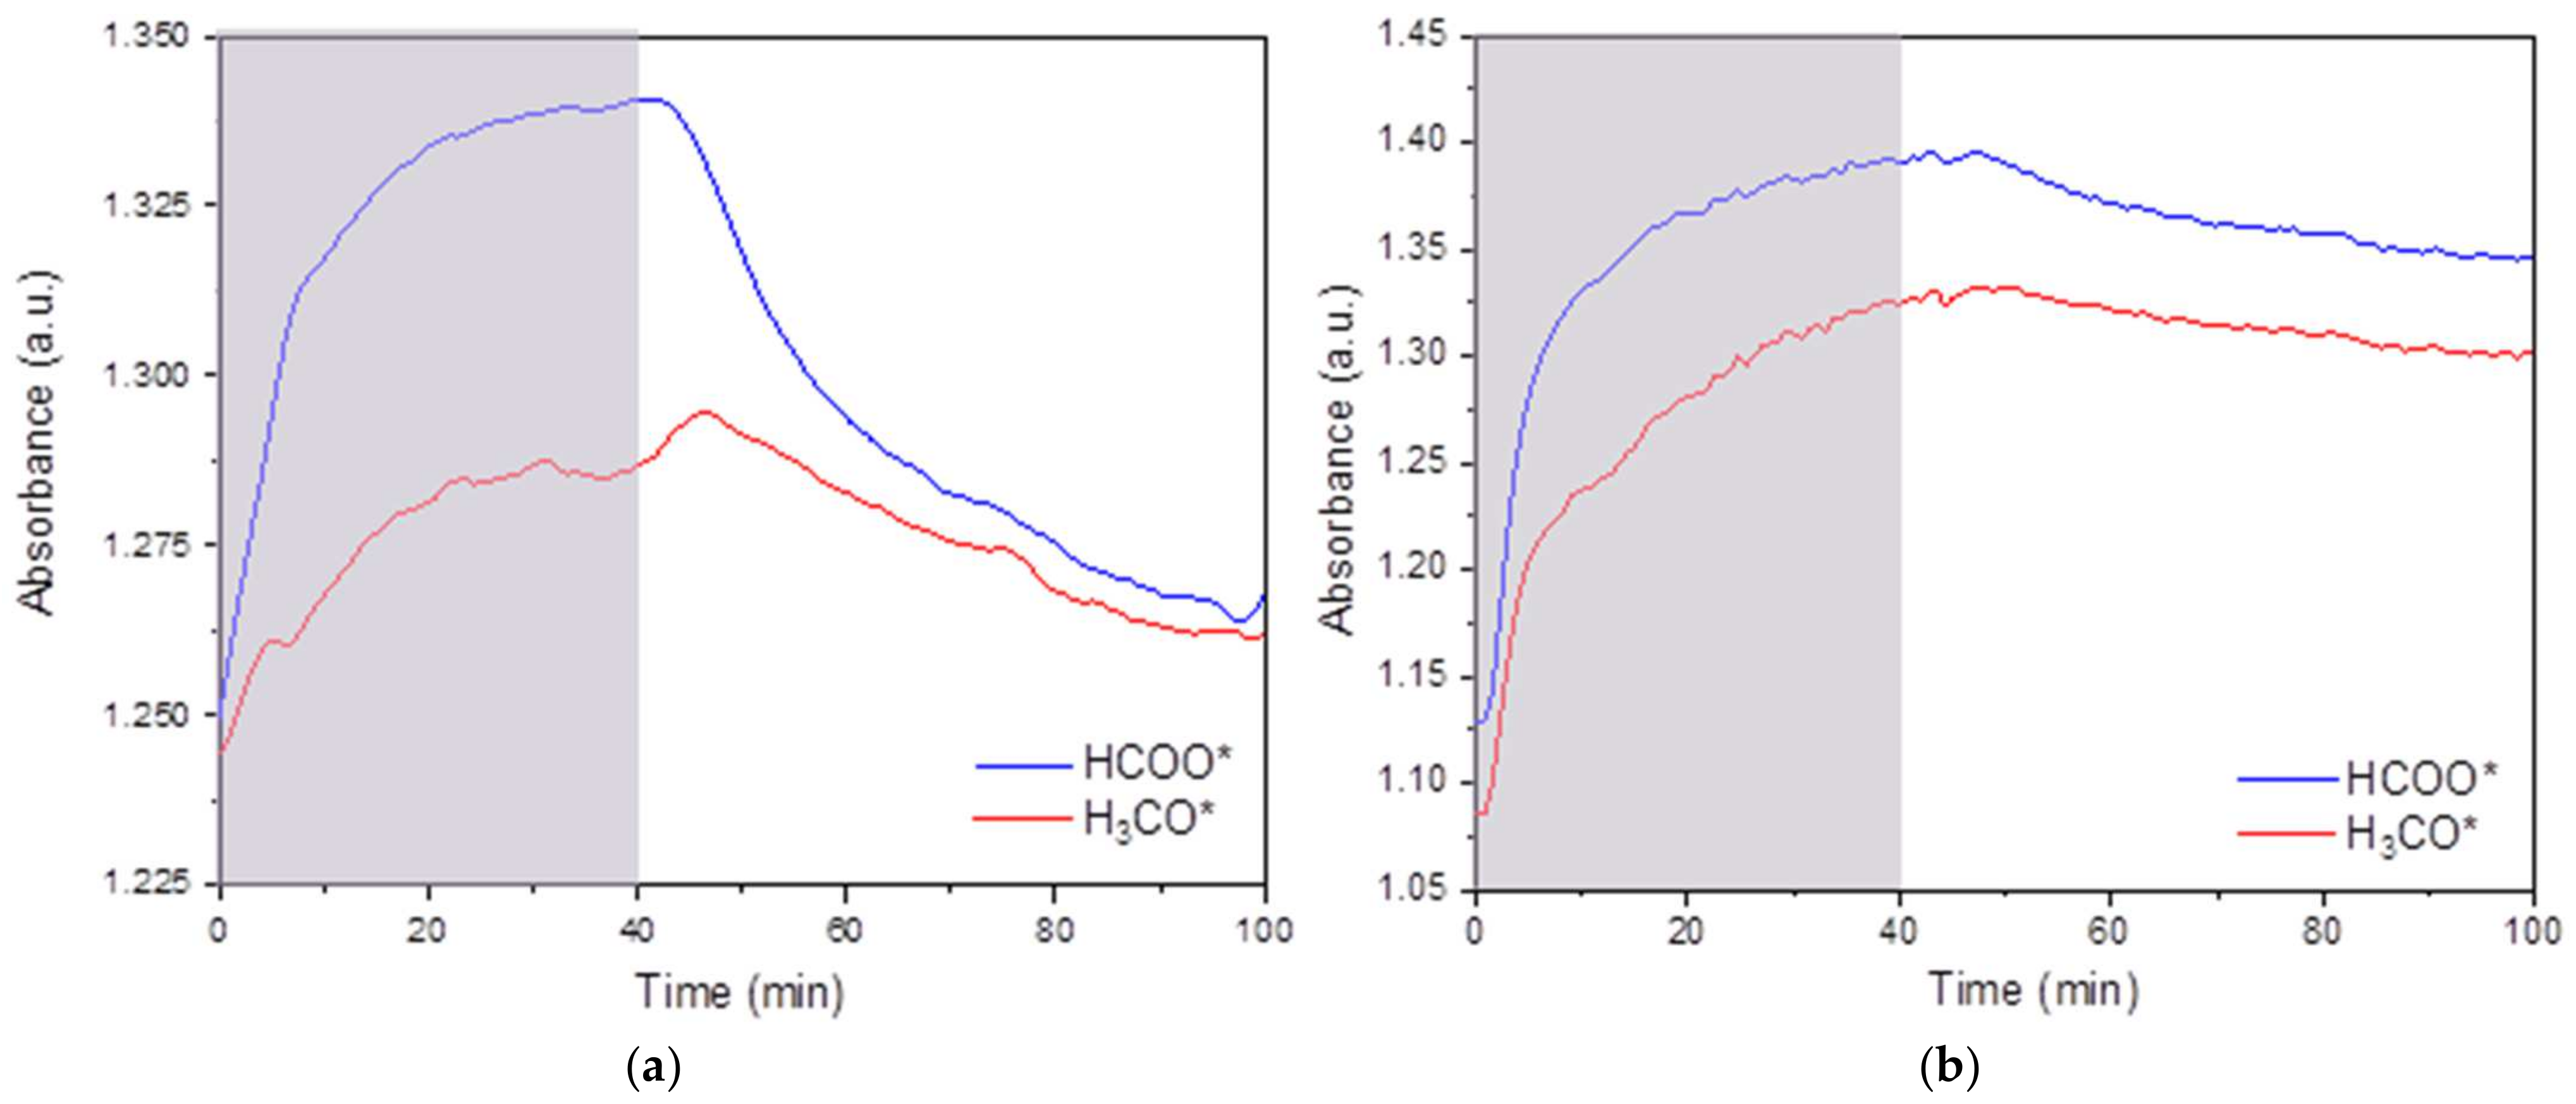
2.2.8. In Situ DRIFTS Analysis
2.2.9. CHNS Analysis of the Spent Catalysts
3. Experimental Section
3.1. Catalyst Synthesis
3.1.1. Synthesis of the ZrO2 Support
3.1.2. Au Deposition Precipitation on the ZrO2 Support
3.1.3. Au Impregnation on the ZrO2 Support
3.2. Catalyst Characterization
3.3. Activity Tests
4. Conclusions
Supplementary Materials
Author Contributions
Funding
Conflicts of Interest
References
- Rasteiro, L.F.; Rossi, M.A.; Assaf, J.M.; Assaf, E.M. Low-pressure hydrogenation of CO2 to methanol over Ni-Ga alloys synthesized by a surfactant-assisted co-precipitation method and a proposed mechanism by DRIFTS analysis. Catal. Today 2020, 381, 261–271. [Google Scholar] [CrossRef]
- Mallikarjun, G.; Sagar, T.; Swapna, S.; Raju, N.; Chandrashekar, P.; Lingaiah, N. Hydrogen rich syngas production by bi-reforming of methane with CO2 over Ni supported on CeO2-SrO mixed oxide catalysts. Catal. Today 2020, 356, 597–603. [Google Scholar] [CrossRef]
- Vessally, E.; Babazadeh, M.; Hosseinian, A.; Arshadi, S.; Edjlali, L. Nanocatalysts for chemical transformation of carbon dioxide. J. CO2 Util. 2017, 21, 491–502. [Google Scholar] [CrossRef]
- Sagar, T.V.; Padmakar, D.; Lingaiah, N.; Rao, K.S.R.; Reddy, I.A.K.; Prasad, P.S.S. Sai Prasad, Syngas production by CO2 reforming of methane on LaNixAl1−xO3 perovskite catalysts: Influence of method of preparation. J. Chem. Sci. 2017, 129, 1787–1794. [Google Scholar] [CrossRef]
- Strniša, F.; Sagar, V.T.; Djinović, P.; Pintar, A.; Plazl, I. Ni-containing CeO2 rods for dry reforming of methane: Activity tests and a multiscale lattice Boltzmann model analysis in two model geometries. Chem. Eng. J. 2021, 413, 127498. [Google Scholar] [CrossRef]
- Saeidi, S.; Amin, N.A.S.; Rahimpour, M.R. Hydrogenation of CO2 to value-added products—A review and potential future developments. J. CO2 Util. 2014, 5, 66–81. [Google Scholar] [CrossRef]
- Sagar, V.T.; Pintar, A. Enhanced surface properties of CeO2 by MnO doping and their role in mechanism of methane dry reforming deduced by means of in-situ DRIFTS. Appl. Catal. A Gen. 2020, 599, 117603. [Google Scholar] [CrossRef]
- Zhang, G.; Fan, G.; Yang, L.; Li, F. Tuning surface-interface structures of ZrO2 supported copper catalysts by in situ introduction of indium to promote CO2 hydrogenation to methanol. Appl. Catal. A Gen. 2020, 605, 117805. [Google Scholar] [CrossRef]
- Bai, S.-T.; De Smet, G.; Liao, Y.; Sun, R.; Zhou, C.; Beller, M.; Maes, B.U.W.; Sels, B.F. Homogeneous and heterogeneous catalysts for hydrogenation of CO2 to methanol under mild conditions. Chem. Soc. Rev. 2021, 50, 4259–4298. [Google Scholar] [CrossRef]
- Olah, G.A.; Goeppert, A.; Prakash, G.K.S. Beyond Oil and Gas: The Methanol Economy; Wiley: Los Angeles, CA, USA, 2009. [Google Scholar] [CrossRef]
- Zhen, X. Methanol As An Internal Combustion on Engine Fue. In Methanol; Elsevier: Amsterdam, The Netherlands, 2018; pp. 313–337. [Google Scholar] [CrossRef]
- Gaikwad, R.; Bansode, A.; Urakawa, A. High-pressure advantages in stoichiometric hydrogenation of carbon dioxide to methanol. J. Catal. 2016, 343, 127–132. [Google Scholar] [CrossRef] [Green Version]
- Bansode, A.; Urakawa, A. Towards full one-pass conversion of carbon dioxide to methanol and methanol-derived products. J. Catal. 2014, 309, 66–70. [Google Scholar] [CrossRef]
- Álvarez, A.; Bansode, A.; Urakawa, A.; Bavykina, A.V.; Wezendonk, T.A.; Makkee, M.; Gascon, J.; Kapteijn, F. Challenges in the Greener Production of Formates/Formic Acid, Methanol, and DME by Heterogeneously Catalyzed CO2 Hydrogenation Processes. Chem. Rev. 2017, 117, 9804–9838. [Google Scholar] [CrossRef] [PubMed]
- Han, Z.; Tang, C.; Sha, F.; Tang, S.; Wang, J.; Li, C. CO2 hydrogenation to methanol on ZnO-ZrO2 solid solution catalysts with ordered mesoporous structure. J. Catal. 2021, 396, 242–250. [Google Scholar] [CrossRef]
- Lu, Z.; Sun, K.; Wang, J.; Zhang, Z.; Liu, C. A Highly Active Au/In2O3-ZrO2 Catalyst for Selective Hydrogenation of CO2 to Methanol. Catalysts 2020, 10, 1360. [Google Scholar] [CrossRef]
- Dong, X.; Li, F.; Zhao, N.; Xiao, F.; Wang, J.; Tan, Y. CO2 hydrogenation to methanol over Cu/ZnO/ZrO2 catalysts prepared by precipitation-reduction method. Appl. Catal. B Environ. 2016, 191, 8–17. [Google Scholar] [CrossRef]
- Wang, Y.H.; Gao, W.G.; Wang, H.; Zheng, Y.E.; Na, W.; Li, K.Z. Structure–activity relationships of Cu–ZrO2 catalysts for CO2 hydrogenation to methanol: Interaction effects and reaction mechanism. RSC Adv. 2017, 7, 8709–8717. [Google Scholar] [CrossRef] [Green Version]
- Gao, J.; Song, F.; Li, Y.; Cheng, W.; Yuan, H.; Xu, Q. Cu2 In Nanoalloy Enhanced Performance of Cu/ZrO2 Catalysts for the CO2 Hydrogenation to Methanol. Ind. Eng. Chem. Res. 2020, 59, 12331–12337. [Google Scholar] [CrossRef]
- Wang, W.; Qu, Z.; Song, L.; Fu, Q. CO2 hydrogenation to methanol over Cu/CeO2 and Cu/ZrO2 catalysts: Tuning methanol selectivity via metal-support interaction. J. Energy Chem. 2020, 40, 22–30. [Google Scholar] [CrossRef] [Green Version]
- Xiao, J.; Mao, D.; Guo, X.; Yu, J. Methanol Synthesis from CO2 Hydrogenation over CuO-ZnO-TiO2 Catalysts: The Influence of TiO2 Content. Energy Technol. 2015, 3, 32–39. [Google Scholar] [CrossRef]
- Jadhav, S.G.; Vaidya, P.D.; Bhanage, B.; Joshi, J.B. Catalytic carbon dioxide hydrogenation to methanol: A review of recent studies. Chem. Eng. Res. Des. 2014, 92, 2557–2567. [Google Scholar] [CrossRef]
- Wang, W.; Wang, S.; Ma, X.; Gong, J. Recent advances in catalytic hydrogenation of carbon dioxide. Chem. Soc. Rev. 2011, 40, 3703–3727. [Google Scholar] [CrossRef] [PubMed] [Green Version]
- Wu, C.; Zhang, P.; Zhang, Z.; Zhang, L.; Yang, G.; Han, B. Efficient Hydrogenation of CO2 to Methanol over Supported Subnanometer Gold Catalysts at Low Temperature. ChemCatChem 2017, 9, 3691–3696. [Google Scholar] [CrossRef]
- Słoczyński, J.; Grabowski, R.; Kozłowska, A.; Olszewski, P.; Stoch, J.; Skrzypek, J.; Lachowska, M. Catalytic activity of the M/(3ZnO·ZrO2) system (M = Cu, Ag, Au) in the hydrogenation of CO2 to methanol. Appl. Catal. A Gen. 2004, 278, 11–23. [Google Scholar] [CrossRef]
- Yang, X.; Kattel, S.; Senanayake, S.; Boscoboinik, J.A.; Nie, X.; Graciani, J.; Rodriguez, J.A.; Liu, P.; Stacchiola, D.; Chen, J.G. Low Pressure CO2 Hydrogenation to Methanol over Gold Nanoparticles Activated on a CeOx/TiO2 Interface. J. Am. Chem. Soc. 2015, 137, 10104–10107. [Google Scholar] [CrossRef] [PubMed]
- Rui, N.; Zhang, F.; Sun, K.; Liu, Z.; Xu, W.; Stavitski, E.; Senanayake, S.D.; Rodriguez, J.A.; Liu, C.-J. Hydrogenation of CO2 to Methanol on a Auδ+-In2O3−x Catalyst. ACS Catal. 2020, 10, 11307–11317. [Google Scholar] [CrossRef]
- Stenlid, J.H.; Brinck, T. Extending the σ-Hole Concept to Metals: An Electrostatic Interpretation of the Effects of Nanostructure in Gold and Platinum Catalysis. J. Am. Chem. Soc. 2017, 139, 11012–11015. [Google Scholar] [CrossRef]
- Hartadi, Y.; Widmann, D.; Behm, R.J. CO2 Hydrogenation to Methanol on Supported Au Catalysts under Moderate Reaction Conditions: Support and Particle Size Effects. ChemSusChem 2015, 8, 456–465. [Google Scholar] [CrossRef]
- Chen, S.; Abdel-Mageed, A.M.; Mochizuki, C.; Ishida, T.; Murayama, T.; Rabeah, J.; Parlinska-Wojtan, M.; Brückner, A.; Behm, R.J. Controlling the O-Vacancy Formation and Performance of Au/ZnO Catalysts in CO2 Reduction to Methanol by the ZnO Particle Size. ACS Catal. 2021, 11, 9022–9033. [Google Scholar] [CrossRef]
- Posada-Pérez, S.; Ramírez, P.J.; Evans, J.; Viñes, F.; Liu, P.; Illas, F.; Rodriguez, J.A. Highly Active Au/δ-MoC and Cu/δ-MoC Catalysts for the Conversion of CO2: The Metal/C Ratio as a Key Factor Defining Activity, Selectivity, and Stability. J. Am. Chem. Soc. 2016, 138, 8269–8278. [Google Scholar] [CrossRef] [Green Version]
- Li, Y.; Na, W.; Wang, H.; Gao, W. Hydrogenation of CO2 to methanol over Au–CuO/SBA-15 catalysts. J. Porous Mater. 2017, 24, 591–599. [Google Scholar] [CrossRef]
- Vidal, A.B.; Feria, L.; Evans, J.; Takahashi, Y.; Liu, P.; Nakamura, K.; Illas, F.; Rodriguez, J.A. CO2 Activation and Methanol Synthesis on Novel Au/TiC and Cu/TiC Catalysts. J. Phys. Chem. Lett. 2012, 3, 2275–2280. [Google Scholar] [CrossRef]
- Jiang, X.; Nie, X.; Guo, X.; Song, C.; Chen, J.G. Recent Advances in Carbon Dioxide Hydrogenation to Methanol via Heterogeneous Catalysis. Chem. Rev. 2020, 120, 7984–8034. [Google Scholar] [CrossRef]
- Wu, C.; Cheng, D.; Wang, M.; Ma, D. Understanding and Application of Strong Metal–Support Interactions in Conversion of CO2 to Methanol: A Review. Energy Fuels 2021, 35, 19012–19023. [Google Scholar] [CrossRef]
- Rodriguez, J.A. Activation of Gold on Metal Carbides: Novel Catalysts for C1 Chemistry. Front. Chem. 2020, 7, 875. [Google Scholar] [CrossRef] [PubMed] [Green Version]
- Rezvani, A.; Abdel-Mageed, A.M.; Ishida, T.; Murayama, T.; Parlinska-Wojtan, M.; Behm, R.J. CO2 Reduction to Methanol on Au/CeO2 Catalysts: Mechanistic Insights from Activation/Deactivation and SSITKA Measurements. ACS Catal. 2020, 10, 3580–3594. [Google Scholar] [CrossRef]
- Vourros, A.; Garagounis, I.; Kyriakou, V.; Carabineiro, S.A.C.; Maldonado-Hódar, F.J.; Marnellos, G.E.; Konsolakis, M. Carbon dioxide hydrogenation over supported Au nanoparticles: Effect of the support. J. CO2 Util. 2017, 19, 247–256. [Google Scholar] [CrossRef]
- Rodriguez, J.A.; Evans, J.; Feria, L.; Vidal, A.B.; Liu, P.; Nakamura, K.; Illas, F. CO2 hydrogenation on Au/TiC, Cu/TiC, and Ni/TiC catalysts: Production of CO, methanol, and methane. J. Catal. 2013, 307, 162–169. [Google Scholar] [CrossRef]
- Wang, J.; Li, G.; Li, Z.; Tang, C.; Feng, Z.; An, H.; Liu, H.; Liu, T.; Li, C. A highly selective and stable ZnO-ZrO2 solid solution catalyst for CO2 hydrogenation to methanol. Sci. Adv. 2017, 3, e1701290. [Google Scholar] [CrossRef] [Green Version]
- Abdel-Mageed, A.M.; Klyushin, A.Y.; Knop-Gericke, A.; Schlögl, R.; Behm, R.J. Influence of CO on the Activation, O-Vacancy Formation, and Performance of Au/ZnO Catalysts in CO2 Hydrogenation to Methanol. J. Phys. Chem. Lett. 2019, 10, 3645–3653. [Google Scholar] [CrossRef]
- Li, K.; Chen, J.G. CO2 Hydrogenation to Methanol over ZrO2-Containing Catalysts: Insights into ZrO2 Induced Synergy. ACS Catal. 2019, 9, 7840–7861. [Google Scholar] [CrossRef]
- Alothman, Z.A. A Review: Fundamental Aspects of Silicate Mesoporous Materials. Materials 2012, 5, 2874–2902. [Google Scholar] [CrossRef] [Green Version]
- Rushton, M.J.D.; Ipatova, I.; Evitts, L.J.; Lee, W.E.; Middleburgh, S.C. Stoichiometry deviation in amorphous zirconium dioxide. RSC Adv. 2019, 9, 16320–16327. [Google Scholar] [CrossRef] [Green Version]
- Zhang, X.; Zhang, M.; Zhang, J.; Zhang, Q.; Tsubaki, N.; Tan, Y.; Han, Y. Methane decomposition and carbon deposition over Ni/ZrO2 catalysts: Comparison of amorphous, tetragonal, and monoclinic zirconia phase. Int. J. Hydrog. Energy 2019, 44, 17887–17899. [Google Scholar] [CrossRef]
- Horti, N.C.; Kamatagi, M.D.; Nataraj, S.K.; Wari, M.N.; Inamdar, S.R. Structural and optical properties of zirconium oxide (ZrO2) nanoparticles: Effect of calcination temperature. Nano Express 2020, 1, 010022. [Google Scholar] [CrossRef]
- Ambrosi, M.; Fratini, E.; Canton, P.; Dankesreiter, S.; Baglioni, P. Bottom-up/top-down synthesis of stable zirconium hydroxide nanophases. J. Mater. Chem. 2012, 22, 23497–23505. [Google Scholar] [CrossRef] [Green Version]
- Padovini, D.S.S.; Pontes, D.S.L.; Dalmaschio, C.J.; Pontes, F.M.; Longo, E. Facile synthesis and characterization of ZrO2 nanoparticles prepared by the AOP/hydrothermal route. RSC Adv. 2014, 4, 38484–38490. [Google Scholar] [CrossRef]
- Zhang, M.; Yang, K.; Wang, N.; Yu, Y. Combined DFT and experimental studies of properties of TiO2 modified USY zeolite. J. Porous Mater. 2015, 22, 595–602. [Google Scholar] [CrossRef]
- Blanco-Sánchez, M.; Pfab, E.; Lázaro, N.; Balu, A.M.; Luque, R.; Pineda, A. Tuneable Acidity in Fluorinated Al-SBA-15 Materials for the Esterification of Valeric Acid to Alkyl Valerates. Front. Chem. 2020, 8, 42. [Google Scholar] [CrossRef] [Green Version]
- Selli, E.; Forni, L. Comparison between the surface acidity of solid catalysts determined by TPD and FTIR analysis of pre-adsorbed pyridine. Microporous Mesoporous Mater. 1999, 31, 129–140. [Google Scholar] [CrossRef]
- Wu, J.; Liu, H.-J.; Yan, X.; Zhou, Y.-J.; Lin, Z.-N.; Mi, S.; Cheng, K.-K.; Zhang, J.-A. Efficient catalytic dehydration of high-concentration 1-butanol with Zn-Mn-Co modified γ-Al2O3 in jet fuel production. Catalysts 2019, 9, 93. [Google Scholar] [CrossRef] [Green Version]
- Bai, Y.; Cherkasov, N.; Huband, S.; Walker, D.; Walton, R.I.; Rebrov, E. Highly Selective Continuous Flow Hydrogenation of Cinnamaldehyde to Cinnamyl Alcohol in a Pt/SiO2 Coated Tube Reactor. Catalysts 2018, 8, 58. [Google Scholar] [CrossRef] [Green Version]
- Witoon, T.; Chalorngtham, J.; Dumrongbunditkul, P.; Chareonpanich, M.; Limtrakul, J. CO2 hydrogenation to methanol over Cu/ZrO2 catalysts: Effects of zirconia phases. Chem. Eng. J. 2016, 293, 327–336. [Google Scholar] [CrossRef]
- Guo, X.; Mao, D.; Lu, G.; Wang, S.; Wu, G. The influence of La doping on the catalytic behavior of Cu/ZrO2 for methanol synthesis from CO2 hydrogenation. J. Mol. Catal. A Chem. 2011, 345, 60–68. [Google Scholar] [CrossRef]
- Yu, G.; Zhu, L.; Wang, X.; Liu, J.; Xu, D. Fabrication of silica-supported ZrO2 mesoporous fibers with high thermal stability by sol–gel method through a controlled hydrolysis–condensation process. Microporous Mesoporous Mater. 2010, 130, 189–196. [Google Scholar] [CrossRef]
- Kanade, K.; Baeg, J.; Apte, S.; Prakash, T.; Kale, B. Synthesis and characterization of nanocrystallined zirconia by hydrothermal method. Mater. Res. Bull. 2008, 43, 723–729. [Google Scholar] [CrossRef]
- Hernández-Ramírez, E.; Wang, J.; Chen, L.; Valenzuela, M.; Dalai, A. Partial oxidation of methanol catalyzed with Au/TiO2, Au/ZrO2 and Au/ZrO2-TiO2 catalysts. Appl. Surf. Sci. 2017, 399, 77–85. [Google Scholar] [CrossRef]
- Margitfalvi, J.; Fási, A.; Hegedűs, M.; Lónyi, F.; Gőbölös, S.; Bogdanchikova, N. Au/MgO catalysts modified with ascorbic acid for low temperature CO oxidation. Catal. Today 2002, 72, 157–169. [Google Scholar] [CrossRef]
- Wang, X.; Shi, H.; Kwak, J.H.; Szanyi, J. Mechanism of CO2 Hydrogenation on Pd/Al2O3 Catalysts: Kinetics and Transient DRIFTS-MS Studies. ACS Catal. 2015, 5, 6337–6349. [Google Scholar] [CrossRef]
- Kim, J.; Sarma, B.B.; Andrés, E.; Pfänder, N.; Concepción, P.; Prieto, G. Surface Lewis Acidity of Periphery Oxide Species as a General Kinetic Descriptor for CO2 Hydrogenation to Methanol on Supported Copper Nanoparticles. ACS Catal. 2019, 9, 10409–10417. [Google Scholar] [CrossRef] [Green Version]
- Ma, C.; Yang, C.; Wang, B.; Chen, C.; Wang, F.; Yao, X.; Song, M. Effects of H2O on HCHO and CO oxidation at room-temperature catalyzed by MCo2O4 (M = Mn, Ce and Cu) materials. Appl. Catal. B Environ. 2019, 254, 76–85. [Google Scholar] [CrossRef]
- Abdel-Mageed, A.M.; Klyushin, A.; Rezvani, M.S.A.; Knop-Gericke, A.; Schlögl, R.; Behm, R.J. Negative Charging of Au Nanoparticles during Methanol Synthesis from CO2/H2 on a Au/ZnO Catalyst: Insights from Operando IR and Near-Ambient-Pressure XPS and XAS Measurements. Angew. Chem. Int. Ed. 2019, 58, 10325–10329. [Google Scholar] [CrossRef] [PubMed]
- Liu, X.; Liu, M.-H.; Luo, Y.-C.; Mou, C.-Y.; Lin, S.D.; Cheng, H.; Chen, J.-M.; Lee, J.-F.; Lin, T.-S. Strong Metal–Support Interactions between Gold Nanoparticles and ZnO Nanorods in CO Oxidation. J. Am. Chem. Soc. 2012, 134, 10251–10258. [Google Scholar] [CrossRef] [PubMed]
- Mitsudome, T.; Urayama, T.; Fujita, S.; Maeno, Z.; Mizugaki, T.; Jitsukawa, K.; Kaneda, K. A Titanium Dioxide Supported Gold Nanoparticle Catalyst for the Selective N-Formylation of Functionalized Amines with Carbon Dioxide and Hydrogen. ChemCatChem 2017, 9, 3632–3636. [Google Scholar] [CrossRef]
- Fujitani, T.; Nakamura, I.; Akita, T.; Okumura, M.; Haruta, M. Hydrogen Dissociation by Gold Clusters. Angew. Chem. Int. Ed. 2009, 48, 9515–9518. [Google Scholar] [CrossRef]
- Fisher, I.A.; Bell, A. In-SituInfrared Study of Methanol Synthesis from H2/CO2 over Cu/SiO2 and Cu/ZrO2/SiO2. J. Catal. 1997, 172, 222–237. [Google Scholar] [CrossRef]


| Catalyst | SSA (m2/g) | Total Pore Volume (cm3/g) | Average Pore Diameter (Å) | Au Content (wt.%) |
|---|---|---|---|---|
| ZrO2 | 187 | 0.115 | 22.5 | - |
| 1 Au/ZrO2 DP | 166 | 0.105 | 25.2 | 0.96 |
| 0.5 Au/ZrO2 DP | 168 | 0.110 | 26.2 | 0.49 |
| 0.5 Au/ZrO2 IMP | 122 | 0.072 | 23.4 | 0.52 |
| Catalyst | Total Acidity (µmol/g) | Total Basicity (µmol/g) | γ Peak Area (a.u.) |
|---|---|---|---|
| ZrO2 | 0.2571 | 47.02 | 33.69 |
| 1 Au/ZrO2 DP | 0.1528 | 62.67 | 45.29 |
| 0.5 Au/ZrO2 DP | 0.1221 | 63.96 | 43.39 |
| 0.5 Au/ZrO2 IMP | 0.1737 | 38.12 | 29.80 |
| Catalyst | d (nm) | Carbon Content (wt.%) |
|---|---|---|
| 1 Au/ZrO2 DP | 10.8 | 1.17 |
| 0.5 Au/ZrO2 DP | 1.1 | 0.59 |
| 0.5 Au/ZrO2 IMP | 50.1 | 0.92 |
Publisher’s Note: MDPI stays neutral with regard to jurisdictional claims in published maps and institutional affiliations. |
© 2022 by the authors. Licensee MDPI, Basel, Switzerland. This article is an open access article distributed under the terms and conditions of the Creative Commons Attribution (CC BY) license (https://creativecommons.org/licenses/by/4.0/).
Share and Cite
Sagar, T.V.; Zavašnik, J.; Finšgar, M.; Novak Tušar, N.; Pintar, A. Evaluation of Au/ZrO2 Catalysts Prepared via Postsynthesis Methods in CO2 Hydrogenation to Methanol. Catalysts 2022, 12, 218. https://0-doi-org.brum.beds.ac.uk/10.3390/catal12020218
Sagar TV, Zavašnik J, Finšgar M, Novak Tušar N, Pintar A. Evaluation of Au/ZrO2 Catalysts Prepared via Postsynthesis Methods in CO2 Hydrogenation to Methanol. Catalysts. 2022; 12(2):218. https://0-doi-org.brum.beds.ac.uk/10.3390/catal12020218
Chicago/Turabian StyleSagar, Tatiparthi Vikram, Janez Zavašnik, Matjaž Finšgar, Nataša Novak Tušar, and Albin Pintar. 2022. "Evaluation of Au/ZrO2 Catalysts Prepared via Postsynthesis Methods in CO2 Hydrogenation to Methanol" Catalysts 12, no. 2: 218. https://0-doi-org.brum.beds.ac.uk/10.3390/catal12020218