Article

Effects of Soil Surface Chemistry on Adsorption and Activity of Urease from a Crude Protein Extract: Implications for Biocementation Applications

1
Department of Civil, Construction and Environmental Engineering, Iowa State University, Ames, IA 50011, USA
2
Interdepartmental Environmental Science Program, Iowa State University, Ames, IA 50011, USA
3
Interdepartmental Microbiology Program, Iowa State University, Ames, IA 50011, USA
*
Author to whom correspondence should be addressed.
Submission received: 12 January 2022 / Revised: 14 February 2022 / Accepted: 16 February 2022 / Published: 18 February 2022
(This article belongs to the Special Issue Enzymes and Biocatalysis)

Abstract

:
In the bacterial enzyme-induced calcite precipitation (BEICP) technique for biocementation, the spatial distribution of adsorbed and catalytically active urease dictates the location where calcium carbonate precipitation and resulting cementation will occur. This study investigated the relationships between the amount of urease and total bacterial proteins adsorbed, the retained enzymatic activity of adsorbed urease, and the overall loss of activity upon adsorption, and how these relationships are influenced by changes in soil surface chemistry. In soils with hydrophobic contents higher than 20% (w/w) ratio, urease was preferentially adsorbed compared to the total amount of proteins present in the crude bacterial protein extract. Conversely, adsorption of urease onto silica sand and soil mixtures, including iron-coated sand, was much lower compared to the total proteins. Higher levels of urease activity were retained in hydrophobic-containing samples, with urease activity decreasing with lower hydrophobic content. These observations suggest that the surface manipulation of soils, such as treatments to add hydrophobicity to soil surfaces, can potentially be used to increase the activity of adsorbed urease to improve biocementation outcomes.

1. Introduction

Biocementation is a sustainable engineering technique that has received significant attention as an environmentally friendly alternative to chemical stabilization methods for soils [1,2,3,4,5]. Chemical stabilization poses significant harm to the environment, mainly because it utilizes materials that are major contributors to greenhouse gas emissions, such as cement, fly ash, lime, and the leaching of toxic contaminants into the environment [5,6,7,8]. Instead, biocementation is based on the generation of calcium carbonate precipitates from urea hydrolysis, a chemical reaction that is only feasible when catalyzed by the urease enzyme [9]. Biocementation methods consist of an injection of a mixture containing urea, calcium, and the catalyst urease into the soil. Urease can be added in the form of whole bacterial cells, crude extracts, or purified proteins. The generated calcium carbonate deposits between the soil grains bridge them like a cement, which then leads to a stronger soil matrix [10].
Biocementation via the enzyme-induced calcite precipitation (EICP) technique uses purified urease enzymes, mostly from the jack bean plant, and it has proven to be an effective technique to increase soil strength [11,12,13,14]. However, enzyme extraction from plants is a resource-intensive and time-consuming process; protein purification can further increase costs significantly. To overcome this limitation, we work herein with a new technique called bacterial enzyme-induced calcite precipitation (BEICP). In BEICP, free microbial urease is used as part of a total bacterial protein extract obtained from Sporsarcina pasteurii, a commonly found soil bacterium that produces urease in high quantities [15]. Biocementation via BEICP has proven to be effective in cementing coarse and fine-grained containing soils [16,17] to varying degrees. However, to be successfully implemented, a deeper fundamental understanding of the mechanisms leading to biocementation is necessary.
In the BEICP technique, the spatial distribution of adsorbed, enzymatically active urease dictates the locations where calcium carbonate precipitation, and therefore cementation, will take place. In our previous work, we reported that urease adsorbed to Ottawa silica sand and silt retained some enzymatic activity, even when present in a complex protein mixture [10]. However, an overall loss of urease activity after adsorption was observed (i.e., the sum of urease activity in the soil and supernatant was lower compared to the original activity of the total protein suspension), with greater losses observed for samples with higher silt contents. These observations raised the question of how activity loss relates to the overall amount of protein adsorbed and soil surface chemistry. Understanding this relationship is especially important for BEICP applications, because soils have highly heterogeneous surfaces often coated with metal oxides and hydrophobic compounds, with varying sizes of positively and negatively charged patches [18,19].
In particular, protein adsorption is highly dependent on the surface chemistries of the protein and the sorbent surface, as well as the presence of other proteins. For example, proteins commonly exhibit high affinity towards hydrophobic surfaces, even if they are hydrophilic in nature [20,21,22,23,24,25,26], but that often leads to protein denaturation and sharp decreases in enzymatic activity [27]. Although soils generally display low levels of hydrophobicity [28,29], hydrophobic soils, defined as having contact angles ≥ 90°, have been documented worldwide and are especially common in surface soils that often dry out or have been exposed to fires [28,30,31,32,33,34,35,36]. It is also noteworthy that hydrophobic soils are associated with increased soil erosion [37,38,39,40], for which soil stabilization via biocementation may be a suitable mitigation method [41,42,43,44]. In addition, low amounts of adsorbed proteins and the subsequent retention of their enzymatic activity have been observed in soils containing aluminum and iron oxides, even in single-protein adsorption studies [19,22,45].
Therefore, the overall goal of this paper was to investigate the behavior of S. pasteurii total bacterial proteins, specifically urease, upon adsorption onto soil samples with varying degrees of hydrophobicity and electrical charges, and the resulting enzymatic activities. We hypothesized that higher amounts of adsorbed proteins including urease would result from favorable protein–soil surface interactions, such as those resulting from opposing electrostatic charges or hydrophobicity. This increased amount of adsorbed proteins, in turn, was expected to increase overall urease enzymatic activity in the soil to different degrees, depending on the configuration of the adsorbed urease. To test this hypothesis, batch adsorption experiments were conducted in sand mixtures where electrostatic and hydrophobic driving forces were expected to be dominant. An amount of 100% organosilane breathable-soil waterproofing agent and iron oxide was used to produce hydrophobic and positively-charged sands, respectively. The ranges of hydrophobicity or the positive charges in soils were varied by changing the ratios of mixing between coated and uncoated sands. The total amount of adsorbed proteins, and specifically urease, were measured though spectrophotometric and proteomic analyses, and enzymatic activity assays were performed in soil and supernatant portions following adsorption.

2. Results and Discussion

2.1. Surface Coverage

In this study, soil mixtures containing different levels of hydrophobicity and positive charge patches were considered. Adsorption is a surface phenomenon and is largely controlled by the surface chemistry of the adsorbent and adsorbate [46]. Sorbent surfaces with greater numbers of available adsorption sites have higher adsorption capacities, but the likelihood of protein adsorption and surface coverage is dictated by the affinity of the proteins to the solid surface. At high surface coverage levels, adsorbed proteins are tightly packed; adsorption is more likely to occur in a multilayer fashion and might result in blockage of the active site [23,45]. At low surface coverage, intermolecular interactions are limited, but protein denaturing caused by conformational changes in the molecular structure is more likely [47,48,49,50,51].
The measured surface area for each soil sample is shown in Table S1, and the total amount of protein adsorbed is shown in Figure S2. It is worth noting that although the total surface areas among the samples were markedly different, the total amount of protein adsorbed onto each soil mixture was similar. This suggests that differences in surface area between the different samples tested did not impact total protein adsorption. The calculated surface coverage for each soil sample is shown in Table S1 and Figure 1; herein, surface coverage is defined as the number of total proteins adsorbed per m2 of sorbent surface. The hydrophobic-containing soil samples (denoted as “HF”) displayed the highest surface coverages; while increasing the hydrophobicity level from 10% HF to 20% HF did not significantly affect the surface coverage of these samples (p-value > 0.05), and the values for 100% HF were approximately 25% higher. In addition, surface coverages in all hydrophobic-containing samples were considerably higher than in the sand samples (p-value < 0.05). The surface coverages for sand and iron soil (denoted as “iron”) mixtures were not statistically different from each other, even though the total surface area of the 100% iron sample was 32 times larger than the sand-only surface area. Despite this, there appears to be a trend of lower surface coverage for samples with higher iron contents. Similar observations linking soil iron content with lower adsorbed protein masses have been reported in natural soils [52,53,54].

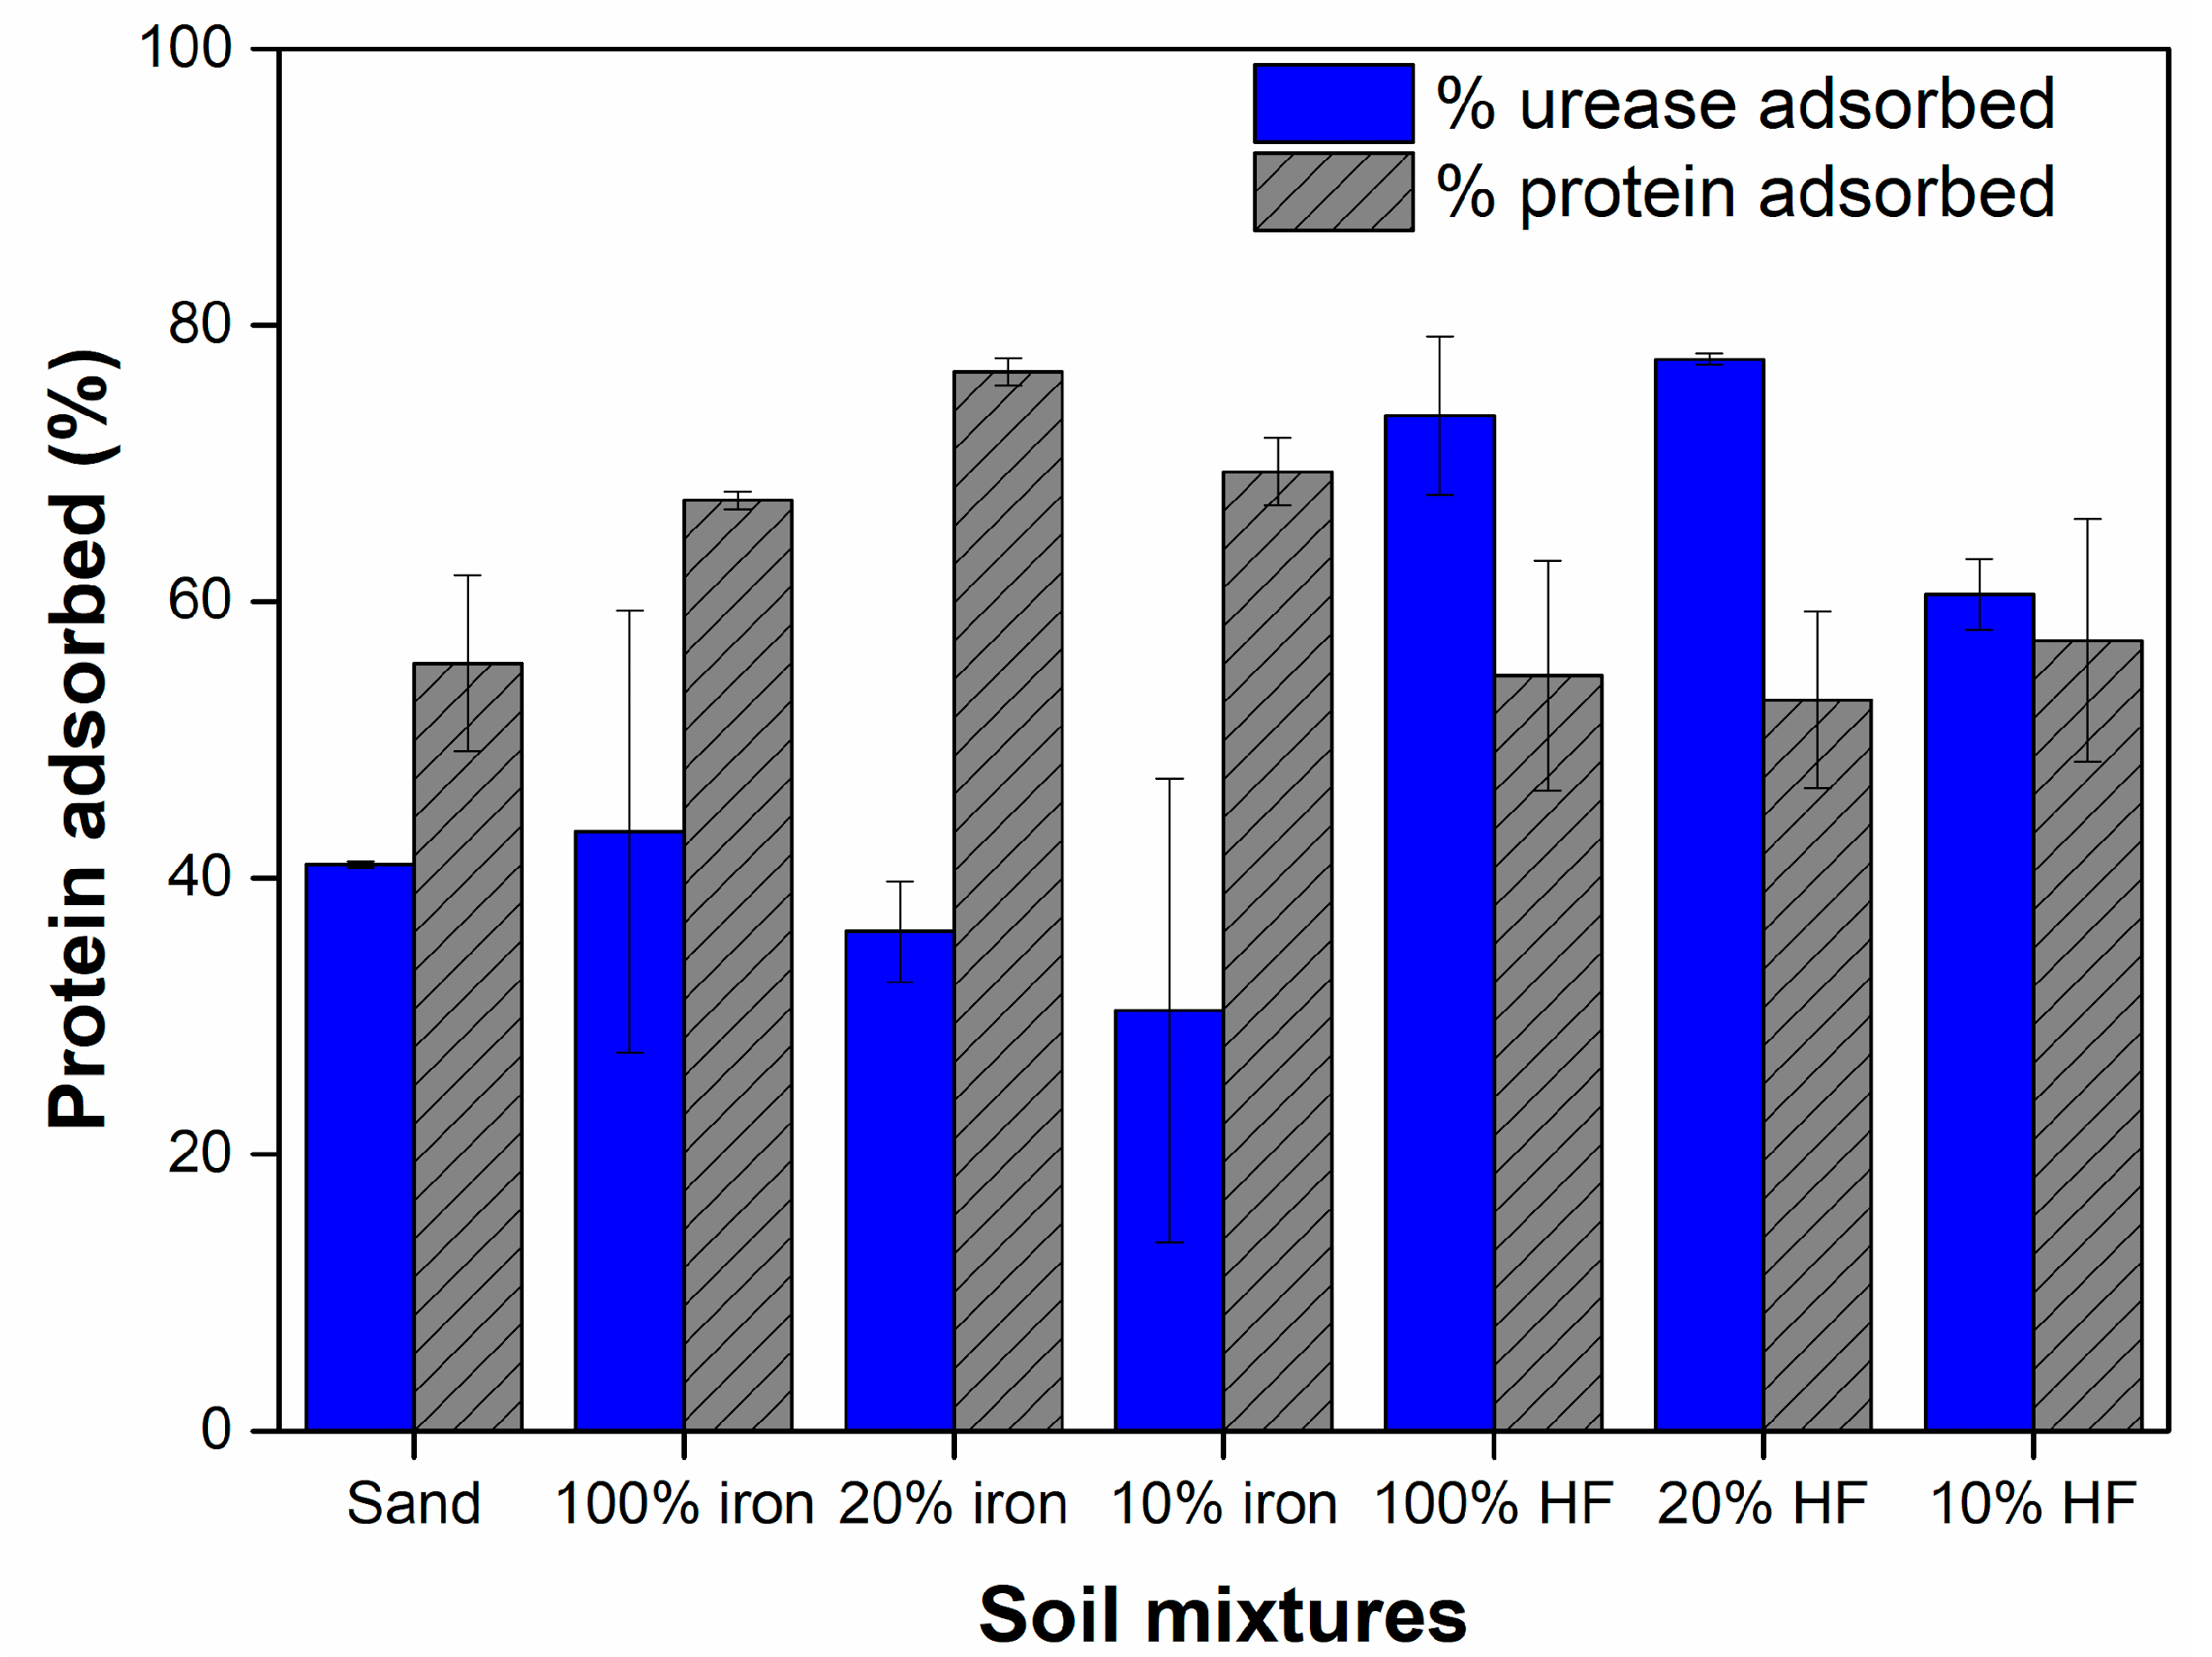
2.2. Protein Adsorption

Similar amounts of total proteins were adsorbed in all soil samples tested (Figure 2, p-values > 0.05) even though the specific surface area of the 100% iron sample was approximately 32 and 150 times larger than sand and 100% HF, respectively (Table S1). Similar findings were reported for protein adsorption onto soil mineral surfaces for various proteins including urease, where the amount of adsorbed protein did not positively correlate to the surface area available [18,19,22,45]. The differences in surface coverages combined with the equal amounts of adsorbed proteins indicate that most proteins in the S. pasteurii total protein extract have a higher affinity towards hydrophobic surfaces. In fact, several studies have shown that most proteins have a high affinity towards hydrophobic surfaces, including hydrophilic proteins such as BSA, with increased amounts of adsorbed proteins displayed on surfaces with higher hydrophobicity levels [20,21,22,23,24,25,26,55]. Furthermore, though hydrophobic amino acid residues are mostly ingrained inside the protein’s molecular structure, a hydrophobic protein core can become exposed due to structural unfolding upon initial binding via electrostatic interactions. This unfolding then gives rise to numerous hydrophobic binding sites in the protein, that will in turn enhance subsequent adsorption [56,57,58,59].
While the total mass of adsorbed proteins was similar across all samples (Figure S2), the percentage of urease adsorbed onto hydrophobic-containing mixtures was significantly higher than in sand samples (Figure 2, p-value < 0.05). These results suggest urease was preferentially adsorbed onto 20% HF and 100% HF samples compared to other proteins. This could be a result of surface chemistry modifications arising from multilayers of adsorbed proteins in the tightly packed surfaces of 20% and 100% HF samples, which might have resulted in a sorbent surface that was more favorable for urease adsorption, as well as an increased affinity of urease towards hydrophobic surfaces. Hence, the presence of other proteins may have facilitated urease adsorption onto the 20% and 100% HF mixtures.
No significant differences were found in the percentage of adsorbed urease among iron-containing mixtures, even when compared to sand (p-value > 0.05). In addition, our results indicate that urease adsorption onto sand- and iron-containing soil mixtures was less favorable in comparison to the total proteins in the mixture. It is unclear if increased iron contents had a more detrimental effect on urease adsorption, but previous studies have found low levels of urease adsorption onto clay minerals coated with iron [22]. Studies have found that the presence of urease is negatively related to the amount of iron present, either in natural soils or in experimental settings [60].
Furthermore, the adsorption experiments herein were conducted at pH 8 and ambient temperature. In these conditions, about 87% of all proteins present in the initial protein mixture have isoelectric points (pI) lower than 8 based on our label-free LC/MS data, including urease which has a pI of 4.6 [61], pointing to an overall negative charge for most proteins during adsorption. The pIs of Ottawa sand and iron-coated sand are 2 [62] and 9.3 [46], respectively, suggesting that the sand surface had a net negative charge whereas the iron-coated sand had a net positive surface charge. Results from streaming current measurements confirmed a shift towards less net negative charges in samples with increased iron contents (data not shown). Thus, electrostatic interactions between most proteins and the iron-coated sand were expected to enhance protein adsorption and result in higher amounts of proteins adsorbed for samples with higher iron contents. However, our results showed no differences between the amounts of protein adsorbed among those samples (Figure 2). The surface of iron and sand soil mixtures is mostly composed of silica, iron, and hydroxyls groups, as shown by the EDS data in Figure S1. The complete absence of hydrophobic groups in these surfaces suggest that electrostatic interactions were dominant. Possibly, the negatively charged proteins that adsorbed first onto the positively charged patches on the iron-coated surface created a repulsive environment that hindered the subsequent electrostatic attachment of negatively charged proteins [58]. These findings are in agreement with previous studies that have also found low amounts of proteins adsorbed onto aluminum- and iron oxide-coated surfaces, especially in soils and clay minerals [19,22,45].
Label-free LC/MS proteomic analysis was conducted on the initial total protein extract and in supernatant portions of each sample following adsorption. A heatmap showing the complete protein profile in each sample is shown in Figure S3 (peak area data from label-free LC/MS analysis are provided in Table S2), and the score plot in Figure 3 provides information on sample clustering. These data revealed that after adsorption, supernatant samples from hydrophobic soil mixtures were markedly different from the initial protein extract, especially 20% and 100% HF samples (Figure 3). On the other hand, iron-containing samples were more closely related to sand and the original protein extract, indicating that the protein profile in these supernatant samples upon adsorption did not differ as much from the initial protein extract. It is also worth noting that hydrophobic samples were more distinctive from each other compared to the iron-containing soil mixtures, which were closely clustered. The significantly higher surface coverage displayed in hydrophobic samples (Figure 1) suggests that protein adsorption happened in a multilayer fashion. Thus, the underlying soil surface was replaced as the adsorbent surface by a layer of adsorbed proteins as the adsorption sites were occupied, which in turn gave rise to a new sorbent surface with a different surface chemistry than the soil grain surfaces. Therefore, these observations suggest that the change in surface chemistry due to multilayer adsorption was able to attract a more diverse pool of proteins present in the crude protein extract, which would explain why hydrophobic samples were markedly distinct from each other and from all other samples (Figure 3). In fact, label-free analysis showed that the initial crude protein extract was a complex protein mixture composed of over 600 proteins (Table S2), with sizes varying from 4 to 130 kDa and isoelectric points ranging from 3.9 to 12.4. This diverse pool of proteins is potentially able to attach to any surface, but the extent of protein adsorption achieved is still dependent on how compatible the sorbent surface chemistry would be to the proteins in the mixture.

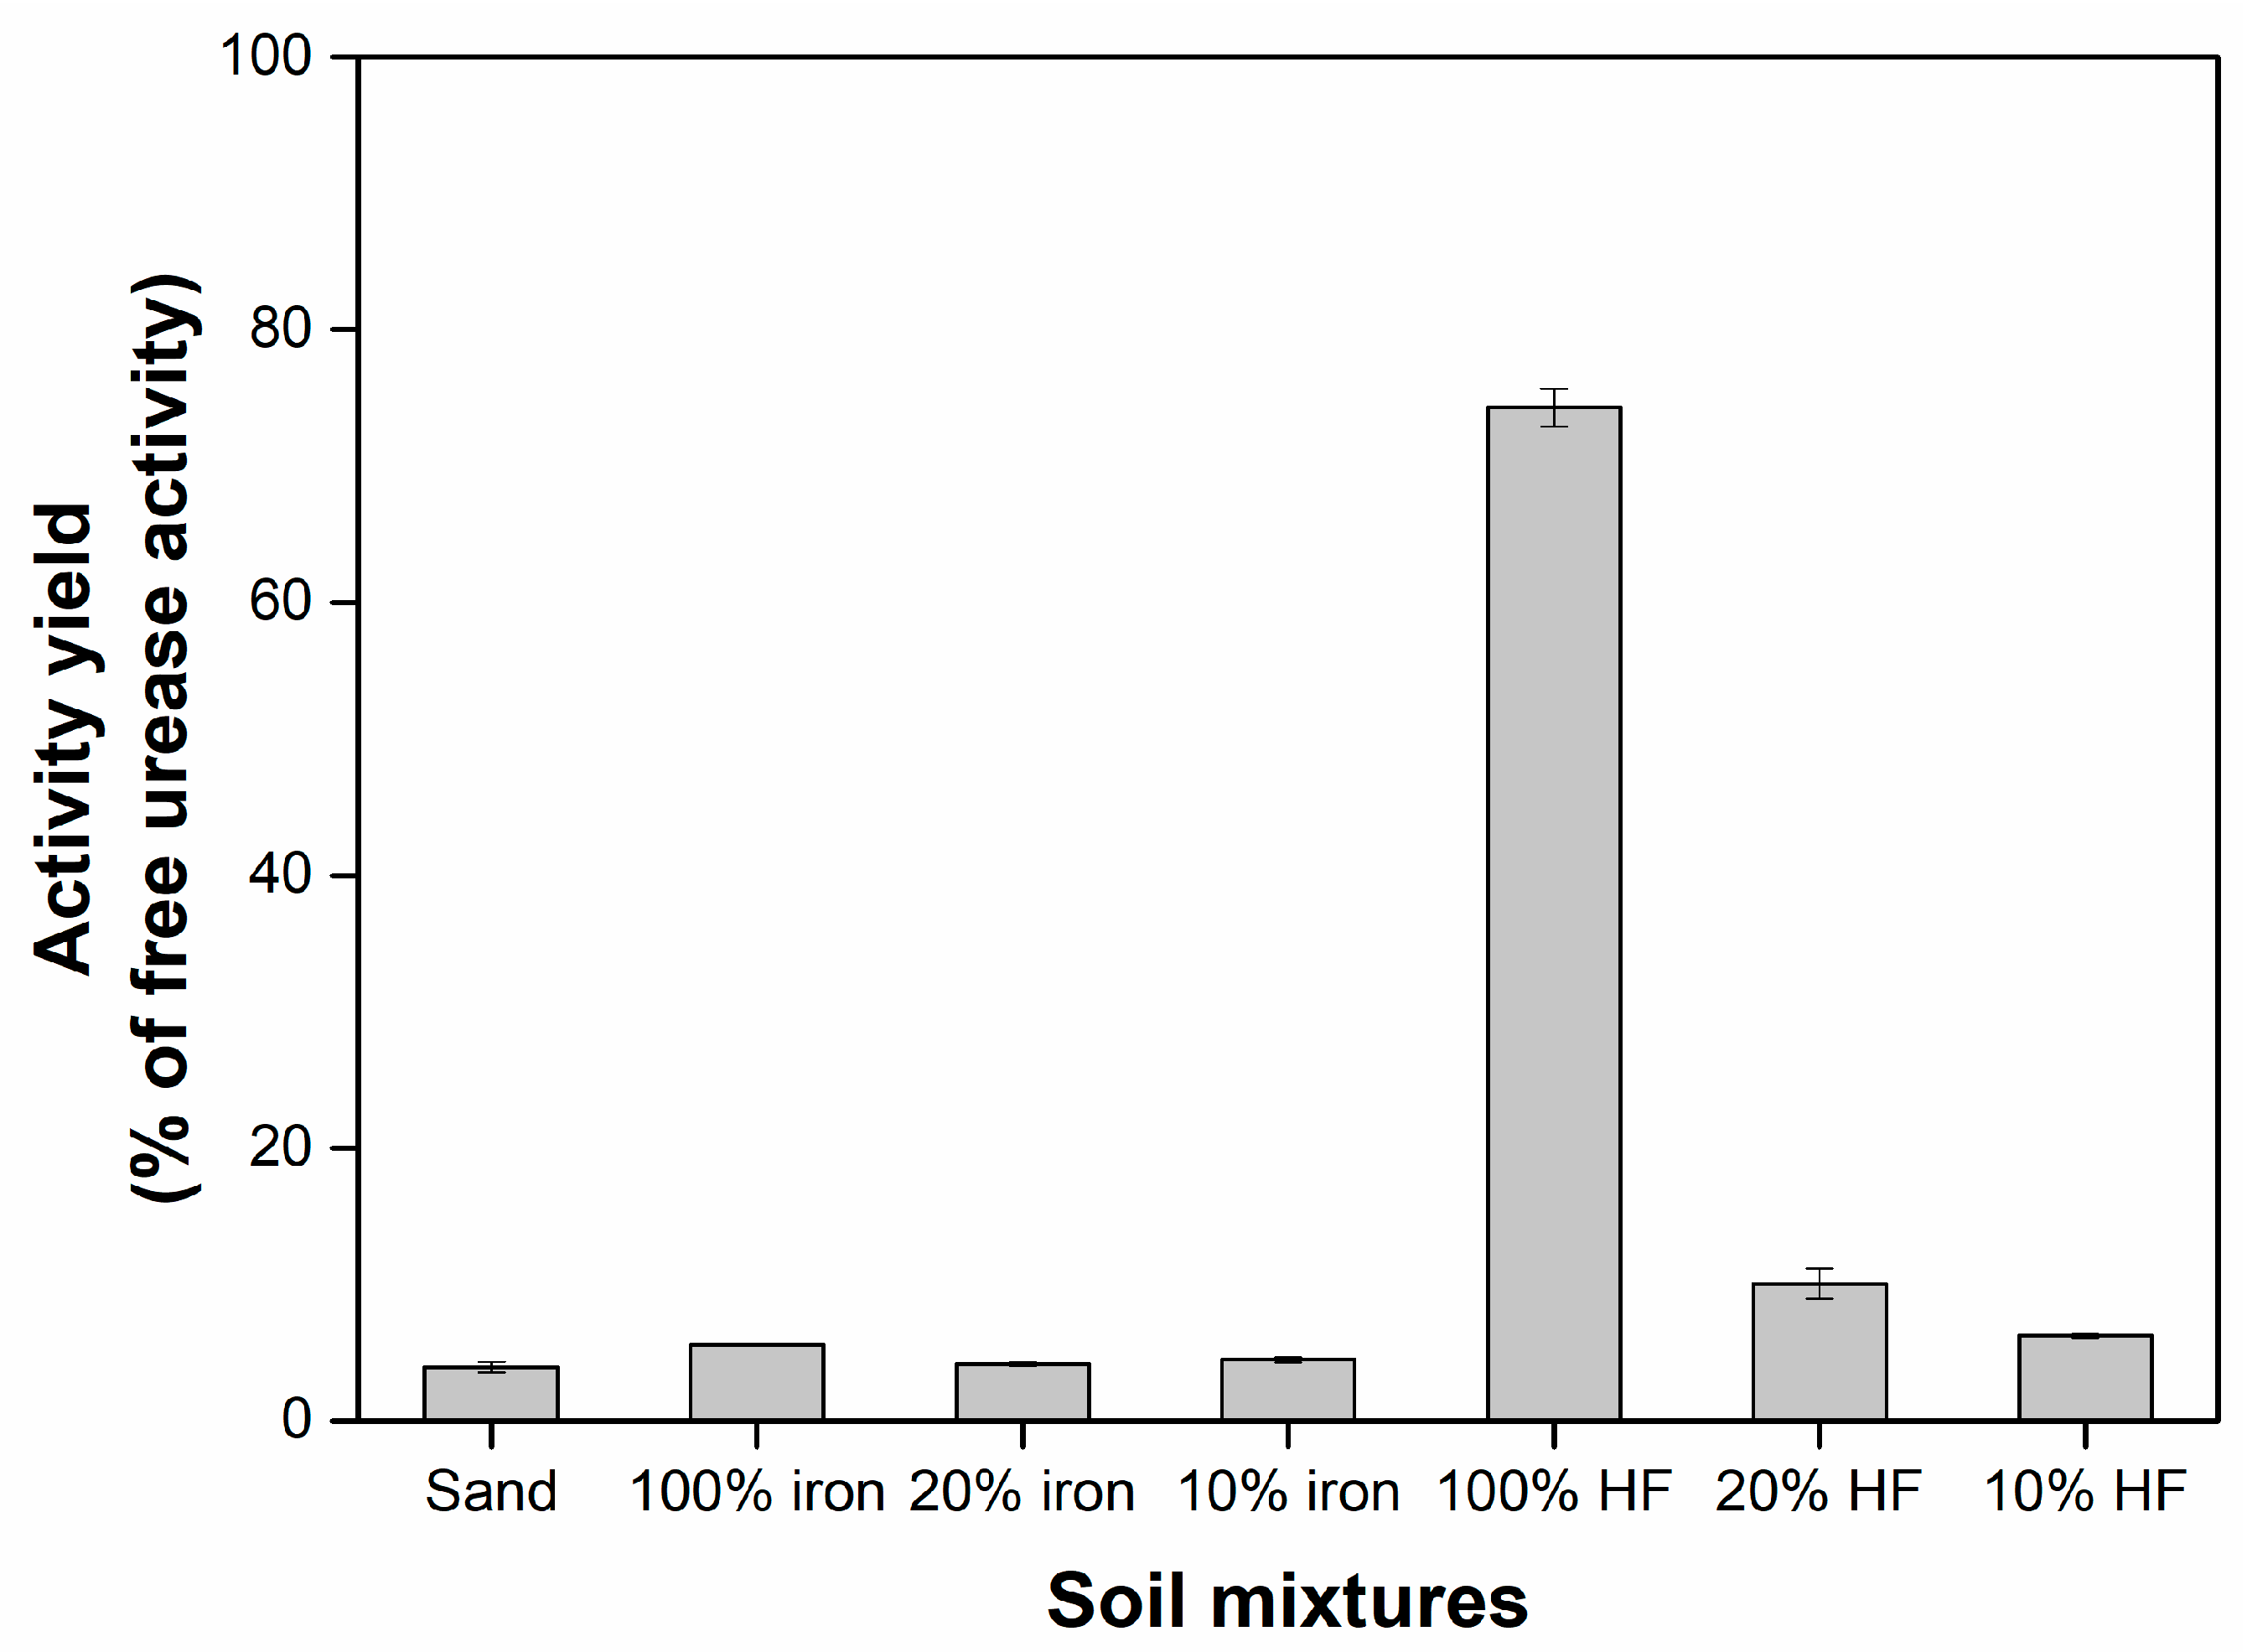
2.3. Enzymatic Activity of Adsorbed Urease

The enzymatic activity of adsorbed urease, normalized to the free urease activity of the initial total protein extract, is shown as activity yield in Figure 4. Hydrophobic samples showed the highest activity among all samples, and the retained enzymatic activity increased for samples with higher hydrophobic contents. In addition, urease activity values for hydrophobic soil mixtures were significantly higher than the values for sand- and iron-containing soil mixtures (p-value < 0.1). Low urease activity was retained in soil mixtures containing iron. The 10% and 20% iron samples were found to not be statistically different from each other, or from sand, in terms of retained urease activity. The 100% iron sample displayed higher urease activity than sand (p = 0.07). Although the presence of iron has been correlated with a lower amount of adsorbed urease or the presence of urease in natural soils, several studies found an increased activity of several enzymes, including urease, in the presence of iron as shown [52,53,54]. Overall, urease activity decreased in the order of 100% HF > 20% HF > 10% HF > 100% iron > sand, 10% iron/20% iron. These findings agree with the values obtained for the catalytic efficiency of adsorbed urease, defined as the ratio of Vmax/KM from Michaelis–Menten experiments, which shows the decrease in catalytic efficiency and follows the order 100% HF > 100% iron > sand (Table S3).
Total urease activity, defined as the sum of the activity retained in the soil and supernatant portions of each sample after adsorption, showed that the decrease in urease activity observed in the soil portions of all soil mixtures was not solely a result of adsorption intricacies (Figure S4). Except for 100% HF, all samples displayed high urease activity in their supernatant portions. This suggests that urease adsorption was distinctively more favorable in the 100% HF samples, where more urease was adsorbed into the soil (Figure 2). Additional experiments with 50% HF confirmed similar trends to 100% HF (Figure S4). For all other samples, some urease stayed in the supernatant after adsorption, as indicated by residual urease activity in the supernatant. Nevertheless, all samples displayed an overall loss of total urease activity; the highest activity loss was observed in samples containing 10% and 20% iron (up to 58%), whereas the 100% HF samples displayed the lowest loss of activity (less than 25%).
Protein denaturation upon adsorption is highly dependent on surface coverage, especially on whether or not proteins have room to spread over the surface [23,64]. Although hydrophobic interactions have been shown to be more detrimental to the molecular structure of adsorbed proteins [27], some studies found that electrostatic interactions played a major role in protein denaturation upon adsorption to solid surfaces compared to hydrophobic interactions [65,66]. Therefore, aside from surface coverage, it is not the nature of the adsorption-driving force that dictates the likelihood of protein unfolding, but rather the extent of the protein’s affinity towards the sorbent surface, regardless of the driving force. We can hypothesize that the high packing density observed in hydrophobic soil mixtures of 100% HF samples (Figure 1) had a strong effect on hindering the spreading of adsorbed proteins and their denaturation, which explains why a smaller decrease in overall urease activity was found in those samples (Figure S4). However, although the 20% HF and 10% HF samples had much higher surface coverage than sand, 100% iron, and 50% iron samples (Figure 1), the overall losses of activity in those samples were similar (Figure S4). It has been shown that the dissociation of jack bean urease into its subunits has little effect on urease activity, and subunits are often functionally independent [56,67,68]. As such, even though samples such as sand and the iron-containing soil mixtures might have experienced a higher degree of protein unfolding due to their low surface coverage of proteins, the structural changes might have happened in a way that did not affect activity as much, and the overall level of activity loss ended up being similar to those found in 10% HF and 20% HF samples. Moreover, surface topography has been highlighted as an important variable that can constrain the mobility and agglomeration of adsorbed proteins [69,70], which in turn would also affect the degree of protein unfolding. In this study, surface topography was not controlled for and likely varied widely across tested soil samples, based on SEM pictures of the coated and uncoated soil grains (Figure S5).

3. Materials and Methods

3.1. Materials Used

Commercial-grade Ottawa silica sand 20/30 (Gilson Company Inc., Lewis Center, OH, USA), composed of 98.7% silica and specific gravity of 2.65, was used as the primary sand material in this study. Pure culture S. pasteurii (ATCC 11859) cells were used as the source of crude total bacterial proteins. All chemicals were obtained from Fisher Scientific (Walthan, MA, USA) unless otherwise noted.

3.2. Total Protein Extract

Growth media and cell harvesting of S. pasteurii followed previously described procedures [10] with the following modifications. Upon extraction of the crude bacterial total protein by sonication, the protein extracts were not dialyzed prior to storing at −20 °C. Aqueous protein concentrations were quantified spectrophotometrically using Nanodrop measurements at 280 nm.

3.3. Soil Pretreatments

Commercial-grade Ottawa silica sand 20/30 (Gilson Company Inc., Lewis Center, OH, USA) was used as uncoated sand, and hereafter defined as “sand”. Hydrophobic-coated sand was obtained by mixing 100% organosilane-based breathable-soil waterproofing agent from TerraSil (Zydex Industries, Gotri, Vadodara, India) in a 10% ratio by weight with the Ottawa sand. The mixture was left at ambient temperature overnight and then dried at 110 °C until completely dry. The dried coated sand was sieved through a U.S Sieve No. 20 and No.30 (0.85 and 0.6 mm openings, respectively); the portion retained between the two sieves is herein defined as “100% HF”.
Iron-coated sand was obtained following the IOCS-1 procedure [71] designed to yield sand particles with a 9.3 isoelectric point. In brief, approximately 80 g of Ottawa silica sand was mixed with 200 mL of 2.5 M FeCl3 solution and heated to 110 °C for 3 h. The temperature was then raised to 550 °C and heating continued for an additional 3 h. Sand was cooled to room temperature in open air, after which it was rinsed with DI water and air-dried. Next, sand from the previous step was mixed in a 1:2 ratio with a 2.1 M solution of Fe(NO3)3 plus 1.5% w/w ratio of a 10 M NaOH solution. This mixture was heated to 110 °C overnight or until completely dried. The resulting coated sand aggregates were then mechanically broken and sieved through a U.S Sieve No. 20 and No. 30 (0.85 and 0.6 mm openings, respectively); the portion retained between the two sieves is herein defined as “100% iron”. Uncoated sand was mixed with the 100% HF or 100% iron in various ratios.

3.4. Soil Characterization

Contact angle: Contact angle measurements were conducted on 100% HF samples using the sessile drop method, using nanopure water as the probe liquid [72]. In brief, a water droplet was placed on top of the sand surface and a handheld camera was used to visually capture the drop shape on the surface. The tangent to drop profile was aligned with the base using an online protractor tool (https://www.ginifab.com/feeds/angle_measurement/, accessed on 28 October 2021), and yielded a value of 106°, which confirmed that the organosilane-coated sand was indeed hydrophobic.
Streaming current: To confirm iron-containing soil mixtures were indeed more positively charged in samples with higher iron contents, streaming current was measured in all samples using the Laboratory Charge Analyzer (Chemtrac, Atlanta, GA, USA). All measurements were conducted in 50 mM HEPES buffer with 4% EDTA at pH 8 and ambient temperature.
Surface area: The specific surface area of each soil mixture was measured by N2 physisorption analysis using a Micromeritics 3Flex surface characterization analyzer (Micromeritics, Atlanta, GA, USA) (Table S1). Approximately 3.5 ± 0.5 g of samples was used for BET analysis from 0.05 to 0.3 P/P0 using nitrogen as the carrier gas at 77 K. Prior to analysis, all samples were degassed at 200 °C for 120 min to remove any adsorbates.

3.5. Adsorption Experiments

Batch adsorption experiments were conducted using 2 g of each soil mixture. Soil mixtures containing 10% and 20% (w/w) ratios of iron coated sand or hydrophobic coated sand to uncoated sand along with samples containing 100% iron, 100% HF, and 100% sand were considered in this study. Batch adsorption experiments were conducted at room temperature (22–25 °C) and end-over rotation for 16 h, using a total protein extract with 4 mg/mL protein concentration. Following adsorption, protein soil mixtures were separated via centrifugation at 8000× g for 5 min at 20 °C to obtain the soil and supernatant fractions from each sample. Supernatants were filtered through 0.2 μm pore size syringe filters, and soil samples were washed with buffer (50 mM HEPES buffer with 4% EDTA at pH 8) to remove loosely bound proteins. These two fractions are herein defined as “supernatant” and “soil”. Samples containing only soil in buffer and the crude protein extract without soil were also tested as controls. All adsorption experiments were conducted in 50 mM HEPES buffer with 4% EDTA (pH 8). Experiments were conducted in triplicates using different total protein extracts.

3.6. Urease Activity Measurements

Urease activity was determined through measurements of urea consumption over time according to method A in Rahmatullah and Boyde [73]. Soil samples were suspended in 8 mL of 50 mM HEPES buffer with 4% EDTA at pH 8, and 2 mL of supernatant samples were used. Sub-samples were taken following the addition of 2.08 mM urea approximately every 30 s for 3 min for soil fractions, and every 15 s for 90 min for supernatants. Urease activity was determined based on the linear slope of each reaction and is expressed in U, where 1 U is equal to 1 µmol of urea consumed per minute.

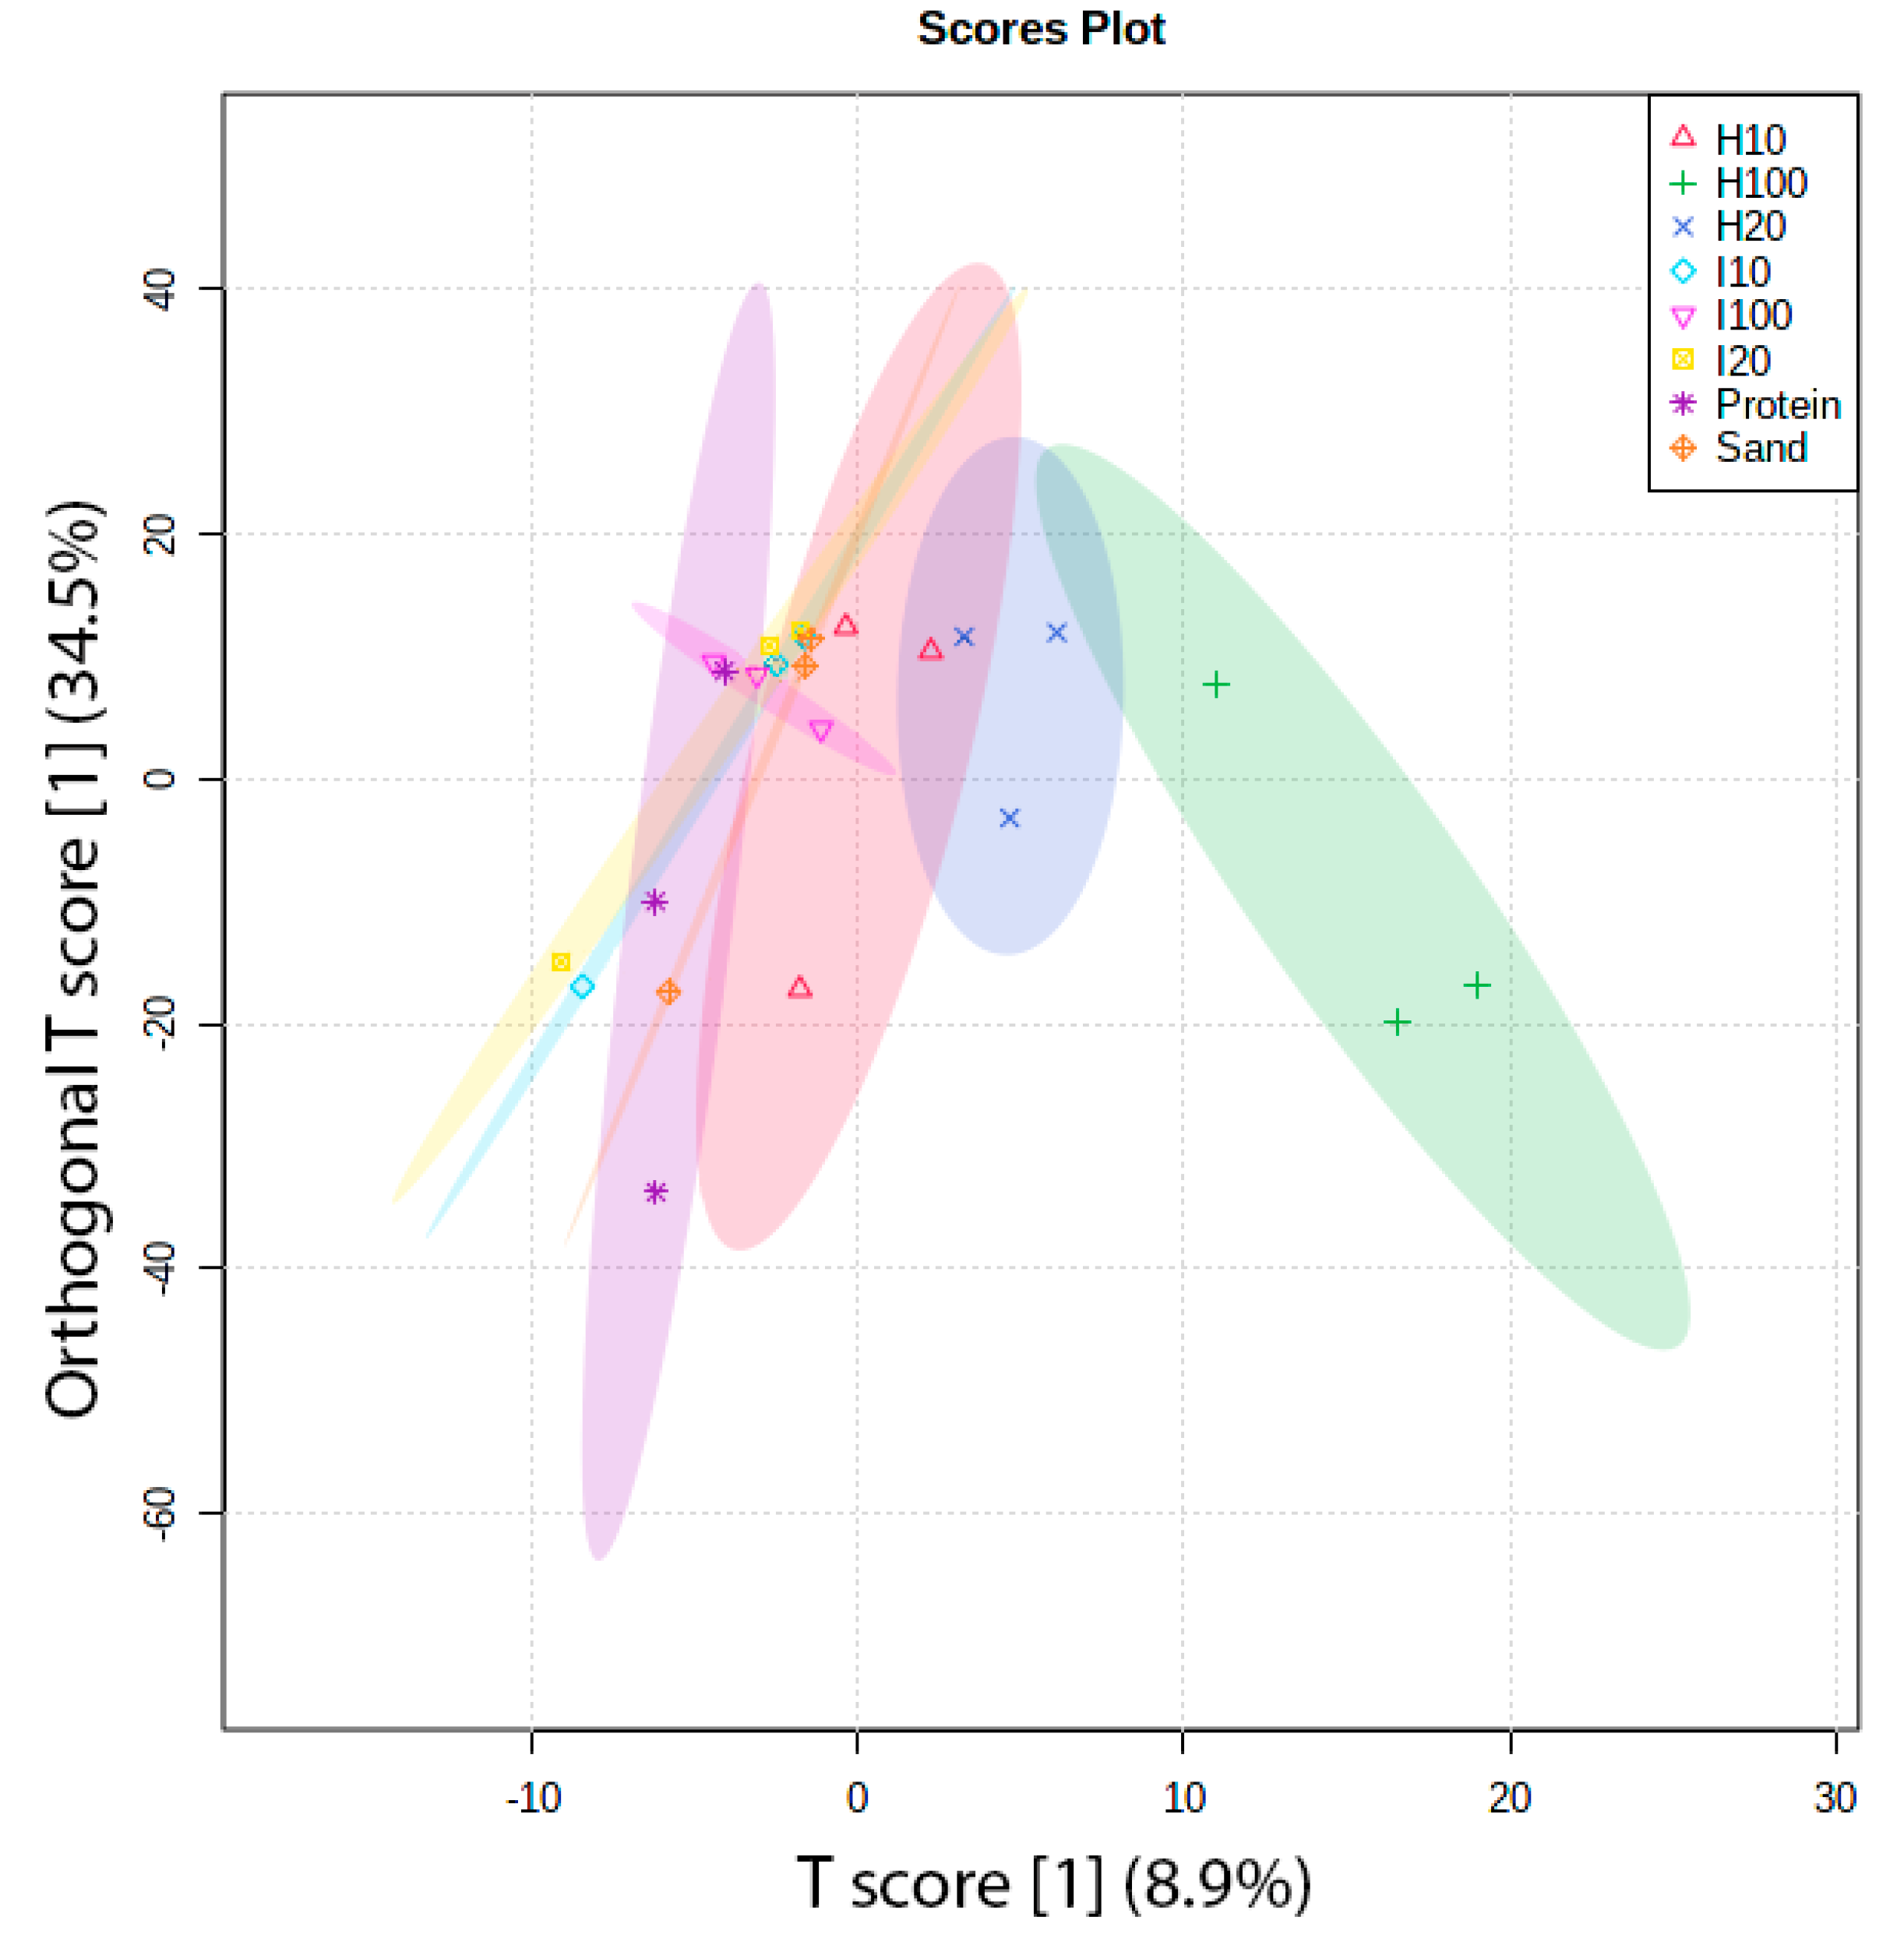
3.7. Proteomics Analysis

Supernatant samples derived from adsorption experiments were analyzed using label-free liquid chromatography/mass spectrometry (LC/MS) relative quantification and targeted parallel reaction monitoring (PRM) LC/MS absolute quantification techniques at the Protein Facility at Iowa State University. In brief, crude protein extracts were reduced with DTT for the label-free analysis. The Cys were modified with iodoacetamide and then digested overnight with trypsin/Lys-C. Samples were desalted using C18 MicroSpin Columns (Nest Group SEM SS18V) prior to drying in a SpeedVac. PRTC standard (Pierce part #88320) was spiked into each sample to serve as an internal control. The peptides were then separated by LC and analyzed through MS/MS by fragmenting each peptide with an Exactive Hybrid Quadrupole-Orbitrap Mass Spectrometer with an HCD fragmentation cell (Thermo Fisher Scientific, Waltham, MA, USA). Data was normalized using the PRTC peak areas. The Proteome Discoverer program version 2.2 (Thermo Fisher Scientific, Waltham, MA, USA) was used to create a peak list. Only proteins with peptide spectrum matches (PSMs) higher than three were used for data analysis [74]. The resulting intact and fragmentation pattern was compared to a theoretical fragmentation pattern using the UniProt database for S. pasteurii [75] in order to identify proteins based on the peptides present. The retention time and masses of urease subunits α, β, and γ obtained from the label-free untargeted quantification analysis were used to produce an inclusion list of peptides for the PRM runs. A total number of 11, 4, and 3 peptides present in the urease α, β, and γ subunit samples, respectively, displaying a high number of PMS were selected for the PRM inclusion list. In the PRM analysis, myoglobin was spiked in each sample as an internal standard at 0.5 µg/µL concentration. An MS1 scan was used to find the peptides of interest from the generated inclusion list and MS/MS scan was used to confirm the peptide’s identity for quantification. The mass of each urease subunit was obtained based on the ratio of the peak areas of myoglobin standard, the protein of interest, and the known amount of myoglobin injected.

3.8. Statistical Analysis

Statistical analysis was performed using the R Stats Package version 4.1.1. Compared samples were subjected to an f-test for equality of variances and followed by unpaired or paired t-tests based on the results of the f-test. A p-value less than 0.05 was considered as statistical significance.

4. Conclusions

Understanding how protein adsorption onto soils results in enzymatic activity is vital for enzyme-based sustainable engineering applications such as biocementation. The findings from this study showed that similar amounts of adsorbed proteins from the original crude protein extract adsorbed onto all soil surfaces regardless of surface chemistry. However, when considering the adsorbed urease, our findings suggests that urease was preferentially adsorbed onto 20% HF and 100% HF samples. Higher levels of urease activity were retained in hydrophobic-containing samples, and urease activity decreased in the order of 100% HF > 20% HF > 10% HF > 100% iron > sand, 10% iron/20% iron. Similar levels of enzymatic activity were retained in iron-containing soil mixtures and sand, indicating that although favorable electrostatic interactions were expected to enhance adsorption and urease activity in iron-containing mixtures, our results showed otherwise. Finally, although higher amounts of urease and retained activity were found in hydrophobic-containing soils, the overall loss of activity in 10% HF and 20% HF samples were similar to values obtained for sand and 100% iron (ranging from 40–47%). The 10% iron and 20% iron samples displayed the highest activity loss, with up to 55 and 58%, respectively, whereas 100% HF exhibited the lowest loss of activity of less than 25%.
The findings from this study show that preferential adsorption of targeted proteins in a complex protein mixture is possible, even when competition for adsorption sites is high, as noted in the 100% HF soils. The fact that low amounts of proteins adsorbed onto iron-containing soils, even though that interaction should be electrostatically favorable, highlights the complexity of protein adsorption and the importance of soil characterization prior to the implementation of biocementation to assess the likelihood of achieving successful cementation. Furthermore, our results suggest that surface coverage can play a major positive role in mitigating the loss of enzymatic activity upon adsorption. Thus, surface manipulations to yield high surface coverage, such as TerraSil treatments to add hydrophobicity to soil surfaces, can potentially be used to decrease the negative effects of adsorption on enzymatic activity, at least to some extent. Finally, the high amount of urease activity in hydrophobic soils containing more than 50% hydrophobic-coated sands suggests that biocementation could be successfully used to stabilize soils exposed to wildfires and/or that have experienced long periods of severe drought, since such soils are associated with higher degrees of hydrophobicity.

Supplementary Materials

The following are available online at https://0-www-mdpi-com.brum.beds.ac.uk/article/10.3390/catal12020230/s1: Figure S1: Elemental analysis obtained with an Oxford Aztec energy-dispersive spectrometer (EDS) for sand, 100% HF and 100% iron samples; Figure S2: Total amount of protein adsorbed in the soil portion of each sample shown in mg; Figure S3: Heatmaps showing all (A) and top 25 (B) proteins present in the initial total protein extract and in the supernatant samples following adsorption onto soil mixtures; Figure S4: Urease activity in supernatant and soils portions upon adsorption as a percentage of the activity of the free urease enzyme in the initial total protein extract; Figure S5: SEM pictures of (A) uncoated Ottawa silica sand, (B) 10% HF hydrophobic coated sand, (C) 10% iron oxide coated sand; Table S1: Surface areas of each soil mixture measured using BET N2 physisorption analysis; Table S2: Label-free proteomics analysis data; KM and VMAX parameters obtained from Michaelis-Menten kinetic experiments in soil portions of each samples following batch adsorption experiments.

Author Contributions

Conceptualization, R.P.V. and K.I.; methodology, R.P.V.; investigation, R.P.V.; writing—original draft preparation, R.P.V.; writing—review and editing, K.I.; supervision, K.I. All authors have read and agreed to the published version of the manuscript.

Funding

This research received no external funding.

Data Availability Statement

All data from this study are provided in the article and the Supplemental Materials.

Acknowledgments

The authors would like to thank Joel Nott and the ISU Protein Facility for help with proteomics analysis. We also thank Warren Straszheim, Joseph Goodwill, and Bora Cetin for providing instrument access and helpful feedback on data interpretation.

Conflicts of Interest

The authors declare no conflict of interest.

References

  1. Meyer, F.D.; Bang, S.; Min, S.; Stetler, L.D. Microbiologically-Induced Soil Stabilization: Application of Sporosarcina pasteurii for Fugitive Dust Control. In Proceedings of the Geo-Frontiers 2011: Advances in Geotechnical Engineering, Dallas, TX, USA, 13–16 March 2011; pp. 4002–4011. [Google Scholar] [CrossRef] [Green Version]
  2. Dhami, N.K.; Ereddy, M.S.; Mukherjee, A. Biomineralization of calcium carbonates and their engineered applications: A review. Front. Microbiol. 2013, 4, 314. [Google Scholar] [CrossRef] [PubMed] [Green Version]
  3. Whiffin, V.S.; van Paassen, L.; Harkes, M.P. Microbial Carbonate Precipitation as a Soil Improvement Technique. Geomicrobiol. J. 2007, 24, 417–423. [Google Scholar] [CrossRef]
  4. Van Paassen, L.A.; Ghose, R.; Van Der Linden, T.J.M.; Van Der Star, W.R.L.; Van Loosdrecht, M.C.M. Quantifying Biomediated Ground Improvement by Ureolysis: Large-Scale Biogrout Experiment. J. Geotech. Geoenviron. Eng. 2010, 136, 1721–1728. [Google Scholar] [CrossRef]
  5. DeJong, J.T.; Mortensen, B.M.; Martinez, B.C.; Nelson, D.C. Bio-mediated soil improvement. Ecol. Eng. 2010, 36, 197–210. [Google Scholar] [CrossRef]
  6. Cetin, B.; Aydilek, A.H.; Li, L. Trace Metal Leaching from Embankment Soils Amended with High-Carbon Fly Ash. J. Geotech. Geoenviron. Eng. 2014, 140, 1–13. [Google Scholar] [CrossRef]
  7. Komonweeraket, K.; Cetin, B.; Aydilek, A.H.; Benson, C.H.; Edil, T.B. Geochemical Analysis of Leached Elements from Fly Ash Stabilized Soils. J. Geotech. Geoenviron. Eng. 2015, 141, 04015012. [Google Scholar] [CrossRef]
  8. Komonweeraket, K.; Cetin, B.; Aydilek, A.H.; Benson, C.H.; Edil, T.B. Effects of pH on the leaching mechanisms of elements from fly ash mixed soils. Fuel 2015, 140, 788–802. [Google Scholar] [CrossRef]
  9. Qin, Y.; Cabral, J.M. Review Properties and Applications of Urease. Biocatal. Biotransform. 2002, 20, 1–14. [Google Scholar] [CrossRef]
  10. Vilar, R.P.; Ikuma, K. Adsorption of urease as part of a complex protein mixture onto soil and its implications for enzymatic activity. Biochem. Eng. J. 2021, 171, 108026. [Google Scholar] [CrossRef]
  11. Carmona, J.P.; Oliveira, P.V.; Lemos, L. Biostabilization of a Sandy Soil Using Enzymatic Calcium Carbonate Precipitation. Procedia Eng. 2016, 143, 1301–1308. [Google Scholar] [CrossRef] [Green Version]
  12. Kavazanjian, E.; Hamdan, N. Enzyme induced carbonate precipitation (eicp) columns for ground improvement. In Proceedings of the IFCEE 2015, Antonio, TX, USA, 17–21 March 2015; pp. 2252–2261. [Google Scholar] [CrossRef]
  13. Neupane, D.; Yasuhara, H.; Kinoshita, N.; Unno, T. Applicability of Enzymatic Calcium Carbonate Precipitation as a Soil-Strengthening Technique. J. Geotech. Geoenviron. Eng. 2013, 139, 2201–2211. [Google Scholar] [CrossRef]
  14. Yasuhara, H.; Neupane, D.; Hayashi, K.; Okamura, M. Experiments and predictions of physical properties of sand cemented by enzymatically-induced carbonate precipitation. Soils Found. 2012, 52, 539–549. [Google Scholar] [CrossRef] [Green Version]
  15. Larson, A.D.; Kalion, R.E. Purification and properties of bacterial urease. J. Bacteriol. 1954, 68, 67–73. [Google Scholar] [CrossRef] [PubMed] [Green Version]
  16. Hoang, T.; Alleman, J.; Cetin, B.; Ikuma, K.; Choi, S.-G. Sand and silty-sand soil stabilization using bacterial enzyme–induced calcite precipitation (BEICP). Can. Geotech. J. 2019, 56, 808–822. [Google Scholar] [CrossRef]
  17. Hoang, T.; Alleman, J.; Cetin, B.; Choi, S.-G. Engineering Properties of Biocementation Coarse- and Fine-Grained Sand Catalyzed By Bacterial Cells and Bacterial Enzyme. J. Mater. Civ. Eng. 2020, 32, 04020030. [Google Scholar] [CrossRef]
  18. Fusi, P.; Ristori, G.; Calamai, L.; Stotzky, G. Adsorption and binding of protein on “clean” (homoionic) and “dirty” (coated with Fe oxyhydroxides) montmorillonite, illite and kaolinite. Soil Biol. Biochem. 1989, 21, 911–920. [Google Scholar] [CrossRef]
  19. Gianfreda, L.; Rao, M.A.; Violante, A. Invertase β-fructosidase)- Effects of montmorillonite, AL-hydroxide and AL(OH)x-montmorillonite on activity and kinetics properties. Soil Biol. Biochem. 1991, 23, 581–587. [Google Scholar] [CrossRef]
  20. Absolom, D.R.; Zingg, W.; Neumann, A.W. Protein adsorption to polymer particles: Role of surface properties. J. Biomed. Mater. Res. 1987, 21, 161–171. [Google Scholar] [CrossRef]
  21. Azioune, A.; Chehimi, M.M.; Miksa, B.; Basinska, T.; Slomkowski, S. Hydrophobic Protein−Polypyrrole Interactions: The Role of van der Waals and Lewis Acid−Base Forces As Determined by Contact Angle Measurements. Langmuir 2002, 18, 1150–1156. [Google Scholar] [CrossRef]
  22. Huang, Q.; Jiang, M.; Li, X. Adsorption and Properties of Urease Immobilized on Several Iron and Aluminum Oxides (Hydroxides) and Kaolinite. In Effect of Mineral-Organic-Microorganism Interactions on Soil and Freshwater Environments; Springer: Berlin/Heidelberg, Germany, 1999; pp. 167–168. [Google Scholar]
  23. Kim, J.; Somorjai, G.A. Molecular Packing of Lysozyme, Fibrinogen, and Bovine Serum Albumin on Hydrophilic and Hydrophobic Surfaces Studied by Infrared−Visible Sum Frequency Generation and Fluorescence Microscopy. J. Am. Chem. Soc. 2003, 125, 3150–3158. [Google Scholar] [CrossRef]
  24. Tilton, R.; Robertson, C.R.; Gast, A.P. Manipulation of hydrophobic interactions in protein adsorption. Langmuir 1991, 7, 2710–2718. [Google Scholar] [CrossRef]
  25. Tangpasuthadol, V.; Pongchaisirikul, N.; Hoven, V.P. Surface modification of chitosan films.: Effects of hydrophobicity on protein adsorption. Carbohydr. Res. 2003, 338, 937–942. [Google Scholar] [CrossRef]
  26. Wang, W.; Chen, L.; Zhang, Y.; Liu, G. Adsorption of bovine serum albumin and urease by biochar. In IOP Conference Series: Earth and Environmental Science; IOP Publishing: Bristol, UK, 2017; Volume 61, pp. 8–13. [Google Scholar] [CrossRef] [Green Version]
  27. Lu, J.; Su, T.; Thirtle, P.; Thomas, R.; Rennie, A.; Cubitt, R. The Denaturation of Lysozyme Layers Adsorbed at the Hydrophobic Solid/Liquid Surface Studied by Neutron Reflection. J. Colloid Interface Sci. 1998, 206, 212–223. [Google Scholar] [CrossRef] [PubMed]
  28. Onweremadu, E.U. Hydrophobicity of soils formed over different lithologies. Malasyan J. Soil Sci. 2008, 12, 19–30. [Google Scholar]
  29. Hallett, P.; Baumgartl, T.; Young, I. Subcritical Water Repellency of Aggregates from a Range of Soil Management Practices. Soil Sci. Soc. Am. J. 2001, 65, 184–190. [Google Scholar] [CrossRef]
  30. Dekker, L.W.; Ritsema, C.J. How water moves in a water repellent sandy soil: 1. Potential and actual water repellency. Water Resour. Res. 1994, 30, 2507–2517. [Google Scholar] [CrossRef]
  31. Dekker, L.W.; Doerr, S.H.; Oostindie, K.; Ziogas, A.K.; Ritsema, C.J. Water Repellency and Critical Soil Water Content in a Dune Sand. Soil Sci. Soc. Am. J. 2001, 65, 1667–1674. [Google Scholar] [CrossRef]
  32. Jaramillo, D.F.; Dekker, L.W.; Ritsema, C.J.; Hendrickx, J.M.H. Soil water repellency in arid and humid climates. Soil Water Repel. Occur. Conseq. Amelior. 2003, 232, 93–98. [Google Scholar] [CrossRef]
  33. Roberts, F.; Carbon, B. Water repellence in sandy soils of South-Western Australia. II. Some chemical characteristics of the hydrophobic skins. Soil Res. 1972, 10, 35–42. [Google Scholar] [CrossRef]
  34. Jaramillo, D.F.; Herrón, F.E. Evaluacion de la repelencia al agua de algunos andisols de antioquia bajo cobertura de Pinus patula. Acta Agron. 1991, 4, 79–85. [Google Scholar]
  35. Debano, L.F.; Krammes, J.S. Water repellent soils and their relation to wildfire temperatures. Int. Assoc. Sci. Hydrol. Bull. 1966, 11, 14–19. [Google Scholar] [CrossRef]
  36. Doerr, S.; Shakesby, R.; Walsh, R. Soil water repellency: Its causes, characteristics and hydro-geomorphological significance. Earth-Sci. Rev. 2000, 51, 33–65. [Google Scholar] [CrossRef]
  37. McHale, G.; Newton, M.I.; Shirtcliffe, N.J. Water-repellent soil and its relationship to granularity, surface roughness and hydrophobicity: A materials science view. Eur. J. Soil Sci. 2005, 56, 445–452. [Google Scholar] [CrossRef] [Green Version]
  38. Osborn, J.F.; Pelishek, R.E.; Krammes, J.S.; Letey, J. Soil Wettability as a Factor in Erodibility. Soil Sci. Soc. Am. J. 1964, 28, 294–295. [Google Scholar] [CrossRef]
  39. Jungerius, P.; van der Meulen, F. Erosion processes in a dune landscape along the Dutch coast. Catena 1988, 15, 217–228. [Google Scholar] [CrossRef]
  40. Lowe, M.-A.; McGrath, G.; Leopold, M. The Impact of Soil Water Repellency and Slope upon Runoff and Erosion. Soil Tillage Res. 2021, 205, 104756. [Google Scholar] [CrossRef]
  41. Almajed, A.; Lemboye, K.; Arab, M.G.; Alnuaim, A. Mitigating wind erosion of sand using biopolymer-assisted EICP technique. Soils Found. 2020, 60, 356–371. [Google Scholar] [CrossRef]
  42. Chae, S.H.; Chung, H.; Nam, K. Evaluation of microbially Induced calcite precipitation (MICP) methods on different soil types for wind erosion control. Environ. Eng. Res. 2020, 26, 123–128. [Google Scholar] [CrossRef]
  43. Jiang, X.; Rutherford, C.; Cetin, B.; Ikuma, K. Reduction of Water Erosion Using Bacterial Enzyme Induced Calcite Precipitation (BEICP) for Sandy Soil. In Proceedings of the Geo-Congress 2020 Biogeotechnics, Reston, VA, USA; 2020; pp. 104–110. [Google Scholar] [CrossRef]
  44. Jiang, N.-J.; Soga, K. The applicability of microbially induced calcite precipitation (MICP) for internal erosion control in gravel–sand mixtures. Géotechnique 2017, 67, 42–53. [Google Scholar] [CrossRef] [Green Version]
  45. Gianfreda, L.; Rao, M.A.; Violante, A. Adsorption, activity and kinetic properties of urease on montmorillonite, aluminium hydroxide and AL(OH)x-montmorillonite complexes. Soil Biol. Biochem. 1992, 24, 51–58. [Google Scholar] [CrossRef]
  46. Artioli, Y. Adsorption. In Encyclopedia of Ecology; Elsevier: Amsterdam, The Netherlands, 2008; pp. 60–65. [Google Scholar]
  47. Hoeve, C.A.J.; DiMarzio, E.A.; Peyser, P. Adsorption of Polymer Molecules at Low Surface Coverage. J. Chem. Phys. 1965, 42, 2558–2563. [Google Scholar] [CrossRef]
  48. Larsericsdotter, H.; Oscarsson, S.; Buijs, J. Thermodynamic Analysis of Proteins Adsorbed on Silica Particles: Electrostatic Effects. J. Colloid Interface Sci. 2001, 237, 98–103. [Google Scholar] [CrossRef] [PubMed]
  49. Norde, W.; Favier, J.P. Structure of adsorbed and desorbed proteins. Colloids Surfaces 1992, 64, 87–93. [Google Scholar] [CrossRef]
  50. Norde, W.; Giacomelli, C. BSA structural changes during homomolecular exchange between the adsorbed and the dissolved states. J. Biotechnol. 2000, 79, 259–268. [Google Scholar] [CrossRef]
  51. Norde, W.; Giacomelli, C.E. Conformational changes in proteins at interfaces: From solution to the interface, and back. Macromol. Symp. 1999, 145, 125–136. [Google Scholar] [CrossRef]
  52. Gianfreda, L.; Rao, M.A.; Violante, A. Formation and Activity of Urease-Tannate Complexes Affected by Aluminum, Iron, and Manganese. Soil Sci. Soc. Am. J. 1995, 59, 805–810. [Google Scholar] [CrossRef]
  53. Gianfreda, L.; De Cristofaro, A.; Rao, M.A.; Violante, A. Kinetic Behavior of Synthetic Organo-and Organo-Mineral-Urease Complexes. Soil Sci. Soc. Am. J. 1995, 59, 811–815. [Google Scholar] [CrossRef]
  54. He, S.; Feng, Y.; Ren, H.; Zhang, Y.; Gu, N.; Lin, X. The impact of iron oxide magnetic nanoparticles on the soil bacterial community. J. Soils Sediments 2011, 11, 1408–1417. [Google Scholar] [CrossRef]
  55. Rabe, M.; Verdes, D.; Seeger, S. Understanding protein adsorption phenomena at solid surfaces. Adv. Colloid Interface Sci. 2011, 162, 87–106. [Google Scholar] [CrossRef] [Green Version]
  56. Bordbar, A.-K.; Sohrabi, N.; Hojjati, E. The estimation of the hydrophobic and electrostatic contributions to the free energy change upon cationic surfactants binding to Jack bean urease. Colloids Surf. B Biointerfaces 2004, 39, 171–175. [Google Scholar] [CrossRef]
  57. Tipping, E.; Jones, M.N.; Skinner, H.A. Enthalpy of interaction between some globular proteins and sodium n-dodecyl sulphate in aqueous solution. J. Chem. Soc. Faraday Trans. 1 Phys. Chem. Condens. Phases 1974, 70, 1306–1315. [Google Scholar] [CrossRef]
  58. Bordbar, A.-K. Thermodynamic Analysis for Cationic Surfactants Binding to Bovine Serum Albumin. J. Phys. Theor. Chem. 2006, 2, 197–204. [Google Scholar] [CrossRef]
  59. Takishima, K.; Suga, T.; Mamiya, G. The structure of jack bean urease. The complete amino acid sequence, limited proteolysis and reactive cysteine residues. JBIC J. Biol. Inorg. Chem. 1988, 175, 151–157. [Google Scholar] [CrossRef]
  60. Kuscu, I.S.K.; Cetin, M.; Yigit, N.; Savaci, G.; Sevik, H. Relationship between Enzyme Activity (Urease-Catalase) and Nutrient Element in Soil Use. Pol. J. Environ. Stud. 2018, 27, 2107–2112. [Google Scholar] [CrossRef]
  61. Christians, S.; Kaltwasser, H. Nickel-content of urease from Bacillus pasteurii. Arch. Microbiol. 1986, 145, 51–55. [Google Scholar] [CrossRef]
  62. Kuo, J.F.; Angeles, L. Further Investigation of the Surface Charge Properties of Oxide Surfaces in Oil-Bearing Sands and Sandstones. J. Colloid. 1987, 115, 9–16. [Google Scholar] [CrossRef]
  63. Xia, J.; Wishart, D.S. Metabolomic data processing, analysis, and interpretation using MetaboAnalyst. Curr. Protoc. Bioinform. 2011, 34. [Google Scholar] [CrossRef]
  64. Garwood, G.; Mortland, M.; Pinnavaia, T. Immobilization of glucose oxidase on montmorillonite clay: Hydrophobic and ionic modes of binding. J. Mol. Catal. 1983, 22, 153–163. [Google Scholar] [CrossRef]
  65. Quiquampoix, H.; Abadie, J.; Baron, M.H.; Leprince, F.; Matumoto-Pintro, P.T.; Ratcliffe, R.G.; Staunton, S. Mechanisms and Consequences of Protein Adsorption on Soil Mineral Surfaces. In Proteins at Interfaces II; ACS Symposium Series; American Chemical Society, ACS: Washington, DC, USA, 1995; pp. 321–333. Available online: https://0-pubs-acs-org.brum.beds.ac.uk/doi/abs/10.1021/bk-1995-0602.ch023 (accessed on 9 January 2022).
  66. Lahari, C.; Jasti, L.S.; Fadnavis, N.W.; Sontakke, K.; Ingavle, G.; Deokar, S.; Ponrathnam, S. Adsorption Induced Enzyme Denaturation: The Role of Polymer Hydrophobicity in Adsorption and Denaturation of α-Chymotrypsin on Allyl Glycidyl Ether (AGE)-Ethylene Glycol Dimethacrylate (EGDM) Copolymers. Langmuir 2010, 26, 1096–1106. [Google Scholar] [CrossRef]
  67. Hirai, M.; Kawai-Hirai, R.; Hirai, T.; Ueki, T. Structural change of jack bean urease induced by addition surfactants studied with synchrotron-radiation small-angle X-ray scattering. JBIC J. Biol. Inorg. Chem. 1993, 215, 55–61. [Google Scholar] [CrossRef]
  68. Contaxis, C.; Reithel, F. Studies on Protein Multimers: II. A Study of the Mechanism OF Urease Dissociation in 1, 2-Propanediol: Comparative Studies with Ethylene Glycol and Glycerol. J. Biol. Chem. 1971, 246, 677–685. [Google Scholar] [CrossRef]
  69. dos Santos, E.A.; Farina, M.; Soares, G.A.; Anselme, K. Surface energy of hydroxyapatite and β-tricalcium phosphate ceramics driving serum protein adsorption and osteoblast adhesion. J. Mater. Sci. Mater. Med. 2008, 19, 2307–2316. [Google Scholar] [CrossRef]
  70. Dufrêne, Y.F.; Marchal, T.G.; Rouxhet, P.G. Influence of Substratum Surface Properties on the Organization of Adsorbed Collagen Films: In Situ Characterization by Atomic Force Microscopy. Langmuir 1999, 15, 2871–2878. [Google Scholar] [CrossRef]
  71. Benjamin, M.M.; Sletten, R.S.; Bailey, R.P.; Bennett, T. Sorption and filtration of metals using iron-oxide-coated sand. Water Res. 1996, 30, 2609–2620. [Google Scholar] [CrossRef]
  72. Olorunfemi, I. Soil Hydrophobicity: An Overview. J. Sci. Res. Rep. 2014, 3, 1003–1037. [Google Scholar] [CrossRef]
  73. Rahmatullah, M.; Boyde, T. Improvements in the determination of urea using diacetyl monoxime; methods with and without deproteinisation. Clin. Chim. Acta 1980, 107, 3–9. [Google Scholar] [CrossRef]
  74. Kandhavelu, J.; Demonte, N.L.; Namperumalsamy, V.P.; Prajna, L.; Thangavel, C.; Jayapal, J.M.; Kuppamuthu, D. Data set of Aspergillus flavus induced alterations in tear proteome: Understanding the pathogen-induced host response to fungal infection. Data Brief 2016, 9, 888–894. [Google Scholar] [CrossRef]
  75. UniProt Consortium. UniProt: A worldwide hub of protein knowledge. Nucleic Acids Res. 2019, 47, D506–D515. [Google Scholar] [CrossRef] [Green Version]
Figure 1. The surface coverage for samples containing sand, mixtures of sand and iron-coated sand (“iron”), and mixtures of sand and hydrophobic-coated sand (“HF”). The initial protein concentration used was 4 mg/mL, with a ratio of 2 mg protein per gram of soil. Surface coverage was calculated by normalizing the amount of total protein adsorbed by the total surface area of each sample. Values shown are averages of three replicates and error bars represent the standard error.
Catalysts 12 00230 g001
Figure 2. The percentage of overall protein adsorbed, and urease adsorbed, from the initial total protein extract. The total amount of adsorbed proteins was obtained through Nanodrop measurements at 280 nm wavelengths before and after adsorption. Urease concentrations were obtained from targeted PRM LC/MS analysis. Results shown are the averages of three and two independent experiments for the % adsorbed urease and % total proteins adsorbed, respectively. Error bars represent the standard error.
Catalysts 12 00230 g002
Figure 3. A score plot for all proteins present in the initial total protein extract and in supernatant portions of samples following adsorption. The score plot employs the orthogonal projections to latent structures discriminant analysis (OPLS-DA) modeling method and was developed through the MetaboAnalyst online tool [63]. Displayed regions reflect a 95% confidence interval. Prior to analysis, the data was log transformed and auto-scaled (mean centered and divided by the standard deviation of each variable). Sand = uncoated sand; Protein = initial protein sample; I10, I20, I100 = 10, 20, and 100% iron-coated sand, respectively; H10, H20, H100 = 10, 20, and 100% hydrophobic sand, respectively.
Catalysts 12 00230 g003
Figure 4. Urease activity yield upon adsorption. Activity yield was calculated as the % of activity of adsorbed urease in each soil mixture normalized to the activity urease in the initial total protein extract. Data shown represent the average of three independent experiments, with error bars indicating one standard error.
Catalysts 12 00230 g004
Publisher’s Note: MDPI stays neutral with regard to jurisdictional claims in published maps and institutional affiliations.

