Article

Transcription Factor β-Catenin Plays a Key Role in Fluid Flow Shear Stress-Mediated Glomerular Injury in Solitary Kidney

by
Tarak Srivastava
1,2,3,*,
Daniel P. Heruth
4,
R. Scott Duncan
5,
Mohammad H. Rezaiekhaligh
1,
Robert E. Garola
6,
Lakshmi Priya
1,
Jianping Zhou
2,7,
Varun C. Boinpelly
2,7,
Jan Novak
8,
Mohammed Farhan Ali
1,
Trupti Joshi
9,10,11,12,
Uri S. Alon
1,
Yuexu Jiang
10,11,
Ellen T. McCarthy
13,
Virginia J. Savin
7,
Ram Sharma
7,
Mark L. Johnson
3 and
Mukut Sharma
2,7,13
1
Section of Nephrology, Children’s Mercy Hospital and University of Missouri at Kansas City, Kansas City, MO 64108, USA
2
Midwest Veterans’ Biomedical Research Foundation (MVBRF), Kansas City, MO 64128, USA
3
Department of Oral and Craniofacial Sciences, School of Dentistry, University of Missouri at Kansas City, Kansas City, MO 64108, USA
4
Children’s Mercy Research Institute, Children’s Mercy Hospital and University of Missouri at Kansas City, Kansas City, MO 64108, USA
5
School of Biological Sciences, University of Missouri at Kansas City, Kansas City, MO 64108, USA
6
Department of Pathology and Laboratory Medicine, Children’s Mercy Hospital and University of Missouri at Kansas City, Kansas City, MO 64108, USA
7
Kansas City VA Medical Center, Kansas City, MO 64128, USA
8
Department of Microbiology, University of Alabama at Birmingham, Birmingham, AL 35487, USA
9
Department of Health Management and Informatics, University of Missouri, Columbia, MO 65211, USA
10
Department of Electrical Engineering and Computer Science, University of Missouri, Columbia, MO 65211, USA
11
Christopher S. Bond Life Sciences Center, University of Missouri, Columbia, MO 65211, USA
12
MU Data Science and Informatics Institute, University of Missouri, Columbia, MO 65211, USA
13
Department of Internal Medicine, The Jared Grantham Kidney Institute, University of Kansas Medical Center, Kansas City, KS 66160, USA
*
Author to whom correspondence should be addressed.
Submission received: 21 April 2021 / Revised: 6 May 2021 / Accepted: 14 May 2021 / Published: 19 May 2021

Abstract

:
Increased fluid flow shear stress (FFSS) in solitary kidney alters podocyte function in vivo. FFSS-treated cultured podocytes show upregulated AKT-GSK3β-β-catenin signaling. The present study was undertaken to confirm (i) the activation of β-catenin signaling in podocytes in vivo using unilaterally nephrectomized (UNX) TOPGAL mice with the β-galactosidase reporter gene for β-catenin activation, (ii) β-catenin translocation in FFSS-treated mouse podocytes, and (iii) β-catenin signaling using publicly available data from UNX mice. The UNX of TOPGAL mice resulted in glomerular hypertrophy and increased the mesangial matrix consistent with hemodynamic adaptation. Uninephrectomized TOPGAL mice showed an increased β-galactosidase expression at 4 weeks but not at 12 weeks, as assessed using immunofluorescence microscopy (p < 0.001 at 4 weeks; p = 0.16 at 12 weeks) and X-gal staining (p = 0.008 at 4 weeks; p = 0.65 at 12 weeks). Immunofluorescence microscopy showed a significant increase in phospho-β-catenin (Ser552, p = 0.005) at 4 weeks but not at 12 weeks (p = 0.935) following UNX, and the levels of phospho-β-catenin (Ser675) did not change. In vitro FFSS caused a sustained increase in the nuclear translocation of phospho-β-catenin (Ser552) but not phospho-β-catenin (Ser675) in podocytes. The bioinformatic analysis of the GEO dataset, #GSE53996, also identified β-catenin as a key upstream regulator. We conclude that transcription factor β-catenin mediates FFSS-induced podocyte (glomerular) injury in solitary kidney.

1. Introduction

Persistent hyperfiltration is one of the major causes of a loss of glomerular function and the progression of chronic kidney disease (CKD), but the underlying mechanism is not well understood. Hemodynamic parameters, including renal blood flow, glomerular capillary pressure (PGC), single nephron glomerular filtration rate (SNGFR), filtration fraction, and decreased hydraulic conductivity associated with glomerular hypertrophy, have been used to study hyperfiltration, leading to a detailed analysis of these parameters [1,2]. Our laboratory and a few other groups have recently started investigating biomechanical forces that mediate the effects of hyperfiltration in the glomerulus [3,4,5,6].
Two types of biomechanical forces are believed to mediate the effects of hyperfiltration on glomerular function and structure, namely, tensile stress and fluid flow shear stress (FFSS), which were recently reviewed by Srivastava et al. [5,6]. Podocytes localized in Bowman’s space are most vulnerable to increased biomechanical forces [7,8,9]. Primary processes from the large soma of podocytes further branch into foot processes covering the glomerular basement membrane around the capillary and interdigitate to form slit pore junctions. The increased intra-capillary pressure, working outwardly perpendicular to the direction of blood flow in the capillary, stretches foot processes and generates tensile stress on the basolateral aspect of podocytes [5]. The second biomechanical force, FFSS, is generated on podocyte soma and primary processes by the glomerular ultrafiltrate flowing through Bowman’s space [5,7]. Thus, PGC and SNGFR become the principal determinants of tensile stress and FFSS, respectively [5,6]. We have shown a 1.5–2.0-fold increase in the calculated FFSS over podocytes in solitary kidney in mice and rats [9].
The in vitro application of FFSS to podocytes resulted in an altered actin cytoskeleton, increased the secretion of prostaglandin E2 (PGE2), and increased the expression of cyclooxygenase (COX)2 and PGE2 receptor EP2, but not EP4 [10,11,12]. Additionally, we demonstrated an upregulated COX2-PGE2-EP2 axis with an unchanged EP4 expression in unilaterally nephrectomized (UNX) mice, as well as an elevated urinary PGE2 in children born with solitary kidney [10,13]. These findings established the significance of the COX2-PGE2-EP2 axis in mediating the mechanoreception of FFSS by podocytes.
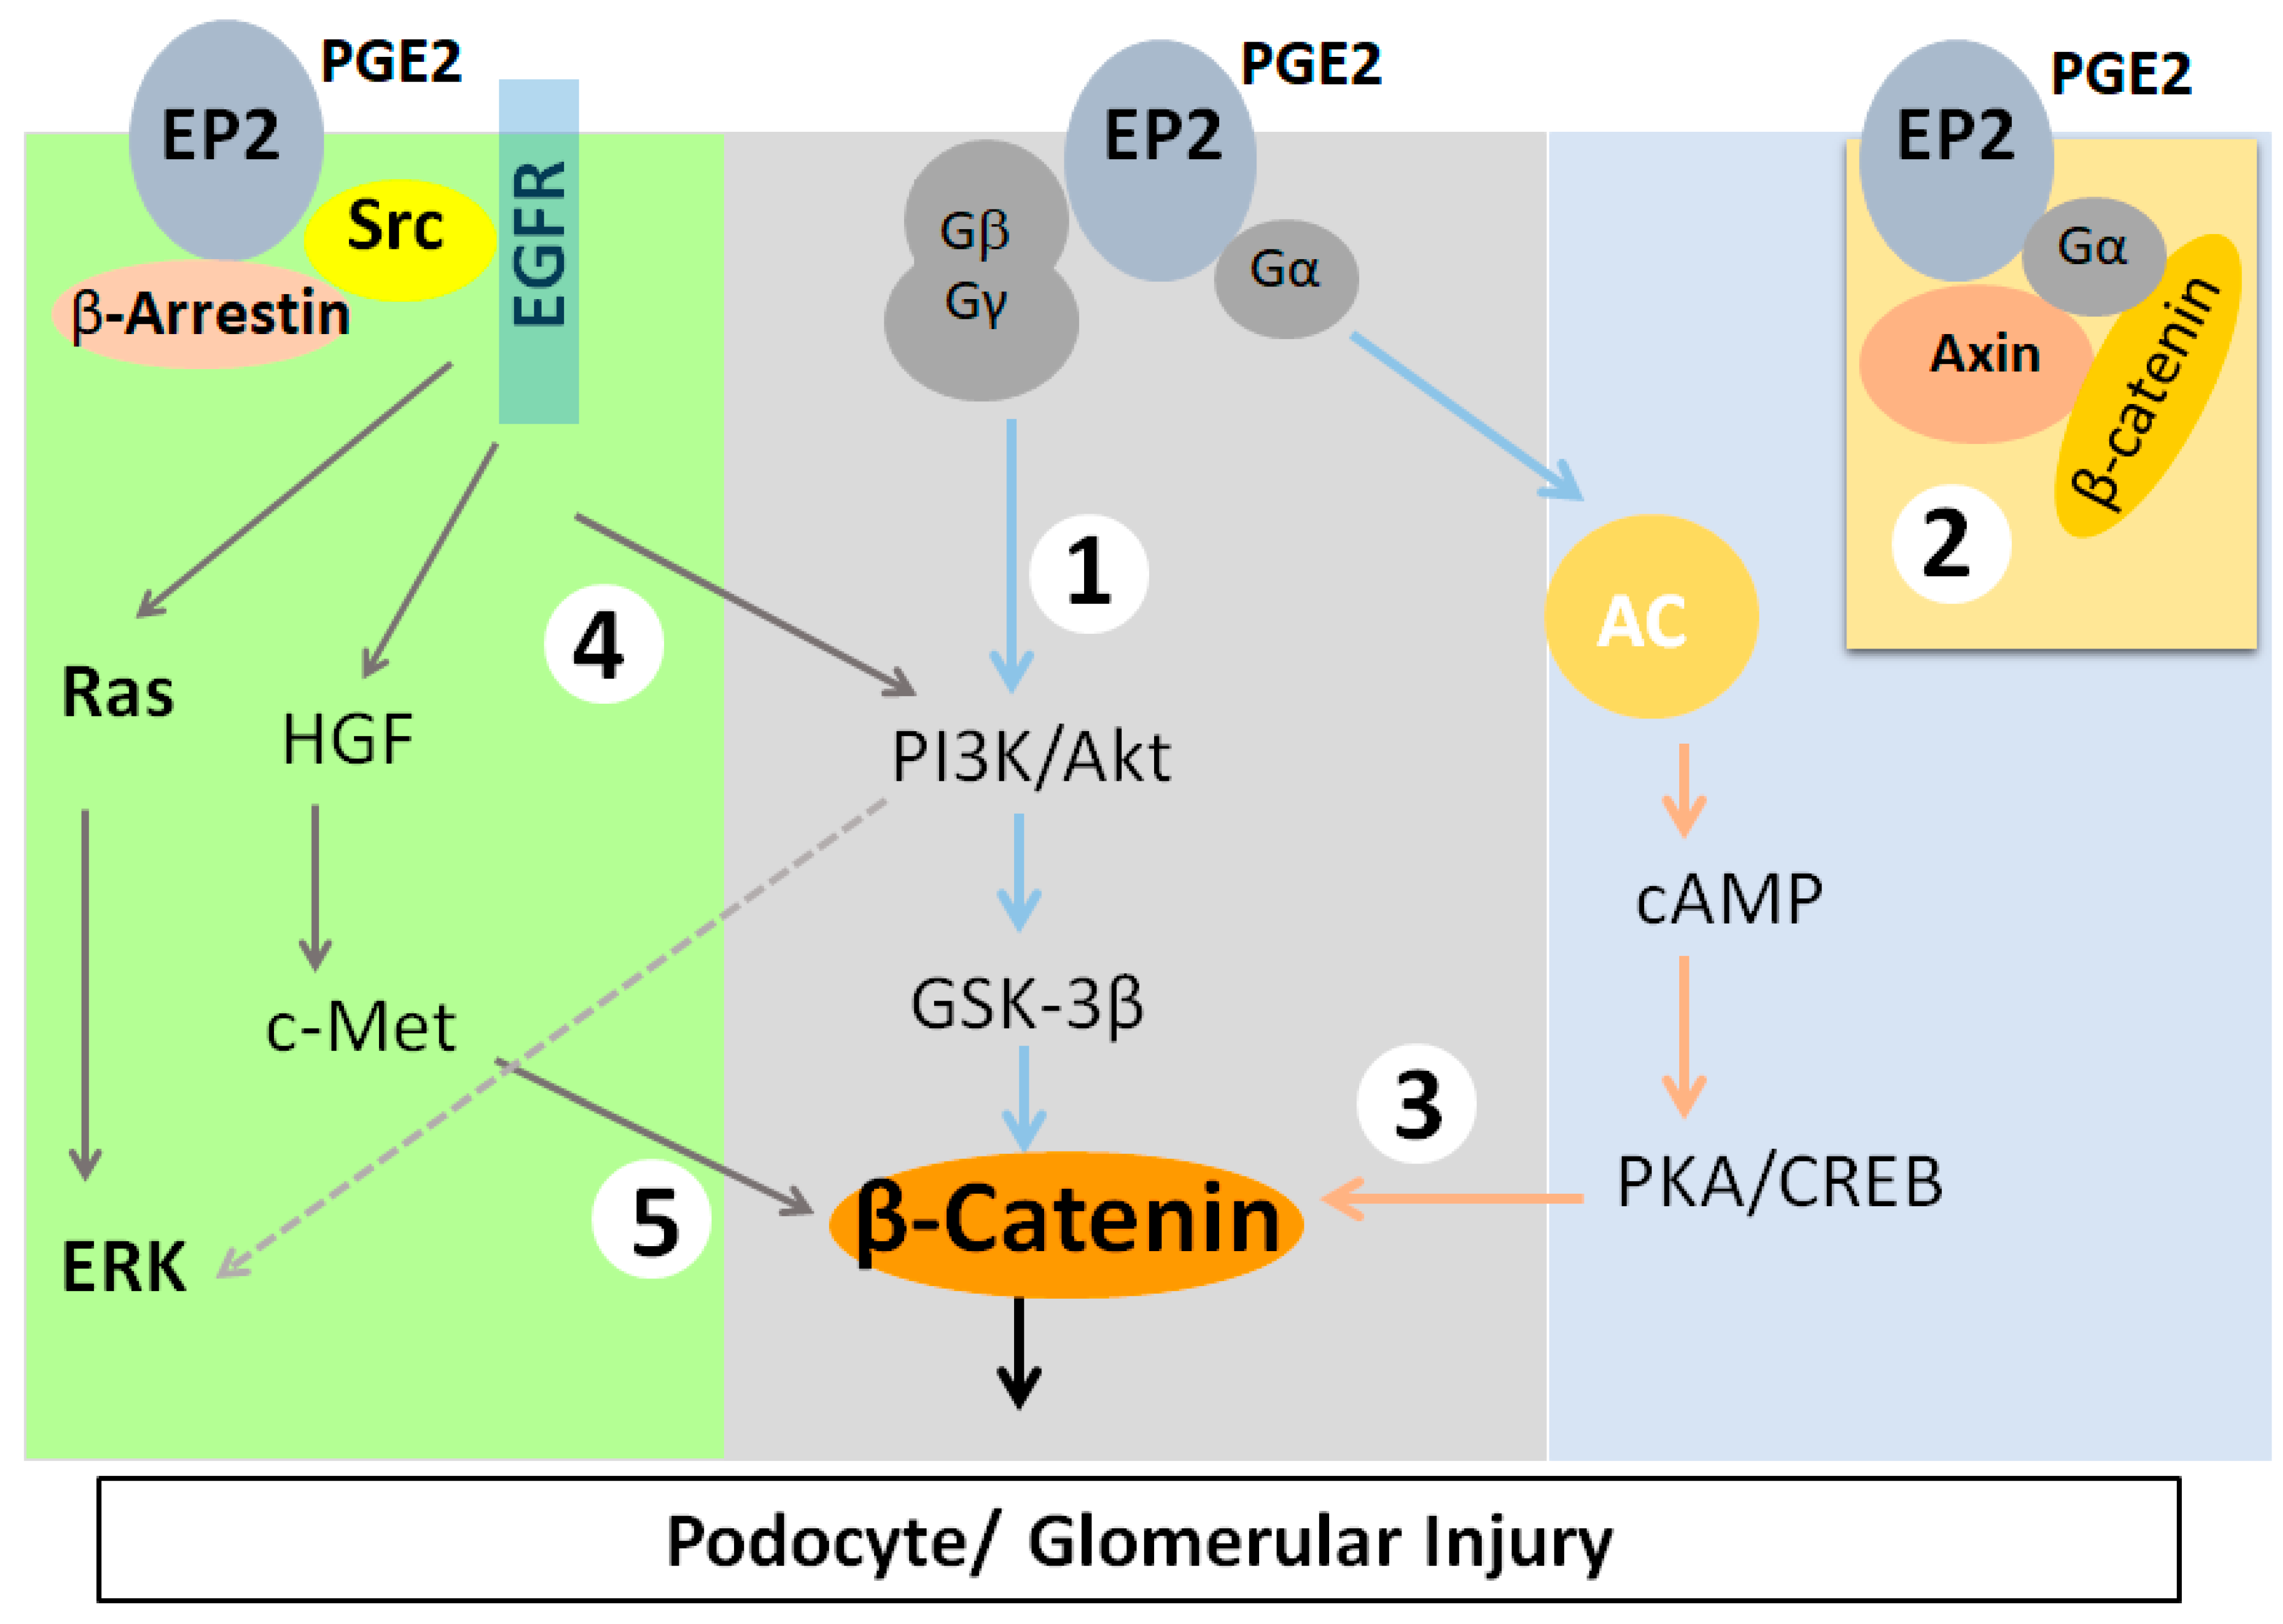
PGE2 binding with EP2 receptor results in signaling events that induce β-catenin translocation to the nucleus (Figure 1). Bioinformatics analysis to address the mechanotransduction that converts mechanical stimuli into biochemical changes identified Glycogen Synthase Kinase-3β (GSK3β) using Kinase enrichment analysis and Protein Kinase B (AKT1), GSK3β, and β-catenin through protein–protein interaction network analysis. Validation of these analyses using immortalized mouse podocytes led to the conclusion that AKT-GSK3β-β-catenin signaling plays a key role in podocyte response to FFSS in vitro [14,15].
Intracellular levels of β-catenin, a transcription factor, are normally kept low by the association of phosphorylated β-catenin with a degradation complex that targets it to the ubiquitin-proteasome degradation pathway in the absence of Wnt ligand. In the presence of Wnt bound to membrane receptor complex (LRP5/6 and frizzled), it is released from the degradation complex for translocation to the nucleus. Phosphorylation by Casein Kinase at Ser45, followed by GSK3β, at Ser33, Ser37, and Thr41 directs β-catenin for degradation, whereas phosphorylation by AKT at Ser552 and by Protein Kinase A (PKA) at Ser675 results in the nuclear translocation of β-catenin [16,17,18]. Activated β-catenin signaling has been identified in Adriamycin-induced podocyte injury and albuminuria, oxidative stress-induced podocyte dysfunction, diabetic nephropathy, and focal segmental glomerulosclerosis [19,20]. The significance of β-catenin in solitary kidney injury and dysfunction is not known.
The present studies were undertaken to assess and confirm the upregulation of AKT-GSK3β-β-catenin signaling using a mouse model of UNX. We performed UNX in TOPGAL mice, a specific reporter mouse line with β-galactosidase activity as a direct in vivo readout for activated β-catenin signaling [21]. The increased FFSS in solitary kidney following UNX resulted in the activation of β-catenin in TOPGAL mice. Next, we carried out in vitro experiments using cultured podocytes, which demonstrated phosphorylation of β-catenin at Ser552 as the main driver of β-catenin nuclear translocation. Additionally, we analyzed the publicly available datasets in the gene expression omnibus (GEO) database repository, which showed an upregulation of AKT-GSK3β-β-catenin in solitary kidney following UNX in mice [22,23]. Thus, studies using in vivo UNX TOPGAL mice, cultured podocytes in vitro, and bioinformatic data analysis on UNX mice provide combined evidence supporting our original in vitro findings and a better understanding of the molecular events associated with hyperfiltration-induced glomerular injury in solitary kidney.

2. Materials and Methods

2.1. Unilateral Nephrectomy of TOPGAL Mice

Animal studies involving TOPGAL mice were carried out using protocols approved by the Institutional Animal Care and Use Committee (IACUC), Institutional Biosafety Committee/Subcommittee on Research Safety (IBC/SRS), and the Research and Development (R&D) Committee at the VA Medical Center, Kansas City, MO. The study was carried out in compliance with the ARRIVE guidelines. All methods were performed in accordance with the relevant guidelines and regulations. The mice were maintained at AAALAC-approved facilities with unrestricted access to food and water under light/dark cycles of 12/12 h. The TOPGAL [Tg(TCF/Lef1-lacZ)34Efu] mouse carries a lacZ transgene on a CD1 background (Stock #4623, The Jackson Laboratory, Bar Harbor, ME, USA). The transgene contains the lacZ gene under the control of a promoter consisting of three consensus lymphoid enhancer binding factor 1/transcription factor 3 (LEF/TCF)-binding motifs upstream of a minimal Fos promoter [21]. This allele is responsive to canonical Wnt/β-catenin signal transduction. Thus, the TOPGAL mouse is a specific reporter strain, with β–galactosidase activity as a direct in vivo readout for activated β–catenin signaling.
Four-week-old TOPGAL mice (n = 47) underwent unilateral nephrectomy (UNX) to remove the right kidney (UNX) or sham operation (Sham). The animals recovered in their cages following the surgery, and the left kidney was harvested for analysis at 4 or 12 weeks following UNX. The day prior to the harvesting of the kidneys, urine was collected for urine albumin and creatinine measurements. At the time of the tissue retrieval, an intracardiac perfusion was performed with ice cold 4%PFA in PBS (pH 7.8) for 10 min at 4.4 mL/min, followed by ice cold 18% sucrose in PBS (pH 7.8) for 10 min at 4.4 mL/min. The fixative solutions were prepared and filtered to remove small particles which otherwise may block the capillaries. The resected kidney was then incubated overnight in 30% sucrose in PBS (pH 7.8) on ice [24]. A part of the kidney was embedded in optimal cutting temperature compound (OCT) and flash frozen in liquid nitrogen. A part of the kidney was fixed in 10% formalin, processed, and embedded in paraffin.

2.2. Urine Albumin and CREATININE

Urine albumin was measured in triplicates using an Albuwell M kit (#1011, Exocell Inc., Philadelphia, PA, USA), following the manufacturer’s instructions. Urine creatinine was measured in duplicates using a companion creatinine kit (#1012, Exocell Inc., Philadelphia, PA, USA), following the manufacturer’s instructions.

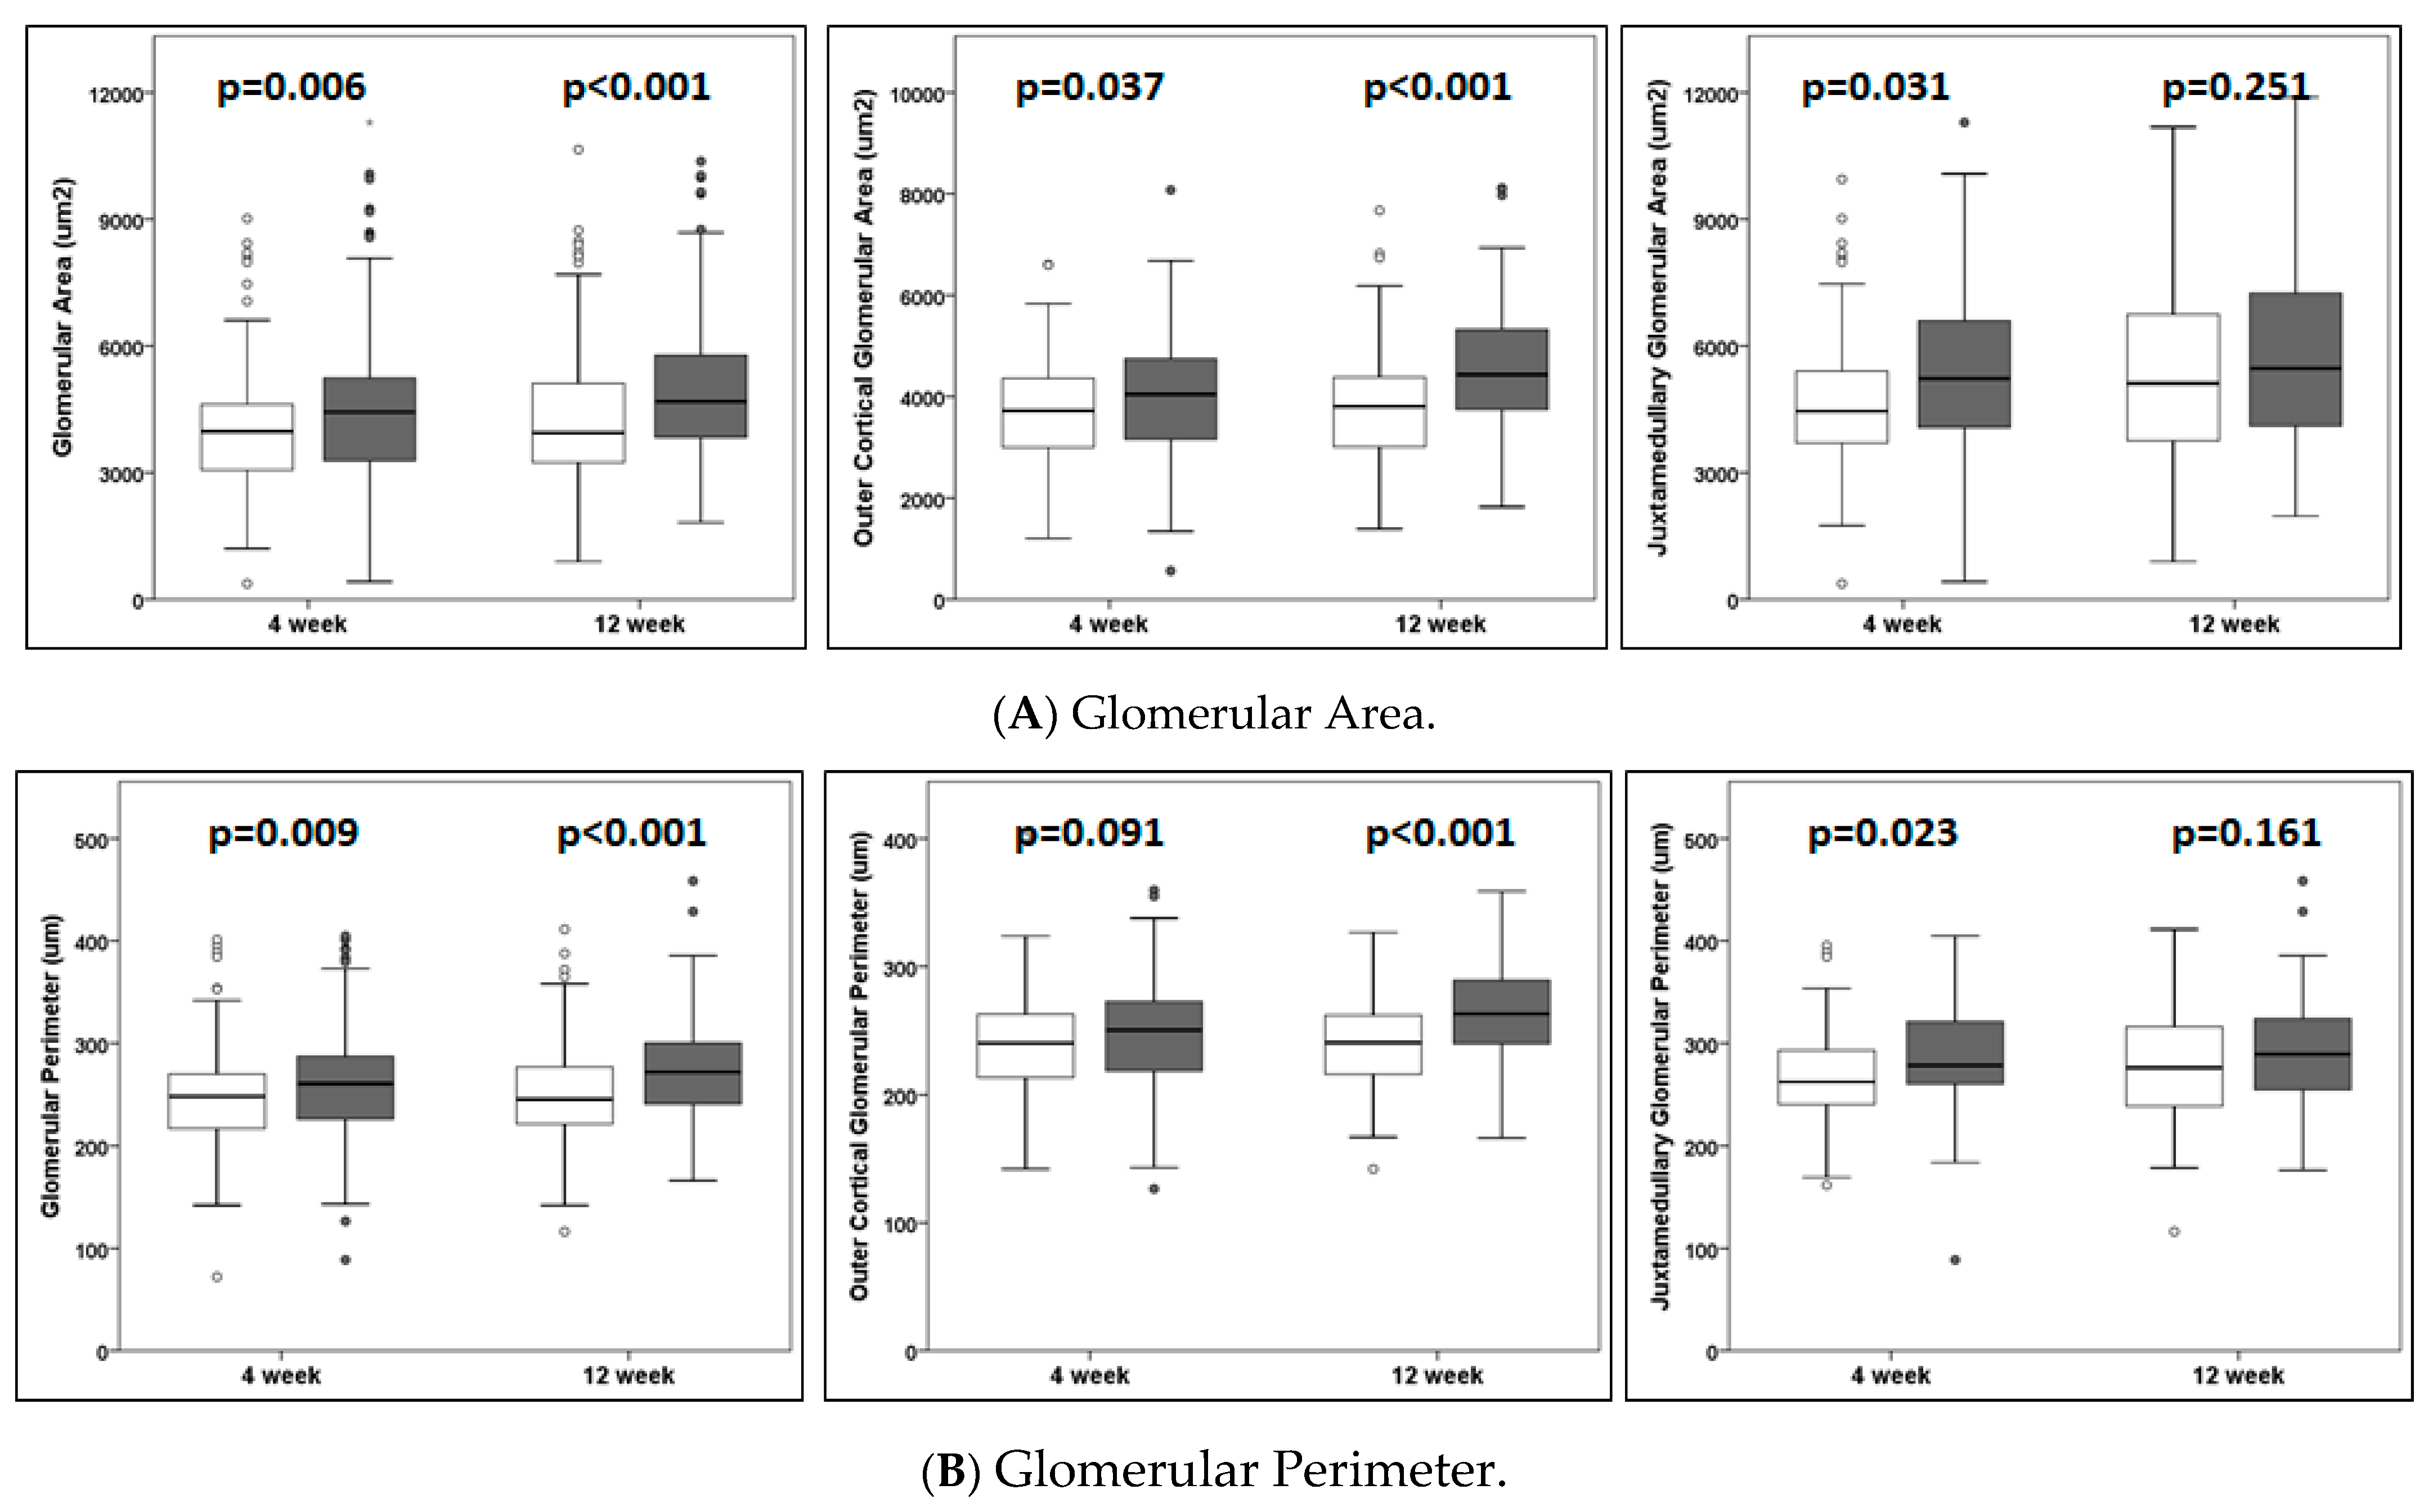
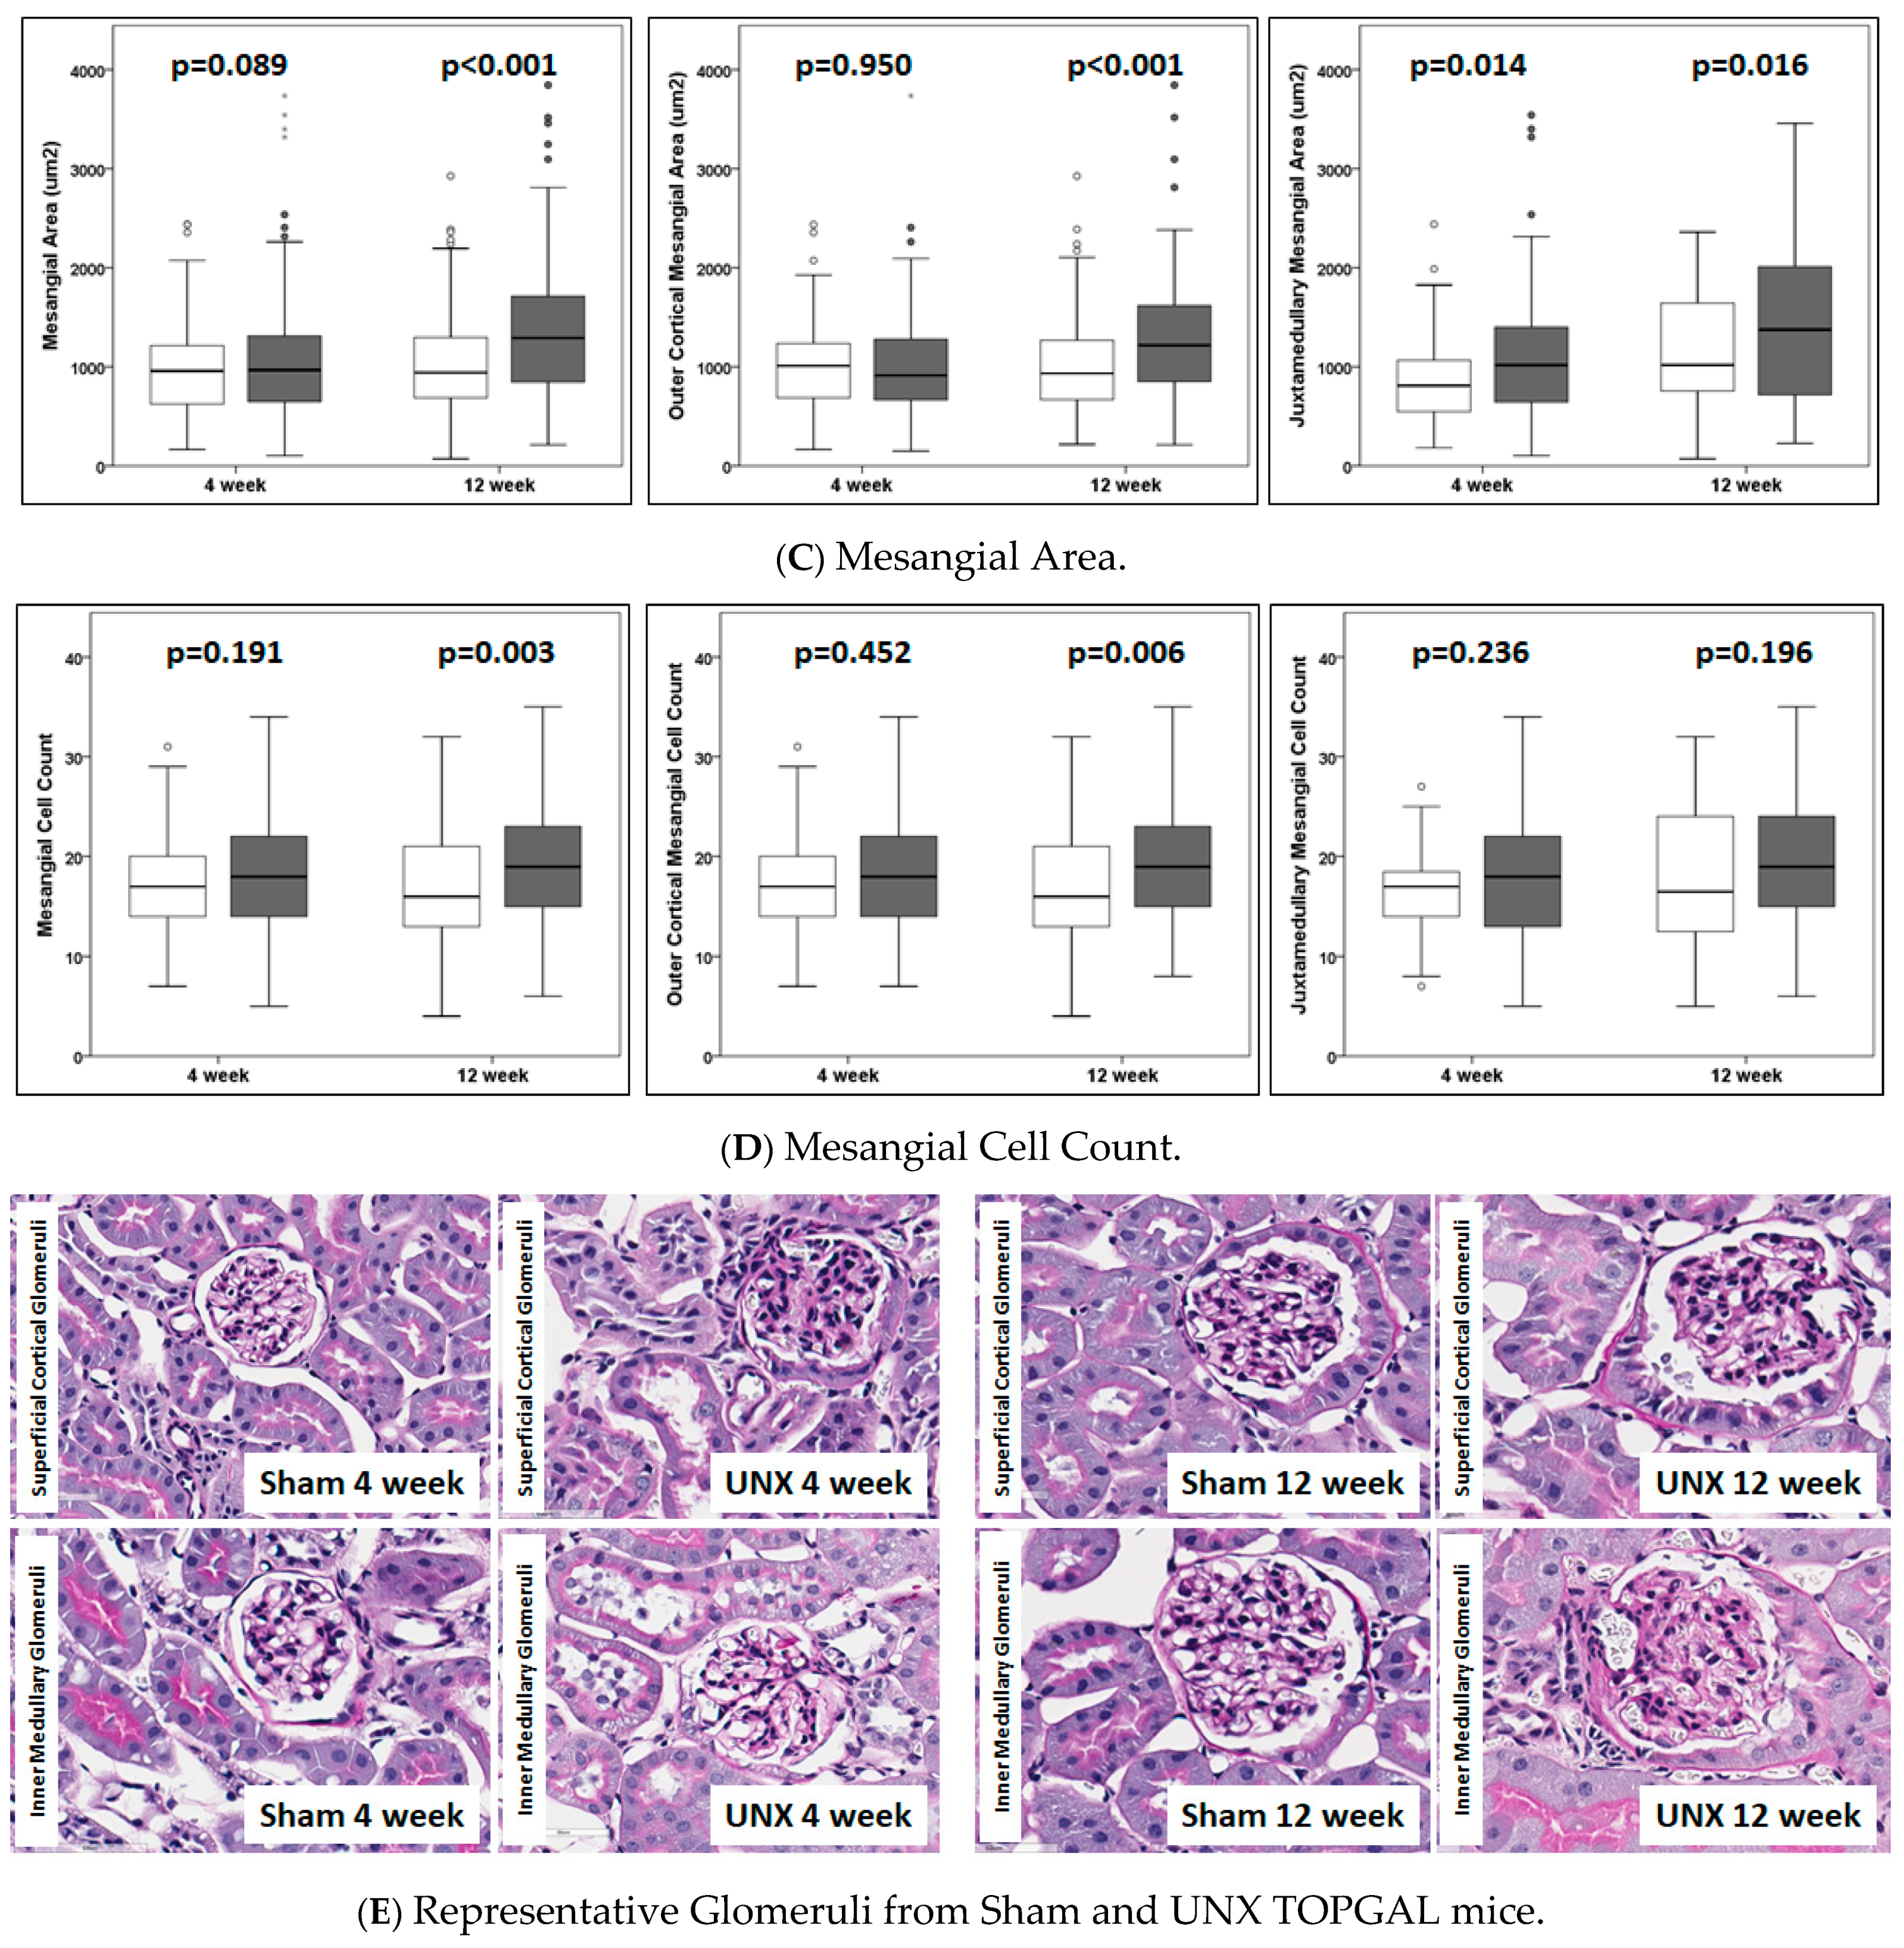
2.3. Morphometric Analysis of Glomeruli in the TOPGAL Mouse Kidney

Paraffin-embedded tissue was sectioned at 3–5 μm and stained with Periodic Acid-Schiff (PAS) stain. PAS-stained kidney sections were evaluated for glomerular characteristics, including the size, mesangial matrix, and mesangial cell count. The glomerular area and perimeter included only the glomerular tufts and not the Bowman’s space or the parietal epithelial cells. The mesangial area included the PAS-stained matrix and cells. The mesangial cell counts were derived from the most proliferative mesangial stalk of each glomerulus, but not immediately adjacent to a vascular stalk. The counts were taken from cross sections and not the longitudinal section of the stalk, as described by Roberts et al. [25]. Images were obtained using an Olympus BX60 (Hamburg, Germany) for light microscopy and analyzed using the Image J software suite (National Institute of Health and the Laboratory for Optical and Computational Instrumentation at the University of Wisconsin, Madison, WI, USA) [26].

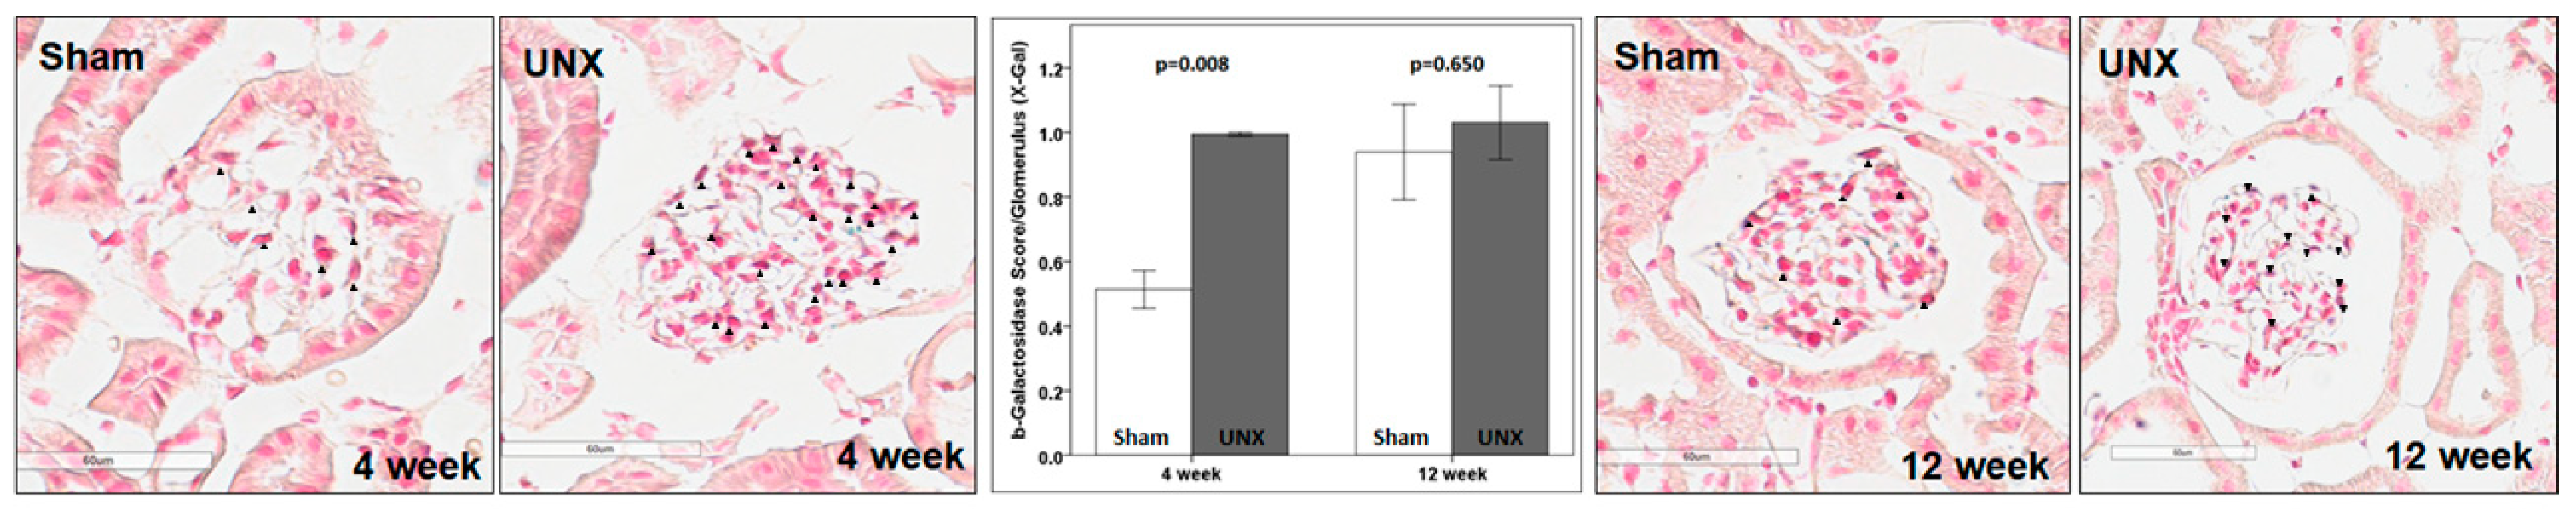
2.4. X-Gal Staining for β-Galactosidase Expression in TOPGAL Mice

The tissue sections (8–10 μm in thickness) were fixed by immersion in 2% glutaraldehyde, 0.01% sodium deoxycholate, 0.02% IGEPAL-CA630, and 1 mM MgCl2 in PBS [pH = 7.8]) for 10 min and washed in a LacZ wash buffer (2 mM MgCl2, 0.01% Na-deoxycholate, and 0.02% NP40 in PBS). The sections were immersed and incubated overnight with gentle rocking in a staining solution (1 mg/mL X-gal, 5 mM potassium ferricyanide, 5 mM potassium ferrocyanide, and 2 mM MgCl2 in PBS, pH = 8.0) at 30 °C in the dark for 24 h in a humidified atmosphere [24]. The tissue sections were washed with PBS, counterstained using a nuclear fast red staining solution, and washed with water for 1–2 min. Finally, the tissue sections were dehydrated through grades of ethanol and xylene and mounted in a non-aqueous mounting fluid. Using the images obtained after X-gal staining, endothelial cells were localized on the intraluminal aspect of the glomerular capillary, while podocytes were on the extraluminal aspect of the capillary wall. Semi-quantitative analysis was performed using a scale of 0–4 for X-gal staining within the glomerulus. Each glomerulus examined was assigned a score based upon the percentage of total podocytes that showed positive staining: 0 (no staining), 1 (<10% of podocytes), 2 (10–25% of podocytes), 3 (25–50% of podocytes), or 4 (>50% of podocytes staining).

2.5. Immunofluorescence Staining of TOPGAL Mouse Kidneys and Immortalized Mouse Podocytes

The tissue sections (4 μm) were fixed at 4 °C in 1:1 acetone and alcohol for 10–15 min, washed with PBS, and blocked in 5% donkey serum for 3 h at room temperature. The blocked sections were washed with PBS and incubated with primary antibodies for Podocalyxin (Goat Polyclonal Antibody from R&D, Catalog number AF1556, 1:1000 dilution), Total β-catenin (Rabbit Monoclonal Antibody from Cell Signaling, cs-8480S, 1:100 dilution), phospho-β-catenin (Ser675, Rabbit Monoclonal Antibody from Cell Signaling, cs-4176S, 1:100), phospho-β-catenin (Ser552, Rabbit Monoclonal Antibody from Cell Signaling, cs-5651S, 1:200 dilution), or β-galactosidase (Rabbit Polyclonal Antibody from Sigma, Catalog Number A-11132, 1:100 dilution) in a blocking solution overnight at 4 °C. The tissue slices were then washed and incubated with fluorescent-tagged secondary antibody (Donkey anti-rabbit Alexa Fluor 488, Invitrogen Catalog # A-21206 and Donkey anti-goat Alexa Fluor 594, Invitrogen Catalog # A-32758) for 1 h at room temperature and washed. The tissue sections were counterstained with Evan’s Blue for 4 min, washed, and mounted in an aqueous mounting fluid.
The cultured podocytes were fixed in 4% paraformaldehyde in PBS for 15 min at room temperature, washed in PBS, permeabilized in Triton X-100 0.1% in PBS for 10 min, and washed again. The cells were blocked in 1% goat serum/2.5% BSA in PBS for 2–3 h at room temperature, washed, and then incubated with primary antibodies in a blocking solution overnight at 4 °C, as described above for the tissue sections. The cells were washed and incubated in Alexa Fluor 488-tagged goat anti-rabbit secondary antibody (1:200 dilution) for 1 h at room temperature, washed, and mounted in an aqueous mounting fluid.

2.6. Confocal Microscopy and Measurement of Immunofluorescence Intensity

Confocal microscopy with Z-stacking was performed on a Zeiss LSM 510 META microscope with an LSM 510 laser module. We obtained images at 63× magnification (in immersion oil). The z-stack depth of the confocal images is approximately 4 μm (+/− 1.5 μm) with a an optical section (z-slice) depth of 0.317 μm. We converted stacked images into maximum-intensity-projection images for analysis. The cells were treated with FFSS in triplicate, and 3–5 images were obtained per experiment. The photomultiplier tube voltage was kept constant throughout image acquisition to ensure comparable relative fluorescence intensities for all experimental conditions. Quantitative analysis of confocal microscope images was carried using the open-source Image-J/FIJI software to determine the predominant subcellular location of different phospho-β-catenin [27]. The fluorescent staining for β-catenin protein in the nucleus was quantitated by measuring the relative fluorescence units (RFU) selected in the region of interest. We measured the net fluorescence integrated density in the nucleus using the area of the nucleus and the mean intensity of β-catenin immunofluorescence within the nucleus. We measured a minimum of 50 nuclei at each experimental time point. A similar protocol was followed for quantification in kidney tissue from TOPGAL animals.

2.7. Podocyte Cell Culture

Conditionally immortalized mouse podocytes containing thermosensitive tsA58 mutant T-antigen (kindly provided by Dr. Peter Mundel) were seeded on collagen-I coated 75 cm2 polystyrene flasks and first propagated in RPMI 1640 containing L-glutamine, 10% fetal bovine serum, 100 units/mL penicillin, and 0.1 mg/mL streptomycin (Invitrogen, Carlsbad, CA, USA) supplemented with 10 units/mL of γ-interferon (Cell Sciences, Norwood, MA, USA) under permissive conditions at 33 °C, with 95% humidity and 5% CO2 [28]. The cells were then transferred to non-permissive conditions (37 °C without γ-interferon) to induce differentiation. The cells on standard glass slides (3 slides/dish, 12 mL medium) were maintained for differentiation and studied on day 14.

2.8. Fluid Flow Shear Stress (FFSS) Application

Fluid flow shear stress was applied to the differentiated podocytes using a FlexCell Streamer Gold apparatus (FlexCell International, Hillsborough, NC, USA), as described previously [10,14]. FFSS was applied at 2 dynes/cm2 for 2 h and untreated podocytes (control group) were placed in the same incubator, without exposure to FFSS. The slides were returned to the dishes for recovery up to 24 h at 37 °C under a 5% CO2-humidified atmosphere. The samples obtained from untreated podocytes at the end of the FFSS treatment, and at 2 h and 24 h following the FFSS treatment, were termed Control, End-FFSS, Post-2 h, and Post-24 h, respectively.

2.9. Gene Expression Omnibus Dataset on Unilaterally Nephrectomized Mice

The Gene Expression Omnibus (GEO, NCBI, (http://0-www-ncbi-nlm-nih-gov.brum.beds.ac.uk/geo, access on 24 July 2017) public functional genomics data repository was searched for “uninephrectomy” and filtered for “Mus musculus”, which returned 58 hits (as of 24 July 2017). We excluded results for uninephrectomy associated with ischemia-perfusion injury, diabetic nephropathy, drug treatment, and pooled samples. We identified the GEO dataset, GSE 53996, titled “Effects of high-fat induced obesity on gene expression in mouse kidney”. In the animal protocol used for obtaining this GEO dataset, male C57/BJ mice aged 6 weeks were randomly assigned to left uninephrectomy (UNX) or sham procedures and fed a high-fat diet or control chow diet. The mice were divided into 4 groups: Sham-chow, UNX-chow, Sham-HFD, and UNX-HFD. All mice were sacrificed under anesthesia at 20 weeks after surgery, and their kidneys were harvested. Microarray was performed on Agilent-026655 Mouse GE 4x44K v2 [29,30]. To evaluate the transcriptomic changes induced by unilateral nephrectomy alone, avoiding the effect of the high-fat diet, the present bioinformatics analysis included only the groups maintained on normal chow. These included the sham samples (n = 4): GSM1305179 LFD-sham_1, GSM1305180 LFD-sham_2, GSM1305181 LFD-sham_3, GSM1305182 LFD-sham_4, and UNX samples (n = 4): GSM1305183 LFD-UNX_1, GSM1305184 LFD-UNX_2, GSM1305185 LFD-UNX_3, and GSM1305186 LFD-UNX_4.

2.10. Functional Annotation, Pathway, and Network Analyses Using Ingenuity Pathway Analysis (IPA)

To identify over-represented canonical pathways, networks, and upstream regulators, differentially expressed genes (p < 0.05) between sham and unilateral nephrectomy were submitted for the Ingenuity Pathways Knowledge Base tool (IPA, Ingenuity Systems, Inc., Redwood City, CA, USA). Core analysis was performed by comparing the significant genes with the IPA knowledge base, comprising curated pathways within the program on 24 July 2017. IPA predicted significant biological functions and pathways (p < 0.05, Fischer’s exact test) affected in the kidney following unilateral nephrectomy. In addition, IPA was used to predict the upstream biological regulators and the downstream effects on cellular and organismal biology. In the analysis of the upstream regulators, such as transcription factors, kinases, receptors, etc., the further the activation z-score is away from zero, the more likely it is that the direction of change of the target genes is consistent with the upstream regulator being in an activated or inhibited state. The settings for the core analyses were as follows: Ingenuity Knowledge Base; Endogenous Chemicals included Direct and Indirect relationships; molecules per pathway: 35; and networks per analysis: 25.

2.11. Statistics

We used the SPSS 23 statistical software for the preparation of the statistics and graphs. ANOVA was used for three-group comparisons of the podocyte experiments, and Students’ t-test was used for two-group comparisons. A p-value < 0.05 was considered significant.

3. Results

Previously, we demonstrated that FFSS induces the activation of the “PGE2-COX2-EP2” axis and the “AKT-GSK3β-β-catenin” pathway in podocytes in vitro. We validated the role of the COX2 and EP2 in vivo model of UNX [10,11,12,14]. The present study was undertaken to determine if in vivo FFSS following UNX in mice would support the original in vitro findings concerning the role of β-catenin. To this end, we used TOPGAL mice and immortalized mouse podocytes to demonstrate the activation and nuclear translocation of β-catenin. We also applied bioinformatic analysis to determine if publicly available data from UNX mice support our in vivo and in vitro findings.

3.1. Unilateral Nephrectomy Affected Growth, Glomerular Morphology, and β-Catenin in TOPGAL Mice

(a)
Body weight following unilateral nephrectomy. There was no significant difference in body weight at the baseline between the sham (n = 23, 20.1 ± 1.5 g) and the UNX (n = 24, 20.1 ± 1.8 g, p = 0.97) at the time of UNX or sham treatment at 4 weeks of age. Weight gain was lower at 4 weeks following UNX (mean difference −3.2 g, p = 0.002) but not at 12 weeks (mean difference +2.4 g, p = 0.32). Kidney weight could not be obtained due to the special perfusion protocol followed in these animals for X-gal staining at the time of euthanasia. Unilateral nephrectomy did impact growth at the early time point of 4 weeks, compared to the sham controls, but the UNX mice caught up with the sham-treated group by 12 weeks.
(b)
Unilateral nephrectomy resulted in glomerular hypertrophy and increased the mesangial matrix. Quantitative morphometry was performed on the first 15 glomeruli, including 10 glomeruli from the outer cortical and 5 from the inner juxtamedullary regions, as the section was observed starting from one edge of the slide. Each glomerulus was analyzed for the glomerular area, glomerular perimeter, mesangial area, and mesangial cell count, which are shown in Table 1A–D and Figure 2A–E. A significant increase in the glomerular area over time was observed. The mean glomerular area increased by 11.6% and 15.1% in UNX, compared to the sham-treated animals, at 4 weeks and 12 weeks, respectively. The increase in the mean glomerular area was more marked in the juxtamedullary glomeruli, compared to the outer cortical glomeruli (17.1% vs. 8.6%), at 4 weeks but less so at 12 weeks (8.9% vs. 20.0%). Similarly, the mean glomerular perimeter increased by 5.4% and 8.6% in UNX, compared to the sham group, at 4 weeks and 12 weeks, respectively. The increase in the mean glomerular perimeter was more marked in the juxtamedullary glomeruli versus the outer cortical glomeruli (9.3% vs. 3.6%) at 4 weeks but less so at 12 weeks (5.4% vs. 10.7%). The mean mesangial area increased by 9.9% and 28.6% in UNX over the sham-treated animals at 4 weeks and 12 weeks, respectively. The increase in the mean mesangial area was exclusively in the juxtamedullary glomeruli, compared to the outer cortical glomeruli (31.5% vs. 0.4%), at 4 weeks but less so at 12 weeks (26.1% vs. 30.1%). In contrast to the mesangial matrix expansion, no significant increase in the mesangial cell count was observed in the glomeruli, except in the outer cortical glomeruli at 12 weeks. Together, these results show that unilateral nephrectomy in TOPGAL mice resulted in increased glomerular hypertrophy and increased the mesangial matrix, especially in the juxtamedullary glomeruli early and in the outer cortical glomeruli later, as part of the glomerular hemodynamic adaptation following UNX.
(c)
Urine albumin excretion was increased in TOPGAL mice following unilateral nephrectomy. There was no difference at the baseline between the sham (24.2 ± 9.3 µg/mg Cr) and UNX TOPGAL mice (28.3 ± 11.3 µg/mg Cr, p = 0.189) at the time of surgery. At 4 weeks following unilateral nephrectomy, the urine albumin/creatinine ratios in the sham (n = 12, 36.1 ± 21.1 µg/mg Cr) and UNX (n = 12, 28.1 ± 18.7 µg/mg Cr, p = 0.338) animals were not different. However, the urine albumin/creatinine ratio increased significantly by 12 weeks in the UNX (n = 12, 66.3 ± 46.4 µg/mg Cr, p = 0.046), compared to the sham-treated group (n = 11, 35.3 ± 13.7 µg/mg Cr) of TOPGAL mice. The boxplot distribution of urine albumin/creatinine ratio at the baseline and following unilateral nephrectomy is shown in Figure 3.
(d)
Unilateral nephrectomy resulted in the nuclear translocation of β-catenin in TOPGAL mice. The β-galactosidase expression in the reporter mouse (TOPGAL) was consistent with a nuclear translocation of β-catenin. The β-galactosidase expression was assessed by two different techniques, namely, immunofluorescence (n = 3 in each group) and X-gal staining (n = 3 in each group). Each animal was tested for β-galactosidase expression with only one method.
Confocal microscopy showed that the relative fluorescence units/area of the glomerulus was significantly increased (p < 0.001) at 4 weeks following UNX (Table 2). Since unilateral nephrectomy is associated with glomerular hypertrophy, we also assessed the net fluorescence/glomerulus (Figure 4). The increase in β-galactosidase expression at 4 weeks following UNX was further supported by X-gal staining (p = 0.008), which was measured by a semi-quantitative score of 0–4 across all the glomeruli in the section (Table 2 and Figure 5). However, the increased β-galactosidase expression dissipated by 12 weeks following UNX. The mean β-galactosidase expression was not different in UNX animals, compared to the sham-treated group, at 12 weeks (Table 2 and Figure 4 and Figure 5).
A consistent increase in the β-galactosidase expression at 4 weeks following UNX using two different methods suggests a definite increase in the activation and nuclear translocation of the transcription factor, β-catenin. As shown below, the results also show that β-catenin was phosphorylated at Ser552 in podocytes. The observed increase in the reporter β-galactosidase expression in the early period following UNX indicates the significance of β-catenin in the adaptive response to the loss of one kidney.
(e)
Unilateral nephrectomy resulted in increased levels of β-catenin. Confocal microscopy showed a significant increase in the phospho-β-catenin (Ser552) relative fluorescence units/area of the glomerular at 4 weeks (p = 0.005) but not at 12 weeks (p = 0.935) following UNX (Table 3). No changes were detected in the phospho-β-catenin (Ser675) relative fluorescence units/area of the glomerulus at 4 weeks (p = 0.170) or at 12 weeks (p = 0.197) following UNX (Table 3). Interestingly, confocal microscopy for RFU/area of the glomerulus also showed a significant increase in the total catenin expression (p = 0.027) at 12 weeks but not at 4 weeks (p = 0.111) following UNX (Table 3). Unilateral nephrectomy is associated with glomerular hypertrophy, and we therefore also assessed the net fluorescence/glomerulus for phospho-β-catenin (Ser552), phospho-β-catenin (Ser675), and Total β-catenin (Figure 6). The results showed an increased phospho-β-catenin (Ser552) at 4 weeks (p = 0.006) and increased the Total β-catenin at 12 weeks (p = 0.008), while there was no change in phospho-β-catenin (Ser675). Thus, there was an increase in phospho-β-catenin (Ser552) in the kidneys following unilateral nephrectomy at 4 weeks and Total- β-catenin at 12 weeks, but not for phospho-β-catenin (Ser675).

3.2. Fluid Flow Shear Stress on Podocytes Resulted in a Sustained Increase in the Nuclear Translocation of Phospho-β-Catenin (Ser552)

Western blot analysis of cell lysates from cultured podocytes exposed to FFSS showed an increased expression of phospho-β-catenin (Ser552) but not phospho-β-catenin (Ser675) [14]. In this study, we performed confocal imaging to localize and quantitate the Total (non-phosphorylated) and phosphorylated β-catenin in the nucleus. We measured the total fluorescence in the nucleus (in relative fluorescence units, RFU) in at least 50 nuclei from cells in 3–5 images following FFSS on podocytes (n = 3). At the end of the FFSS treatment, there was a significant increase in phosphorylated phospho-β-catenin (Ser552) and phospho-β-catenin (Ser675) and a significant decrease in the Total (non-phosphorylated) β-catenin in the nucleus (Table 4 and Figure 7). Phospho-β-catenin (Ser675) returned to the baseline by Post-2 h, which is in contrast to phospho-β-catenin (Ser552), as the latter continued to increase over time. The total (non-phosphorylated) β-catenin at Post-24 h FFSS was lower than the baseline. These results show that phospho-β-catenin (Ser552) and not phospho-β-catenin (Ser675) plays a key role in response to FFSS in podocytes, as demonstrated here by confocal imaging studies and earlier by Western blotting [14].

3.3. Analysis of the Gene Expression Omnibus Dataset on Unilateral Nephrectomy Corroborated In Vivo and In Vitro Studies

Bioinformatic analysis of GSE53996 identified 1722 microarray probes corresponding to 898 mapped genes that were differentially expressed (p < 0.05) in the solitary kidney after unilateral nephrectomy in mice. To investigate the molecular mechanisms underlying unilateral nephrectomy, the microarray data were submitted for IPA core analysis. IPA core analysis predicted the canonical pathways and upstream regulators affected by unilateral nephrectomy. The top enriched categories of canonical pathways are listed in Table 5. In alignment with our previous work using FFSS-treated podocytes, the present bioinformatic analysis showed changes in the G-protein coupled receptor signaling, Wnt/β-catenin, actin cytoskeleton, and cAMP-mediated signaling [10,12,14,15]. Upstream regulator analysis predicted the G-protein coupled receptors (Table 6), transcription factors (Table 7), and kinases (Table 8) associated with the observed differential expression. Thus, as with our previous findings, the current bioinformatic analysis also identified the EP2 (PTGER2) receptor as the G-protein coupled receptor, AKT and GSK3β as kinases, and β-catenin as an upstream transcription factor. These findings through bioinformatics analyses of a publicly available dataset generated by an independent group further provides evidence of the relevance of G-coupled protein signaling through the prostanoid receptor, EP2, in the “PGE2-COX2-EP2” axis and the role of β-catenin in the “AKT-GSK3β-β-catenin” pathway downstream of EP2 activation in podocytes previously reported by us in in vitro studies. These results advance our understanding of the interactions between these molecules, which will be valuable in future work.
As part of our ongoing work to understand the role of FFSS-mediated injury in solitary kidney, we previously demonstrated that FFSS activated the “PGE2-COX2-EP2” axis and upregulated the “AKT-GSK3β-β-catenin” pathway in podocytes in vitro and validated the role of a COX2 and EP2 in vivo model of solitary kidney [10,11,12,14,15]. In the current study, we now show the importance of the transcription factor, β-catenin, in vivo following unilateral nephrectomy in a reporter TOPGAL mouse and, additionally, confirm the role of phospho-β-catenin (Ser552) in response to FFSS in a solitary kidney model both in vivo and in vitro. The results from our previous and current study are further supported by bioinformatic analyses of an independent dataset available in the public domain.

4. Discussion

Hyperfiltration is a major underlying factor in the onset and progression of CKD, which is associated with podocyte injury, resulting in impairment of the glomerular filtration barrier and a decreased renal function over time. The present in vivo results validate previous in vitro studies that described the significance of β-catenin signaling in FFSS-treated podocytes [14,15]. The present results show glomerular hypertrophy and an increased mesangial matrix in unilaterally nephrectomized TOPGAL mice. The glomerular hypertrophy was more marked in juxtaglomerular glomeruli in the early period (4 weeks) and in cortical glomeruli in the later period (12 weeks). The results also show an increased albuminuria at 3 months, increased nuclear translocation of β-catenin at 4 weeks, phosphorylation of β-catenin at Ser552 and not Ser675 in UNX mice, which was further complemented by in vitro studies in podocytes, and the bioinformatic analysis of publicly available independent datasets supports our previously reported activation of “COX2-PGE2-EP2” and “AKT-GSK3β-β-catenin” in podocytes in vitro. These studies advance our understanding of the mechanism of CKD progression to ESRD in adult kidney donors with acquired solitary kidney and in children born with solitary functioning kidney.
Glomerular hypertrophy is considered a hallmark of decreasing kidney function and proteinuric disease. Key in vivo findings, glomerular hypertrophy, and an increased mesangial matrix in TOPGAL mice were evident by 4 weeks post-UNX and showed further progression at 12 weeks (Figure 2 and Table 1). Previously, we reported an increased glomerular diameter and area as early as 2–3 weeks in C57BL/6J mice and by 4 weeks in sv129 mice following UNX [9,10]. Celsi et al. [1,2] reported an increase in glomerular diameter and area at ~7 weeks and not at ~2 weeks following UNX in Sprague Dawley rats. To further refine and advance our findings, we examined and compared the adaptive changes in cortical and juxtamedullary glomeruli. The glomerular hypertrophy was more marked in the juxtamedullary region at 4 weeks and in the cortical region by 12 weeks. A centrifugal pattern of renal maturation from the juxtamedullary region towards the superficial cortical layers leads to subtle regional differences in the structure and function of the nephrons [31]. Thus, the larger juxtamedullary glomeruli, compared to the cortical glomeruli, in the present study correspond with normal size differences (Table 1). Vascular damage from hypertension occurs first and more severely in the juxtamedullary glomeruli [32]. A pathologic glomerular lesion of focal segmental glomerulosclerosis is most common in or restricted to the juxtamedullary cortex [33]. Thus, the presently observed early glomerular adaptive changes in the juxtamedullary region are of special significance in the development of secondary focal segmental glomerulosclerosis from hyperfiltration-mediated injury.
The unilaterally nephrectomized TOPGAL mice showed an increased urinary albumin by 12 weeks, which was not evident at 4 weeks (Figure 3). Recently, we showed sv129 mice with increased urine albumin following unilateral nephrectomy [10]. The onset of albuminuria is preceded by increased albumin in the glomerular filtrate, as a result of a damaged glomerular filtration barrier. Using an in vitro assay developed in our laboratory, we demonstrated that a variety of agents and conditions increase glomerular albumin permeability (Palb). We have also demonstrated that an increase in Palb precedes the onset of proteinuria in animal models of diabetes, hypertension, radiation nephropathy, puromycin-induced nephrosis, and focal segmental glomerulosclerosis [34,35,36,37]. We have also demonstrated that treatment of isolated rat glomeruli with PGE2 or FFSS increased Palb, which could be blocked by indomethacin, indicating a role of PGE2 [10,38,39]. Thus, previously reported work and present observations show that UNX-induced increases in FFSS damage the glomerular filtration barrier causing increased albumin permeability and, subsequently, proteinuria. Similarly, children born with solitary kidney start to develop hypertension and proteinuria in late adolescence, suggesting that glomerular injury due to hyperfiltration gradually leads to proteinuria over several years in these children [40,41]. Thus, morphological changes, glomerular hypertrophy, and an increased mesangial matrix complement the observed functional outcome in TOPGAL mice following UNX.
The TOPGAL mouse is a specific reporter strain with β-galactosidase activity, as a direct in vivo readout for activated β-catenin signaling. Using the TOPGAL mice, we demonstrated an increase in the β-galactosidase activity, as direct evidence for the in vivo activation of β-catenin following UNX. We used two different methods (described under Methods) to evaluate the β-galactosidase expression in TOPGAL and the data from each method support this finding. The increased β-galactosidase activity (i.e., β-catenin signaling) was detectable at 4 weeks following UNX and returned to the baseline by 12 weeks. We anticipated a transient activation of β-catenin signaling, since it is a transcription factor, and its activation would cause progressive changes.
A small but significant magnitude of increase in β-galactosidase activity at 4 weeks but not at 12 weeks in β-galactosidase expression is consistent with other reports. For example, the β-galactosidase activity in TOPGAL mice is observed during fetal and neonatal periods in the skeleton and is not detectable in mature animals, unless induced by mechanical loading or fracture in vivo [42,43]. In vivo bone loading in 5- and 12-months-old TOPGAL mice for 1 day and 5 day was shown to result in a β-galactosidase expression in 5% to 10% of osteocytes that peaked at 24 h and declined to baseline by 72 h [44,45]. Additionally, the expression of β-galactosidase in callus and periosteum following a fracture stimulus was observed in TOPGAL mice. Treatment with GSK-3β inhibitor resulted in an increased β-catenin activation and rapid fracture healing, showing the importance of β-catenin in response to injury [43]. Thus, stress or injury stimulate β-catenin signaling in a TOPGAL mouse model of UNX, which is similar to that observed in models of bone loading and fracture.
β-catenin phosphorylation by casein kinase (Ser45) followed by GSK3β (Ser33,37 and Thr41) directs it toward degradation through the ubiquitin-proteasome degradation pathway [18]. In contrast, phosphorylation by AKT (predominantly) at Ser552 and by PKA (predominantly) at Ser675 results in the nuclear translocation of β-catenin for transcriptional activity via LEF/TCF [16,17]. We previously identified β-catenin, a transcription factor, in podocytes treated with FFSS through Enrichr and IPA bioinformatic analyses as an upstream regulator [14]. Western blot analysis of podocytes treated with PGE2 (1 µM) or FFSS showed an increased phosphorylation of β-catenin (Ser552) but not β-catenin (Ser675) [14]. Western blotting also showed the upregulation of CD44/ERBB2/β-catenin pathway in podocytes following FFSS [15].
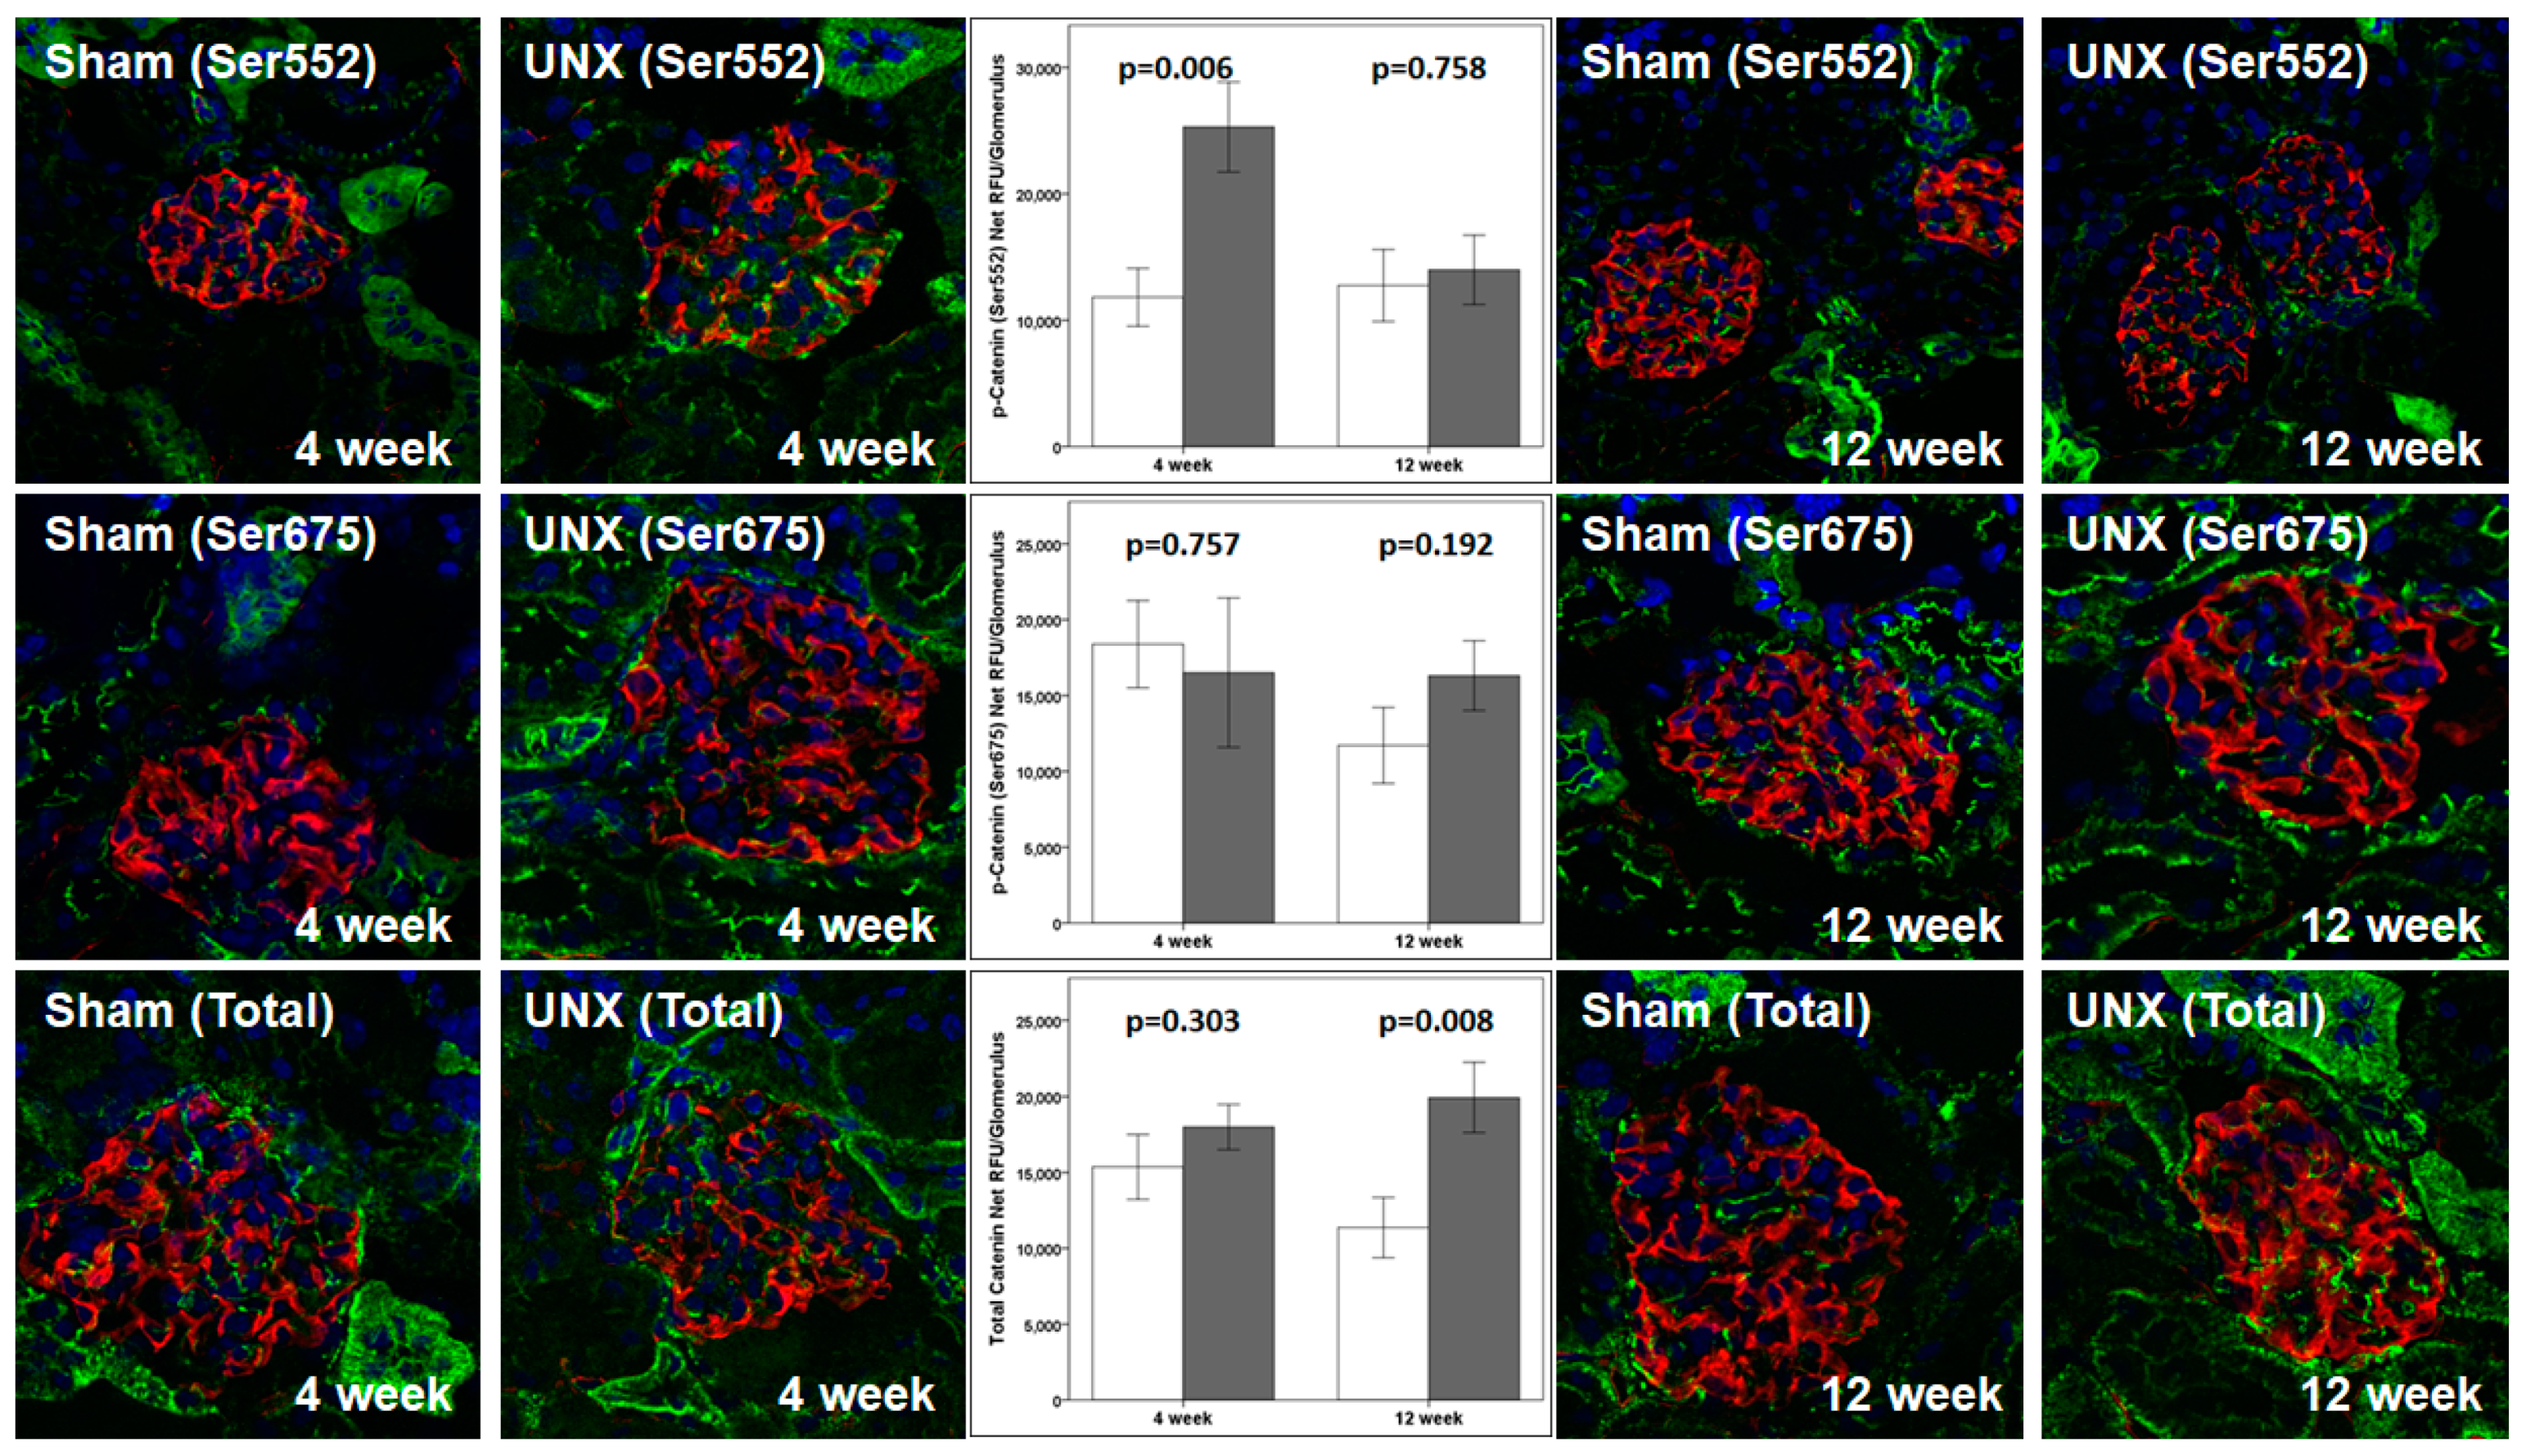
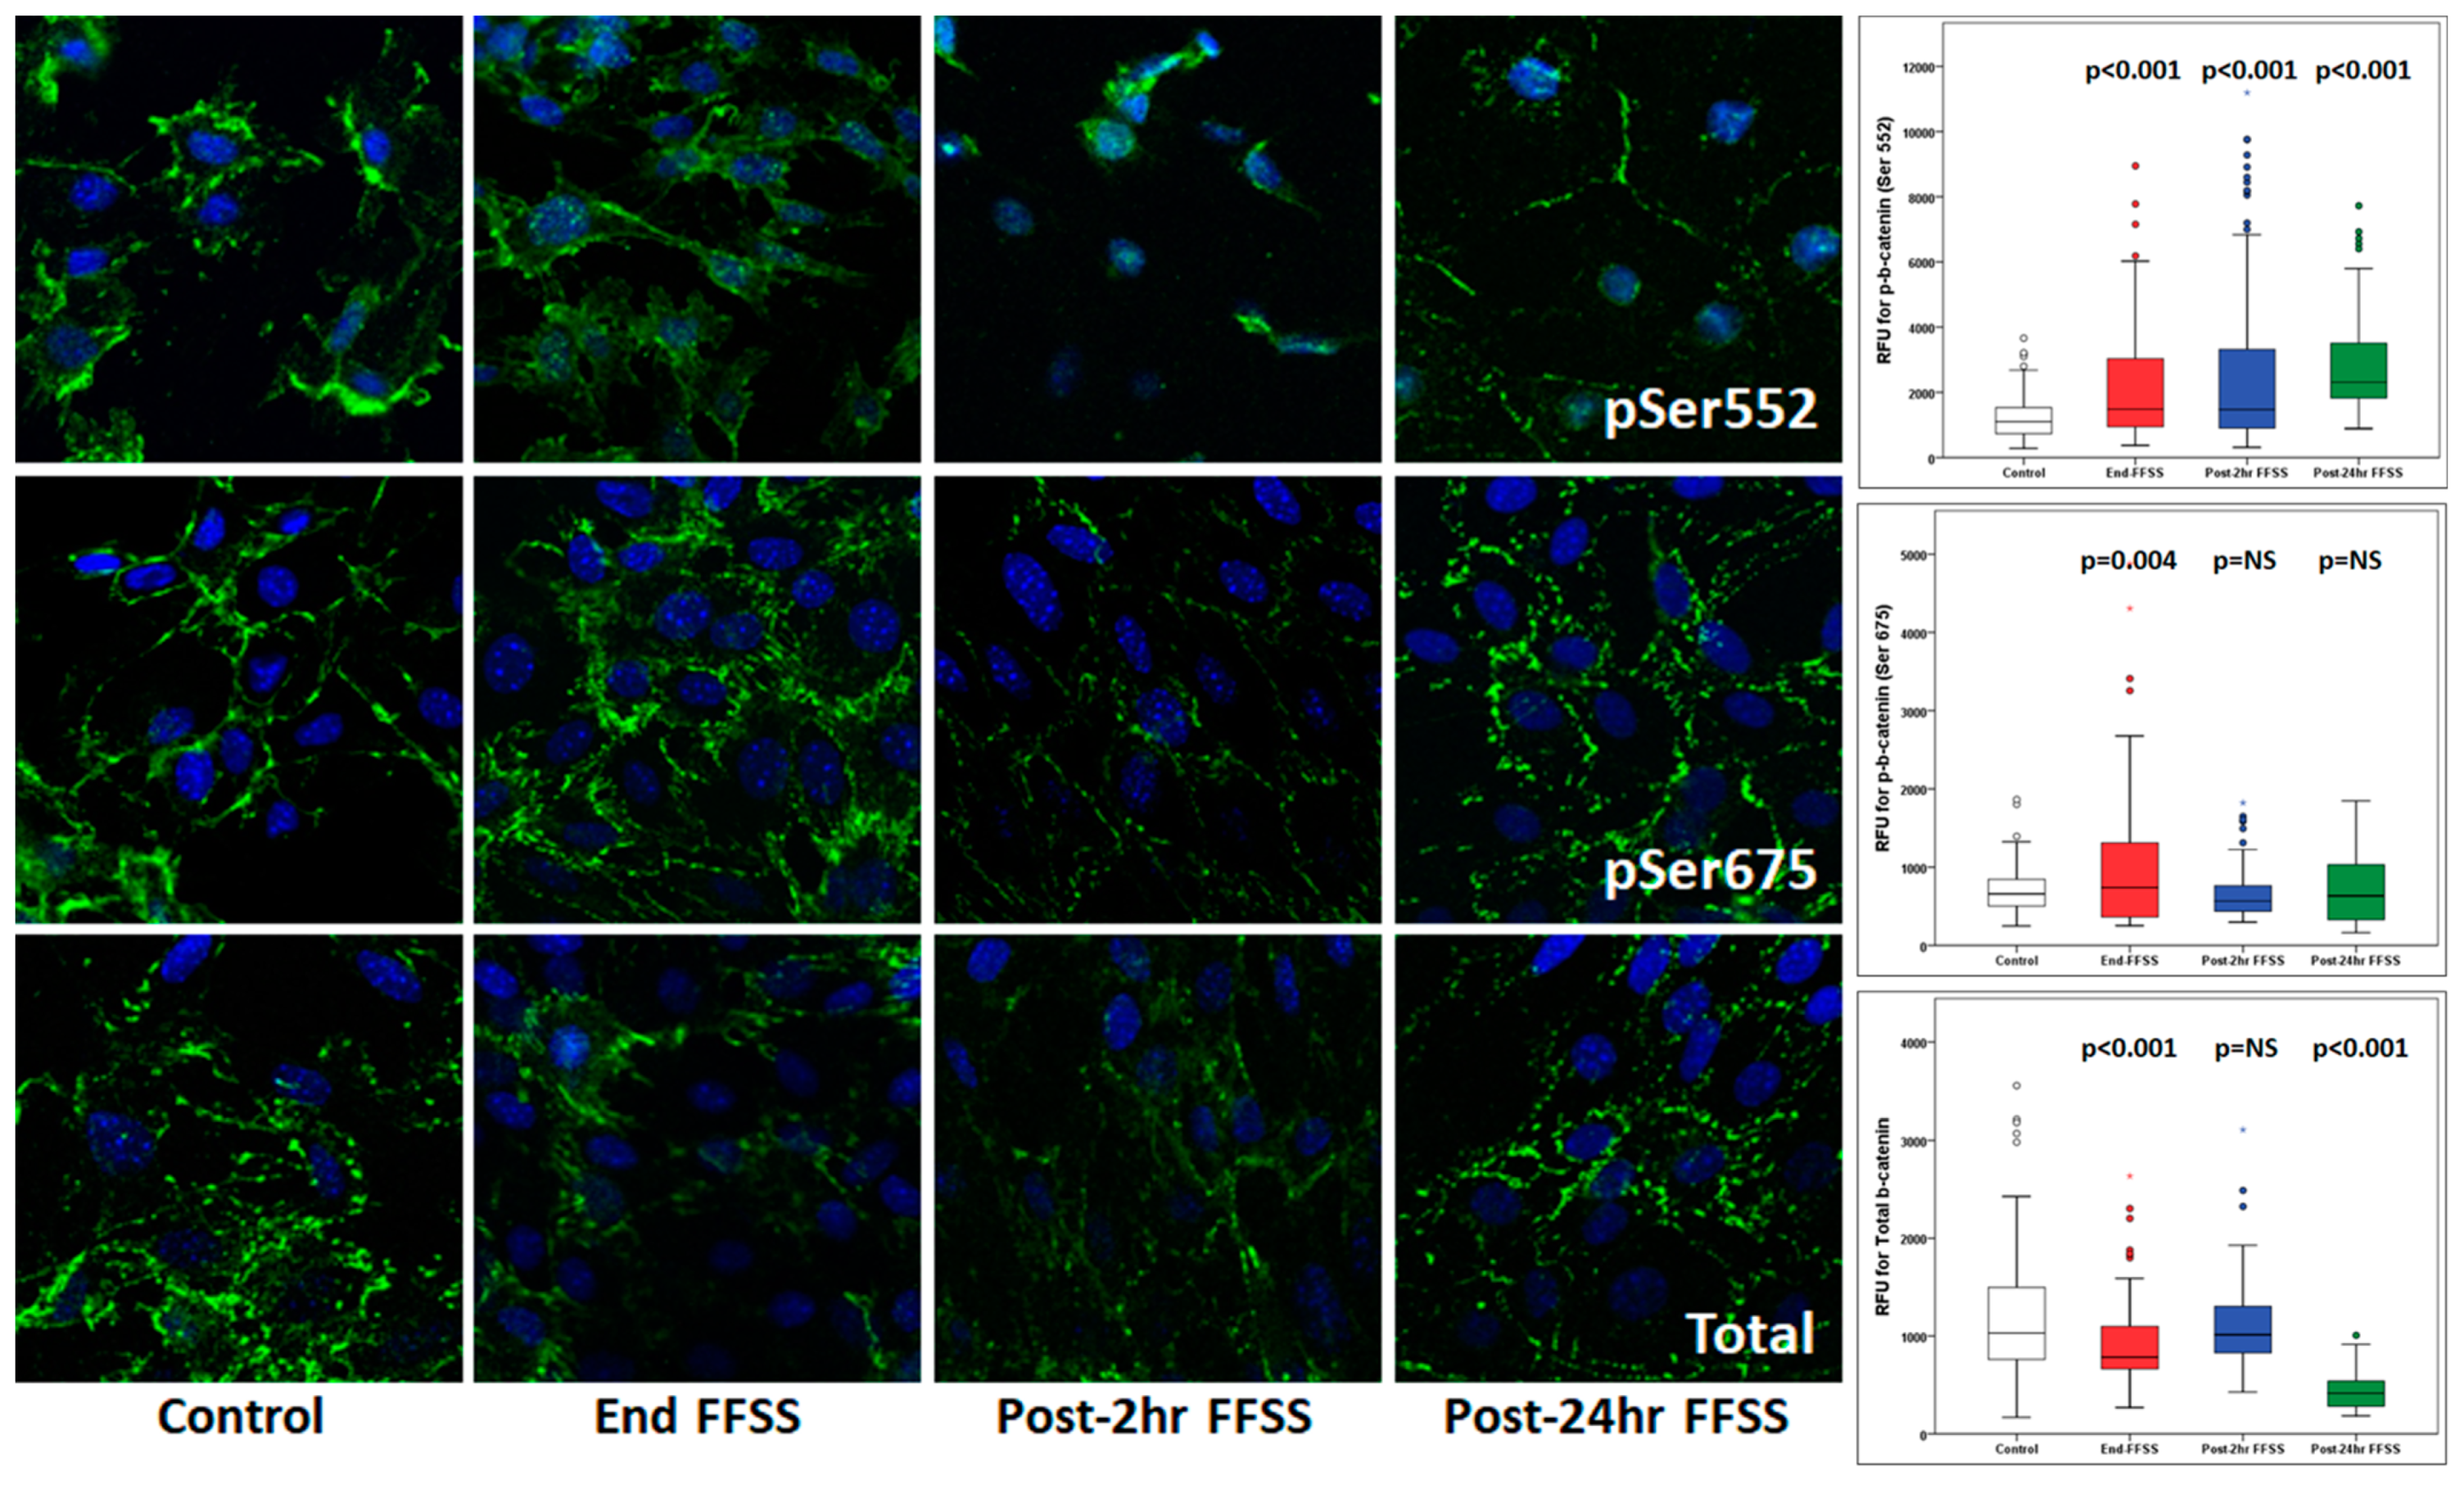
Presently, we evaluated the localization and movement of phospho-β-catenin (Ser552), phospho-β-catenin (Ser675), and total β-catenin using confocal microscopy. The results (Table 4 and Figure 7) show the translocation to and accumulation of phospho-β-catenin (Ser552) in the nucleus. A transient increase in phospho-β-catenin (Ser675) suggests a role of AKT-GSK3β-β-catenin, compared to cAMP-PKA-β-catenin, as observed previously [14]. Additionally, confocal microscopy of the kidney from unilaterally nephrectomized TOPGAL mice showed an upregulated phospho-β-catenin (Ser552) at 4 weeks and Total β-catenin at 12 weeks, while phospho-β-catenin (Ser675) remained unchanged (Table 3 and Figure 6). The significance of β-catenin signaling is also highlighted by other reports, as it was found to mediate oxidative stress-induced podocyte dysfunction in vitro and in vivo [19]. Podocyte injury and albuminuria caused by Adriamycin were ameliorated in β-catenin knock-out mice, and the over-expression of podocyte β-catenin was also detected in human diabetic nephropathy and focal segmental glomerulosclerosis [20]. Additionally, treatment of osteocytes with PGE2 results in the EP2-activated phosphorylation of GSK3β and increased nuclear translocation of β-catenin, followed by binding with LEF/TCF and transcriptional regulation of genes, including COX2, suggesting a role of β-catenin in skeletal physiology [46,47,48,49,50]. Thus, understanding the importance of β-catenin in FFSS-mediated injury in solitary kidney will be critical for developing strategies to treat the progression of CKD in transplant donors with acquired solitary kidney and children born with solitary functioning kidneys.
Considering its potential clinical significance, we adopted a third pre-clinical approach to corroborate our finding that hyperfiltration-induced kidney injury causes the upregulation of β-catenin signaling. To this end, we performed bioinformatic analysis using publicly available dataset in the Gene Expression Omnibus. As shown in Table 5, Table 6, Table 7 and Table 8, the IPA analyses showed G-protein coupled receptor signaling as the main pathway, with prostanoid receptor EP2 as the G-protein-coupled protein receptor, AKT1, GSK3β, Erbb, and mTOR as the kinases, and β-catenin as the transcription factor. Previously, we validated the phosphorylation of AKT1 (Ser473), GSK3β (Ser9), and β-catenin (Ser552 and Ser675) [14]. Additionally, we reported the altered phosphorylation of Erbb2 (Tyr1221/1222), mTOR (Ser2448), ERK1/2 (Thr202/Tyr204), and p38MAPK (Thr180/Tyr182), but not PKA (Thr197) [14,15]. Thus, the mechanoperception and mechanotransduction pathways that we have previously identified were validated from a dataset generated by other investigators [29,30]. Therefore, based on our previous work, the present in vitro and in vivo results, and an analysis of a publicly available dataset, we propose β-catenin signaling to be relevant for understanding hyperfiltration-induced injury in solitary kidney.
Since PGE2 receptors are known to activate diverse signaling pathways, the activity of several proteins is likely affected due to FFSS. Of the four PGE2 receptors, only EP2 activation results in the nuclear translocation of activated β-catenin through five known intermediate mechanisms (Figure 1). EP2 is a G-protein-coupled receptor that activates the heterotrimeric (αβγ) Gs protein, leading to (i) the release of the Gβγ complex, activating PI3K/AKT, which phosphorylates and inactivates GSK3β [51,52], (ii) binding of the Gα complex to Axin and the release of β-catenin from the Axin-β-catenin-GSK3β complex, (iii) generation of cAMP and activation of PKA, which activate β-catenin [53,54,55], (iv) recruitment of β-arrestin-1 and phosphorylation of Src-kinase, which transactivates the EGFR signaling network of the PI3K/AKT, HGF/c-Met, and Ras/ERK pathways [56,57,58], and (v) activation of PI3K/AKT leading to the activation of ERK [59]. Studies suggest that the phosphorylation of β-catenin at Ser552 or Ser675 induces β-catenin translocation to the nucleus, with AKT preferentially phosphorylating β-catenin at Ser552, while PKA preferentially phosphorylating it at Ser675 [16,17,55,60]. Thus, there is a strong link between G-protein-coupled receptor signaling via the EP2 receptor and β-catenin signaling, which could be targeted to mitigate injury.
We believe that there are at least two clinical scenarios where susceptibility to CKD needs special attention, as the reason(s) for the progression to ESRD is still unclear, and specific treatment(s) are not available: (a) in adults following kidney donation and (b) in children born with solitary functioning kidney. We recently reviewed the accumulating evidence that living kidney donation increases the risk of ESRD in donors, despite stringent screening [61]. The risk of ESRD in donors is 8.3-fold higher, compared to eligible healthy individuals, as reported in a meta-analysis of 52 studies [62,63,64,65]. There is a cumulative increase in the incidence of ESRD over time following kidney donation, with a reported mean interval of 27.1 ± 9.8 years [66,67,68]. Secondly, a considerable number of children born with solitary kidney develop albuminuria during adolescence and progress to end-stage renal disease as young adults [69,70,71,72]. Children with SFK manifest renal injury at a median age of ~15 years with hypertension, proteinuria, and/or an eGFR of less than 60 mL/min/1.73 m2 [69,70,71,72]. The significance of FFSS in hyperfiltration-mediated glomerular injury in the progression of CKD is being better understood and appreciated. With growing evidence, we propose EP2 and/or β-catenin as suitable targets for mitigating glomerular injury.

Author Contributions

These authors have been part of the conceptual model of fluid flow shear stress, have made substantial contributions to this novel concept and design over the years, and have published together for many years on this subject (T.S., D.P.H., R.S.D., J.N., R.E.G., T.J., Y.J., U.S.A., E.T.M., V.J.S., R.S., M.L.J. and M.S.). The following authors played a key role in the methodology and formal analysis (M.H.R., L.P., J.Z., V.C.B., M.L.J. and M.F.A.). Data curation (T.S., L.P. and M.F.A.), writing—original draft preparation (T.S. and M.S.), project administration (T.S. and M.S.), and funding acquisition (T.S. and M.S.). All authors have read and approved the final version of the manuscript.

Funding

This work was supported, in part, by NIDDK R01DK107490 (Srivastava, Sharma), Kiersznowski Family Charitable Trust (Srivastava), Sam and Helen Kaplan Research Fund in Pediatric Nephrology (Alon, Srivastava), and funds from the Midwest Veterans Biomedical Research Foundation and KCVA Medical Center, Kansas City, MO (Sharma). Mukut Sharma received support, in part, from the Department of Veterans Affairs VA BX001037 during the period of this study.

Institutional Review Board Statement

This study was carried out using protocols approved by the Institutional Animal Care and Use Committee (IACUC), Safety Subcommittee, and the R&D Committee at the VA Medical Center, Kansas City, MO, USA.

Informed Consent Statement

Not applicable.

Data Availability Statement

GEO dataset, GSE 53996, “Effects of high-fat induced obesity on gene expression in mouse kidney”. GEO dataset samples: GSM1305179 LFD-sham_1, GSM1305180 LFD-sham_2, GSM1305181 LFD-sham_3, GSM1305182 LFD-sham_4, GSM1305183 LFD-UNX_1, GSM1305184 LFD-UNX_2, GSM1305185 LFD-UNX_3, and GSM1305186 LFD-UNX_4.

Acknowledgments

The views expressed in this article are those of the authors and do not necessarily reflect the position or policy of the Department of Veterans Affairs or the United States government. The Medical Writing Center at the Children’s Mercy Hospital provided editing support for the manuscript.

Conflicts of Interest

The authors have no competing financial interests to declare regarding the contents of the manuscript.

References

  1. Celsi, G.; Larsson, L.; Seri, I.; Savin, V.; Aperia, A. Glomerular adaptation in uninephrectomized young rats. Pediatr. Nephrol. 1989, 3, 280–285. [Google Scholar] [CrossRef]
  2. Celsi, G.; Savin, J.; Henter, J.I.; Sohtell, M. The contribution of ultrafiltration pressure for glomerular hyperfiltration in young nephrectomized rats. Acta Physiol. Scand. 1991, 141, 483–487. [Google Scholar] [CrossRef]
  3. Kriz, W.; Lemley, K.V. A potential role for mechanical forces in the detachment of podocytes and the progression of CKD. J. Am. Soc. Nephrol. 2015, 26, 258–269. [Google Scholar] [CrossRef] [Green Version]
  4. Kriz, W.; Lemley, K.V. Potential relevance of shear stress for slit diaphragm and podocyte function. Kidney Int. 2017, 91, 1283–1286. [Google Scholar] [CrossRef]
  5. Srivastava, T.; Thiagarajan, G.; Alon, U.S.; Sharma, R.; El-Meanawy, A.; McCarthy, E.T.; Savin, V.J.; Sharma, M. Role of biomechanical forces in hyperfiltration-mediated glomerular injury in congenital anomalies of the kidney and urinary tract. Nephrol. Dial. Transpl. 2017, 32, 759–765. [Google Scholar] [CrossRef] [Green Version]
  6. Sharma, M.; Sharma, R.; McCarthy, E.T.; Savin, V.J.; Srivastava, T. Hyperfiltration-associated biomechanical forces in glomerular injury and response: Potential role for eicosanoids. Prostaglandins Other Lipid Mediat. 2017, 132, 59–68. [Google Scholar] [CrossRef] [PubMed]
  7. Friedrich, C.; Endlich, N.; Kriz, W.; Endlich, K. Podocytes are sensitive to fluid shear stress in vitro. Am. J. Physiol. Renal Physiol. 2006, 291, F856–F865. [Google Scholar] [CrossRef] [Green Version]
  8. Endlich, N.; Kress, K.R.; Reiser, J.; Uttenweiler, D.; Kriz, W.; Mundel, P.; Endlich, K. Podocytes respond to mechanical stress in vitro. J. Am. Soc. Nephrol. 2001, 12, 413–422. [Google Scholar] [CrossRef]
  9. Srivastava, T.; Celsi, G.E.; Sharma, M.; Dai, H.; McCarthy, E.T.; Ruiz, M.; Cudmore, P.A.; Alon, U.S.; Sharma, R.; Savin, V.A. Fluid flow shear stress over podocytes is increased in the solitary kidney. Nephrol. Dial. Transpl. 2014, 29, 65–72. [Google Scholar] [CrossRef] [PubMed] [Green Version]
  10. Srivastava, T.; Alon, U.S.; Cudmore, P.A.; Tarakji, B.; Kats, A.; Garola, R.E.; Duncan, R.S.; McCarthy, E.T.; Sharma, R.; Johnson, M.L.; et al. Cyclooxygenase-2, prostaglandin E2, and prostanoid receptor EP2 in fluid flow shear stress-mediated injury in the solitary kidney. Am. J. Physiol. Ren. Physiol. 2014, 307, F1323–F1333. [Google Scholar] [CrossRef] [PubMed]
  11. Srivastava, T.; McCarthy, E.T.; Sharma, R.; Kats, A.; Carlton, C.G.; Alon, U.S.; Cudmore, P.A.; El-Meanawy, A.; Sharma, M. Fluid flow shear stress upregulates prostanoid receptor EP2 but not EP4 in murine podocytes. Prostaglandins Other Lipid Mediat 2013, 104–105, 49–57. [Google Scholar] [CrossRef] [PubMed]
  12. Srivastava, T.; McCarthy, E.T.; Sharma, R.; Cudmore, P.A.; Sharma, M.; Johnson, M.L.; Bonewald, L.F. Prostaglandin E(2) is crucial in the response of podocytes to fluid flow shear stress. J. Cell Commun. Signal 2010, 4, 79–90. [Google Scholar] [CrossRef] [Green Version]
  13. Srivastava, T.; Ju, W.; Milne, G.L.; Rezaiekhaligh, M.H.; Staggs, V.S.; Alon, U.S.; Sharma, R.; Zhou, J.; El-Meanawy, A.; McCarthy, E.T.; et al. Urinary prostaglandin E2 is a biomarker of early adaptive hyperfiltration in solitary functioning kidney. Prostaglandins Other Lipid Mediat. 2020, 146, 106403. [Google Scholar] [CrossRef]
  14. Srivastava, T.; Dai, H.; Heruth, D.P.; Alon, U.S.; Garola, R.E.; Zhou, J.; Duncan, R.S.; El-Meanawy, A.; McCarthy, E.T.; Sharma, R.; et al. Mechanotransduction signaling in podocytes from fluid flow shear stress. Am. J. Physiol. Ren. Physiol. 2018, 314, F22–F34. [Google Scholar] [CrossRef] [Green Version]
  15. Srivastava, T.; Joshi, T.; Jiang, Y.; Heruth, D.P.; Rezaiekhaligh, M.H.; Novak, J.; Staggs, V.S.; Alon, U.S.; Garola, R.E.; El-Meanawy, A.; et al. Upregulated proteoglycan-related signaling pathways in fluid flow shear stress-treated podocytes. Am. J. Physiol. Ren. Physiol. 2020, 319, F312–F322. [Google Scholar] [CrossRef]
  16. Fang, D.; Hawke, D.; Zheng, Y.; Yan Xia, Y.; Meisenhelder, J.; Nika, H.; Mills, G.B.; Kobayashi, R.; Hunter, T.; Lu, Z. Phosphorylation of β-catenin by AKT promotes β-catenin transcriptional activity. J. Biol. Chem. 2007, 282, 11221–11229. [Google Scholar] [CrossRef] [Green Version]
  17. Taurin, S.; Sandbo, N.; Qin, Y.; Browning, D.; Dulin, N.O. Phosphorylation of β-Catenin by Cyclic AMP-dependent Protein Kinase. J. Biol. Chem. 2006, 281, 9971–9976. [Google Scholar] [CrossRef] [Green Version]
  18. Liu, C.; Li, Y.; Semenov, M.; Han, C.; Baeg, G.H.; Tan, Y.; Zhang, Z.; Lin, X.; He, X. Control of beta-catenin phosphorylation/degradation by a dual-kinase mechanism. Cell 2002, 108, 837–847. [Google Scholar] [CrossRef] [Green Version]
  19. Zhou, L.; Chen, X.; Lu, M.; Wu, Q.; Yuan, Q.; Hu, C.; Miao, J.; Zhang, Y.; Li, H.; Hou, F.F.; et al. Wnt/β-catenin links oxidative stress to podocyte injury and proteinuria. Kidney Int. 2019, 95, 830–845. [Google Scholar] [CrossRef] [PubMed]
  20. Dai, C.; Stolz, D.B.; Kiss, L.P.; Monga, S.P.; Holzman, L.B.; Liu, Y. Wnt/β-Catenin Signaling promotes podocyte dysfunction and albuminuria. J. Am. Soc. Nephrol. 2009, 20, 1997–2008. [Google Scholar] [CrossRef] [Green Version]
  21. Dasgupta, R.; Fuchs, E. Multiple roles for activated LEF/TCF transcription complexes during hair follicle development and differentiation. Development 1999, 126, 4557–4568. [Google Scholar] [CrossRef]
  22. Edgar, R.; Domrachev, M.; Lash, A.E. Gene Expression Omnibus: NCBI gene expression and hybridization array data repository. Nucleic Acids Res. 2002, 30, 207–210. [Google Scholar] [CrossRef] [Green Version]
  23. Barrett, T.; Wilhite, S.E.; Ledoux, P.; Evangelista, C.; Kim, I.F.; Tomashevsky, M.; Marshall, K.A.; Phillippy, K.H.; Sherman, P.M.; Holko, M.; et al. NCBI GEO: Archive for functional genomics data sets—Update. Nucleic Acids Res. 2013, 41, D991–D995. [Google Scholar] [CrossRef] [Green Version]
  24. Moeller, M.J.; Kovari, I.A.; Holzman, L.B. Evaluation of a new tool for exploring podocyte biology: Mouse Nphs1 5’ flanking region drives LacZ expression in podocytes. J. Am. Soc. Nephrol. 2000, 11, 2306–2314. [Google Scholar] [CrossRef] [PubMed]
  25. Working Group of the International IgA Nephropathy Network and the Renal Pathology Society; Roberts, I.S.; Cook, H.T.; Troyanov, S.; Alpers, C.E.; Amore, A.; Barratt, J.; Berthoux, F.; Bonsib, S.; Bruijn, J.A.; et al. The Oxford classification of IgA nephropathy: Pathology definitions, correlations, and reproducibility. Kidney Int. 2009, 76, 546–556. [Google Scholar] [CrossRef] [PubMed] [Green Version]
  26. Schneider, C.A.; Rasband, W.S.; Eliceiri, K.W. NIH Image to ImageJ: 25 years of image analysis. Nat. Methods 2012, 9, 671–675. [Google Scholar] [CrossRef]
  27. Schindelin, J.; Arganda-Carreras, I.; Frise, E.; Kaynig, V.; Longair, M.; Pietzsch, T.; Preibisch, S.; Rueden, C.; Saalfeld, S.; Schmid, B.; et al. Fiji: An open-source platform for biological-image analysis. Nat. Methods 2012, 9, 676–682. [Google Scholar] [CrossRef] [Green Version]
  28. Shankland, S.J.; Pippin, J.W.; Reiser, J.; Mundel, P. Podocytes in culture: Past, present, and future. Kidney Int. 2007, 72, 26–36. [Google Scholar] [CrossRef] [Green Version]
  29. Gai, Z. Genome-wide profiling to analyze the effects of high fat diet induced obesity on renal gene expression in mouse with reduced renal mass. Genom. Data 2014, 2, 42–43. [Google Scholar] [CrossRef] [PubMed] [Green Version]
  30. Gai, Z.; Hiller, C.; Chin, S.H.; Hofstetter, L.; Stieger, B.; Konrad, D.; Kullak-Ublick, G.A. Uninephrectomy augments the effects of high fat diet induced obesity on gene expression in mouse kidney. Biochim. Biophys. Acta 2014, 1842, 1870–1878. [Google Scholar] [CrossRef] [Green Version]
  31. Daković-Bjelaković, M.; Vlajković, S.; Cukuranović, R.; Antić, S.; Bjelaković, G.; Mitić, D. Quantitative analysis of the nephron during human fetal kidney development. Vojn. Pregl. 2005, 62, 281–286. [Google Scholar] [CrossRef]
  32. Ito, S.; Nagasawa, T.; Abe, M.; Mori, T. Strain vessel hypothesis: A viewpoint for linkage of albuminuria and cerebro-cardiovascular risk. Hypertens. Res. 2009, 32, 115–121. [Google Scholar] [CrossRef]
  33. Sherman, R.L.; Susin, M.; Mouradian, J. Focal glomerular sclerosis. Perspect. Nephrol. Hypertens. 1977, 6, 175–186. [Google Scholar] [PubMed]
  34. Sharma, R.; Sharma, M.; Reddy, S.; Savin, V.J.; Nagaria, A.M.; Wiegmann, T.B. Chronically increased intrarenal angiotensin II causes nephropathy in an animal model of type 2 diabetes. Front. Biosci. 2006, 11, 968–976. [Google Scholar] [CrossRef] [Green Version]
  35. Savin, V.J.; Sharma, R.; Sharma, M.; McCarthy, E.T.; Swan, S.K.; Ellis, E.; Lovell, H.; Warady, B.; Gunwar, S.; Chonko, A.M.; et al. Circulating factor associated with increased glomerular permeability to albumin in recurrent focal segmental glomerulosclerosis. N. Engl. J. Med. 1996, 334, 878–883. [Google Scholar] [CrossRef]
  36. Rangel-Filho, A.; Sharma, M.; Datta, Y.; Moreno, C.; Roman, R.J.; Iwamoto, Y.; Provoost, A.; Lazar, J.; Jacob, H.J. Rab38 is the RF-2 gene and it modulates proteinuria and albuminuria independently of changes in glomerular permeability in the Fawn Hooded hypertensive rat. J. Am. Soc. Nephrol. 2005, 16, 852–856. [Google Scholar] [CrossRef] [Green Version]
  37. Dahly-Vernon, A.J.; Sharma, M.; McCarthy, E.T.; Savin, V.J.; Ledbetter, S.R.; Roman, R.J. Transforming growth factor-beta, 20-HETE interaction, and glomerular injury in Dahl salt-sensitive rats. Hypertension 2005, 45, 643–648. [Google Scholar] [CrossRef] [Green Version]
  38. Sharma, M.; McCarthy, E.T.; Sharma, R.; Fish, B.L.; Savin, V.J.; Cohen, E.P.; Moulder, J.E. Arachidonic acid metabolites mediate the radiation-induced increase in glomerular albumin permeability. Exp. Biol. Med. 2006, 231, 99–106. [Google Scholar] [CrossRef]
  39. McCarthy, E.T.; Sharma, M. Indomethacin protects permeability barrier from focal segmental glomerulosclerosis serum. Kidney Int. 2002, 61, 534–541. [Google Scholar] [CrossRef] [PubMed] [Green Version]
  40. Westland, R.; Schreuder, M.F.; Bökenkamp, A.; Spreeuwenberg, M.D.; Van WiJk, J.A. Renal injury in children with a solitary functioning kidney—the KIMONO study. Nephrol. Dial. Transpl. 2011, 26, 1533–1541. [Google Scholar] [CrossRef] [Green Version]
  41. Schreuder, M.F.; Langemeijer, M.E.; Bökenkamp, A.; Delemarre-Van de Waal, H.A.; Van Wijk, J.A. Hypertension and microalbuminuria in children with congenital solitary kidneys. J. Paediatr. Child Health 2008, 44, 363–368. [Google Scholar] [CrossRef]
  42. Hens, J.R.; Wilson, K.M.; Dann, P.; Chen, X.; Horowitz, M.C.; Wysolmerski, J.J. TOPGAL mice show that the canonical Wnt signaling pathway is active during bone development and growth and is activated by mechanical loading in vitro. J. Bone Miner. Res. 2005, 20, 1103–1113. [Google Scholar] [CrossRef] [PubMed]
  43. Wang, Y.; Newman, M.R.; Ackun-Farmmer, M.; Baranello, M.P.; Sheu, T.J.; Puzas, J.E.; Benoit, D.S.W. Fracture-Targeted Delivery of β-Catenin Agonists via Peptide-Functionalized Nanoparticles Augments Fracture Healing. ACS Nano 2017, 11, 9445–9458. [Google Scholar] [CrossRef] [Green Version]
  44. Holguin, N.; Brodt, M.D.; Silva, M.J. Activation of Wnt Signaling by Mechanical Loading Is Impaired in the Bone of Old Mice. J. Bone Miner. Res. 2016, 31, 2215–2226. [Google Scholar] [CrossRef]
  45. Lara-Castillo, N.; Kim-Weroha, N.A.; Kamel, M.A.; Javaheri, B.; Ellies, D.L.; Krumlauf, R.E.; Thiagarajan, G.; Johnson, M.L. In vivo mechanical loading rapidly activates β-catenin signaling in osteocytes through a prostaglandin mediated mechanism. Bone 2015, 76, 58–66. [Google Scholar] [CrossRef] [Green Version]
  46. Bonewald, L.F.; Johnson, M.L. Osteocytes, mechanosensing and Wnt signaling. Bone 2008, 42, 606–615. [Google Scholar] [CrossRef] [PubMed] [Green Version]
  47. Kamel, M.A.; Picconi, J.L.; Lara-Castillo, N.; Johnson, M.L. Activation of β-catenin signaling in MLO-Y4 osteocytic cells versus 2T3 osteoblastic cells by fluid flow shear stress and PGE2: Implications for the study of mechanosensation in bone. Bone 2010, 47, 872–881. [Google Scholar] [CrossRef] [Green Version]
  48. Kitase, Y.; Barragan, L.; Qing, H.; Kondoh, S.; Jiang, J.X.; Johnson, M.L.; Bonewald, L.F. Mechanical induction of PGE2 in osteocytes blocks glucocorticoid-induced apoptosis through both the β-catenin and PKA pathways. J. Bone Miner. Res. 2010, 25, 2657–2668. [Google Scholar] [CrossRef] [PubMed] [Green Version]
  49. Robinson, J.A.; Chatterjee-Kishore, M.; Yaworsky, P.J.; Cullen, D.M.; Zhao, W.; Li, C.; Kharode, Y.; Sauter, L.; Babij, P.; Brown, E.L.; et al. Wnt/β-catenin signaling is a normal physiological response to mechanical loading in bone. J. Biol. Chem. 2006, 281, 31720–31728. [Google Scholar] [CrossRef]
  50. Xia, X.; Batra, N.; Shi, Q.; Bonewald, L.F.; Sprague, E.; Jiang, J.X. Prostaglandin promotion of osteocyte gap junction function through transcriptional regulation of connexin 43 by glycogen synthase kinase 3/β-catenin signaling. Mol. Cell Biol. 2010, 30, 206–219. [Google Scholar] [CrossRef] [Green Version]
  51. Sheng, H.; Shao, J.; Washington, M.K.; DuBois, R.N. Prostaglandin E2 increases growth and motility of colorectal carcinoma cells. J. Biol. Chem. 2001, 276, 18075–18081. [Google Scholar] [CrossRef] [PubMed] [Green Version]
  52. Tessner, T.G.; Muhale, F.; Riehl, T.E.; Anant, S.; Stenson, W.F. Prostaglandin E2 reduces radiation-induced epithelial apoptosis through a mechanism involving AKT activation and bax translocation. J. Clin. Investig. 2004, 114, 1676–1685. [Google Scholar] [CrossRef] [PubMed] [Green Version]
  53. Tetsu, O.; McCormick, F. β-Catenin regulates expression of cyclin D1 in colon carcinoma cells. Nature 1999, 398, 422–426. [Google Scholar] [CrossRef]
  54. Leone, V.; di Palma, A.; Ricchi, P.; Acquaviva, F.; Giannouli, M.; Di Prisco, A.M.; Iuliano, F.; Acquaviva, A.M. PGE2 inhibits apoptosis in human adenocarcinoma Caco-2 cell line through Ras-PI3K association and cAMP-dependent kinase A activation. Am. J. Physiol. Gastrointest Liver Physiol. 2007, 293, G673–G681. [Google Scholar] [CrossRef]
  55. Hino, S.; Tanji, C.; Nakayama, K.I.; Kikuchi, A. Phosphorylation of β-catenin by cyclic AMP-dependent protein kinase stabilizes β-catenin through inhibition of its ubiquitination. Mol. Cell Biol. 2005, 25, 9063–9072. [Google Scholar] [CrossRef] [Green Version]
  56. Chun, K.S.; Lao, H.C.; Trempus, C.S.; Okada, M.; Langenbach, R. The prostaglandin receptor EP2 activates multiple signaling pathways and β-arrestin1 complex formation during mouse skin papilloma development. Carcinogenesis 2009, 30, 1620–1627. [Google Scholar] [CrossRef] [Green Version]
  57. Chun, K.S.; Lao, H.C.; Langenbach, R. The prostaglandin E2 receptor, EP2, stimulates keratinocyte proliferation in mouse skin by G protein-dependent and β-arrestin1-dependent signaling pathways. J. Biol. Chem. 2010, 285, 39672–39681. [Google Scholar] [CrossRef] [Green Version]
  58. Pai, R.; Nakamura, T.; Moon, W.S.; Tarnawski, A.S. Prostaglandins promote colon cancer cell invasion; signaling by crosstalk between two distinct growth factor receptors. FASEB J. 2003, 17, 1640–1647. [Google Scholar] [CrossRef]
  59. Pozzi, A.; Yan, X.; Macias-Perez, I.; Wei, S.; Hata, A.N.; Breyer, R.M.; Morrow, J.D.; Capdevila, J.H. Colon carcinoma cell growth is associated with prostaglandin E2/EP4 receptor evoked ERK activation. J. Biol. Chem. 2004, 279, 29797–29804. [Google Scholar] [CrossRef] [Green Version]
  60. He, X.C.; Yin, T.; Grindley, J.C.; Tian, Q.; Sato, T.; Tao, W.A.; Dirisina, R.; Porter-Westpfahl, K.S.; Hembree, M.; Johnson, T.; et al. PTEN-deficient intestinal stem cells initiate intestinal polyposis. Nat. Genet. 2007, 39, 189–198. [Google Scholar] [CrossRef] [PubMed] [Green Version]
  61. Srivastava, T.; Hariharan, S.; Alon, U.S.; McCarthy, E.T.; Sharma, R.; El-Meanawy, A.; Savin, V.J.; Sharma, M. Hyperfiltration-mediated Injury in the Remaining Kidney of a Transplant Donor. Transplantation 2018, 102, 1624–1635. [Google Scholar] [CrossRef]
  62. Muzaale, A.D.; Massie, A.B.; Wang, M.C.; Montgomery, R.A.; McBride, M.A.; Wainright, J.L.; Segev, D.L. Risk of end-stage renal disease following live kidney donation. JAMA 2014, 311, 579–586. [Google Scholar] [CrossRef]
  63. Mjøen, G.; Hallan, S.; Hartmann, A.; Foss, A.; Midtvedt, K.; Øyen, O.; Reisæter, A.; Pfeffer, P.; Jenssen, T.; Leivestad, T.; et al. Long-term risks for kidney donors. Kidney Int. 2014, 86, 162–167. [Google Scholar] [CrossRef] [PubMed] [Green Version]
  64. Grams, M.E.; Sang, Y.; Levey, A.S.; Matsushita, K.; Ballew, S.; Chang, A.R.; Chow, E.K.; Kasiske, B.L.; Kovesdy, C.P.; Nadkarni, G.N.; et al. Chronic Kidney Disease Prognosis Consortium. Kidney-Failure Risk Projection for the Living Kidney-Donor Candidate. N. Engl. J. Med. 2016, 374, 411–421. [Google Scholar] [CrossRef]
  65. O’Keeffe, L.M.; Ramond, A.; Oliver-Williams, C.; Willeit, P.; Paige, E.; Trotter, P.; Evans, J.; Wadström, J.; Nicholson, M.; Collett, D.; et al. Mid- and Long-Term Health Risks in Living Kidney Donors: A Systematic Review and Meta-analysis. Ann. Intern. Med. 2018, 168, 276–284. [Google Scholar] [CrossRef] [PubMed]
  66. Ibrahim, H.N.; Foley, R.N.; Reule, S.A.; Spong, R.; Kukla, A.; Issa, N.; Berglund, D.M.; Sieger, G.K.; Matas, A.J. Renal Function Profile in White Kidney Donors: The First 4 Decades. J. Am. Soc. Nephrol. 2016, 27, 2885–2893. [Google Scholar] [CrossRef] [PubMed] [Green Version]
  67. Massie, A.B.; Muzaale, A.D.; Luo, X.; Chow, E.K.H.; Locke, J.E.; Nguyen, A.Q.; Henderson, M.L.; Snyder, J.J.; Segev, D.L. Quantifying Postdonation Risk of ESRD in Living Kidney Donors. J. Am. Soc. Nephrol. 2017, 28, 2749–2755. [Google Scholar] [CrossRef] [PubMed]
  68. Matas, A.J.; Berglund, D.M.; Vock, D.M.; Ibrahim, H.N. Causes and timing of end-stage renal disease after living kidney donation. Am. J. Transpl. 2018, 18, 1140–1150. [Google Scholar] [CrossRef] [PubMed] [Green Version]
  69. Sanna-Cherci, S.; Ravani, P.; Corbani, V.; Parodi, S.; Haupt, R.; Piaggio, G.; Innocenti, M.L.; Somenzi, D.; Trivelli, A.; Caridi, G.; et al. Renal outcome in patients with congenital anomalies of the kidney and urinary tract. Kidney Int. 2009, 76, 528–533. [Google Scholar] [CrossRef] [PubMed] [Green Version]
  70. Westland, R.; Kurvers, R.A.; van Wijk, J.A.; Schreuder, M.F. Risk factors for renal injury in children with a solitary functioning kidney. Pediatrics 2013, 131, e478–e485. [Google Scholar] [CrossRef] [PubMed] [Green Version]
  71. Westland, R.; Schreuder, M.F.; Ket, J.C.; van Wijk, J.A. Unilateral renal agenesis: A systematic review on associated anomalies and renal injury. Nephrol. Dial. Transpl. 2013, 28, 1844–1855. [Google Scholar] [CrossRef] [PubMed] [Green Version]
  72. Argueso, L.R.; Ritchey, M.L.; Boyle, E.T., Jr.; Milliner, D.S.; Bergstralh, E.J.; Kramer, S.A. Prognosis of patients with unilateral renal agenesis. Pediatr. Nephrol. 1992, 6, 412–416. [Google Scholar] [CrossRef] [PubMed]
Figure 1. Phosphorylation of β-catenin at Ser552 or Ser675 results in its translocation to the nucleus. EP2 initiates the activation of β-catenin through five known intermediates. As EP2 is a G-protein coupled receptor, it activates the heterotrimeric (αβγ) Gs protein, leading to (1) the release of the Gβγ complex, thus activating PI3K/AKT, which phosphorylates and inactivates GSK3β, resulting in the nuclear translocation of active β-catenin (Middle), (2) binding of the Gα complex to Axin and release of β-catenin from the Axin-β-catenin-GSK3β complex (Right), and (3) generation of cAMP and activation of PKA, which activate β-catenin. (4) The PGE2 receptor EP2 recruits β-arrestin 1 and phosphorylates Src-kinase, which transactivates the EGFR signaling network of the PI3K/AKT, HGF/c-Met, and Ras/ERK pathways. (5) The transactivation of c-Met by PGE2 through EGFR also leads to an increase in nuclear β-catenin (Left). EP2 activation and PI3K/AKT also activate extracellular signal-regulated kinase (ERK).
Cells 10 01253 g001
Figure 2. Box-plot distribution of (A) the glomerular area, (B) glomerular perimeter, (C) mesangial area, (D) mesangial cell count, and (E) representative glomeruli from superficial cortical glomeruli (upper row) and deep intramedullary glomeruli (lower row) in TOPGAL animals at 4 and 12 weeks following unilateral nephrectomy or sham treatment at 4 weeks of age. These measurements were performed on 15 glomeruli (10 outer cortical glomeruli and 5 inner juxtamedullary glomeruli) in kidneys stained with Periodic Acid-Schiff stain at 4 weeks and 12 weeks. The data from all glomeruli are shown in the left panel, outer cortical glomeruli in the middle panel, and inner juxtamedullary glomeruli in the right panel. There were 12 sham and 12 UNX animals at 4 weeks and 11 sham and 12 UNX animals at 12 weeks. The values represent the mean ± SD; the p-values were obtained using unpaired Students’ t-test. The circles in box-plot distribution represent outliers.
Cells 10 01253 g002aCells 10 01253 g002b
Figure 3. Box-plot distribution of urine albumin/creatinine ratios in TOPGAL animals at the baseline prior to unilateral nephrectomy (UNX) at 4 weeks of age in the sham and UNX groups and at 4 and 12 weeks. These measurements were performed on 12 sham and 12 UNX animals at 4 weeks following UNX and 11 sham and 12 UNX animals at 12 weeks following UNX. The baseline measurements of 4 weeks and 12 weeks animals were combined into a single baseline group. The values for the sham-treated mice are shown in the white boxplots, and those for the UNX mice are shown in the gray boxplots. The circles in box-plot distribution represent outliers.
Cells 10 01253 g003
Figure 4. Confocal microscopy images show an increased expression of β-galactosidase (green fluorescence) as the relative fluorescence units/area at 4 weeks but not at 12 weeks (Table 2). Podocalyxin (red fluorescence) identifies the podocytes within the glomerulus. Unilateral nephrectomy is associated with glomerular hypertrophy. The bar graph shows the net relative fluorescence units/glomerulus.
Cells 10 01253 g004
Figure 5. X-gal staining for β-galactosidase in TOPGAL animals at 4 and 12 weeks following unilateral nephrectomy or sham treatment at 4 weeks of age. The X-gal staining was measured using a semi-quantitative score of 0–4 of all the glomeruli in the section. The X-gal staining showed an increased expression of β-galactosidase at 4 weeks but not at 12 weeks. The arrowheads mark the X-gal positive podocytes. The bar graph shows the mean ± SD of the β-galactosidase expression at 4 and 12 weeks following UNX.
Cells 10 01253 g005
Figure 6. Confocal microscopy images show the expression of β-catenin (green fluorescence) and Podocalyxin (red fluorescence) in TOPGAL animals at 4 and 12 weeks following unilateral nephrectomy or sham treatment at 4 weeks of age. Unilateral nephrectomy is associated with glomerular hypertrophy. The bar graph shows the net relative fluorescence units/glomerulus. The values are shown as the mean relative fluorescence units [RFU] ± SD; the p-values were obtained using unpaired Students’ t-test.
Cells 10 01253 g006
Figure 7. Phosphorylated (Ser552 and Ser675) and non-phosphorylated (Total) β-catenin in the nuclei of podocytes exposed to fluid flow shear stress (FFSS). Untreated (Control) cells were compared with podocytes exposed to FFSS at 2 dynes/cm2 for 2 h, which were observed at the end of FFSS (End-FFSS), Post-2 h FFSS, and Post-24 h FFSS. Representative immunofluorescence images are shown. The box-plot distribution for the relative fluorescence units (RFU) in the nuclei of podocytes is on the far right.
Cells 10 01253 g007
Table 1. (AD): The table shows the glomerular area (A), glomerular perimeter (B), mesangial area (C), and mesangial cell count (D) in TOPGAL animals at 4 and 12 weeks following unilateral nephrectomy or sham treatment at 4 weeks of age. The measurements were performed on 15 glomeruli (10 outer cortical glomeruli and 5 inner juxtamedullary glomeruli) in a kidney section stained with Periodic Acid Schiff stain. This was performed on 12 sham and 12 UNX animals at 4 weeks and 11 sham and 12 UNX animals at 12 weeks. The values are shown as the Mean ± SD; the p-values were obtained using unpaired Students’ t-test.
A. Glomerular Area (µm2) 4 Weeksp-Value12 Weeksp-Value
All Glomeruli (n = 15)Sham4039 ± 1494 4352 ± 1700
UNX4507 ± 17190.0065010 ± 1741<0.001
Outer Cortical Glomeruli (n = 10)Sham3711 ± 1165 3840 ± 1119
UNX4031 ± 12100.0374609 ± 1230<0.001
Juxtamedullary Glomeruli (n = 5)Sham4679 ± 1833 5349 ± 2152
UNX5480 ± 21560.0315825 ± 22770.251
B. Glomerular Perimeter (µm) 4 Weeksp-Value12 Weeksp-Value
All Glomeruli (n = 15)Sham247.9 ± 46.7 252.3 ± 46.9
UNX261.3 ± 50.20.009274.0 ± 46.8<0.001
Outer Cortical Glomeruli (n = 10)Sham239.9 ± 38.3 239.0 ± 34.7
UNX248.5 ± 40.00.091264.6 ± 36.4<0.001
Juxtamedullary Glomeruli (n = 5)Sham263.3 ± 57.1 278.2 ± 56.2
UNX287.7 ± 58.60.023293.3 ± 58.50.161
C. Mesangial Area (µm2) 4 Weeksp-Value12 Weeksp-Value
All Glomeruli (n = 15)Sham970 ± 444 1061 ± 526
UNX1066 ± 6080.0891364 ± 670<0.001
Outer Cortical Glomeruli (n = 10)Sham1012 ± 432 1014 ± 499
UNX1016 ± 5290.9501319 ± 616<0.001
Juxtamedullary Glomeruli (n = 5)Sham889 ± 458 1151 ± 567
UNX1169 ± 7370.0141456 ± 7660.016
D. Mesangial Cell Count (n) 4 Weeksp-Value12 Weeksp-Value
All Glomeruli (n = 15)Sham17.1 ± 4.7 17.2 ± 6.1
UNX17.8 ± 5.80.19119.1 ± 5.80.003
Outer Cortical Glomeruli (n = 10)Sham17.3 ± 5.0 17.0 ± 5.7
UNX17.9 ± 5.60.45219.0 ± 5.50.006
Juxtamedullary Glomeruli (n = 5)Sham16.4 ± 4.2 17.7 ± 6.9
UNX17.6 ± 6.10.23619.3 ± 6.20.196
Table 2. Expression of β-galactosidase determined using immunofluorescence and X-gal staining in TOPGAL animals at 4 and 12 weeks following unilateral nephrectomy or sham treatment at 4 weeks of age. The measurements were performed in 3 sham and 3 UNX animals at 4 weeks and 12 weeks in separate sets of animals. No single animal was studied using two methods to demonstrate a change in β-galactosidase. The values are shown as the mean ± SD; the p-values were obtained using an unpaired Students’ t-test. RFU- Relative Fluorescence Units.
β-GalactosidaseGroup4 Weeksp-Value12 Weeksp-Value
Immunofluorescence (RFU/µm2)Sham14.8 ± 8.5 48.5 ± 29.5
n = 3UNX37.1 ± 9.8<0.00136.0 ± 24.40.16
X-Gal Score (0–4)Sham0.51 ± 0.10 0.94 ± 0.26
n = 3UNX0.99 ± 0.080.0081.03 ± 0.200.650
Table 3. Expression of β-catenin using immunofluorescence in TOPGAL animals at 4 and 12 weeks following unilateral nephrectomy or sham treatment at 4 weeks of age. Fluorescence measurements were performed in 3 Sham and 3 UNX animals at 4 weeks and 12 weeks. The values are shown as the mean relative fluorescence units [RFU] ± SD; the p-values were obtained using unpaired Students’ t-test.
β-Catenin in TOPGAL (RFU/µm2)Group4 Weeksp-Value12 Weeksp-Value
p-β-catenin (Ser552)Sham3.10 ± 1.28 2.72 ± 1.78
UNX5.85 ± 2.250.0052.79 ± 1.560.935
p-β-catenin (Ser675)Sham3.69 ± 1.32 2.20 ± 1.18
UNX3.07 ± 0.790.1702.93 ± 1.170.197
Total β-cateninSham3.41 ± 1.86 2.65 ± 1.65
UNX4.26 ± 1.860.1114.16 ± 2.150.027
Table 4. Levels of phosphorylated and non-phosphorylated (Total) transcription factor β-catenin in the nuclei of podocytes exposed to fluid flow shear stress (FFSS) using immunofluorescence microscopy. The fluorescence from untreated (Control) cells was compared with podocytes exposed to FFSS at 2 dynes/cm2 for 2 h at the end of FFSS, (End-FFSS), Post-2 h FFSS, and Post-24 h FFSS. The relative fluorescence units (RFU) values are shown as the Mean ± SD; the p-values were obtained using Univariate Analysis of Variance with pairwise comparison, corrected using the Bonferroni post-hoc test.
Nuclear Fluorescence (RFU) ControlEnd-FFSSPost-2 h FFSSPost-24 h FFSS
phospho-β-catenin (Ser552)1246.5 ± 717.62175.7 ± 1677.22584.9 ± 2529.02838.3 ± 1554.5
Control vs. (p value)-<0.001<0.001<0.001
End-FFSS vs. (p value)--0.2300.040
Post-24 h FFSS vs. (p value)---1.000
phospho-β-catenin (Ser675)725.8 ± 321.0965.2 ± 839.3678.7 ± 339.3700.7 ± 418.1
Control vs. (p value)-0.0041.0001.000
End-FFSS vs. (p value)--0.0020.002
Post-24 h FFSS vs. (p value)---1.000
β-catenin (Total)1177.6 ± 621.1919.6 ± 411.91100.1 ± 399.1443.6 ± 200.9
Control vs. (p value)-<0.0010.922<0.001
End-FFSS vs. (p value)--0.013<0.001
Post-24 h FFSS vs. (p value)---<0.001
Table 5. The top 25 canonical pathways identified by Ingenuity Pathway Analysis of the Gene Expression Omnibus dataset on unilaterally nephrectomized mice (GSE 53996).
Ingenuity Canonical Pathways−log(p-Value)
1G-Protein Coupled Receptor Signaling6.16
2Role of Osteoblasts, Osteoclasts and Chondrocytes in Rheumatoid Arthritis4.82
3cAMP-mediated signaling4.71
4CREB Signaling in Neurons4.68
5Axonal Guidance Signaling4.65
6Human Embryonic Stem Cell Pluripotency4.37
7Wnt/β-catenin Signaling4.22
8Synaptic Long-Term Depression4.21
9Actin Cytoskeleton Signaling4.14
10Ephrin Receptor Signaling4.14
11EIF2 Signaling3.91
12Renal Cell Carcinoma Signaling3.9
13Protein Ubiquitination Pathway3.85
14Gαi Signaling3.8
15Androgen Signaling3.66
16Molecular Mechanisms of Cancer3.66
17Regulation of the Epithelial-Mesenchymal Transition Pathway3.63
18Role of Oct4 in Mammalian Embryonic Stem Cell Pluripotency3.6
19Role of Macrophages, Fibroblasts and Endothelial Cells in Rheumatoid Arthritis3.43
20CCR3 Signaling in Eosinophils3.39
21Hepatic Fibrosis/Hepatic Stellate Cell Activation3.39
22Glioblastoma Multiforme Signaling3.26
23Ephrin B Signaling3.24
24Natural Killer Cell Signaling3.21
25Methylglyoxal Degradation III3.19
Table 6. The G-coupled protein receptors identified as Upstream Regulators by Ingenuity Pathway Analysis of the Gene Expression Omnibus dataset on unilaterally nephrectomized mice (GSE 53996).
Upstream RegulatorMolecule TypeActivation z-Scorep-Value of Overlap
PTGER2g-protein coupled receptor1.490.00954
CXCR4g-protein coupled receptor0.8220.000305
SMOg-protein coupled receptor0.7620.00921
CNR1g-protein coupled receptor−0.0420.006
CXCR2g-protein coupled receptor 0.0247
ACKR3g-protein coupled receptor 0.0268
LHCGRg-protein coupled receptor 0.0301
Table 7. The transcription factors identified as Upstream Regulators by Ingenuity Pathway Analysis of the Gene Expression Omnibus dataset on unilaterally nephrectomized mice (GSE 53996). The top 50 of the 230 transcription factors identified by the Ingenuity Pathway Analysis.
Upstream RegulatorExpr Log RatioPredicted Activation StateActivation z-Scorep-Value of Overlap
1CTNNB10.552Activated2.6151.13 × 1010
2HTT −0.3961.72 × 109
3NFE2L2 Activated3.3879.76 × 109
4TP53 1.4820.000000011
5SP1 Activated2.9679.35 × 108
6HDAC10.655 0.2210.000000394
7FOS 1.940.00000153
8SMARCA4 Activated3.7180.00000389
9GATA6 −1.1780.00000608
10FOXA10.651 0.7120.00000686
11KLF4 1.720.00000717
12BRCA1 1.4180.00000737
13TCF7L2 Activated3.0790.000011
14SOX2 1.1660.0000111
15RUNX1 Activated2.1530.0000141
16MYC Activated2.3540.0000185
17PTF1A −0.0440.0000199
18HIF1A Activated2.220.0000202
19GLI1 Activated2.4860.0000259
20EZH2 −0.3740.0000296
21HNF4A 0.720.000032
22CEBPA 1.810.0000429
23GBX2 0.0000443
24SOX10 0.7980.0000493
25EP3000.537 1.2480.0000554
26E2F1 1.080.000056
27CREBBP 1.080.000074
28NFE2L1 0.8960.0000816
29LHX50.581 0.0000998
30WT1 1.380.00011
31PPARGC1A Activated3.0640.000165
32SIX1 1.1950.000179
33SMAD5 −0.150.000179
34POU5F10.505 0.8320.000186
35GATA11.352 1.4310.000188
36SOX3 −0.3020.000241
37FOXC1 1.40.000294
38NFKBIA −0.0190.000321
39MSGN1 Activated20.000482
40EPAS1 1.9450.000485
41CDKN2A0.869 −0.1140.000577
42ARNT2 Activated2.4290.000629
43HNF1A 0.8610.000886
44SIM1 Activated2.4570.000912
45TP63 1.4570.000939
46JUN Activated2.0790.00104
47SMAD4 0.4420.00105
48LHX1 0.170.00105
49SP30.499Activated2.0780.00109
50MECP2 0.00115
Table 8. The kinases identified as Upstream Regulators by the Ingenuity Pathway Analysis of the Gene Expression Omnibus dataset on unilaterally nephrectomized mice (GSE 53996).
Upstream RegulatorExpr Log RatioPredicted Activation StateActivation z-Scorep-Value of Overlap
1EGFR 1.6370.0000143
2ERBB30.431 00.0000514
3GSK3B −0.7720.000473
4BMPR1B 0.5550.00102
5TGFBR2 0.360.00109
6ERBB2 1.4240.00148
7MUSK0.413 0.0018
8TNK2 0.00215
9CDK5 1.1880.00225
10FGFR2−0.337 −0.4130.0027
11ZAP70 1.4630.00412
12INSR Activated2.9590.0044
13PRKAA2 −0.5080.00469
14MAPK9 −0.5650.00512
15MTOR 0.9740.00652
16CDK5R1 0.00677
17DCLK1 0.00679
18BMPR1A Activated2.3940.00867
19MAP4K4 Inhibited−2.3090.00995
20KDR 0.011
21CCND3 −1.1540.0123
22PIM10.746 1.3310.0132
23RET−0.811 0.240.015
24STK11 −0.2770.0151
25MAP2K3 1.3420.0156
26PRKAA1 −0.2130.0156
27MAP2K1 1.7840.0158
28ERBB4 −0.9540.0182
29PRKCA 1.9690.0191
30NDRG1 −0.3740.0194
31GRB2 00.0209
32PIK3CA 0.20.0225
33AKT1 Activated3.1440.0246
34PLK4 10.0268
35FLT3 0.0272
36PTK6 0.0285
37EPHB40.874 0.8160.03
38PLK2 10.0306
39CHEK2 0.0355
40IRAK2 0.0355
41EFNB2 0.0355
42PRKCI 0.5770.039
43IRAK3 0.0417
44IKBKB 0.2470.0422
45TSSK3 0.0464
46CAMK2N1 0.0464
47AMHR2 0.0464
48C8orf44-SGK3/SGK3 0.0464
49WNK3 0.0464
50MAP3K20 0.0464
51STK35 0.0464
52PRKCB −0.3910.048
53RPS6KA5 0.0484
Publisher’s Note: MDPI stays neutral with regard to jurisdictional claims in published maps and institutional affiliations.

