Relationship between Altered miRNA Expression and DNA Methylation of the DLK1-DIO3 Region in Azacitidine-Treated Patients with Myelodysplastic Syndromes and Acute Myeloid Leukemia with Myelodysplasia-Related Changes

 , ,
, ,
Abstract
: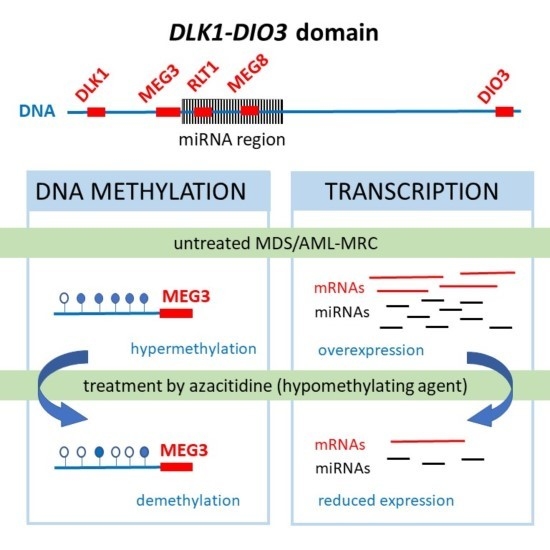
1. Introduction
2. Materials and Methods
2.1. Patients
2.2. Cell Separation and Nucleic Acid Extraction
2.3. miRNA Expression
2.4. Gene Expression
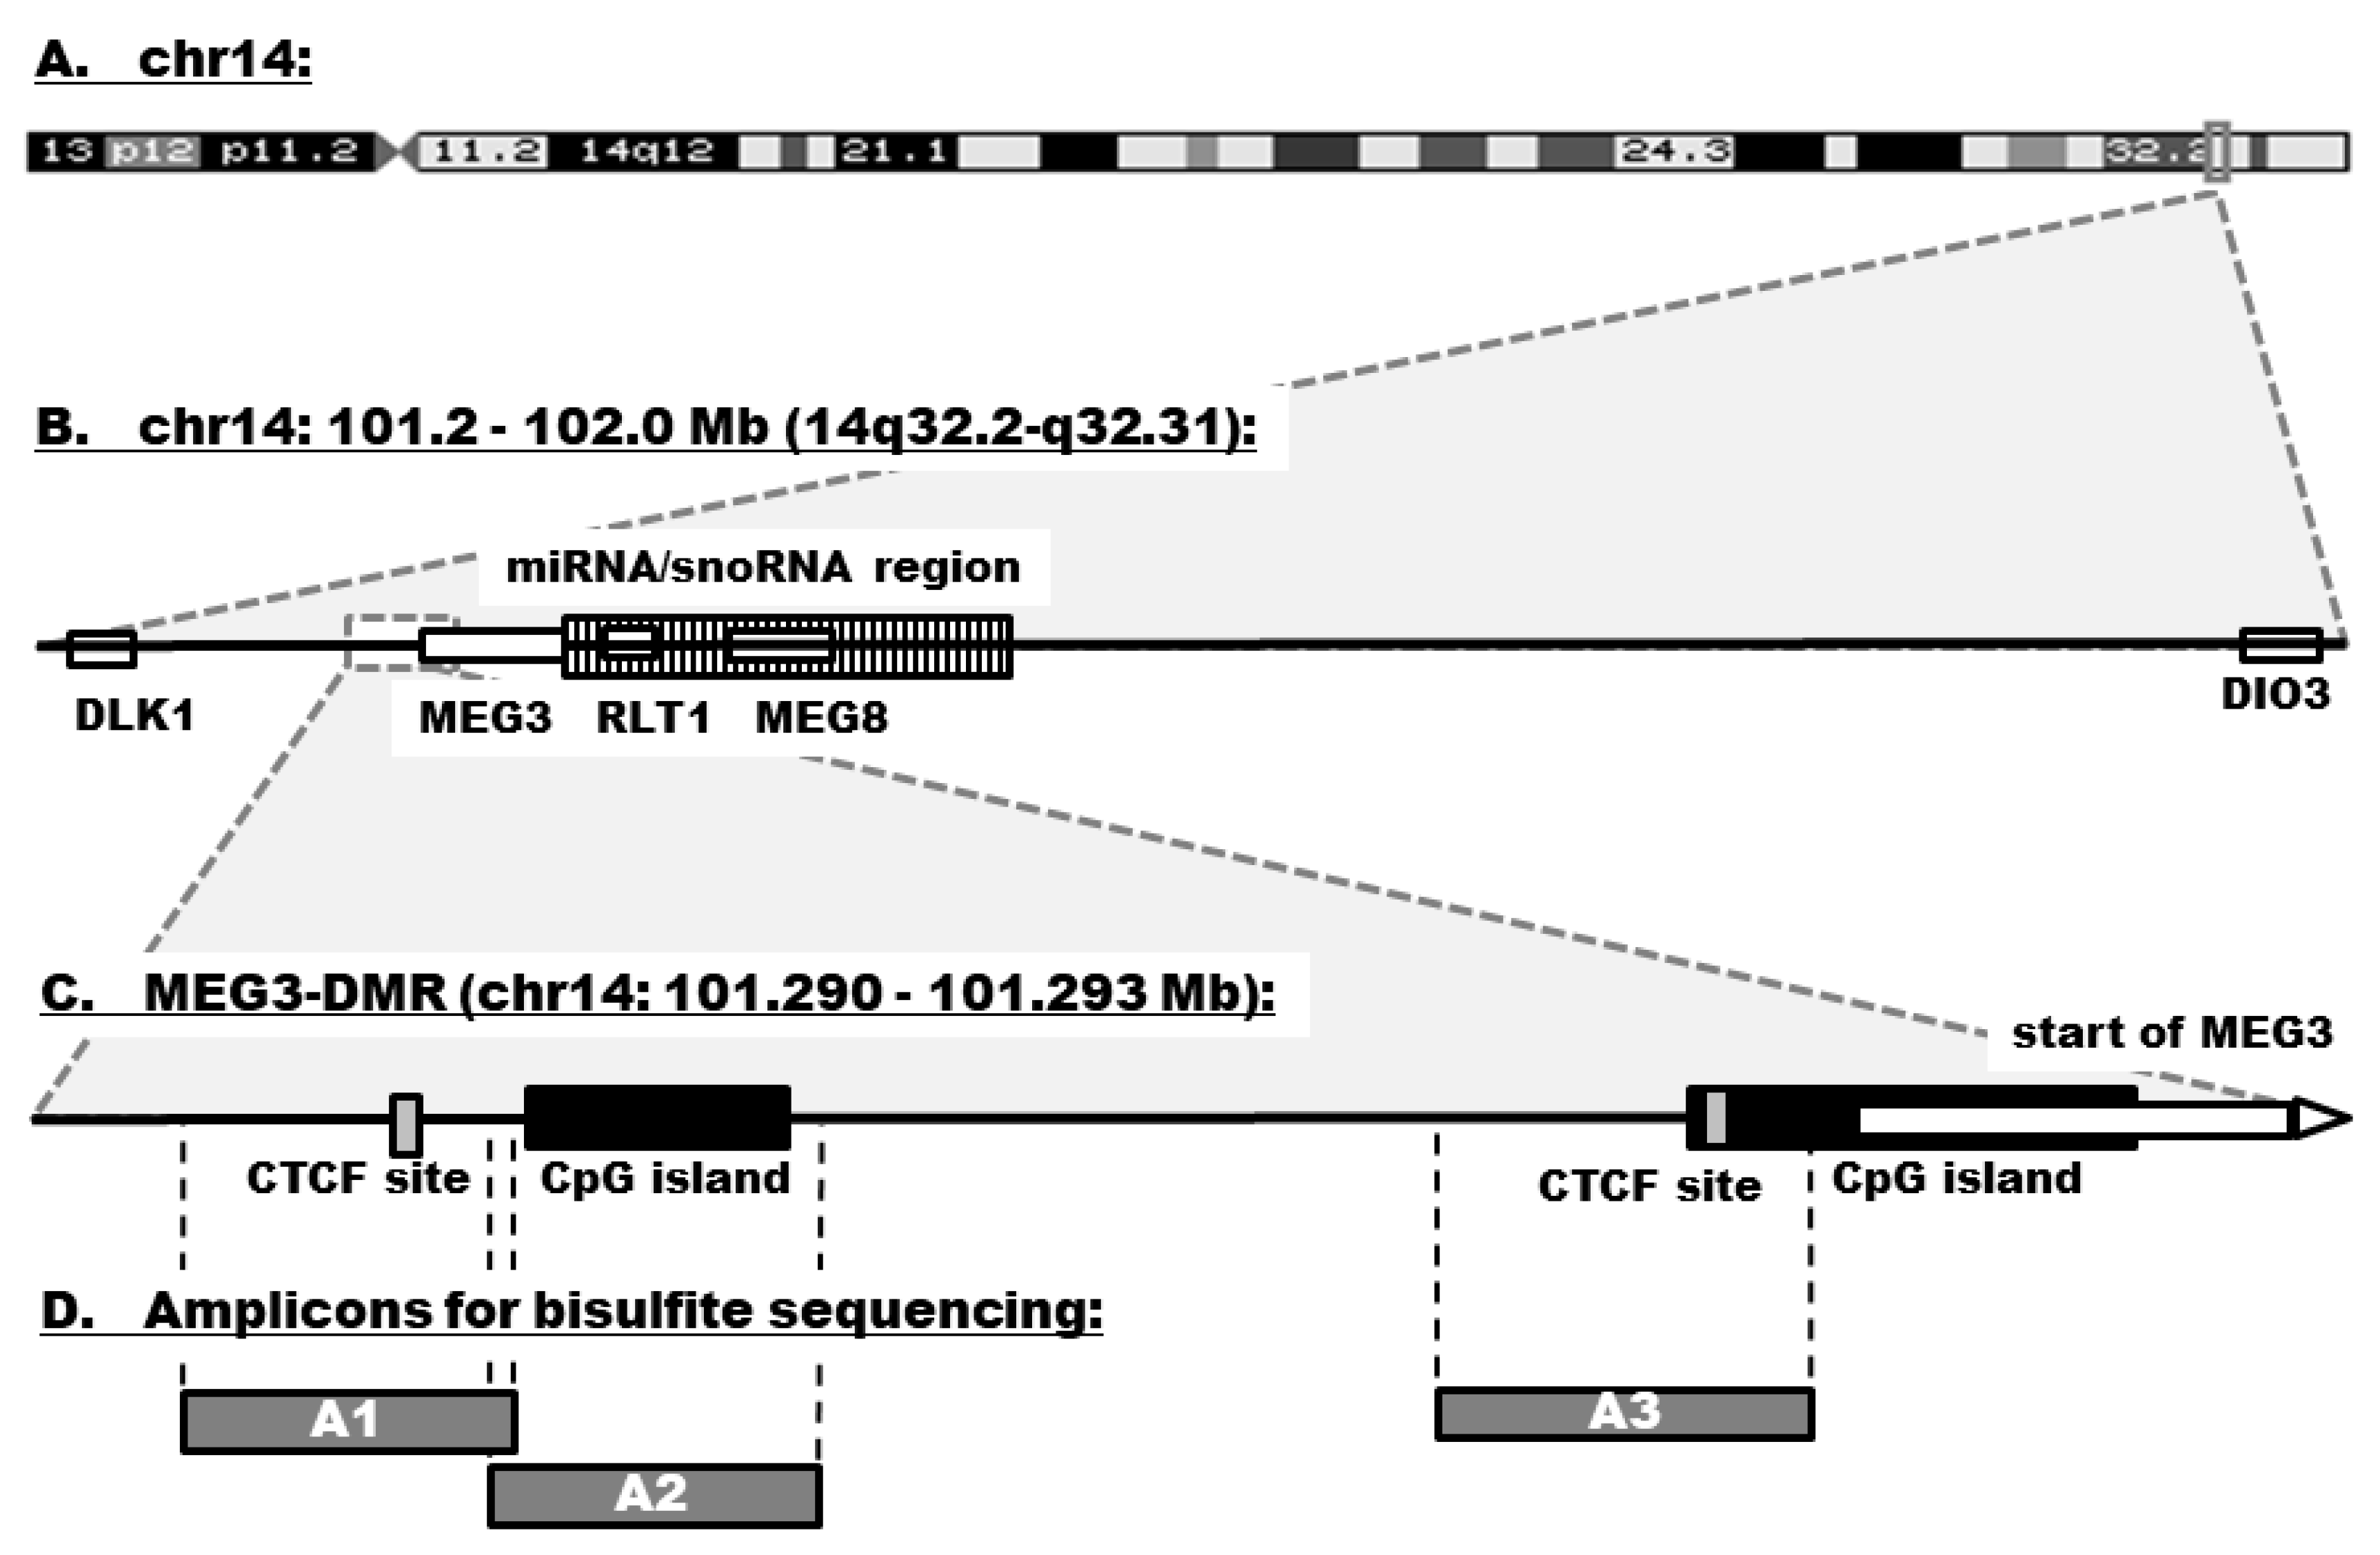
2.5. Bisulfite Sequencing
2.6. Statistical Analyses
3. Results
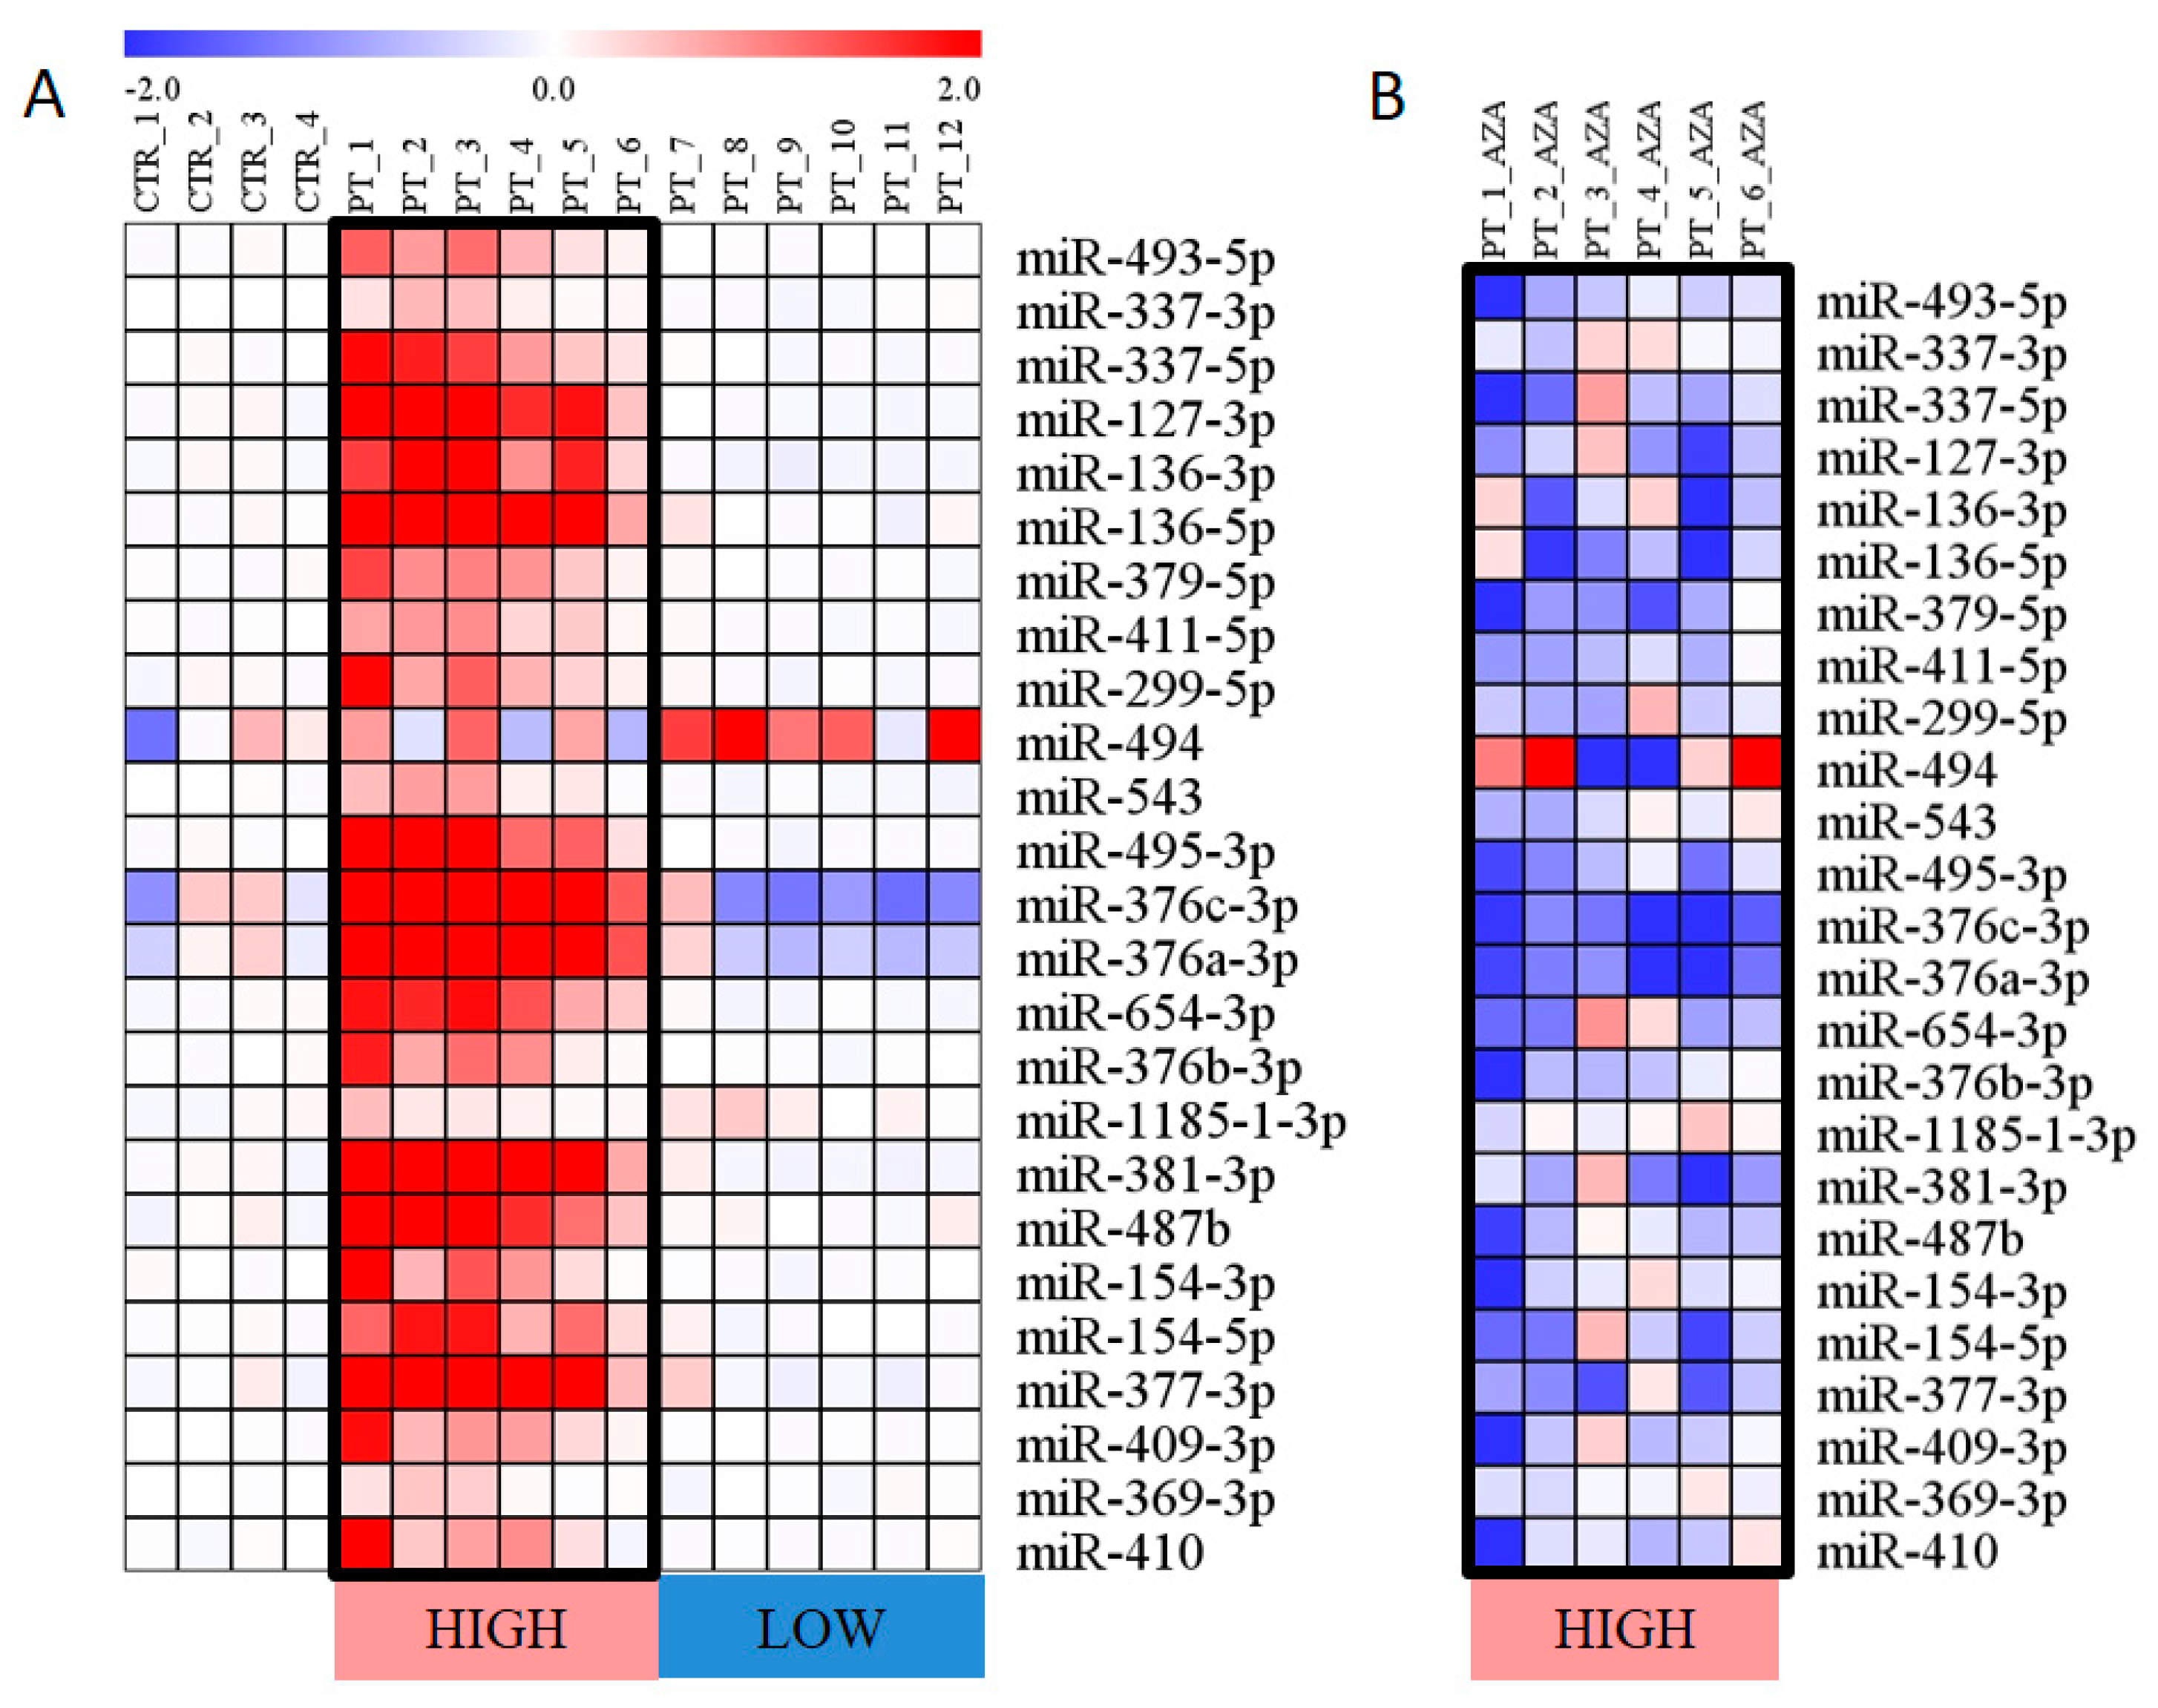
3.1. Expression of miRNAs Encoded within the DLK1–DIO3 Region
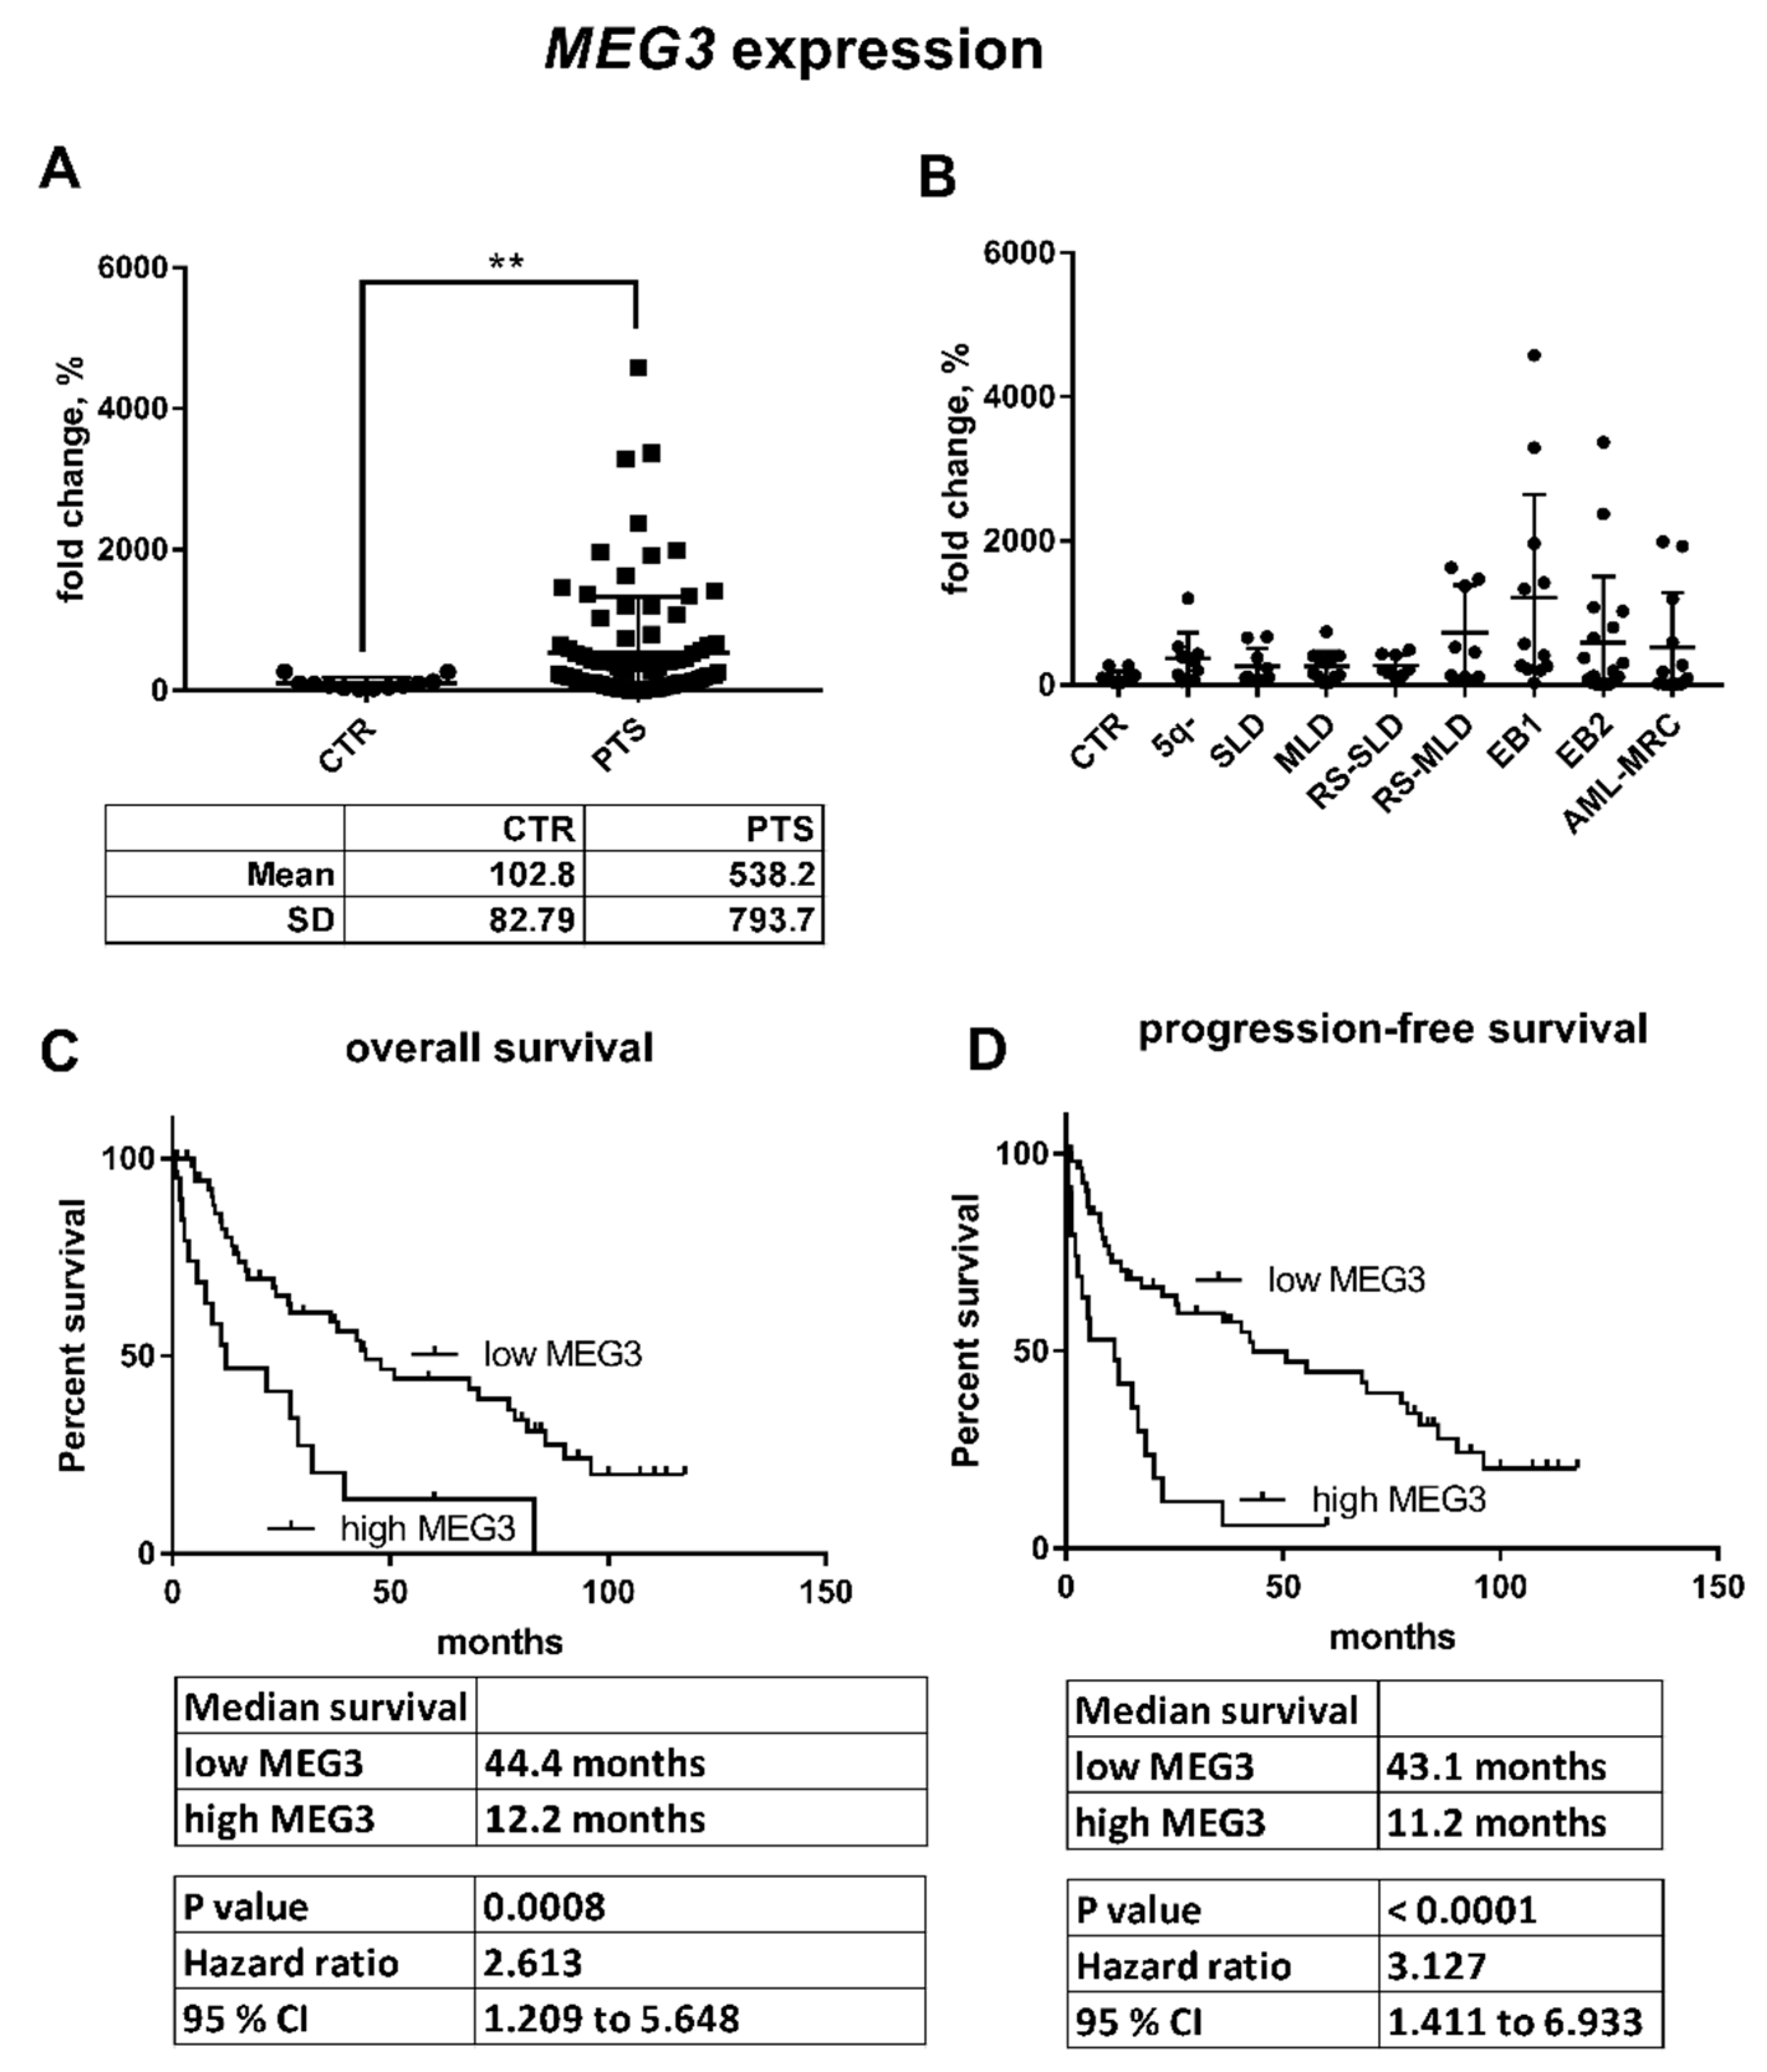
3.2. Expression of Genes Related to the DLK1–DIO3 Region
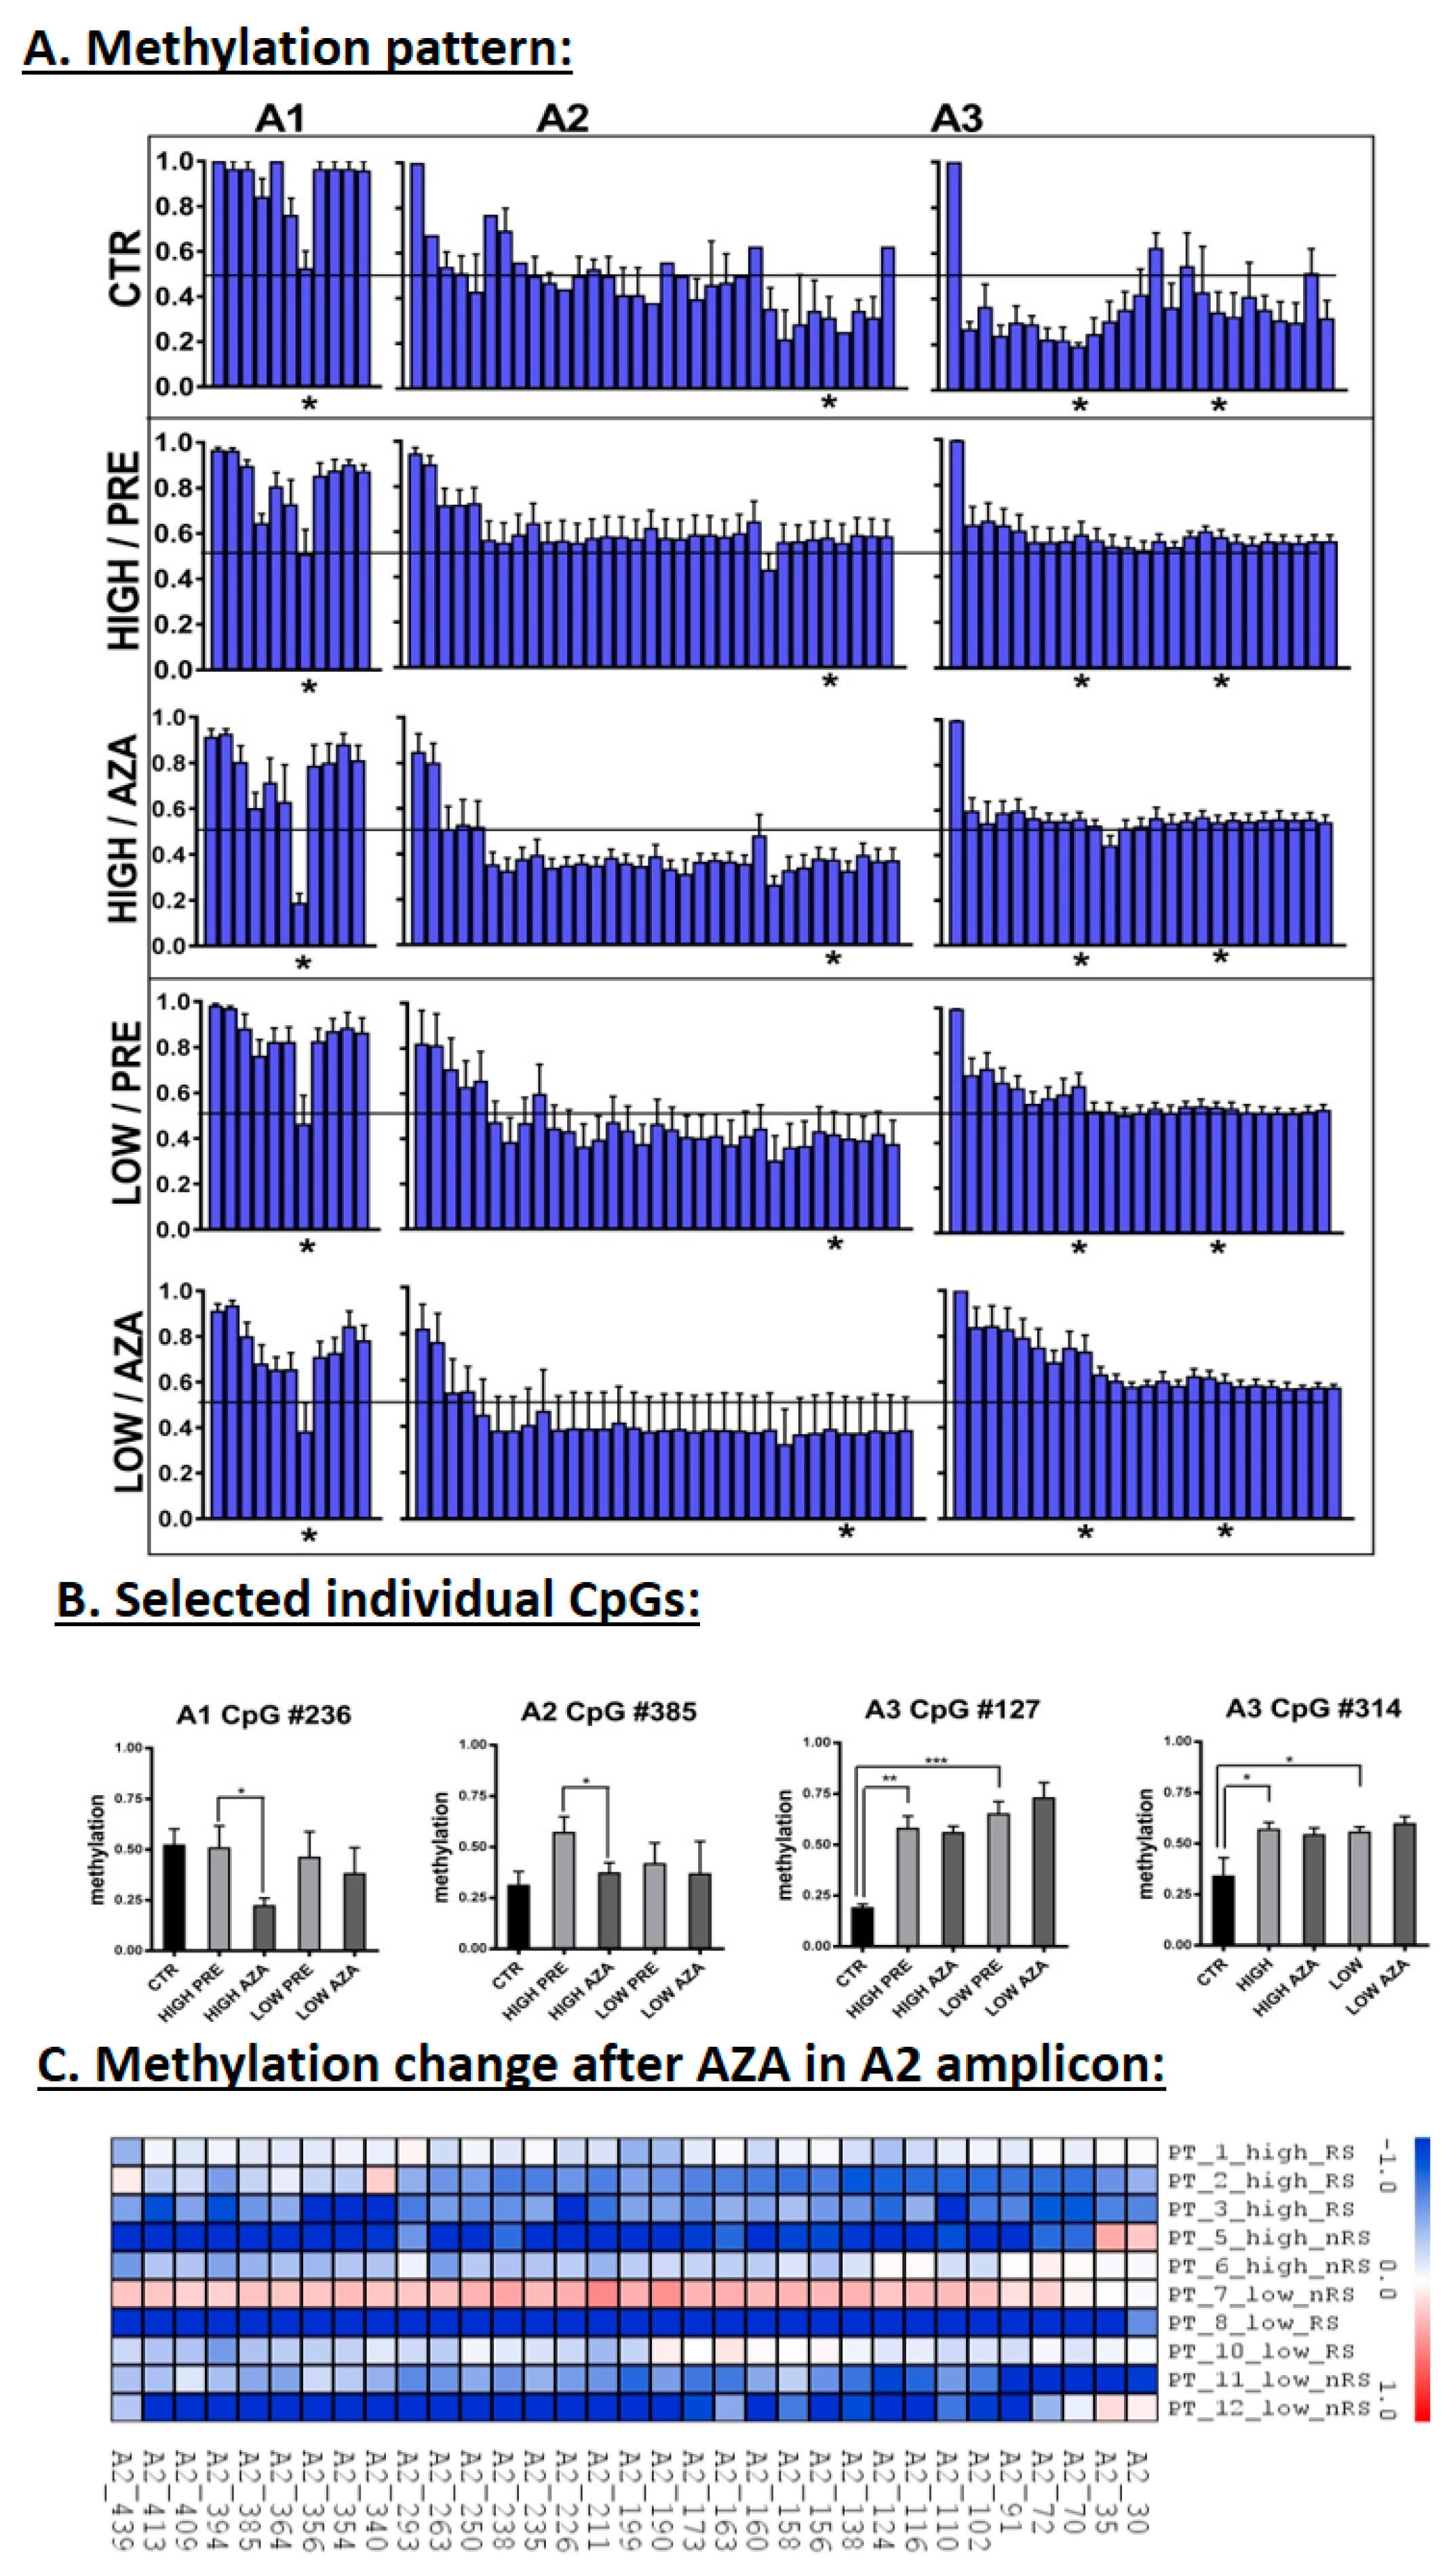
3.3. DNA Methylation in the MEG3-DMR
3.4. Correlation of Expression and Methylation Data
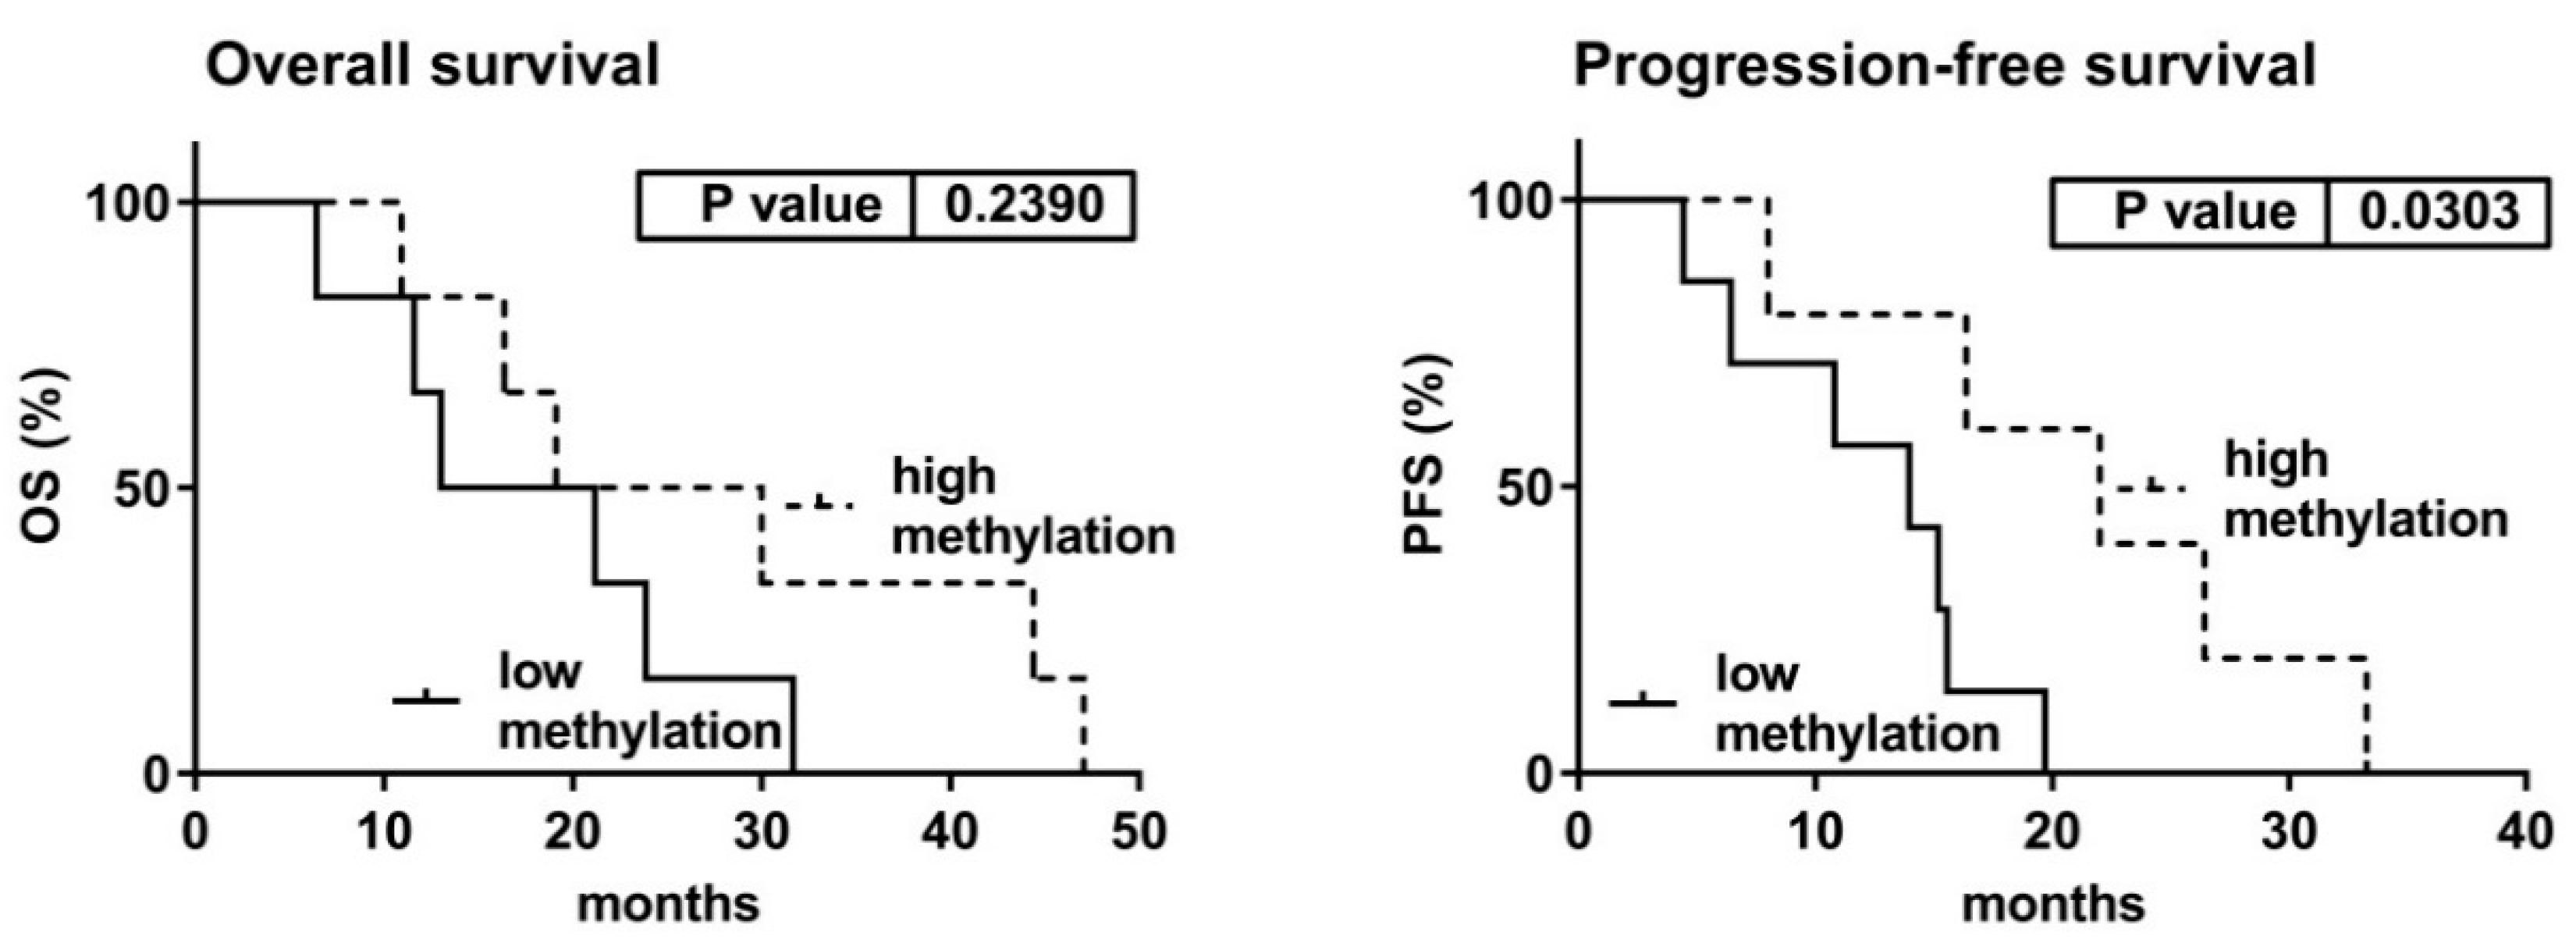
3.5. Clinical Characteristics with Relation to the Expression and Methylation Data
4. Discussion
Supplementary Materials
Author Contributions
Funding
Acknowledgments
Conflicts of Interest
References
- Aul, C.; Bowen, D.T.; Yoshida, Y. Pathogenesis, etiology and epidemiology of myelodysplastic syndromes. Haematologica 1998, 83, 71–86. [Google Scholar] [PubMed]
- Garcia-Manero, G. Myelodysplastic syndromes: 2014 update on diagnosis, risk-stratification, and management. Am. J. Hematol. 2014, 89, 97–108. [Google Scholar] [CrossRef] [PubMed] [Green Version]
- Fenaux, P.; Mufti, G.J.; Hellstrom-Lindberg, E.; Santini, V.; Finelli, C.; Giagounidis, A.; Schoch, R.; Gattermann, N.; Sanzet, G.; List, A.; et al. Efficacy of azacitidine compared with that of conventional care regimens in the treatment of higher-risk myelodysplastic syndromes: A randomised, open-label, phase III study. Lancet Oncol. 2009, 10, 223–232. [Google Scholar] [CrossRef]
- Kornblith, A.B.; Herndon, J.E.; Silverman, L.R.; Demakos, E.P.; Odchimar-Reissig, R.; Holland, J.F.; Powell, B.L.; De Castro, C.; Ellerton, J.; Larson, R.A.; et al. Impact of azacytidine on the quality of life of patients with myelodysplastic syndrome treated in a randomized phase III trial: A Cancer and Leukemia Group B study. J. Clin. Oncol. 2002, 20, 2441–2452. [Google Scholar] [CrossRef] [PubMed]
- Vardiman, J.; Reichard, K. Acute Myeloid Leukemia with Myelodysplasia-Related Changes. Am. J. Clin. Pathol. 2015, 144, 29–43. [Google Scholar] [CrossRef] [PubMed]
- Loiseau, C.; Ali, A.; Itzykson, R. New therapeutic approaches in myelodysplastic syndromes: Hypomethylating agents and lenalidomide. Exp. Hematol. 2015, 43, 661–672. [Google Scholar] [CrossRef] [PubMed]
- Benetatos, L.; Hatzimichael, E.; Londin, E.; Vartholomatos, G.; Loher, P.; Rigoutsos, I.; Briasoulis, E. The microRNAs within the DLK1-DIO3 genomic region: Involvement in disease pathogenesis. Cell. Mol. Life Sci. 2013, 70, 795–814. [Google Scholar] [CrossRef] [PubMed]
- Kagami, M.; O’Sullivan, M.J.; Green, A.J.; Watabe, Y.; Arisaka, O.; Masawa, N.; Matsuoka, K.; Fukami, M.; Matsubara, K.; Kato, F.; et al. The IG-DMR and the MEG3-DMR at human chromosome 14q32.2: Hierarchical interaction and distinct functional properties as imprinting control centers. PLoS Genet. 2010, 6, e1000992. [Google Scholar] [CrossRef] [PubMed]
- Rosa, A.L.; Wu, Y.; Kwabi-Addo, B.; Coveler, K.J.; Reid Sutton, V.; Shaffer, L.G. Allele-specific methylation of a functional CTCF binding site upstream of MEG3 in the human imprinted domain of 14q32. Chromosome Res. 2005, 13, 809–818. [Google Scholar] [CrossRef] [PubMed]
- Formosa, A.; Markert, E.K.; Lena, A.M.; Italiano, D.; Finazzi-Agro’, E.; Levine, A.J.; Bernardiniet, S.; Garabadgiual, A.V.; Melino, G.; Candi, E. MicroRNAs, miR-154, miR-299-5p, miR-376a, miR-376c, miR-377, miR-381, miR-487b, miR-485-3p, miR-495 and miR-654-3p, mapped to the 14q32.31 locus, regulate proliferation, apoptosis, migration and invasion in metastatic prostate cancer cells. Oncogene 2014, 33, 5173–5182. [Google Scholar] [CrossRef] [PubMed]
- Niu, C.S.; Yang, Y.; Cheng, C. MiR-134 regulates the proliferation and invasion of glioblastoma cells by reducing Nanog expression. Int. J. Oncol. 2013, 42, 1533–1540. [Google Scholar] [CrossRef] [PubMed] [Green Version]
- Jin, Y.; Peng, D.; Shen, Y.; Xu, M.; Liang, Y.; Xiao, B.; Lu, J. MicroRNA-376c inhibits cell proliferation and invasion in osteosarcoma by targeting to transforming growth factor-alpha. DNA Cell Biol. 2013, 32, 302–309. [Google Scholar] [CrossRef] [PubMed]
- Choong, M.L.; Yang, H.H.; McNiece, I. MicroRNA expression profiling during human cord blood-derived CD34 cell erythropoiesis. Exp. Hematol. 2007, 35, 551–564. [Google Scholar] [CrossRef] [PubMed]
- Tenedini, E.; Roncaglia, E.; Ferrari, F.; Orlandi, C.; Bianchi, E.; Bicciato, S.; Tagliafico, E.; Ferrari, S. Integrated analysis of microRNA and mRNA expression profiles in physiological myelopoiesis: Role of hsa-mir-299-5p in CD34+ progenitor cells commitment. Cell Death Dis. 2010, 1. [Google Scholar] [CrossRef] [PubMed]
- Wang, F.; Yu, J.; Yang, G.; Wang, X.; Zhang, J. Regulation of erythroid differentiation by miR-376a and its targets. Cell Res. 2011, 21, 1196–1209. [Google Scholar] [CrossRef] [PubMed] [Green Version]
- Jongen-Lavrencic, M.; Sun, S.M.; Dijkstra, M.K.; Valk, P.J.M.; Löwenberg, B. MicroRNA expression profiling in relation to the genetic heterogeneity of acute myeloid leukemia. Blood 2008, 111, 5078–5085. [Google Scholar] [CrossRef] [PubMed] [Green Version]
- Valleron, W.; Laprevotte, E.; Gautier, E.; Quelen, C.; Demur, C.; Delabesse, E.; Agirre, X.; Prósper, F.; Kiss, T.; Brousset, P. Specific small nucleolar RNA expression profiles in acute leukemia. Leukemia 2012, 26, 2052–2060. [Google Scholar] [CrossRef] [PubMed] [Green Version]
- Ley, T.J.; Miller, C.; Ding, L.; Raphael, B.J.; Mungall, A.J.; Robertson, A.G.; Hoadley, K.; Triche, T.J.; Laird, P.W.; Baty, J.D.; et al. Genomic and epigenomic landscapes of adult de novo acute myeloid leukemia. N. Engl. J. Med. 2013, 368, 2059–2074. [Google Scholar] [PubMed]
- Dixon-McIver, A.; East, P.; Mein, C.A.; Cazier, J.; Molloy, G.; Chaplin, T.; Lister, T.A.; Young, B.D.; Debernardi, S. Distinctive patterns of microRNA expression associated with karyotype in acute myeloid leukaemia. PLoS ONE 2008, 3, e2141. [Google Scholar] [CrossRef] [PubMed]
- Votavova, H.; Grmanova, M.; Merkerova, M.D.; Belickova, M.; Vasikova, A.; Neuwirtova, R.; Cermak, J. Differential expression of microRNAs in CD34+ cells of 5q- syndrome. J. Hematol. Oncol. 2011. [Google Scholar] [CrossRef] [PubMed]
- Merkerova, M.D.; Krejcik, Z.; Votavova, H.; Belickova, M.; Vasikova, A.; Cermak, J. Distinctive microRNA expression profiles in CD34+ bone marrow cells from patients with myelodysplastic syndrome. Eur. J. Hum. Genet. 2011, 19, 313–319. [Google Scholar] [CrossRef] [PubMed]
- Krejčík, Z.; Beličková, M.; Hruštincová, A.; Kléma, J.; Zemanová, Z.; Michalová, K.; Čermák, J.; Jonášová, A.; Merkerová, M.D. Aberrant expression of the microRNA cluster in 14q32 is associated with del(5q) myelodysplastic syndrome and lenalidomide treatment. Cancer Genet. 2015, 208, 156–161. [Google Scholar] [CrossRef] [PubMed]
- Merkerova, M.D.; Krejcik, Z.; Belickova, M.; Hrustincova, A.; Klema, J.; Stara, E.; Zemanova, Z.; Michalova, K.; Cermak, J.; Jonasova, A. Genome-wide miRNA profiling in myelodysplastic syndrome with del(5q) treated with lenalidomide. Eur. J. Haematol. 2015, 95, 35–43. [Google Scholar] [CrossRef] [PubMed]
- Manodoro, F.; Marzec, J.; Chaplin, T.; Miraki-Moud, F.; Moravcsik, E.; Jovanovic, J.V.; Wang, J.; Iqbal, S.; Taussig, D.; Grimwade, D.; et al. Loss of imprinting at the 14q32 domain is associated with microRNA overexpression in acute promyelocytic leukemia. Blood 2014, 123, 2066–2074. [Google Scholar] [CrossRef] [PubMed] [Green Version]
- Benetatos, L.; Hatzimichael, E.; Dasoula, A.; Dranitsaris, G.; Tsiara, S.; Syrrou, M.; Georgiou, I.; Bourantas, K.L. CpG methylation analysis of the MEG3 and SNRPN imprinted genes in acute myeloid leukemia and myelodysplastic syndromes. Leuk. Res. 2010, 34, 148–153. [Google Scholar] [CrossRef] [PubMed]
- Merkerova, M.D.; Bystricka, D.; Belickova, M.; Krejcik, Z.; Zemanova, Z.; Polak, J.; Hajkova, H.; Brezinova, J.; Michalova, K.; Cermak, J. From cryptic chromosomal lesions to pathologically relevant genes: Integration of SNP-array with gene expression profiling in myelodysplastic syndrome with normal karyotype. Genes Chromosomes Cancer 2012, 51, 419–428. [Google Scholar] [CrossRef] [PubMed]
- Cheson, B.D.; Greenberg, P.L.; Bennett, J.M.; Lowenberg, B.; Wijermans, P.W.; Nimer, S.D.; Pinto, A.; Beran, M.; de Witte, T.M.; Stone, R.M.; et al. Clinical application and proposal for modification of the International Working Group (IWG) response criteria in myelodysplasia. Blood 2006, 108, 419–425. [Google Scholar] [CrossRef] [PubMed] [Green Version]
- Cheson, B.D.; Bennett, J.M.; Kopecky, K.J.; Büchner, T.; Willman, C.L.; Estey, E.H.; Schiffer, C.A.; Doehner, H.; Tallman, M.S.; Lister, T.A.; et al. Revised recommendations of the International Working Group for Diagnosis, Standardization of Response Criteria, Treatment Outcomes, and Reporting Standards for Therapeutic Trials in Acute Myeloid Leukemia. J. Clin. Oncol. 2003, 21, 4642–4649. [Google Scholar] [CrossRef] [PubMed]
- Krejcik, Z.; Belickova, M.; Hrustincova, A.; Votavova, H.; Jonasova, A.; Cermak, J.; Dyr, J.E.; Merkerova, M.D. MicroRNA profiles as predictive markers of response to azacitidine therapy in myelodysplastic syndromes and acute myeloid leukemia. Cancer Biomark. 2018, 22, 101–110. [Google Scholar] [CrossRef] [PubMed]
- Belickova, M.; Merkerova, M.D.; Votavova, H.; Valka, J.; Vesela, J.; Pejsova, B.; Hajkova, H.; Klemaet, J.; Cermak, J.; Jonasova, A. Up-regulation of ribosomal genes is associated with a poor response to azacitidine in myelodysplasia and related neoplasms. Int. J. Hematol. 2016, 104, 566–573. [Google Scholar] [CrossRef] [PubMed]
- Kumaki, Y.; Oda, M.; Okano, M. QUMA: Quantification tool for methylation analysis. Nucleic Acids Res. 2008, 36, W170–W175. [Google Scholar] [CrossRef] [PubMed]
- Pennucci, V.; Zini, R.; Norfo, R.; Guglielmelli, P.; Bianchi, E.; Salati, S.; Sacchi, G.; Prudente, Z.; Tenedini, E.; Ruberti, S.; et al. Abnormal expression patterns of WT1-as, MEG3 and ANRIL long non-coding RNAs in CD34+ cells from patients with primary myelofibrosis and their clinical correlations. Leuk. Lymphoma 2015, 56, 492–496. [Google Scholar] [CrossRef] [PubMed]
- Boultwood, J.; Wainscoat, J.S. Gene silencing by DNA methylation in haematological malignancies. Br. J. Haematol. 2007, 138, 3–11. [Google Scholar] [CrossRef] [PubMed] [Green Version]


| Variable | Patients with Baseline miRNA Expression | Patients with Increased miRNA Expression | p-Value | |
|---|---|---|---|---|
| Age (years) | Mean (range) | 73 (65–88) | 69 (63–81) | 0.294 |
| Sex, n | Male | 4 | 2 | 0.248 |
| Female | 2 | 4 | ||
| Karyotype, n | Normal | 2 | 1 | 0.505 |
| Abnormal | 4 | 5 | ||
| Marrow blasts | Mean (range) | 10.4 (5.1–20.0) | 31.6 (18.0–75.0) | 0.048 |
| Diagnosis, n | MDS | 6 | 1 | 0.015 |
| AML-MRC | 0 | 5 | ||
| IPSS, n | Intermediate-1/2 | 3 | 0 | 0.182 |
| High | 3 | 6 | ||
| Response to AZA therapy | ORR, n (%) | 3 (50%) | 4 (67%) | 0.558 |
© 2018 by the authors. Licensee MDPI, Basel, Switzerland. This article is an open access article distributed under the terms and conditions of the Creative Commons Attribution (CC BY) license (http://creativecommons.org/licenses/by/4.0/).
Share and Cite
Merkerova, M.D.; Remesova, H.; Krejcik, Z.; Loudova, N.; Hrustincova, A.; Szikszai, K.; Cermak, J.; Jonasova, A.; Belickova, M. Relationship between Altered miRNA Expression and DNA Methylation of the DLK1-DIO3 Region in Azacitidine-Treated Patients with Myelodysplastic Syndromes and Acute Myeloid Leukemia with Myelodysplasia-Related Changes. Cells 2018, 7, 138. https://0-doi-org.brum.beds.ac.uk/10.3390/cells7090138
Merkerova MD, Remesova H, Krejcik Z, Loudova N, Hrustincova A, Szikszai K, Cermak J, Jonasova A, Belickova M. Relationship between Altered miRNA Expression and DNA Methylation of the DLK1-DIO3 Region in Azacitidine-Treated Patients with Myelodysplastic Syndromes and Acute Myeloid Leukemia with Myelodysplasia-Related Changes. Cells. 2018; 7(9):138. https://0-doi-org.brum.beds.ac.uk/10.3390/cells7090138
Chicago/Turabian StyleMerkerova, Michaela Dostalova, Hana Remesova, Zdenek Krejcik, Nikoleta Loudova, Andrea Hrustincova, Katarina Szikszai, Jaroslav Cermak, Anna Jonasova, and Monika Belickova. 2018. "Relationship between Altered miRNA Expression and DNA Methylation of the DLK1-DIO3 Region in Azacitidine-Treated Patients with Myelodysplastic Syndromes and Acute Myeloid Leukemia with Myelodysplasia-Related Changes" Cells 7, no. 9: 138. https://0-doi-org.brum.beds.ac.uk/10.3390/cells7090138