Article

Structural Design of 5 mol.% Yttria Partially Stabilized Zirconia (5Y-PSZ) by Addition of Manganese Oxide and Direct Firing

CICECO—Aveiro Institute of Materials, Department of Materials and Ceramic Engineering, University of Aveiro, 3810-193 Aveiro, Portugal
*
Author to whom correspondence should be addressed.
Submission received: 31 May 2020 / Revised: 5 August 2020 / Accepted: 28 August 2020 / Published: 9 September 2020
(This article belongs to the Special Issue High-Temperature Ceramics)

Abstract

:
In this study, 5Y-PSZ-based ceramics with 15 mol.% of manganese oxide were obtained from PSZ + MnO2 powders mixtures by pressing and direct firing. The resulting materials show a stable cubic fluorite structure with only minor traces of segregated manganese oxides and relative density from 90% to 98%. The linear thermal expansion coefficient is in the order of 10−5 K−1 at 500 K and increases gradually with temperature, due to the onset of a contribution of chemical expansion, reaching about 13 × 10−6 K−1 at 1100 K. These results are suitable for prospective applicability as buffer layers to minimize degradation and delamination of electrolyte/oxygen electrode interfaces in solid electrolyte cells. The electrical conductivity remains close to 1 S/m at 973 K and close to 7 S/m at 1273 K, suggesting mixed conductivity with a prospective contribution to electrode processes occurring at electrode/electrolyte interfaces. Guidelines for further improvement were also established by a detailed analysis of the impact of heating/cooling rate, firing temperature, and time on those properties, based on Taguchi planning.

1. Introduction

Additions of manganese oxide to ZrO2-based materials have attracted significant interest for catalytic applications [1,2] and in solid-state electrochemical cells. For example, Mn is a key component in oxygen electrode materials and its incorporation in zirconia-based buffer layers may minimize electrode/electrolyte reactivity and delamination [3]. Mn-doping has also been proposed to enhance the stability of cubic zirconia [4], to minimize long term conductivity drifts [3], and as a sintering additive for yttria-stabilized zirconia, to allow for the processing of solid oxide fuel cells at lower temperatures [5].
The high solubility of Mn in zirconia-based materials [6,7,8] relies mainly on Mn2+ ions and increases with temperature [9]. The smaller fractions of Mn3+ ions should decrease further on changing the oxidizing to neutral atmosphere or increasing temperatures. Possible explanations for the contribution of Mn2+ to stabilize the cubic phase may rely on the ratio of ionic radii r M n 2 + : r O 2 = 0.69 , which is close to the ideal cation:anion ratio r c : r a = 0.732 for close packing with coordination 8, whereas the corresponding ratio r Z r 4 + : r O 2 = 0.59 is significantly lower. However, this cannot explain a decrease in lattice parameter of cubic zirconia with increasing additions of manganese [6], if one considers only differences in cationic radii ( r M n 2 + > r Z r 4 + ). Even more impressive lattice contraction has been reported for Y-free (Zr, Mn)O2-x catalysts at low and intermediate temperatures [2]. Though a fraction of Mn3+ should be expected [10], contributing to a decrease in lattice parameter ( r M n 3 + < r Z r 4 + ), Mn3+ is unlikely to assume the required coordination in cubic zirconia [8] due to its low cation:anion radii ratio, except possibly by assuming preferential association of Mnn+ with oxygen vacancies and effective decrease of coordination. Otherwise, one may assume shrinkage of anion positions in the fluorite structure, as r V < r O 2 [11,12], possibly contributing also to a decrease in the lattice parameter.
Structural effects of Mn additions and the Mn3+:Mn2+ ratio determine changes in transport properties, as revealed by a maximum in activation energy of electrical conductivity [8], and a drop in ionic transport number, related to changes from ionic to electronic, by increasing the hopping probability. Other changes in transport number and total conductivity on changing from oxidizing to neutral or reducing conditions [6] can be ascribed to depression of the Mn3+ fraction. In addition, changes in sintering temperature may exert simultaneous effects on total Mn concentration and Mn3+:Mn2+ ratio, which may be partially quenched by sufficiently fast cooling. Thus, these effects should be properly understood to minimize undue negative impacts on ionic conductivity and transport numbers in bulk electrolytes [3], and also to design the mixed conductivity of Mn-rich buffer layers [8], possibly combined with their redox and oxygen storage ability. This may provide guidelines for the development of multifunctional buffer layers, enhancing the compatibility between electrolyte and electrode, and possibly contributing also to electrode kinetics in solid electrolyte cells. The compatibility of electrolyte/electrode interfaces may rely on: (i) enhanced stability of Mn-rich zirconia buffer layers, (ii) ability to minimize cation inter-diffusion or de-mixing, (iii) adjustable chemical expansion to bridge the thermochemical expansion differences between electrolyte and electrode layers, and possibly even (iv) oxygen storage ability to counter risks of oxygen overpressure on reverting to electrolysis mode. Buffer layers with mixed ionic-electronic conductivity, variable oxygen stoichiometry and corresponding oxygen storage ability are also expected to contribute to enhanced kinetics of oxygen electrodes.
Thus, the present work was intended to develop Zr1−x−yMnxYyO2−δ buffer layers for prospective applicability at oxygen electrode/electrolyte interfaces of solid electrolyte cells, to minimize risks of degradation and delamination. The selected preparation method relied on simple powder mixtures of PSZ zirconia and MnO2 and direct firing, to demonstrate conditions for facile processing of such buffer layers. This implied a detailed study of the impact of firing schedule on phase stability, density, thermochemical expansion and conductivity, as required for the intended buffer layers.

2. Materials and Methods

The samples with a nominal composition ((ZrO2)0.95(Y2O3)0.05)0.85(MnOx)0.15 were prepared using 5 mol.% yttria partially stabilized zirconia (5Y-PSZ, Innovnano, Portugal) and manganese oxide MnO2 (Alfa Aesar, 99%). The powders of initial reagents were mixed in an appropriate proportion and ball-milled with ethanol for 4 h at 150 rpm using a nylon container, Tosoh tetragonal zirconia milling media and Retsch S1 planetary mill. After drying of the milled powder, disk-shaped samples (Ø 18 mm, thickness ~1.5 mm) were compacted by uniaxial pressing (F = 10 kN) and fired with controlled schedules, as illustrated in Figure 1 for one representative case. The generic firing schedules included controlled heating/cooling rate in the range 2–8 °C/min, firing temperature Tf in the range 1400–1600 °C, and firing time tf in the range of 1–9 h. The corresponding plan of experimental conditions was selected by the Taguchi method [13], as detailed in Table 1, where the generic sub-notation (x-yy-z) for the samples indicates the rate of change in temperature (x), the first 2 digits of firing temperature (yy) and firing time (z). Firing of samples was done on alumina plates covered with alumina cups. Each sample was placed on a bed of powder and also covered with a powder of identical cation composition to act as a buffer against possible high-temperature MnOx losses [14,15].
Sintered ceramics samples were polished and cut into rectangular bars for electrical and dilatometric measurements. The density of prepared ceramics was calculated from the geometric dimensions and mass of polished samples. Powdered samples for X-ray diffraction (XRD) studies were prepared by grinding sintered ceramics in a mortar.
XRD patterns were recorded at room temperature using a PANalytical X’Pert PRO MRD diffractometer (CuKα radiation). Unit cell parameters were calculated in FullProf software (profile match method).
Microstructural characterization was performed by scanning electron microscopy (SEM, Hitachi SU-70) coupled with energy dispersive spectroscopy (EDS, Bruker Quantax 400 detector). Dilatometric measurements were done using a vertical Linseis L75 instrument in flowing air with a constant heating/cooling rate of 3 °C/min. The electrical conductivity was measured in air in the temperature range 500–1000 °C employing AC impedance spectroscopy (Keysight E4284A precision LCR meter, frequency range 20 Hz–2 MHz, AC voltage 1 V) and samples with applied porous Pt electrodes.

3. Results and Discussion

3.1. Structural Effects Induced by Sintering Schedules

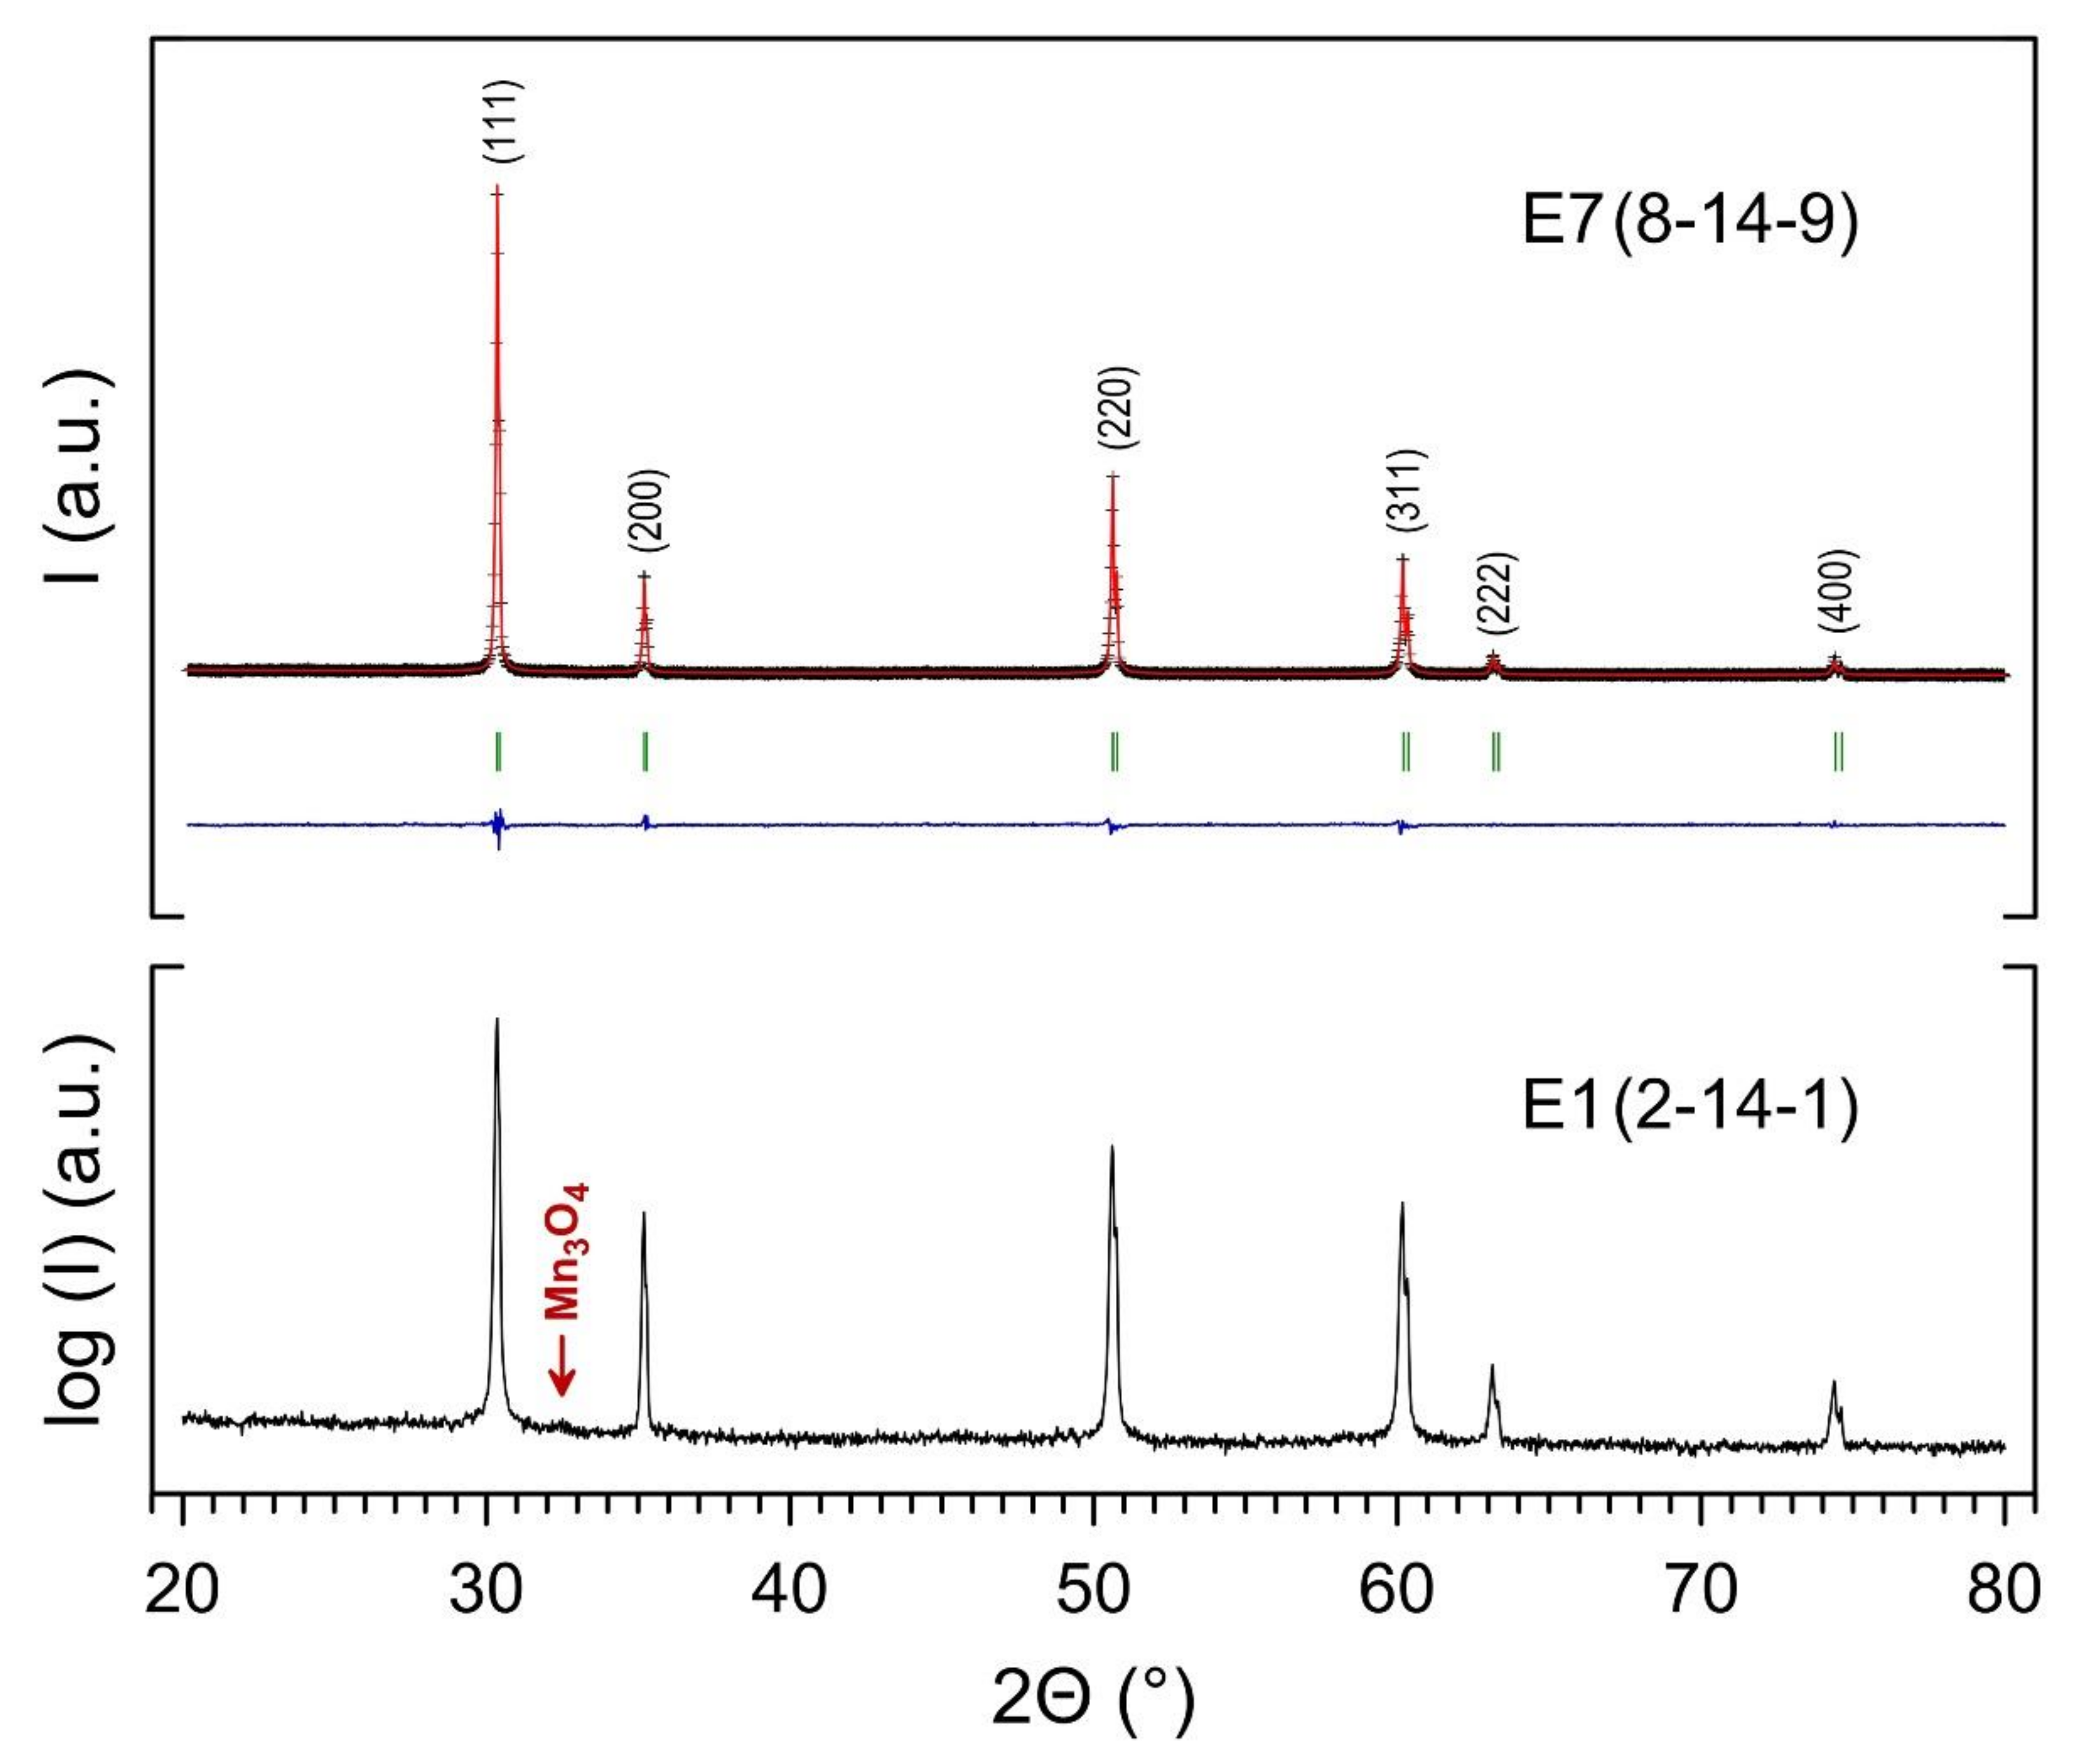
X-ray diffractograms do not show significant evidence of Mn-rich precipitates, even when intensity is shown in logarithmic scale to emphasize minor reflections, except minor traces of Mn3O4 for E1 (2-14-1) (Figure 2, bottom). Overall inspection suggests a pure cubic phase; the XRD data for all samples were successfully refined in the space group F m 3 ¯ m (see an example in Figure 2, top). Thus, one may claim strong evidence that the addition of MnOx to 5Y-PSZ stabilizes the cubic fluorite-type phase.
Different firing schedules induce lattice contraction or expansion, revealed by peak shifts. The corresponding values of lattice parameter were obtained by FullProf refinement and are included in Table 1, and may be used as a guideline for structural dependence on firing schedules; this was screened by the correlation matrix calculated with standard Excel formulae (Table 2), which indicates that the lattice parameter drops mainly with increase in sintering temperature, as reported by others [16], though for higher contents of Y and a much lower concentration of Mn. Thus, the impact of sintering temperature on solubility may explain its effect on the lattice parameter [8], whereas the contribution of firing time is consistent with the effects of time scale in kinetic limitations. The effects of the rate of change in temperature may comprise early effects occurring on heating and the final stage of cooling. One may assume effects of fast heating rate on the interplay between the dissolution of Mn and other early thermochemical transformations occurring on heating, including ready decomposition of the precursor manganese oxide (MnO2), and later onset of sintering of the zirconia-based matrix, or transformation of the partially stabilized powders to cubic phase. Interplay between dissolution of Mn and other early stages of processing is also suggested on comparing results reported for ceramic samples obtained from different precursor powders. For example, samples obtained from co-precipitated powders [8] show wider changes in lattice parameter for up to higher fractions of Mn in the nominal compositions, when compared to samples processed from pre-calcined powders [7]. Changes on cooling may also be expected taking into account that solubility of Mn is dependent on temperature and redox changes, which are also likely to occur on cooling, as shown in Section 3.3.
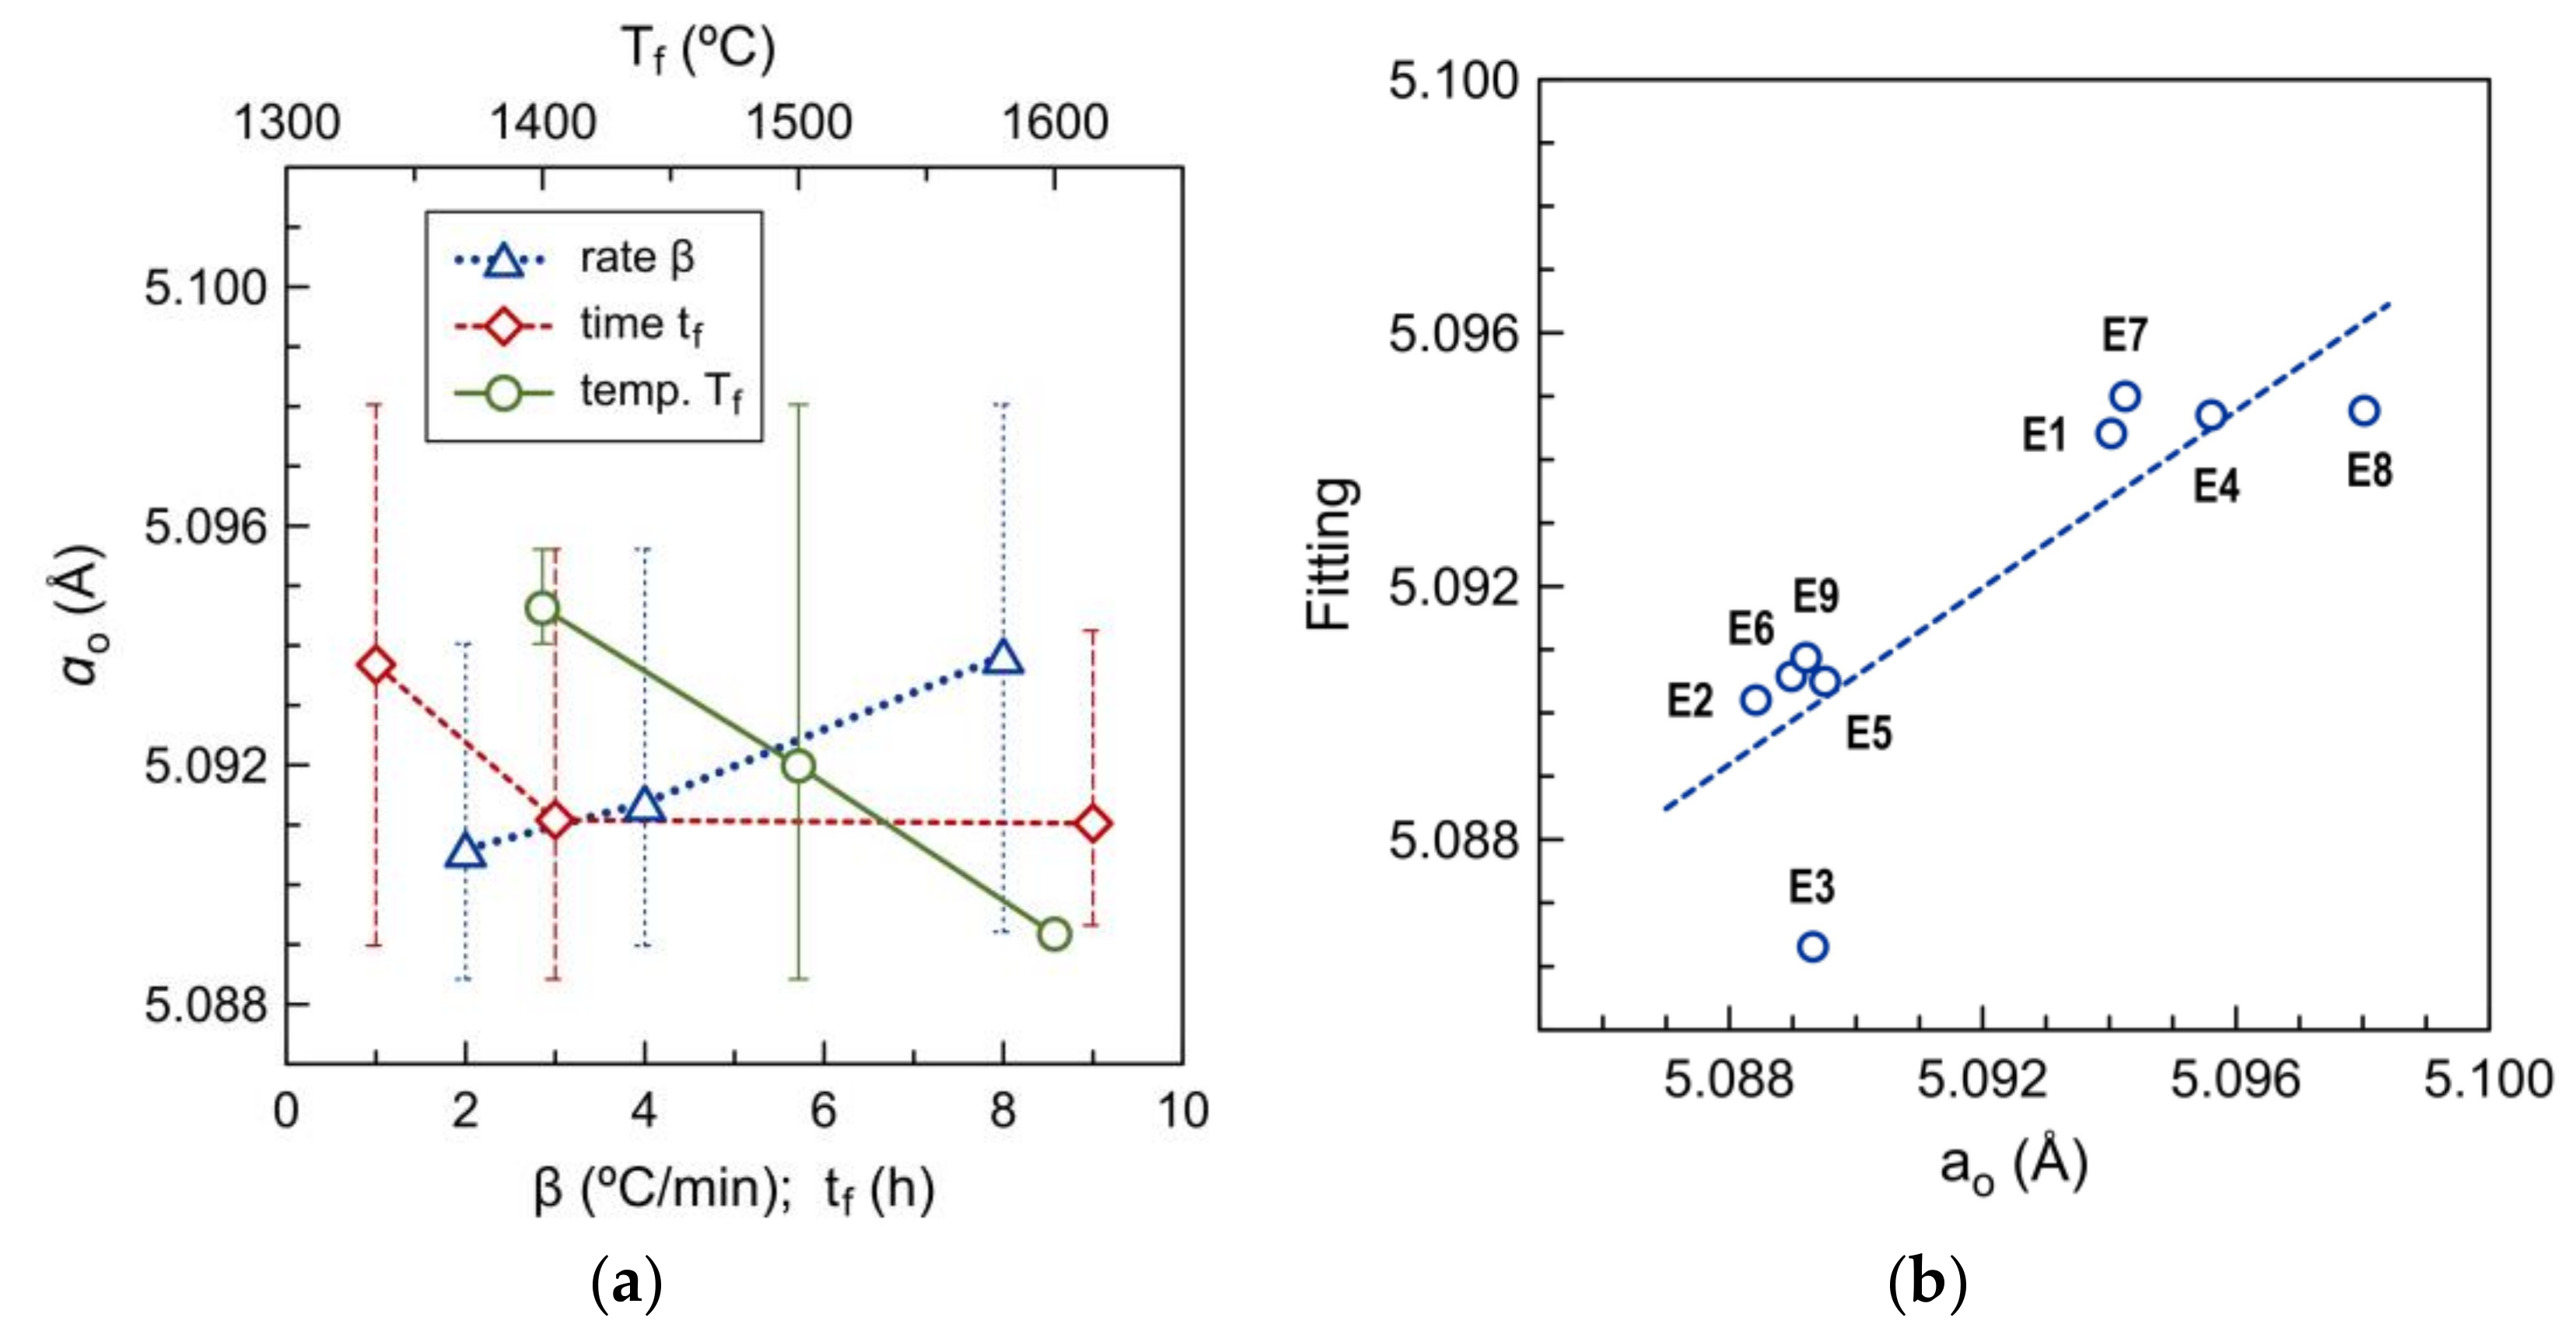
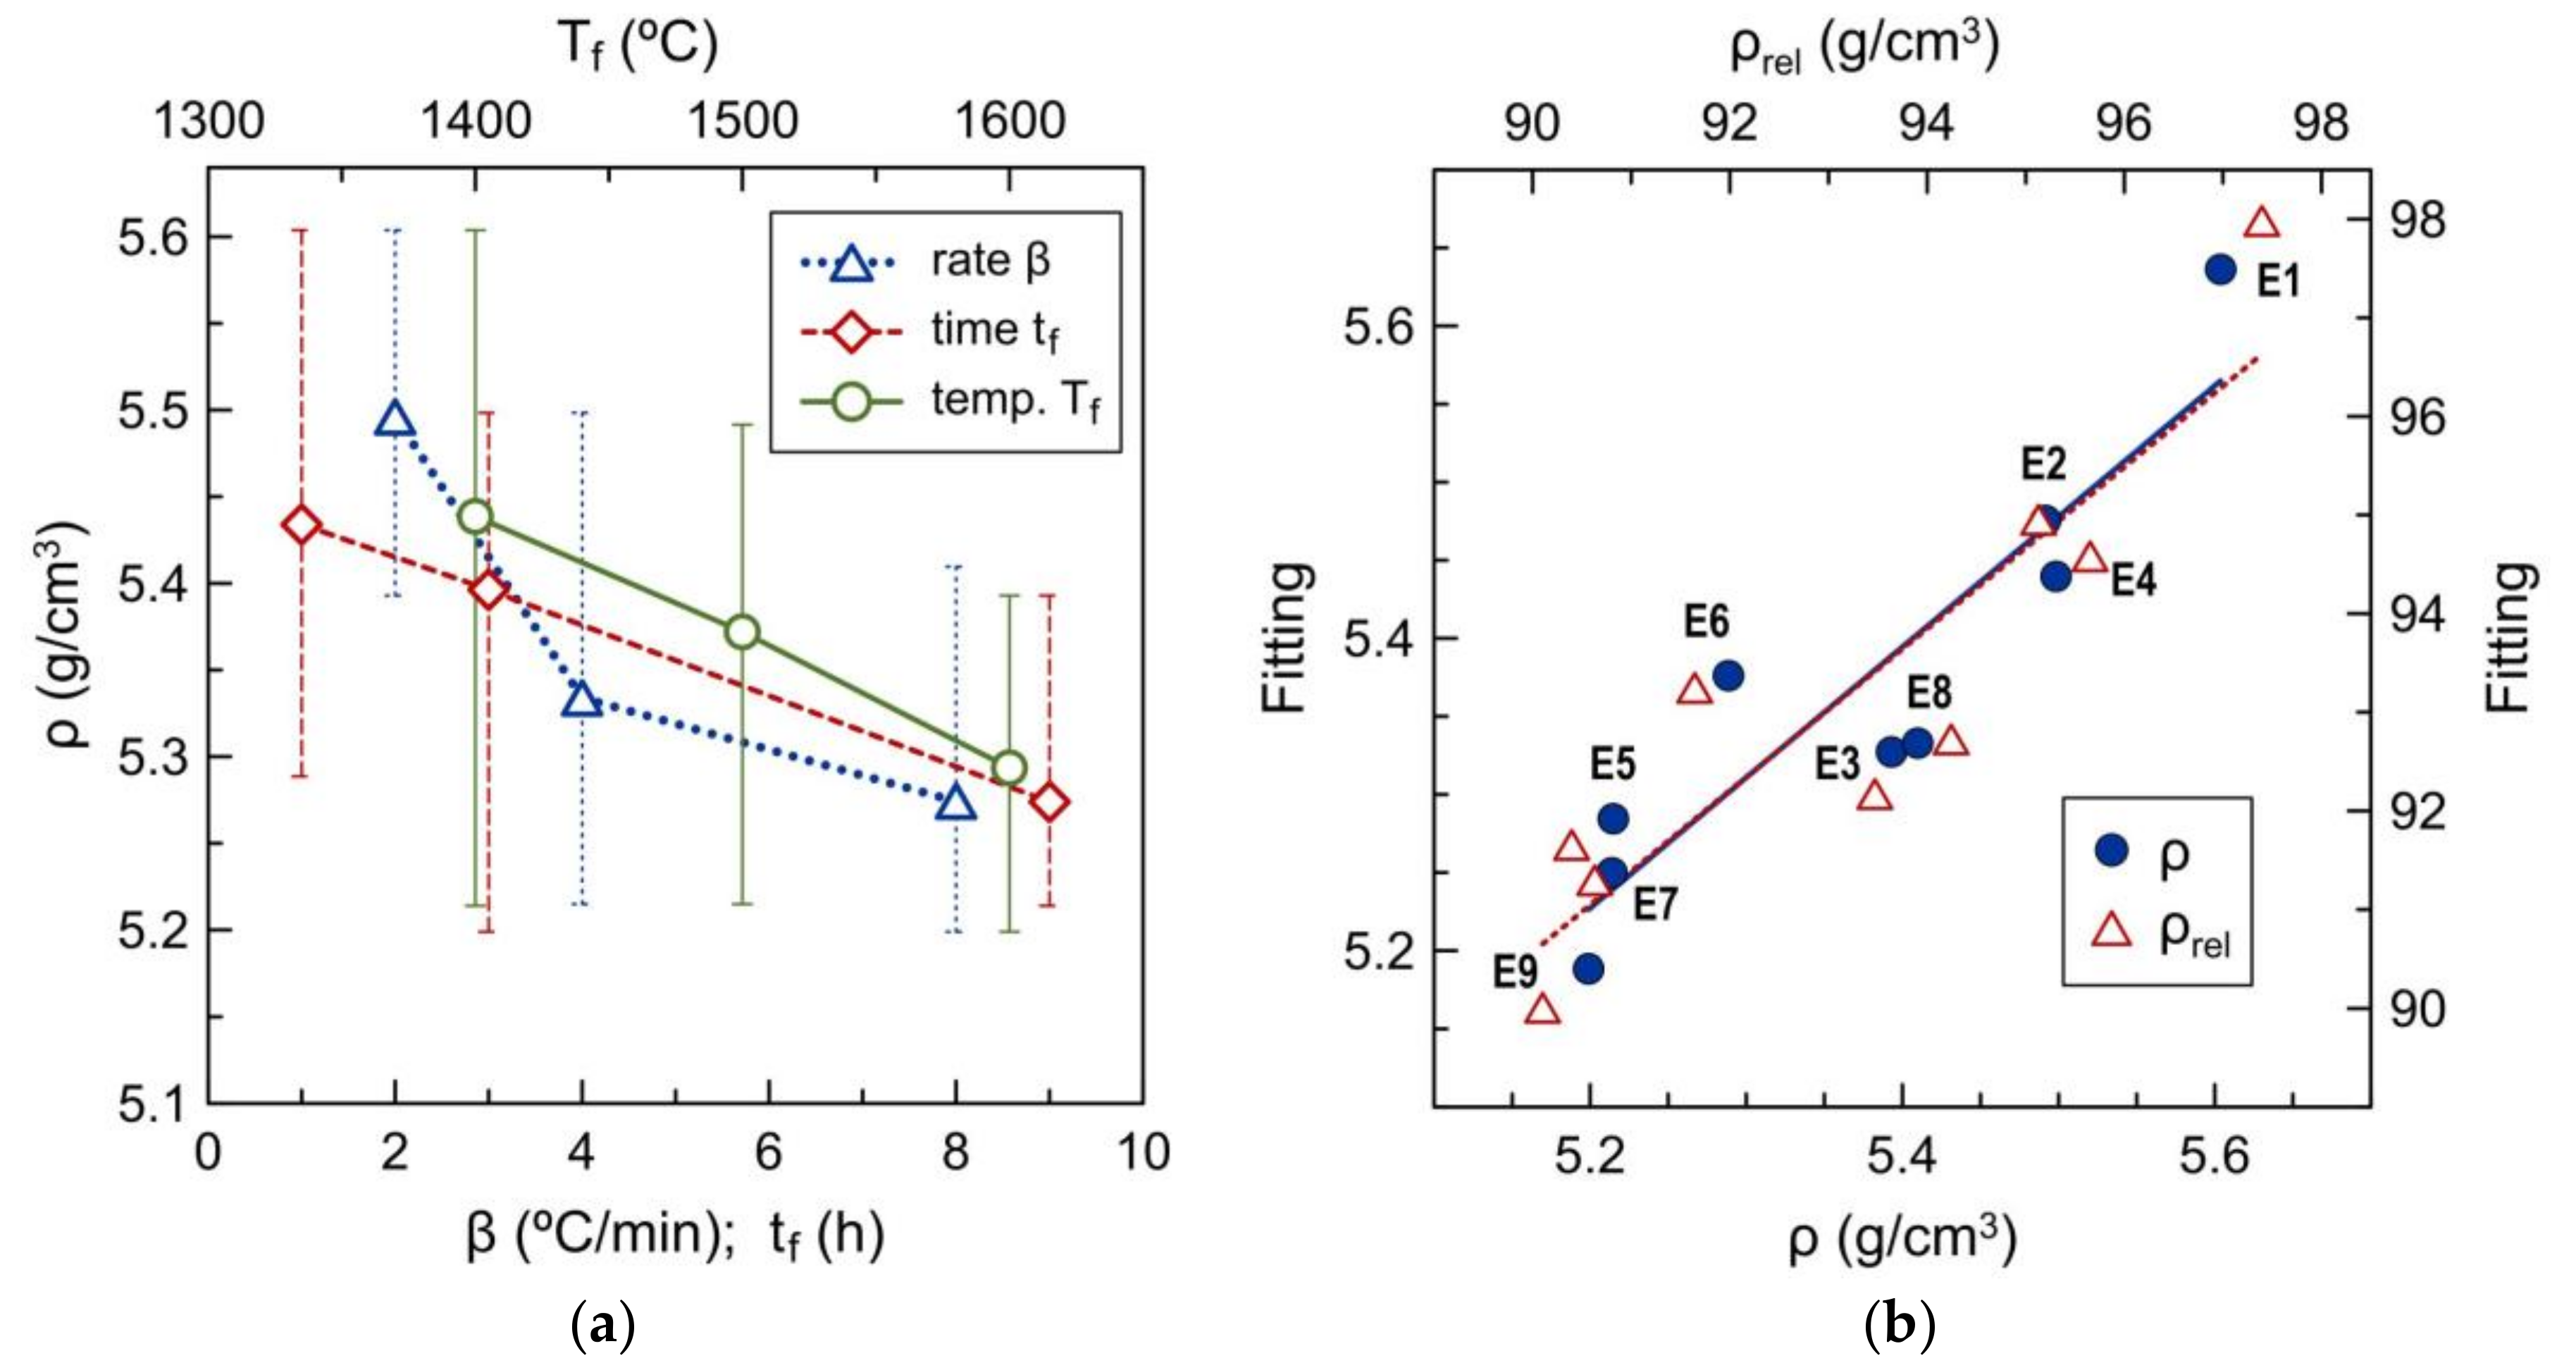
The interplay between the roles of different parameters of sintering schedules (rate, temperature and time) is also emphasized by the corresponding noise to signal ratio, illustrated in Figure 3a; this is given by error bars, which correspond to differences between the highest and lowest results for a specific factor, at the indicated level, while allowing simultaneous changes in other parameters, to minimize the number of experiments. Thus, the poor signal to noise ratio observed mainly for dependence on time explains its weakest correlation in Table 2.
The poor signal to noise ratio shown in 
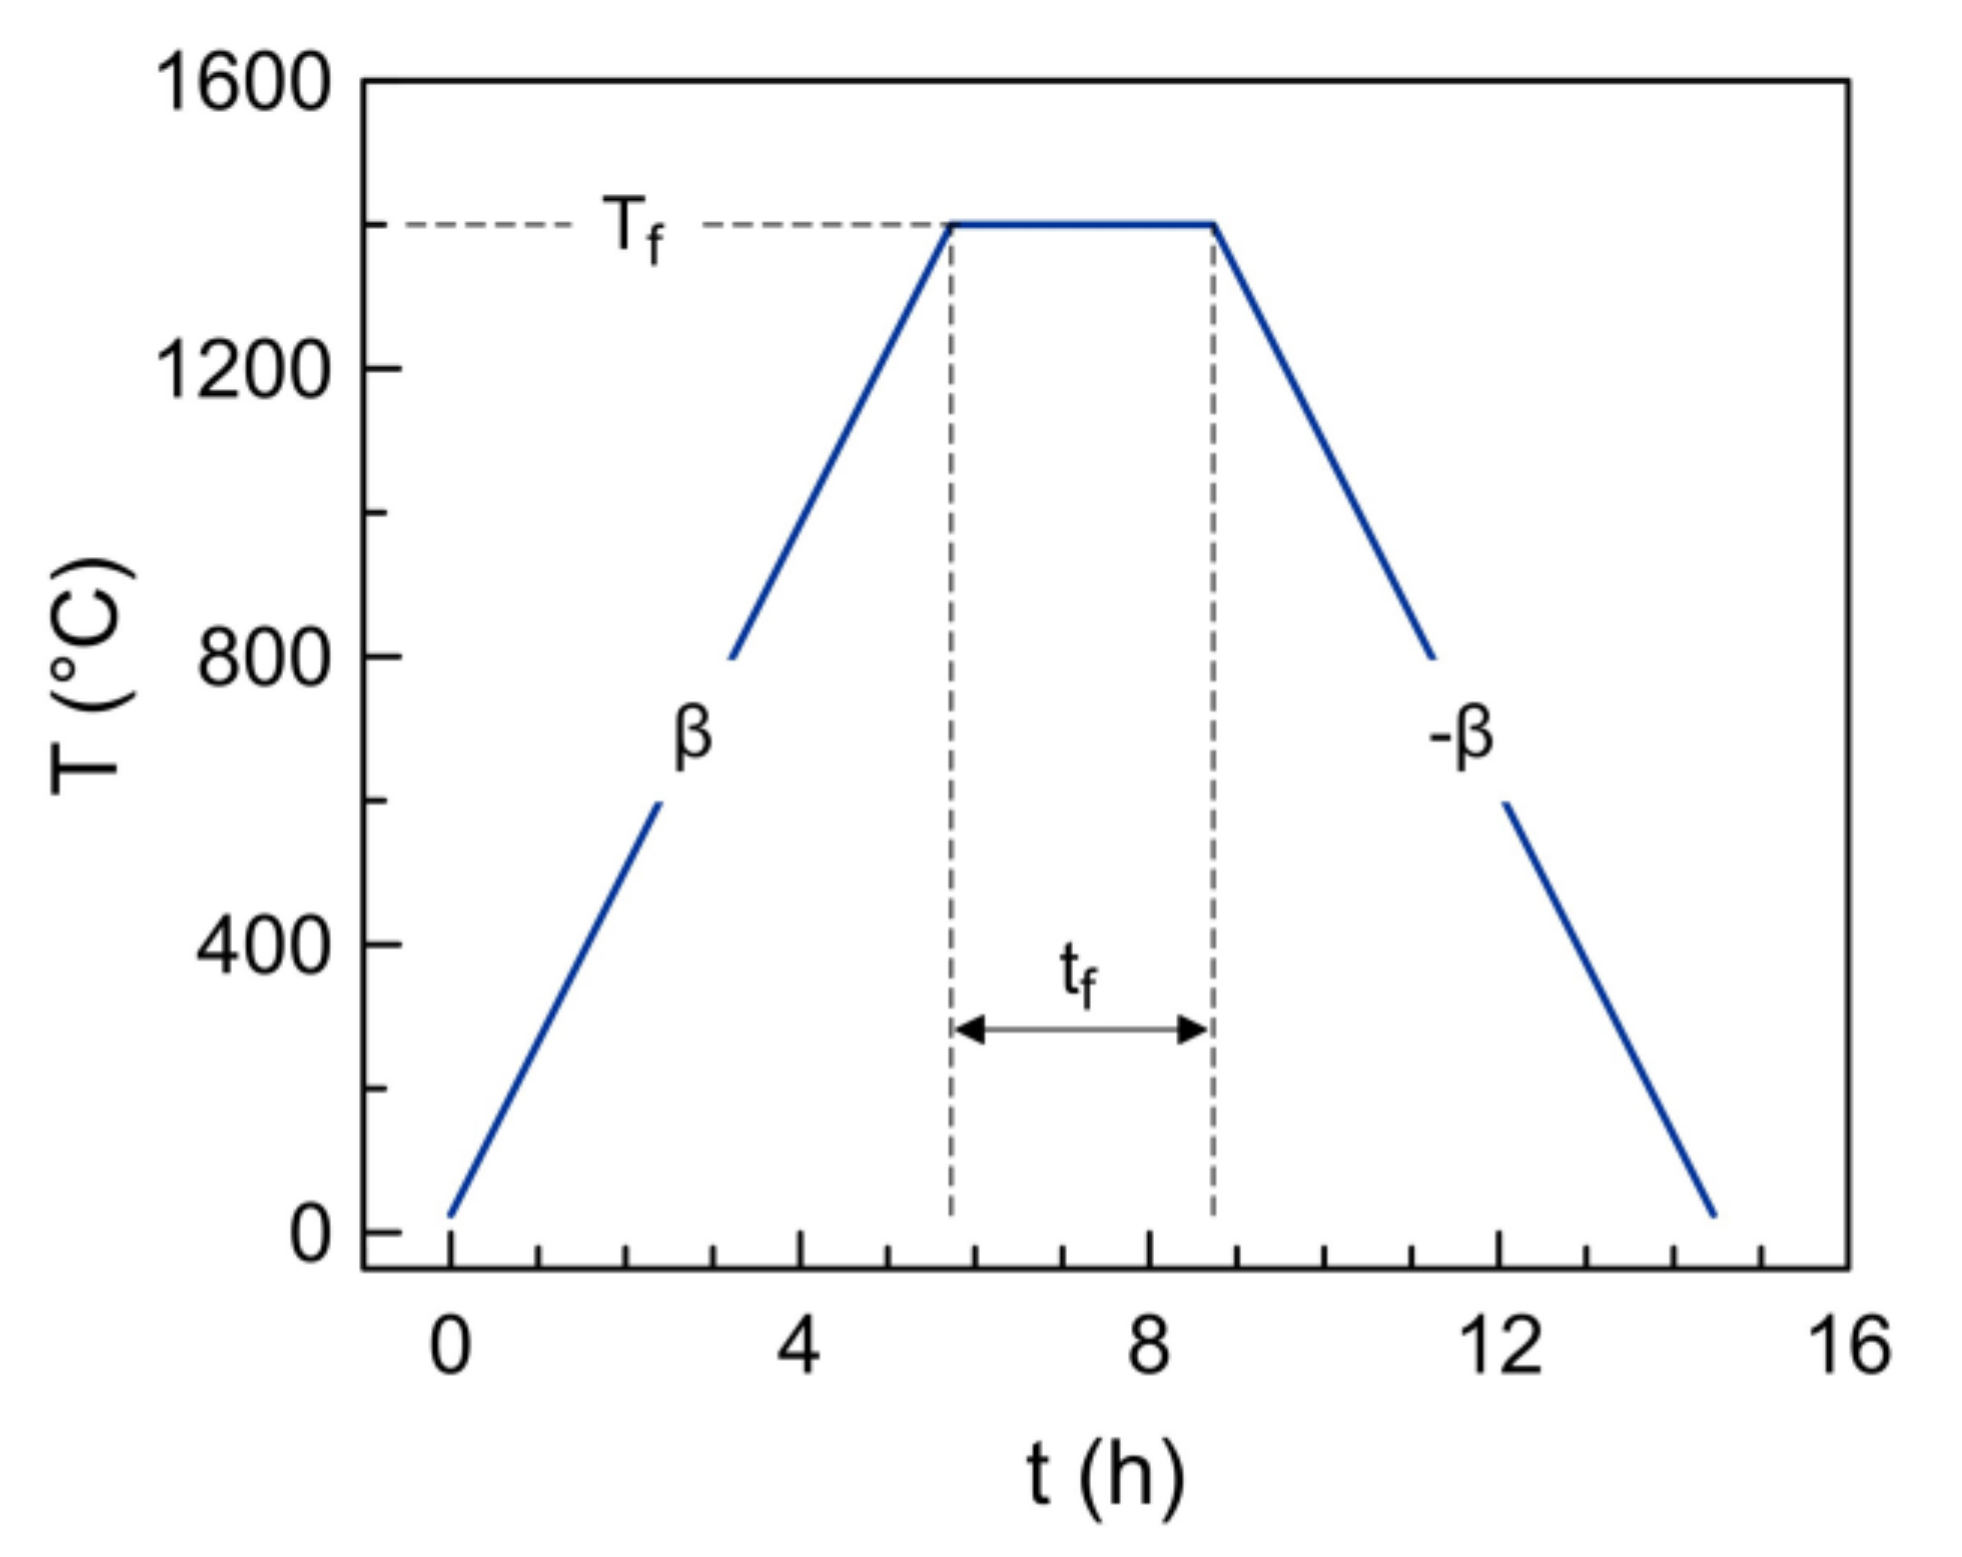
Figure 3a also indicates that one should seek an alternative method to de-convolute effects ascribed to individual factors, and this was performed by statistical multivariate analysis. However, one performed the previous transformation of independent factors based on expected physicochemical guidelines. Thus, one considered trends predicted for temperature-dependent solubility and/or high-temperature kinetics, and assumed typical temperature dependence for a generic property Y, determined by equilibrium or kinetic rate constants, combined with heating rate for variable temperature, as described by Equation (1) [17], or combined with a dwell time of isothermal steps (Equation (2)),
Y R T 2 E a β e x p ± E a R T ,
Y e x p ± E a R T t ,
Both regimes may be linearized by reverting to logarithmic scales, to facilitate analysis of experimental data for dependence on temperature combined with heating rate, or temperature combined with time. Thus, one assumed the following combination of both trends, for approximate dependence of lattice parameter on reciprocal temperature, dwell time and heating/cooling rate:
log Y = Y o + b   l o g 1 β + c T f + e   l o g t f ,
The corresponding fitting parameters for Y = ao, the relative contribution of individual factors, and overall correlation are shown in Table 3; this confirms the prevailing effect of firing temperature but also confirms that contributions of other factors of the firing schedule should not be excluded. The relative quality of fitting is also shown in Figure 3b. The contributions of different factors shown in Table 3 confirm the prevailing effect of firing temperature, and also emphasize time dependence, with combined effects of long firing time, and low heating rate, as illustrated in Figure 3a.

3.2. Microstructural Changes Induced by Sintering Schedules

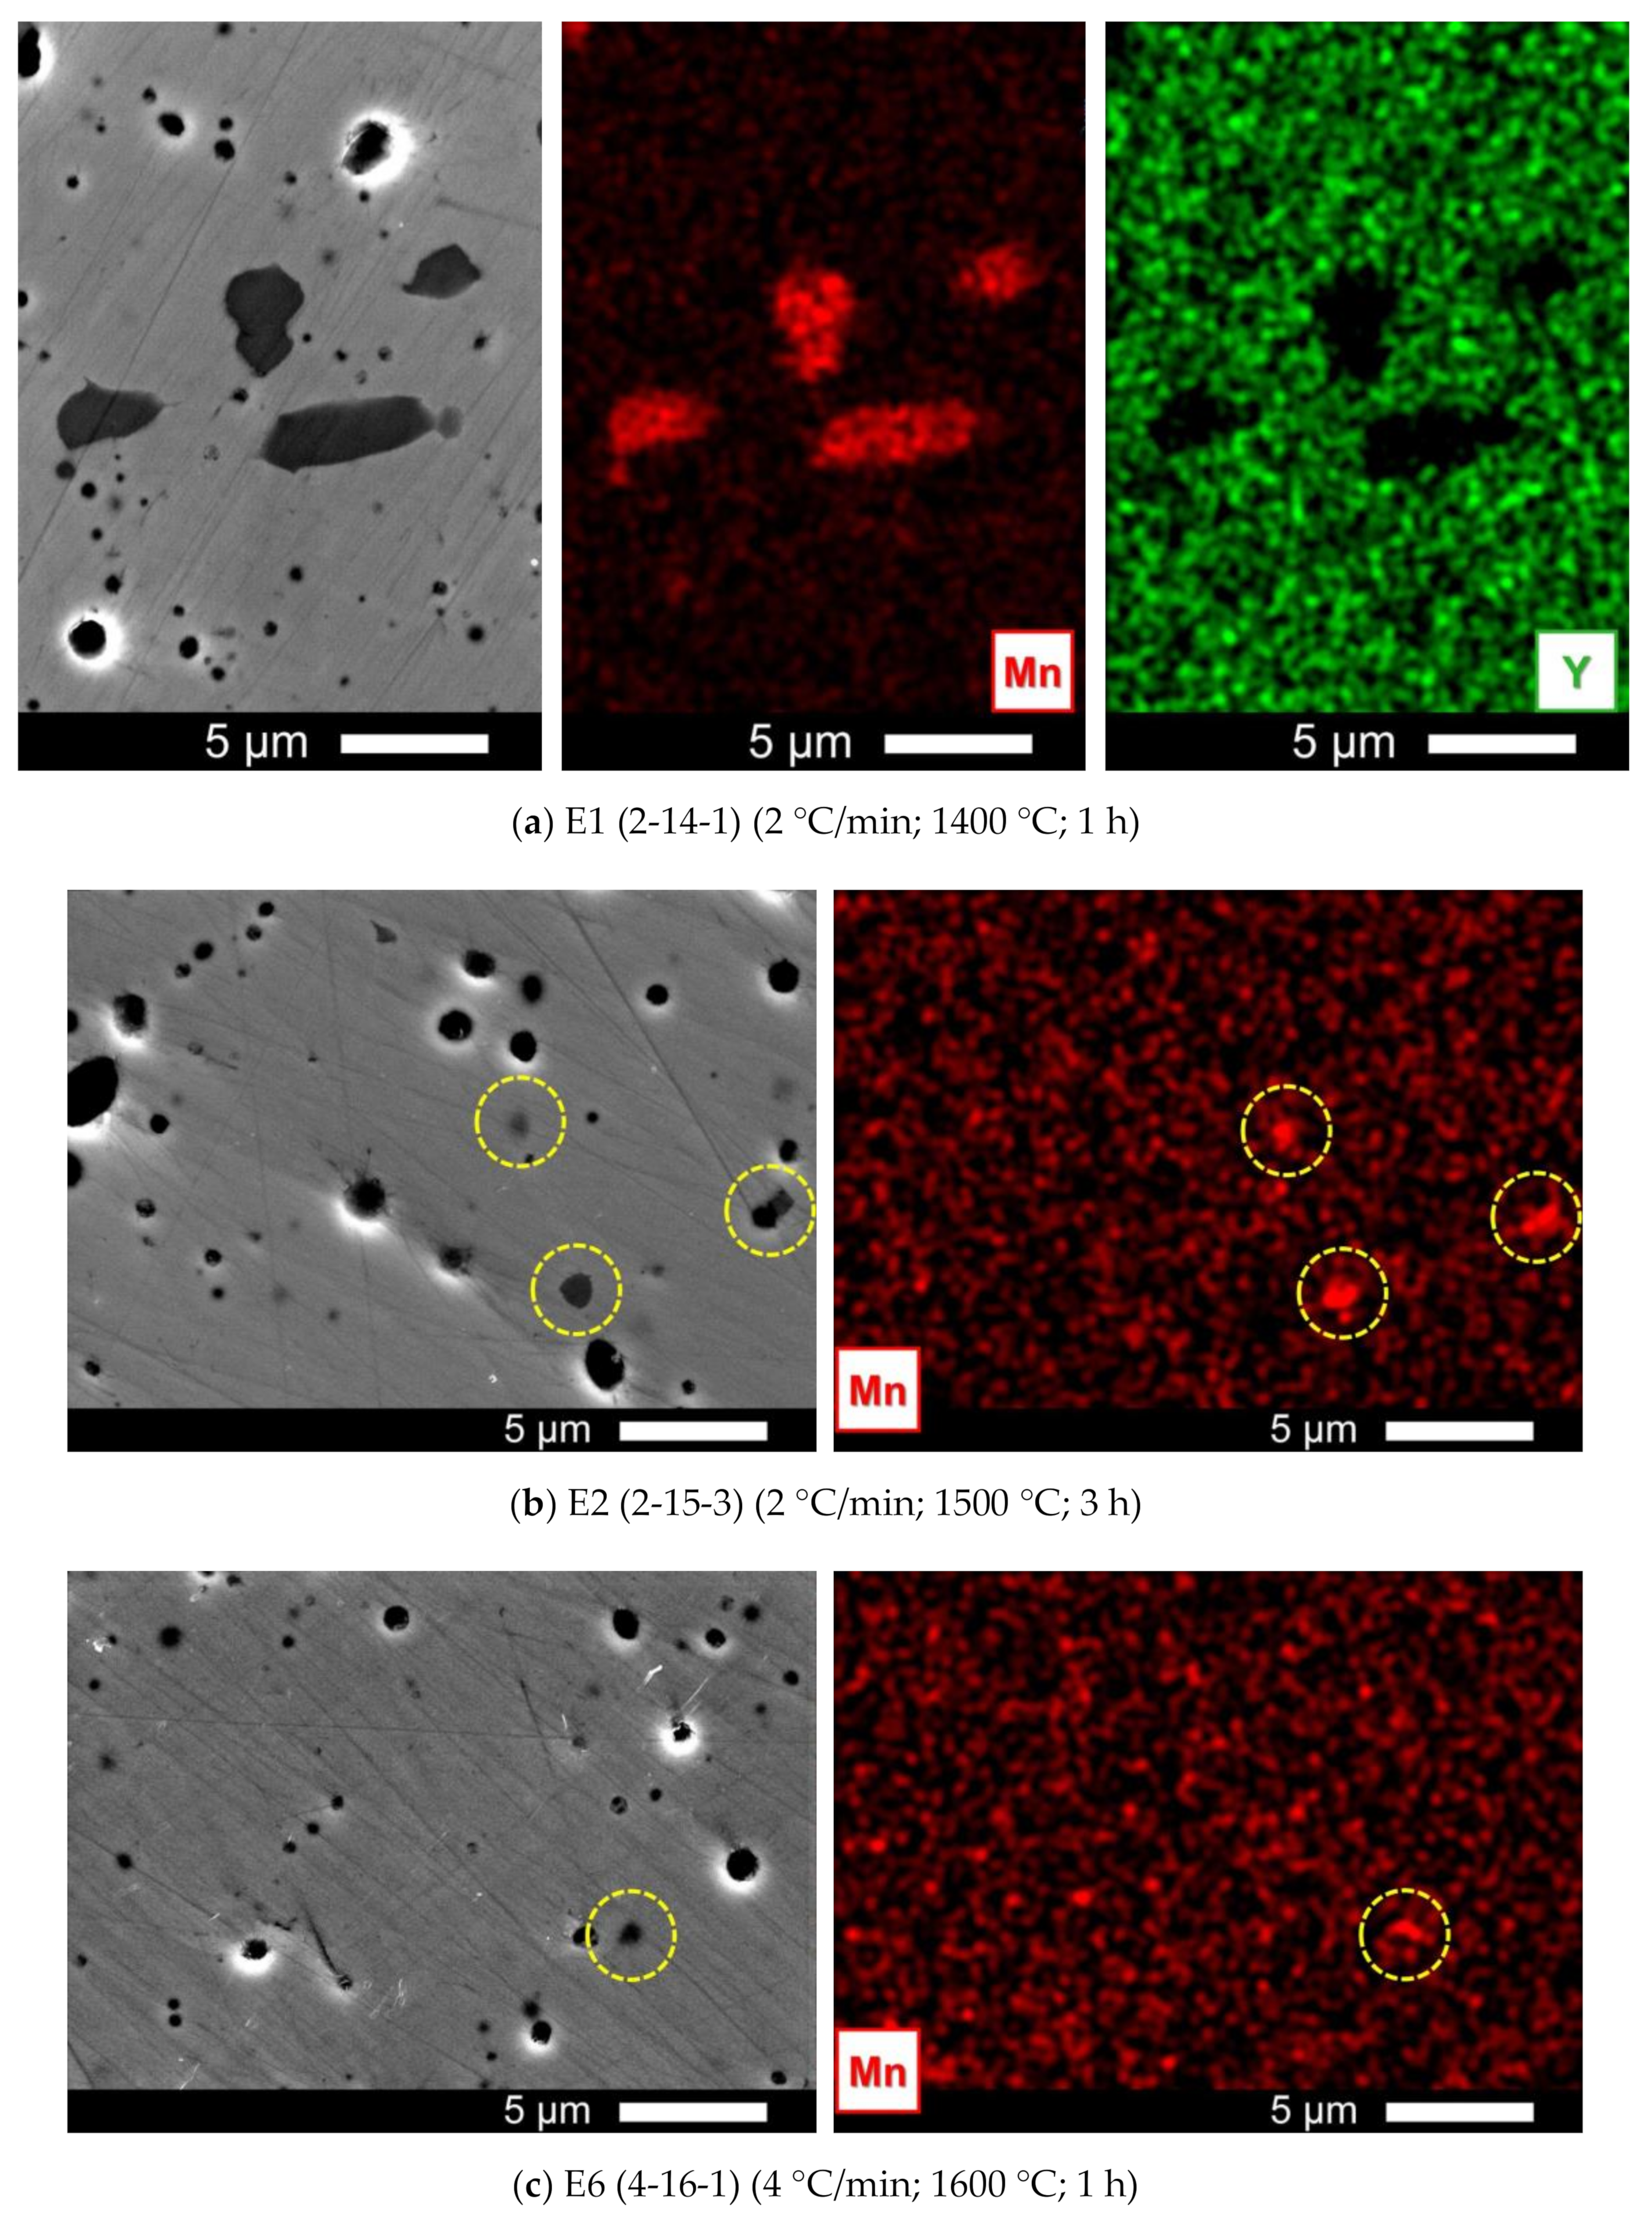
Though X-ray diffraction suggests nearly phase purity, scanning electron microscopy combined with elemental maps (
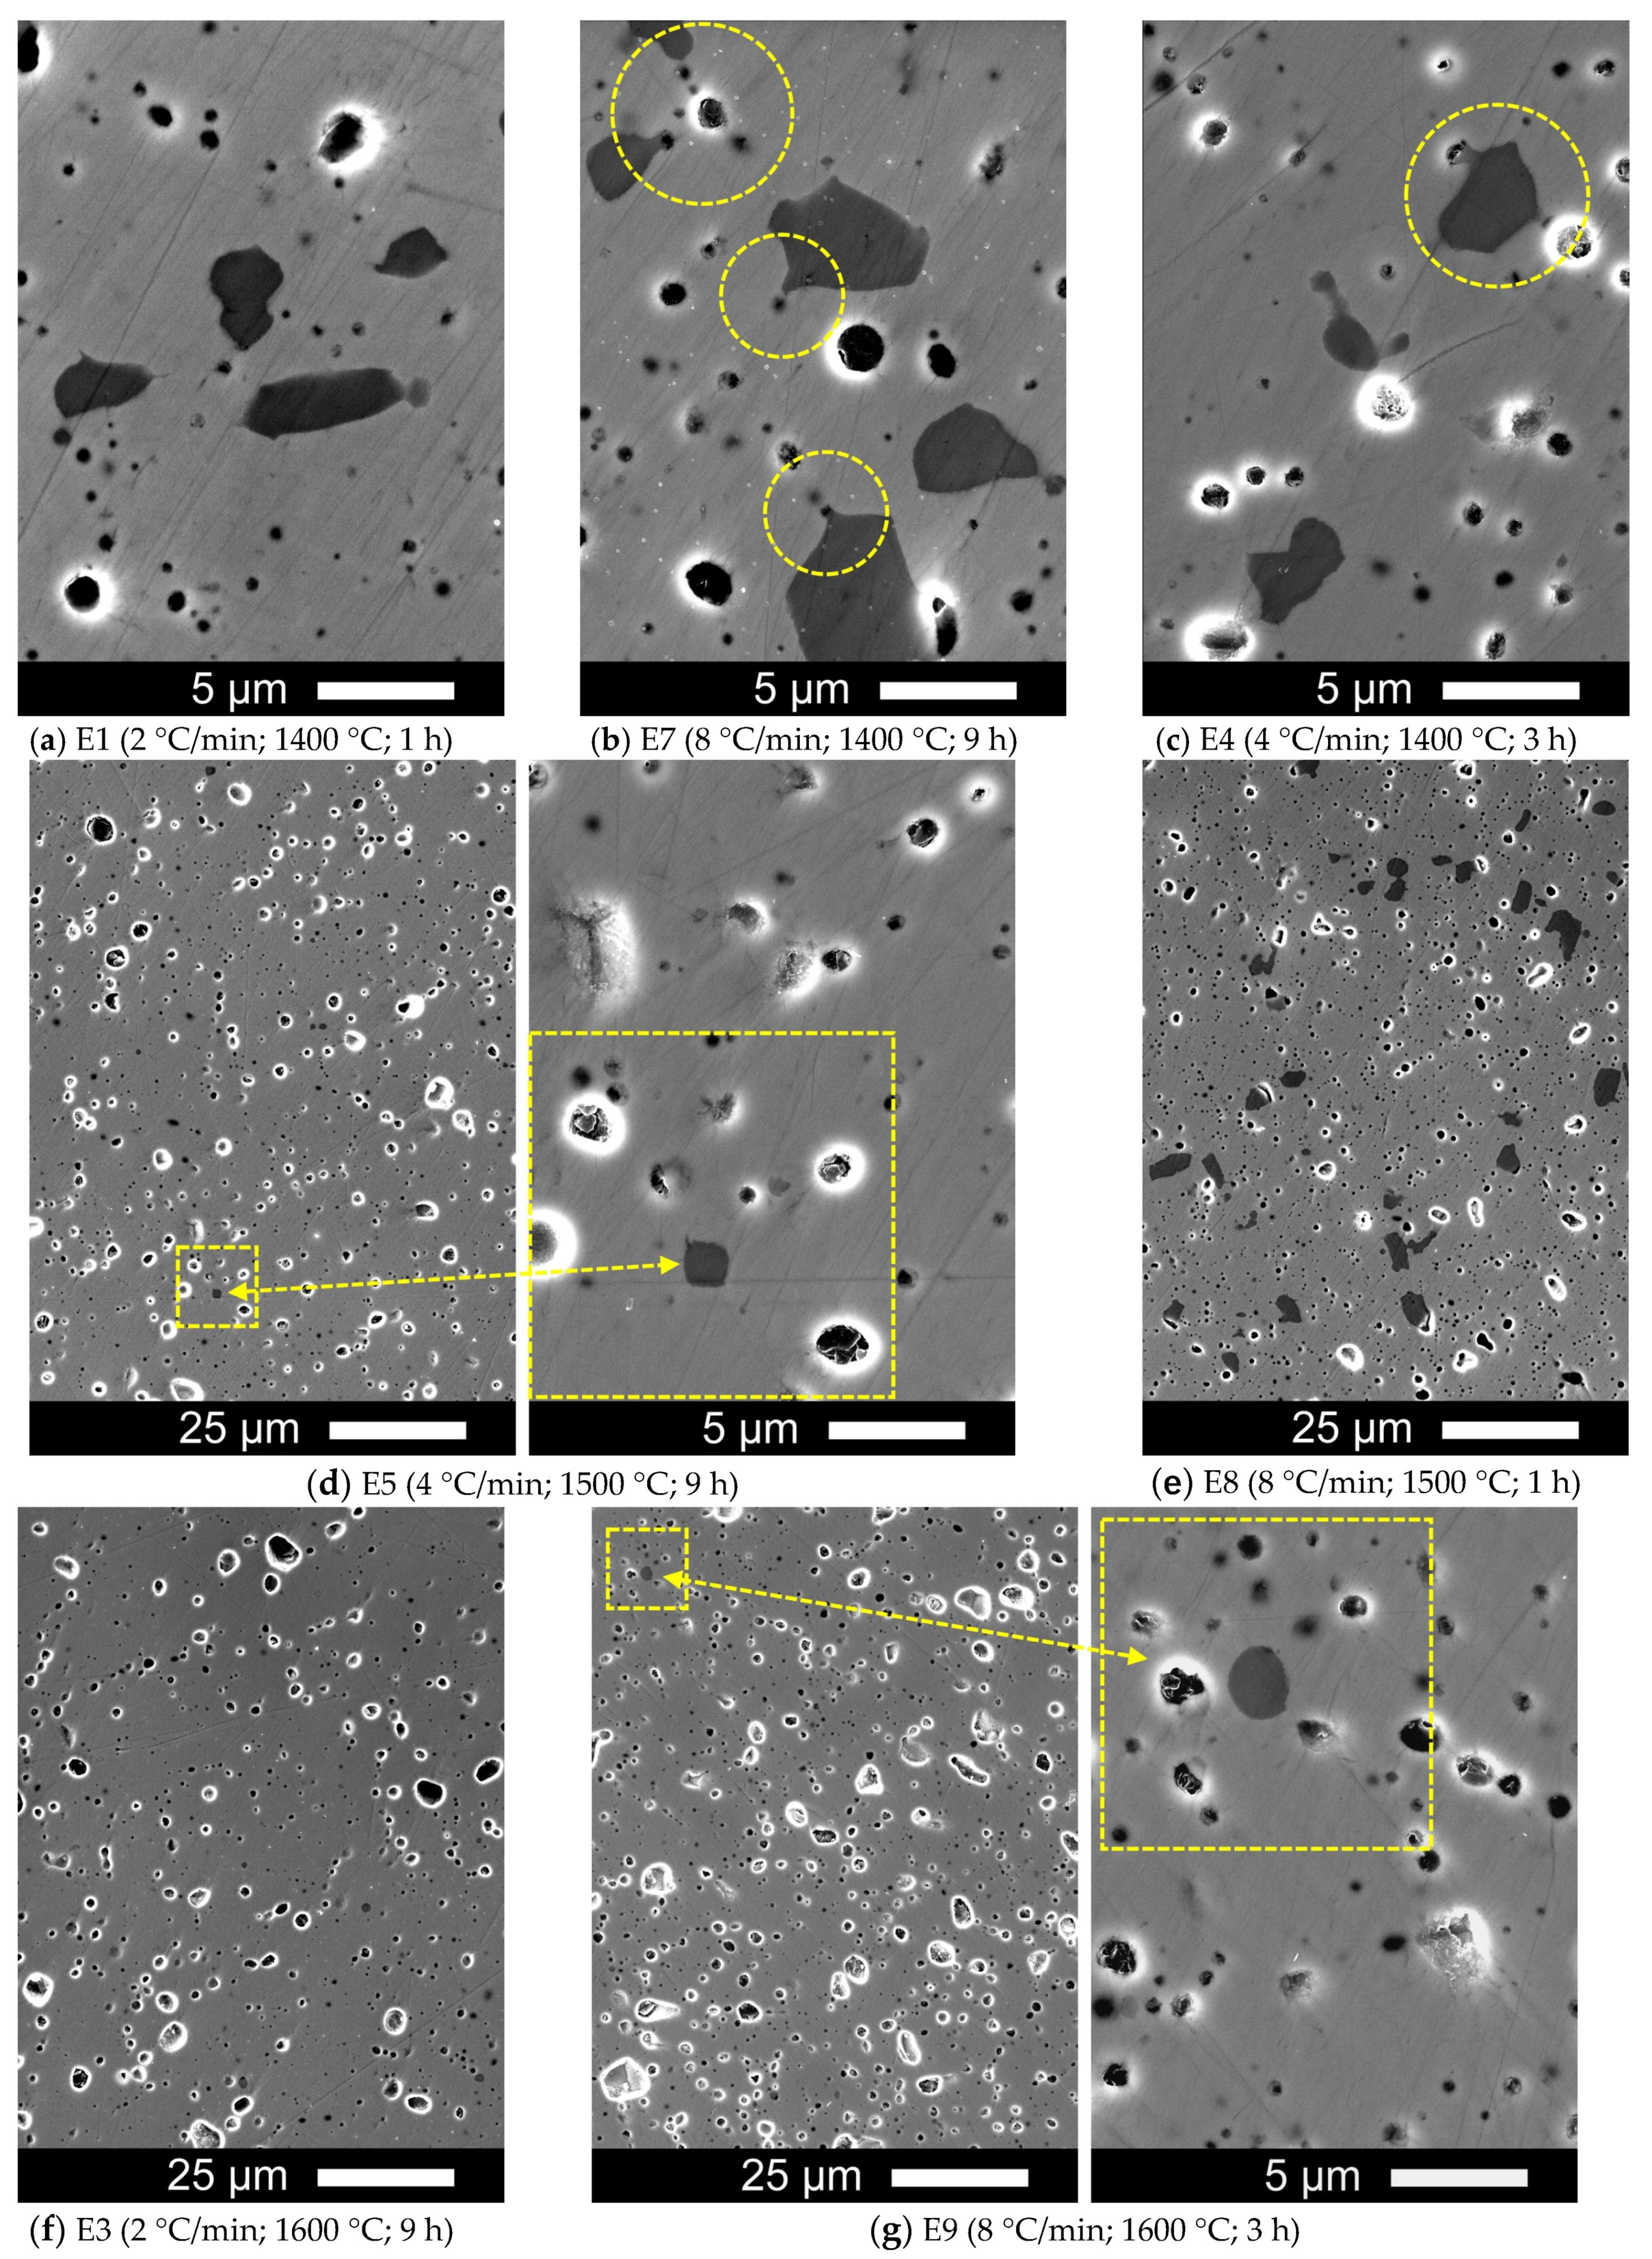
Figure 4) shows clear evidence of traces of Mn-rich phases, mainly for samples with lower firing temperatures. Note also that these Mn-rich spots show depressed concentrations of Zr and Y, indicating that these precipitates are essentially manganese oxides. Still, these precipitates represent relatively low fractions of the observed area, thus explaining why X-ray diffraction fails to detect traces of manganese oxides in most samples. Samples sintered at lower firing temperatures tend to retain larger fractions of Mn-rich precipitates, with particle sizes > 1 µm, whereas higher firing temperatures suppress precipitation and size of residual precipitates also decreases (see also Figure 5). This suggests temperature-dependent solubility, as reported elsewhere [9], and probably also kinetic limitations.
Figure 5 also shows the impact of firing schedules on microstructural features. Mn-rich precipitates are retained in all samples sintered at 1400 °C, whereas firing time and heating/cooling rate are less effective. Mn-segregation seems slightly higher when the heating rate is highest, which is consistent with indications that fast heating counters a decrease in the lattice parameter (Table 2), correlated with the contents of Mn in the zirconia-based fluorite. High heating rate and low sintering time may determine the extent of Mn-segregation for samples fired at intermediate sintering temperature (1500 °C), as found on comparing results for samples E5 (4-15-9) and E8 (8-15-1). At still higher sintering temperature (1600 °C), it is even harder to trace evidence of Mn-rich precipitates.
Thus, the dependence of residual Mn-precipitates on sintering temperature is consistent with the expected increase of solubility at higher temperature [9], and one may use the dependence of lattice parameter on heating rate, firing temperature and firing time (Table 2 and Table 3), as a guideline for corresponding effects on residual contents of Mn-precipitates; this confirms the main effect of temperature but also emphasizes evidence of kinetic effects, determined mainly by early stages on heating at the highest rate. Weaker dependence on sintering time indicates that possible volatilization losses [14] should not play a key role, probably because volatilization involves the pre-reduction of the spinel phase Mn3O4 to lower valence phases (MnO), and this is unlikely by firing in air [9].
All samples show residual porosity, which seems mostly closed, with typical pore sizes in the micrometer range, almost independent of firing temperatures (Figure 5). This may be partially related to specific characteristics of the zirconia precursor powders. In fact, the actual 5Y-PSZ precursor powders were processed by a rather unconventional emulsion detonation synthesis (Innovnano). However, the correlation matrix (Table 2) also suggests an unexpected drop in density on rising the firing temperature and increasing sintering time. Only for the effect of heating rate does one find the expected trend, since a decreasing rate implies a longer time scale for the earliest stage or late stages of sintering.
The absence of a strong correlation (Table 2) and low signal to noise ratio (Figure 6a) raises uncertainties about the dependence of density on sintering conditions, namely unexpected decrease with increasing firing temperature and time. Therefore, one performed multivariate analysis, also based on expected kinetics guidelines (Equation (3)). This yields the fitting parameters (Table 3) with fairly good correlation (Figure 6b), and confirms the abnormal dependence on firing temperature and time. Thus, one estimated theoretical density and relative density based on results of the lattice parameter shown in Table 1, and assuming the nominal composition, with nearly complete dissolution of Mn in the cubic fluorite phase; this yields similar trends for the absolute and relative density (Figure 6b). The weak correlation between density and lattice parameter (Table 2) also excludes a direct interrelation between structural and microstructural changes. Still, one did not consider changes in the solubility of the light element Mn with temperature (Figure 5), and the corresponding decrease in oxygen stoichiometry, expected by charge compensation. In addition, some microstructures in Figure 4 (sample E2 (2-15-3)) show residual Mn-rich spots in residual pores, others (samples E4 (4-14-3) and E7 (8-14-9) in Figure 5) show links between Mn-precipitates and residual closed pores, which may be interpreted as re-precipitation of manganese oxide on cooling, filling residual porosity. Note also that unusual changes in morphology have also been reported after firing YSZ + MnOx composites with dispersed YSZ particles in the MnOx matrix [15]. Thus, these findings and stronger evidence of the prevailing effect of the rate of change in temperature may suggest a key dependence of residual porosity on slow cooling from sintering temperatures. Cooling conditions also exert prevailing effects on transient redox changes and electrical conductivity, as discussed below in Section 3.3. Otherwise, one should consider key dependence on the complex combinations of processes occurring during the earliest stage of heating, namely the onset of sintering, dissolution of Mn, and phase transformation of PSZ to cubic fluorite.

3.3. Changes in Redox and Transport Properties Induced by Sintering Factors

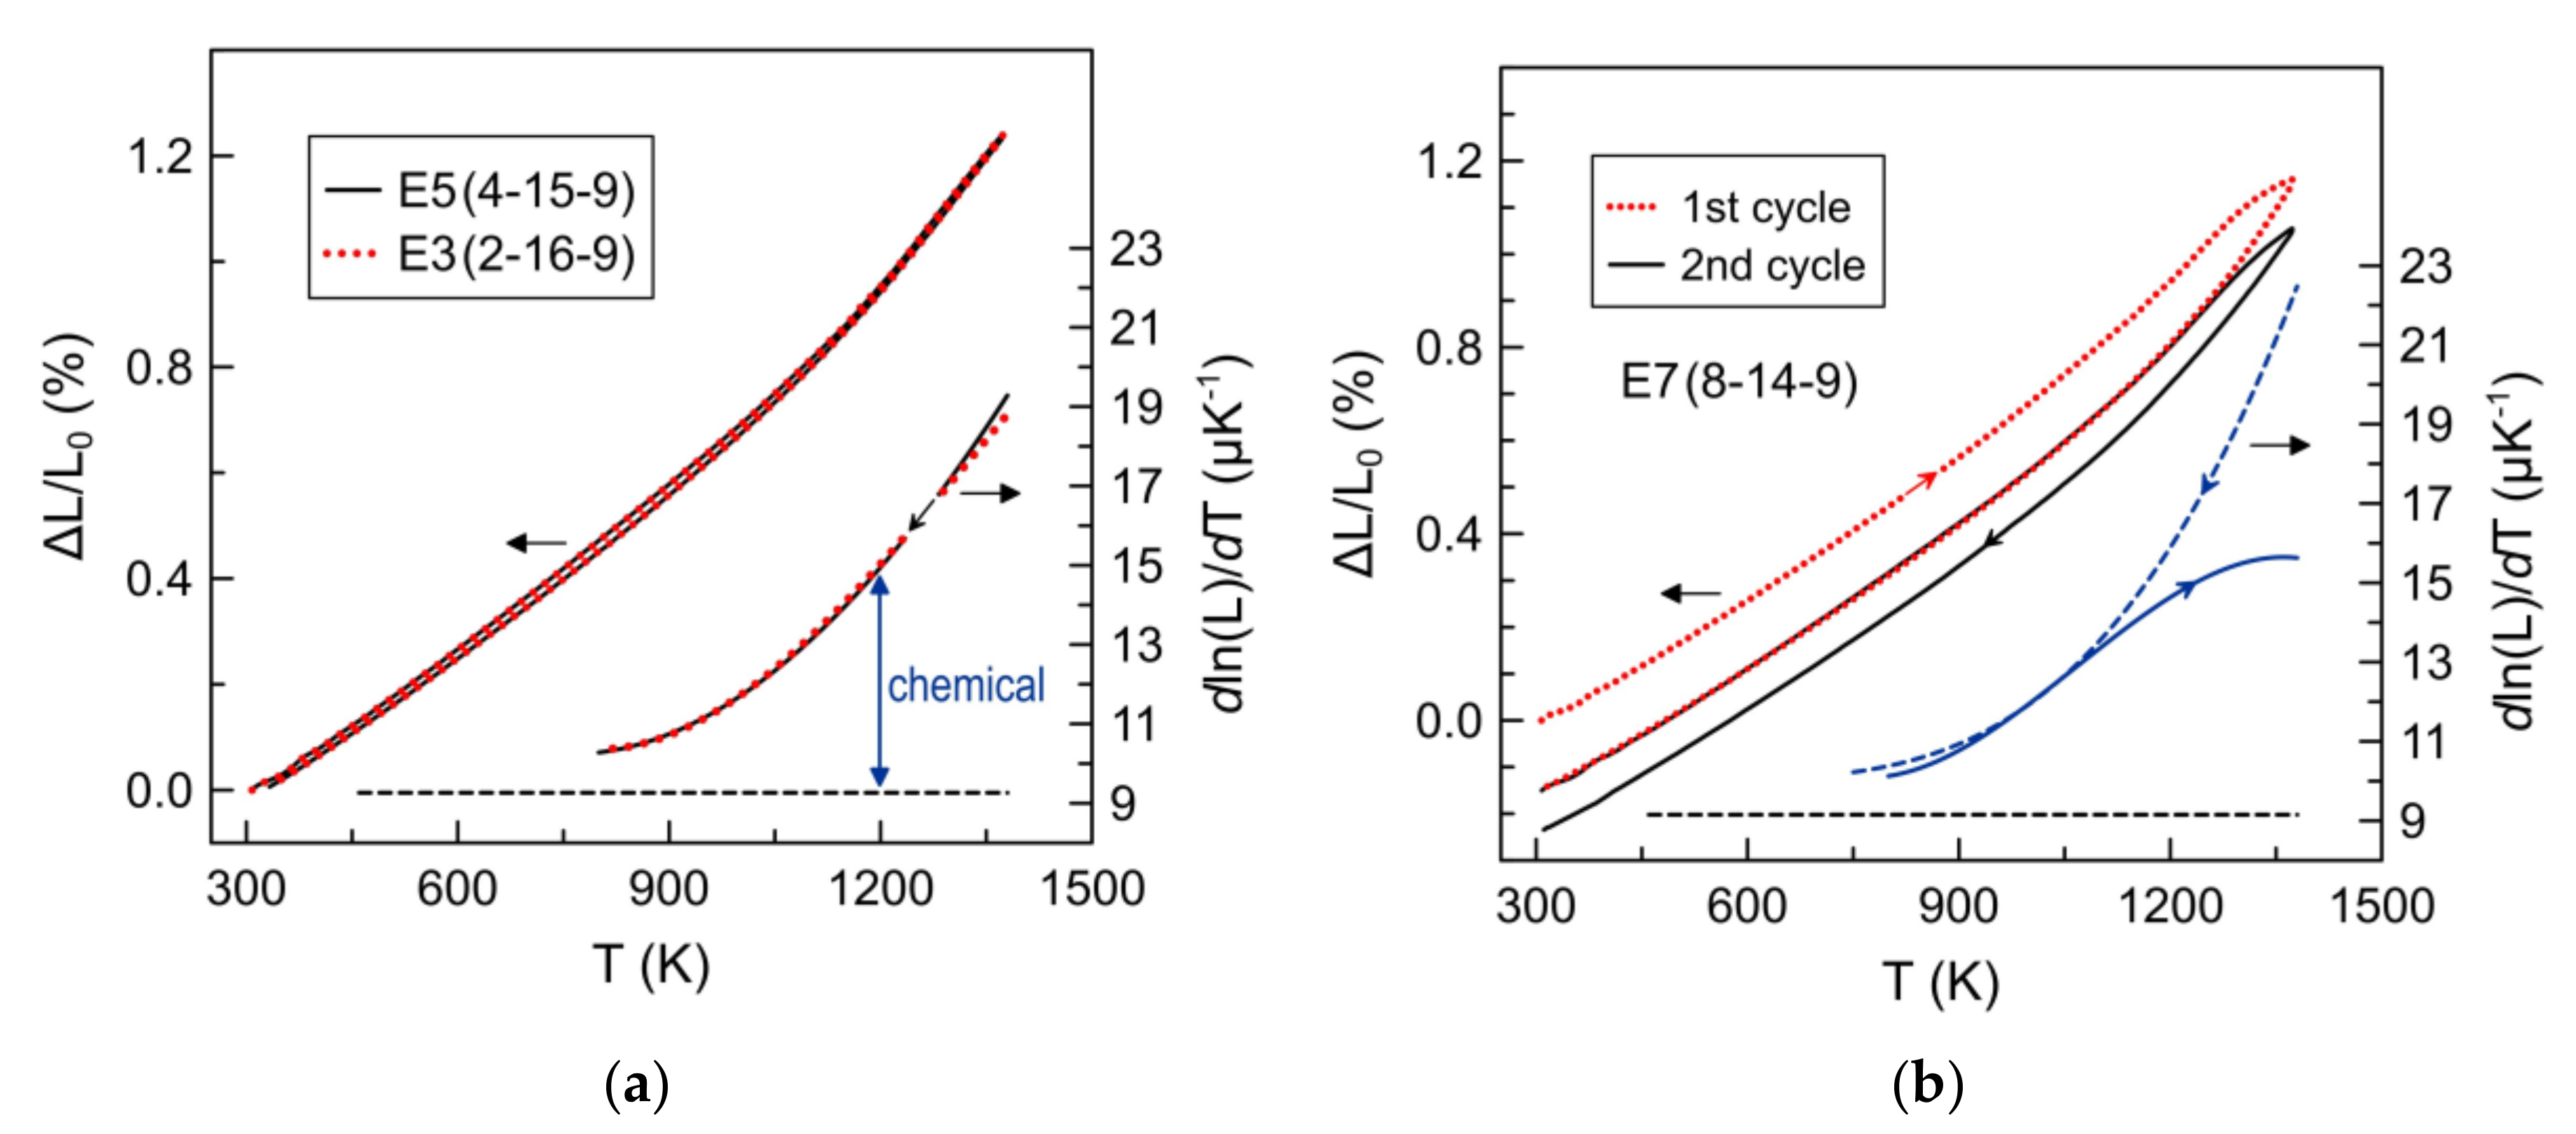
Redox changes of transition metal additives in fluorite materials may induce thermochemical expansion/contraction, with a potential impact on properties, phase stability, and thermochemical compatibility with other components of multilayer cells or devices. Thus, one performed dilatometry (Figure 7) to screen these effects and as a guideline to thermal compatibility of other materials in solid-state electrochemical cells, and problems associated with the onset of chemical expansion. Results obtained for samples E3 (2-16-9) and E5 (4-15-9) are almost indistinguishable, with minimum hysteresis, and also without significant differences between the first and subsequent dilatometry scans; this is consistent with the stabilizing effect of Mn additions, and may also rely on long firing schedules of these samples (Table 1), as well as low or intermediate cooling rates. In these cases, one may extract the thermal expansion coefficient from the slope in the low-temperature range (dashed line in Figure 7a), yielding typical values in the range (9.3–9.6) × 10−6 K−1, as expected for zirconia-based materials. The chemical expansion may also be extracted from gradual slope changes with increasing temperature, as shown in the secondary vertical axis. Note the gradual increase in chemical expansion, rather than step changes. The ready reversibility of this chemical expansion indicates that this may be ascribed to a slight increase in the Mn2+:Mn3+ ratio, with a corresponding increase in average ionic radii. At typical working temperatures of solid electrolyte electrochemical cells (900–1200 K), one finds a moderate range of chemical expansion. This may be useful for buffer layers to bridge the thermochemical expansion gap between classical YSZ electrolytes and ceramic electrodes, including LSM.
The thermochemical expansion of sample E7 (8-14-9) (Figure 7b) shows more complex behavior, with significant hysteresis, which tends to become narrower in subsequent dilatometry scans, indicating relaxation of partially quenched redox changes, with cumulative shrinkage. Relaxation may be ascribed to delayed temperature-dependent re-oxidation of Mn2+ to smaller Mn3+ cations, probably hindered by relatively fast cooling from sintering temperatures. Note also that one should not consider re-precipitation of Mn as the primary process of relaxation because the cubic lattice should expand with decreasing contents of Mn [6]. Relaxation is most obvious at the highest temperatures of the dilatometry scans, and revealed mainly by the ascending branch, as transient relaxation suppresses chemical expansion. This is reverted during the descending branch, when relaxation increases the dependence of chemical expansion on temperature, with an apparent increase in chemical expansion. Thus, both branches deviate from the true contribution of chemical expansion.
Ionic and electronic transport properties of these zirconia-based materials are also expected to depend on effective solubility of Mnn+ species and their redox changes, as well as structural and microstructural features induced by firing. Thus, one used the electrical conductivity to screen those effects and to obtain guidelines to optimize properties. The correlation matrix (Table 2) and also the relative signal to noise ratio (Figure 8a), as well as multivariate analysis (Figure 8b) all confirm the strongest dependence on the rate of change in temperature, rather than sintering temperature and/or time. This may be understood by considering the impact of residual porosity, as emphasized by the significant correlation between conductivity and density. In addition, the mixed ionic + electronic transport properties of these zirconia-based materials with high Mn additions [8] are also likely to depend on their redox behavior.
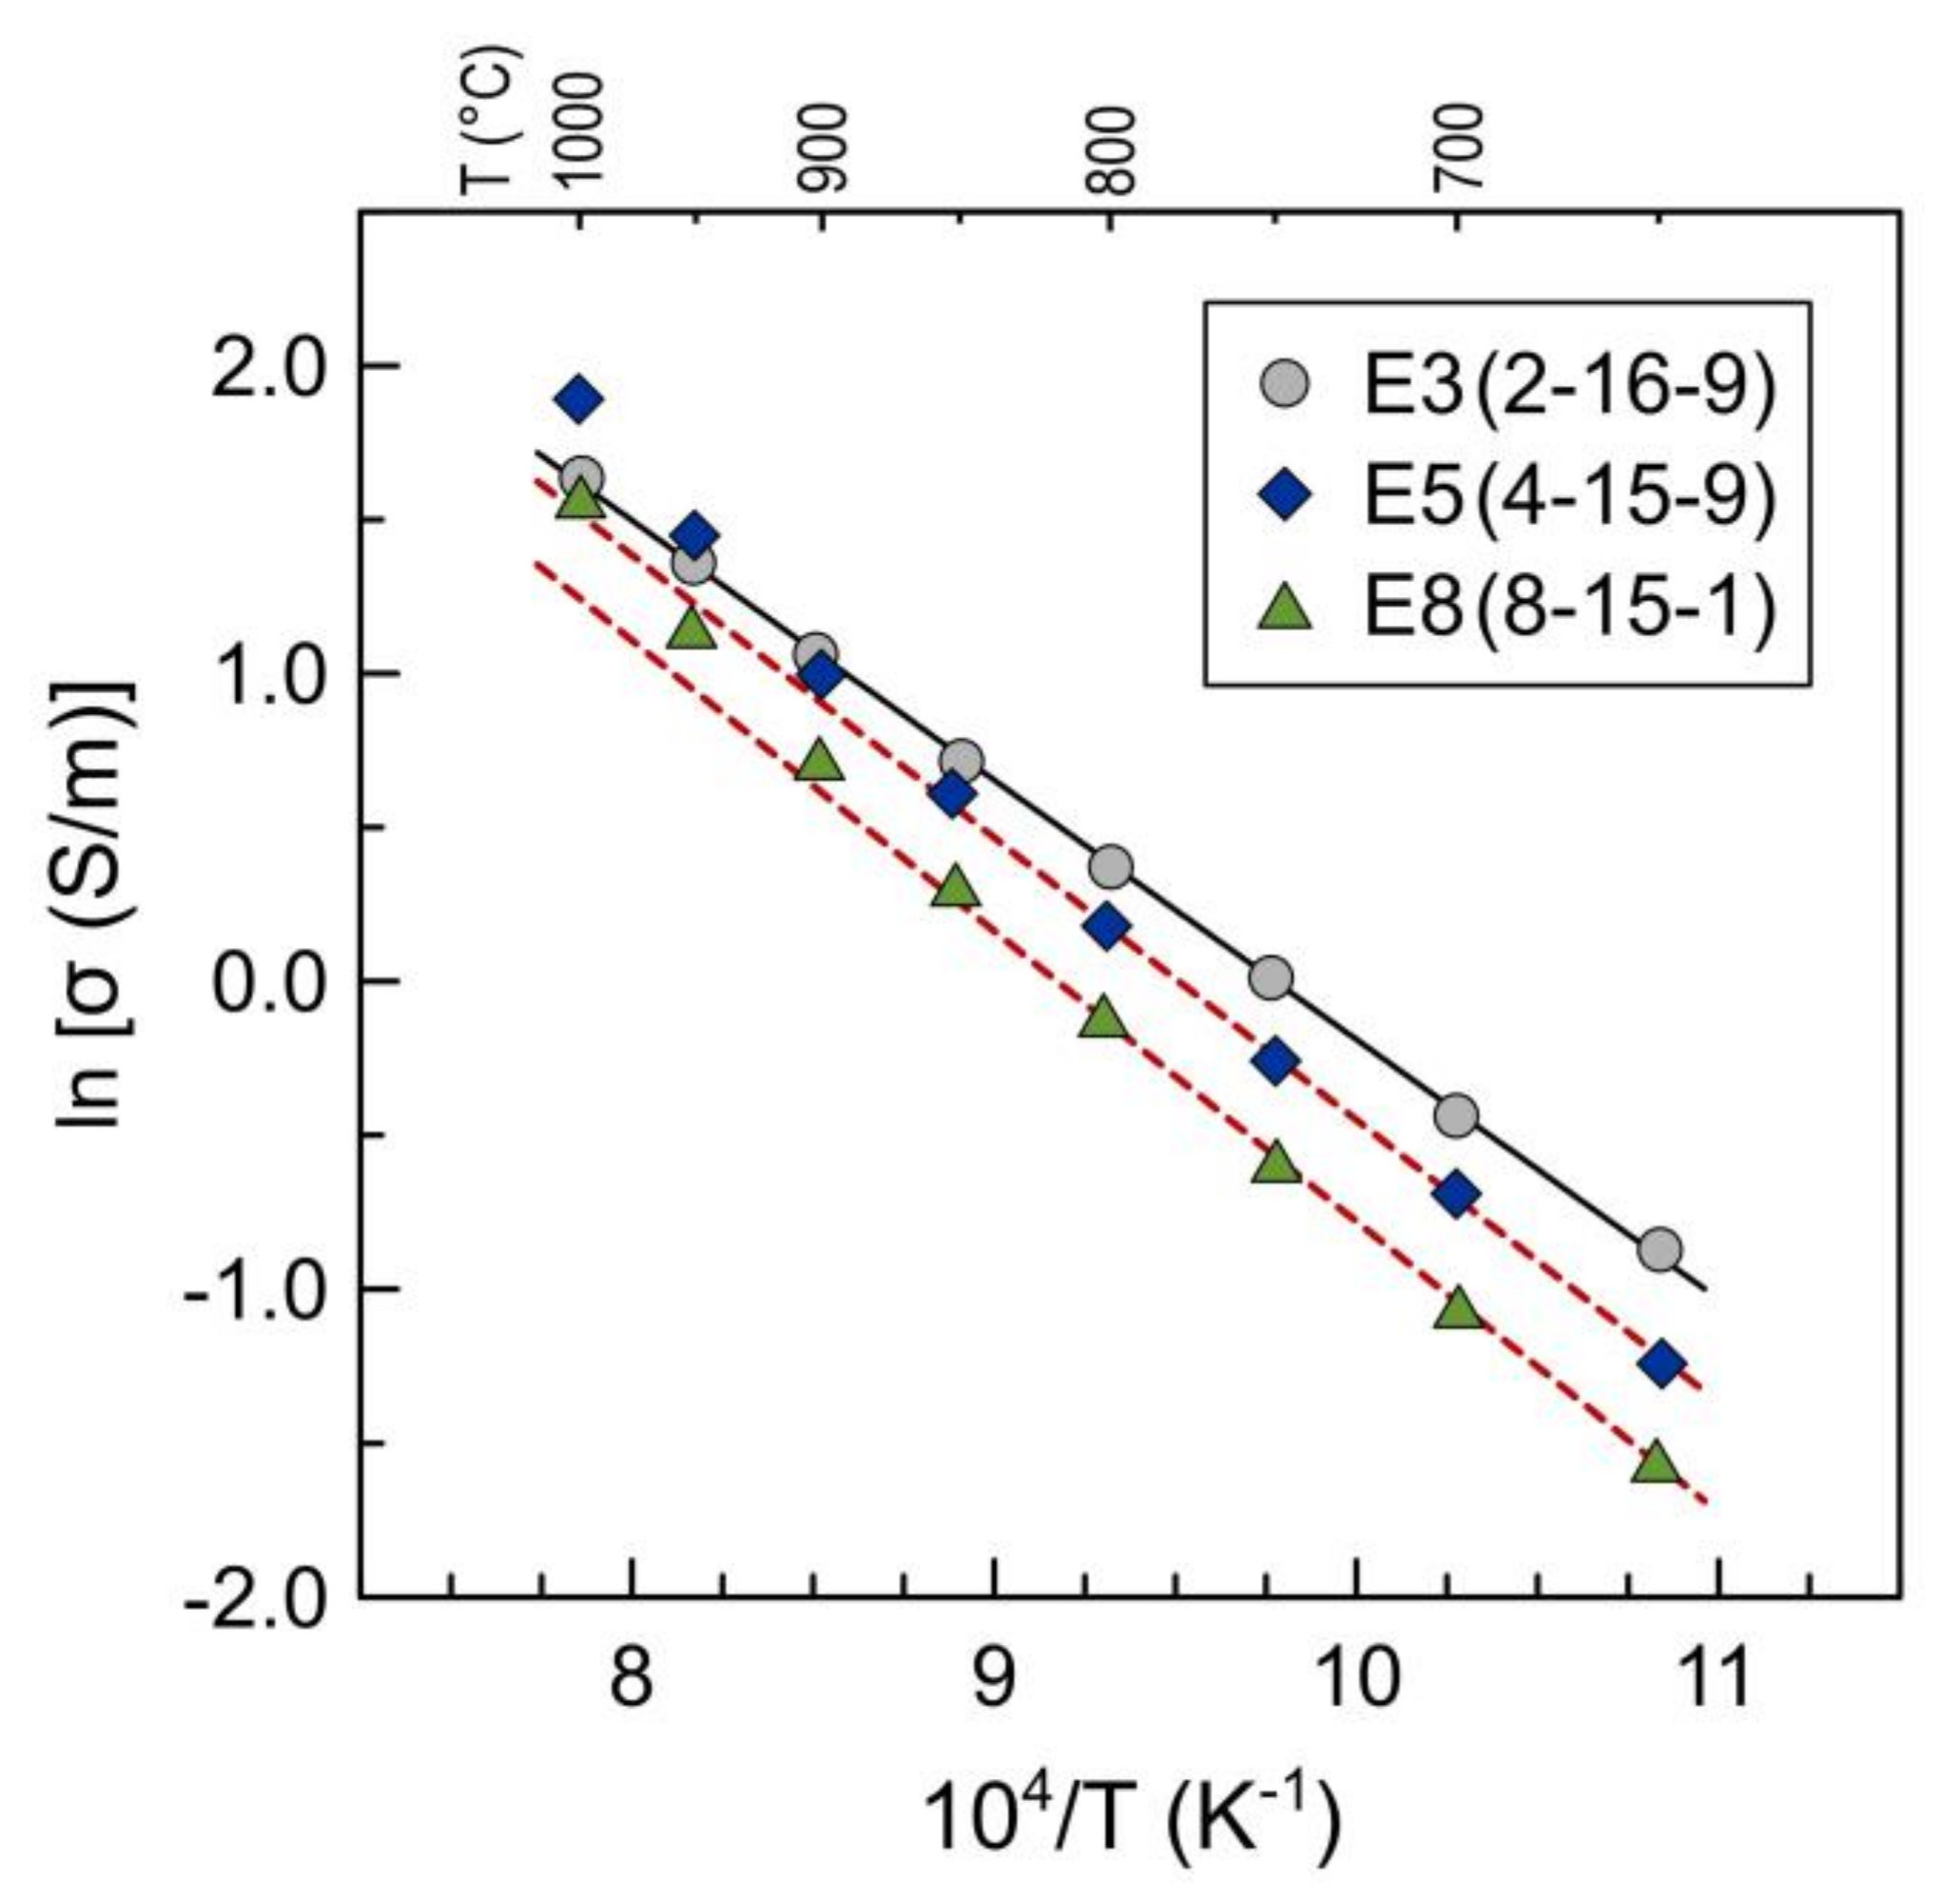
The temperature dependence of conductivity (Figure 9) is nearly described by the Arrhenius dependence expected for prevailing electronic conductivity (Equation (4)), taking into account that the ionic transport number is low in oxidizing conditions [18].
l n σ = l n σ 0 E a R T ,
However, one finds significant deviations from linearity for some samples (mainly E5 (4-15-9) and E8 (8-15-1)), above 800 °C. Thus, the values of activation energy shown in Table 1 refer only to temperatures below 800 °C. These values are within the expected ranges [8], and one could not find a conclusive correlation with firing parameters (Table 2), possibly because the time scale for electrical conductivity measurements is sufficient to relax quenched in effects induced by fast cooling. Similarly, one could not find correlations between deviations from linear Arrhenius dependence and firing conditions, possibly because the relaxation of partially frozen in conditions may still be occurring during the relatively long period of time required for the electrical conductivity characterization, at temperatures up to 1000 °C.

4. Conclusions

The firing schedules determine structural, microstructural, and redox changes in zirconia-based materials with relatively high additions of manganese oxide, and may also have important effects on relevant properties, if one considers the design of buffer layer materials to minimize degradation and delamination at oxygen electrode–electrolyte interfaces. The dissolution of manganese oxide in the PSZ zirconia precursor occurs readily during direct firing, inducing transformation to cubic fluorite. The lattice parameter varies mainly with firing temperature, due to slight changes in solubility of Mn, whereas dependence of lattice parameter on firing time indicates kinetic limitations. Effects of heating/cooling rate during firing on lattice parameters may also be related to transient changes occurring at the earliest stage of heating, or reverted changes on cooling, such as the decrease in solubility with decreasing temperature and partial oxidation of divalent Mn2+ to trivalent Mn3+ ions. Microstructural studies show the presence of Mn-rich precipitates, in close agreement with corresponding changes in the lattice parameter. Closed porosity is retained even after firing at the highest temperature (1600 °C), possibly due to constrained microstructural rearrangements or the delayed dissolution of Mn during the initial stage, mainly with the highest heating rate. These limitations may hinder densification at the highest firing temperatures. Slow cooling contributes to an increase in density, possibly by a combination of redox induced lattice contraction and partial re-precipitation of manganese oxide filling residual porosity. Thermochemical expansion shows nearly reversible behavior, with a significant contribution of chemical expansion above about 900 K. However, fast cooling from sintering temperatures still induces hysteresis, which can be ascribed to the relaxation of partially frozen in redox changes. This may also explain a negative impact of fast cooling on electrical conductivity.

Author Contributions

Conceptualization, J.R.F.; methodology, J.R.F. and A.Y.; investigation, A.N.; data analysis, A.N., J.R.F., and A.Y.; writing—original draft preparation, J.R.F.; writing—review and editing, A.N., A.Y. and J.F.; supervision, project administration and funding acquisition, J.R.F. and A.Y. All authors have read and agreed to the published version of the manuscript.

Funding

This work was supported by the projects HEALING (POCI-01-0145-FEDER-032036), CARBOSTEAM (POCI-01-0145-FEDER-032295), and project CICECO-Aveiro Institute of Materials (UIDB/50011/2020 & UIDP/50011/2020), financed by FEDER, through COMPETE2020-Programa Operacional Competitividade e Internacionalização (POCI), and by national funds through FCT/MCTES. Alejandro Natoli acknowledges PhD scholarship by the FCT (SFRH/BD/116853/2016).

Conflicts of Interest

The authors declare no conflict of interest.

References

  1. Yang, X.; Yang, X.; Yu, X.; Jing, M.; Song, W.; Liu, J.; Ge, M. Defective MnxZr1−xO2 solid solution for the catalytic oxidation of toluene: Insights into the oxygen vacancy contribution. ACS Appl. Mater. Interfaces 2019, 11, 730–739. [Google Scholar] [CrossRef] [PubMed]
  2. Bulavchenko, O.A.; Vinokurov, Z.S.; Afonasenko, T.N.; Tsybulya, S.V. Influence of CO oxidation conditions on the Mn-Zr oxide catalyst structure: In situ XRD and MS study. Mater. Lett. 2020, 258, 126768. [Google Scholar] [CrossRef]
  3. Appel, C.; Bonanos, N.; Horsewell, A.; Linderoth, S. Ageing behaviour of zirconia stabilized by yttria and manganese oxide. J. Mater. Sci. 2001, 36, 4493–4501. [Google Scholar] [CrossRef]
  4. Dravid, V.P.; Ravikumar, V.; Notis, M.R.; Lyman, C.E.; Dhalenne, G.; Revcolevschi, A. Stabilization of cubic zirconia with manganese oxide. J. Amer. Ceram. Soc. 1994, 77, 2758–2762. [Google Scholar] [CrossRef]
  5. Dey, T.; Sharma, A.D.; Dutta, A.; Basu, R.N. Transition metal-doped yttria stabilized zirconia for low temperature processing of planar anode-supported solid oxide fuel cell. J. Alloy Compd. 2014, 604, 151–156. [Google Scholar] [CrossRef]
  6. Kawashima, T. Phase equilibria in ZrO2-Y2O3-MnOt ternary system at 1673 K. Materials Trans. JIM 1999, 40, 967–971. [Google Scholar] [CrossRef] [Green Version]
  7. Kim, J.H.; Choi, G.M. Mixed ionic and electronic conductivity of [(ZrO2)0.92(Y2O3)0.08]1-y(MnO1.5)y. Solid State Ion. 2000, 130, 157–168. [Google Scholar] [CrossRef]
  8. Pomykalska, D.; Bućko, M.M.; Rękas, M. Electrical conductivity of MnOx–Y2O3–ZrO2 solid solutions. Solid State Ion. 2010, 181, 48–52. [Google Scholar] [CrossRef]
  9. Chen, M.; Hallstech, B.; Gauckler, L.J. Thermodynamic modelling of phase equilibria in the Mn-Y-Zr-O system. Solid State Ion. 2005, 176, 1457–1464. [Google Scholar] [CrossRef]
  10. Appel, C.C.; Botton, G.A.; Horsewell, A.; Stobbs, W.M. Chemical and structural changes in manganese-doped yttria-stabilized zirconia studied by electron energy loss spectroscopy combined with electron diffraction. J. Am. Ceram. Soc. 1999, 82, 429–435. [Google Scholar] [CrossRef]
  11. Marrocchelli, D.; Perry, N.H.; Bishop, S.R. Understanding chemical expansion in perovskite-structured oxides. Phys. Chem. Chem. Phys. 2015, 17, 10028–10039. [Google Scholar] [CrossRef] [PubMed]
  12. Chatzichristodoulou, C.; Norby, P.; Hendriksen, P.V.; Mogensen, M.B. Size of oxide vacancies in fluorite and perovskite structured oxides. J. Electroceram. 2015, 34, 100–107. [Google Scholar] [CrossRef] [Green Version]
  13. Mori, T. Taguchi Methods: Benefits, Impacts, Mathematics, Statistics, and Applications; ASME: New York, NY, USA, 2011. [Google Scholar]
  14. Matraszek, A.; Miller, M.; Singheiser, L.; Hilpert, K. Thermodynamic vaporization studies of the manganese oxide-yttria stabilized zirconia (YSZ) solid solution. J. Eur. Ceram. Soc. 2004, 24, 2649–2656. [Google Scholar] [CrossRef]
  15. Li, N.; Asadikiya, M.; Zhong, Y.; Singh, P. Evolution of porous YSZ surface morphology in YSZ-MnOx system. J. Am. Ceram. Soc. 2018, 101, 4802–4811. [Google Scholar] [CrossRef]
  16. Kawada, T.; Sakai, N.; Yokokawa, H.; Dokiya, M. Electrical properties of transition-metal-doped YSZ. Solid State Ion. 1992, 53–56, 418–425. [Google Scholar] [CrossRef]
  17. Frade, J.R. Crystallization with variable temperature: Corrections for the activation energy. J. Amer. Ceram. Soc. 1998, 81, 2654–2660. [Google Scholar] [CrossRef]
  18. Mahapatra, M.K.; Li, N.; Verma, A.; Singh, P. Electrical conductivity of manganese doped yttria (8 mol%) stabilized zirconia. Solid State Ion. 2013, 253, 223–226. [Google Scholar] [CrossRef]
Figure 1. Representative example of a firing schedule with identical heating/cooling rates (E4 4-14-3) in Table 1).
Ceramics 03 00031 g001
Figure 2. X-ray diffractograms of samples E1 (2-14-1) and E7 (8-14-9), sintered with firing schedules shown in Table 1. (Bottom): Relative intensity is shown in logarithmic scale to screen eventual traces of secondary phases. (Top): The cross symbols and the solid line (red) represent the experimental and calculated intensities, respectively, and the line below (blue) is the difference between them. Tick marks (green) indicate the positions of Bragg peaks in the F m 3 ¯ m space group.
Ceramics 03 00031 g002
Figure 3. (a) Dependence of lattice parameter on heating/cooling rate, sintering temperature and time, based on averaged results from Table 1. Error bars show the lowest and highest results obtained at a given level of a specific factor; (b) Multivariate fitting vs. experimental results of lattice parameter (Equation (3)).
Ceramics 03 00031 g003
Figure 4. Scanning electron microscopy with Mn-rich precipitates identified by a darker shade and/or by EDS elemental mapping, for samples sintered at (a) 1400 °C (E1 (2-14-1)), (b) 1500 °C (E2 (2-15-3)) and (c) 1600 °C (E6 (4-16-1)). Circles show a close correlation between dark spots of light elements and higher concentrations of Mn.
Ceramics 03 00031 g004
Figure 5. Scanning electron microstructures of samples processed with different firing schedules: (a) E1 (2-14-1), (b) E7 (8-14-9), (c) E4 (4-14-3), (d) E5 (4-15-9), (e) E8 (8-15-1), (f) E3 (2-16-9), and (g) E9 (8-16-3). Micrographs show dispersed Mn-rich dark spots in E1 (2-14-1), based on high differences in the atomic weight of Mn, Zr and Y. Circles in E7 (8-14-9) and E4 (4-14-3) microstructures show links between Mn-precipitates and residual pores.
Ceramics 03 00031 g005
Figure 6. (a) Density vs. heating/cooling rate, sintering temperature and time, based on averaged results. Error bars show the lowest and highest results obtained at a given level of a specific factor; (b) Multivariate fitting of absolute density (closed symbols and primary axes) and relative density (open symbols and secondary axes).
Ceramics 03 00031 g006
Figure 7. (a) Dilatometry of representative samples fired at 1500 °C (E5 (4-15-9)) and 1600 °C (E3 (2-16-9)) and corresponding changes in the thermochemical expansion coefficient (right axis).; (b) Consecutive dilatometry scans of sample E7 (8-14-9), and corresponding thermochemical expansion coefficient (right axis) extracted from the second cycle. Arrows indicate heating or cooling steps.
Ceramics 03 00031 g007
Figure 8. (a) Averaged dependence of electrical conductivity at 700 °C on the rate of change in temperature, and sintering temperature and time.; (b) Multivariate fitting (Equation (3)) for the electrical conductivity at 700 °C. Fitting parameters are shown in Table 3.
Ceramics 03 00031 g008
Figure 9. Temperature dependence of electrical conductivity of samples E3 (2-16-9), E5 (4-15-9) and E8 (8-15-1).
Ceramics 03 00031 g009
Table 1. Taguchi planning of firing schedules and impact of heating/cooling rate (β), firing temperature (Tf) and firing time (tf) on experimental density, lattice parameter of cubic phase (ao), electrical conductivity at 700 °C and activation energy (Ea). The relative increase of activation energy at temperatures above 800 °C (ΔEa) is also shown.
Sampleβ (K/min)Tf (°C)tf (h)ρ (g/cm3)ao (Å)σ700 (S/m)Ea (eV)ΔEa (eV)
E1 (2-14-1)2140015.605.09400.780.690.00
E2 (2-15-3)2150035.495.08840.760.700.01
E3 (2-16-9)2160095.395.08930.660.710.04
E4 (4-14-3)4140035.505.09560.570.720.06
E5 (4-15-9)4150095.215.08950.490.790.28
E6 (4-16-1)4160015.295.08900.560.770.10
E7 (8-14-9)8140095.215.09430.540.720.09
E8 (8-15-1)8150015.415.09800.350.810.23
E9 (8-16-3)8160035.205.08920.550.690.01
Table 2. Correlation matrix between firing conditions and properties (density, lattice parameter of the cubic phase, electrical conductivity at 700 °C and activation energy) to screen the impact of heating cooling rate, firing temperature and firing time.
βTftfρao
ρ−0.61−0.43−0.49--
ao0.41−0.66−0.260.34-
σ700−0.75−0.13−0.070.55−0.42
Ea0.300.1−0.01−0.290.29
ΔEa0.30−0.010.25−0.380.25
Table 3. Multivariate fitting parameters (Equation (3)), and corresponding contributions of firing factors on lattice parameter, density, electrical conductivity at 700 °C and activation energy.
ao (Å)ρ (g/cm3)σ700 (S/m)Ea (eV)
R0.840.910.840.44
Yo1.621.50−0.70−0.191
log(1/β)b−0.000460.02980.31−0.04
ΔY−0.00320.220.25−0.04
1/Tfc17417983−291
ΔY0.00550.140.04−0.01
log(tf)e−0.00024−0.0140.020−0.009
ΔY−0.0027−0.160.020.01

