
Electrode Material Effect on the Flash Ignition in Soda-Lime Silicate Glass


1
Department of Industrial Engineering, University of Trento, Via Sommarive 9, 38123 Trento, Italy
2
INSTM, Trento Research UniTn, Via G. Giusti 9, 50121 Firenze, Italy
*
Authors to whom correspondence should be addressed.
Ceramics 2021, 4(1), 70-82; https://0-doi-org.brum.beds.ac.uk/10.3390/ceramics4010007
Submission received: 28 December 2020
/
Revised: 11 February 2021
/
Accepted: 19 February 2021
/
Published: 25 February 2021
Abstract
:The need for sustainable solutions to reduce the carbon footprint of the ceramics and glass industry leads towards the development of new electric current-assisted technologies. Flash sintering-like processes in glasses allow a reduction of the softening temperature and could pave the way for new shaping technologies. Herein, we investigated the flash transition in soda-lime silicate glass using two different electrode materials, silver, and platinum. The high dielectric strength registered on samples tested with platinum electrodes undergoes a significant reduction when silver is used. In other words, in the case of silver electrodes, the flash ignition takes place at a lower onset field. Moreover, the Joule heating developed during the process can be turned from being highly inhomogeneous with Pt electrodes to homogeneous when Ag electrodes are used.
1. Introduction
The development of sustainable processing technologies, driven by the interest to reduce energy consumption and the carbon footprint, is a fundamental challenge for the 21st-century industry. The use of electric currents and fields to induce internally generated heating by the Joule effect [1] has already been recognized as a powerful tool to facilitate material processing. Nowadays, electric current-assisted processes are well-established in the field of metals manufacturing [2,3], e.g., in the automotive industry [4], but they are still under investigation for ceramics and glasses [5,6,7,8,9]. Recent research activities have discovered the possibility to densify ceramic materials by flash sintering (FS) [10,11,12] in shorter times and at lower temperatures compared to common sintering techniques [11,13,14]. FS is based on the application of an electric field to a ceramic green body, typically in “warm” conditions (i.e., at temperatures well below those required for conventional sintering), resulting in sudden densification (a matter of seconds) of the component. During the “flash event”, three additional phenomena are observed: (i) a thermal runaway of the Joule heating takes place [15,16], (ii) the electrical resistivity drops, and (iii) a bright emission of light is observed [17,18,19]. Because of the transition from being insulator-like to conductor-like at the flash onset, the process is typically divided into three stages:
- -
- Stage I (or incubation): the material is resistive, a limited current flows, and the power source works in current control;
- -
- Stage II (or flash event): the material becomes electrically conductive, the electric current increases until it reaches the set limit, and most of the densification takes place; such a phenomenon is observed at an onset combination of an electric field and furnace temperature;
- -
- Stage III (or steady stage): the power source works in current control, marginal densification is observed, and the grains coarsen.
Since its discovery in 2010, flash sintering has attracted a relevant scientific and technical interest aimed at unraveling the sintering mechanisms [20,21,22,23,24,25,26,27] and at identifying possible hybrid technologies allowing its integration into existing spark plasma sintering [28,29,30] and microwave equipment [31]. On the other hand, numerous research activities have pointed to the identification of the FS conditions for ceramics, which possess very different electrical properties from electronic conductors [32,33] to ionic conductors [13,14,15,16,17,18,19,20,21,22,23,24,25,26,27,28,29,30,31,32,33,34,35], and from composites [36] to semiconductors [37,38]. A phenomenon similar to FS was discovered in bulk alkali-containing silicate glasses subjected to the application of an external electric field [39,40,41,42,43]. The results were a drop in the glass resistivity and a reduction of the softening temperature. For this reason, the process was named electric field-induced softening (EFIS) [39,40,41,42,43]. However, the process carried out in a direct current (DC) led to highly inhomogeneous Joule heating because of the charge carriers’ displacement (Na+) toward the sample cathode (−) [41,43]. The formation of an alkali-depleted layer at the anode (+) caused a local increase in the electric field and a concentration of the electric power dissipation.
Recent studies on FS have shown the influence of electrodes’ material on the flash event [44,45,46]. The effect of the electrode material on the FS behavior of α-alumina was analyzed by Caliman et al. [45]. They found that platinum electrodes behaved as blockers of the ionic current, rendering FS inefficient. Instead, silver electrodes allowed a sufficient electrochemical transfer for the flash event to occur [45]. More recently, it has been shown that the use of conductive pastes at the Pt wires/ceramic interface allows one to change the flash sintering behavior of oxygen ion conductors (i.e., yttria-stabilized zirconia) [44,46]. Besides, the possibility to tune the Joule heating in soda-lime silicate glasses by changing the electrodes has been demonstrated: if a molten NaNO3 bath is used as an anode, a homogeneous Joule heating profile develops, whereas Pt electrodes cause the localized overheating of the anodic region [47]. Starting from these results, in the present work we aimed to understand whether the choice of the electrode could alter the flash onset conditions of soda lime silicate glass. To achieve this goal, the FS onset conditions of glass samples were studied using silver and platinum electrodes.
2. Materials and Methods
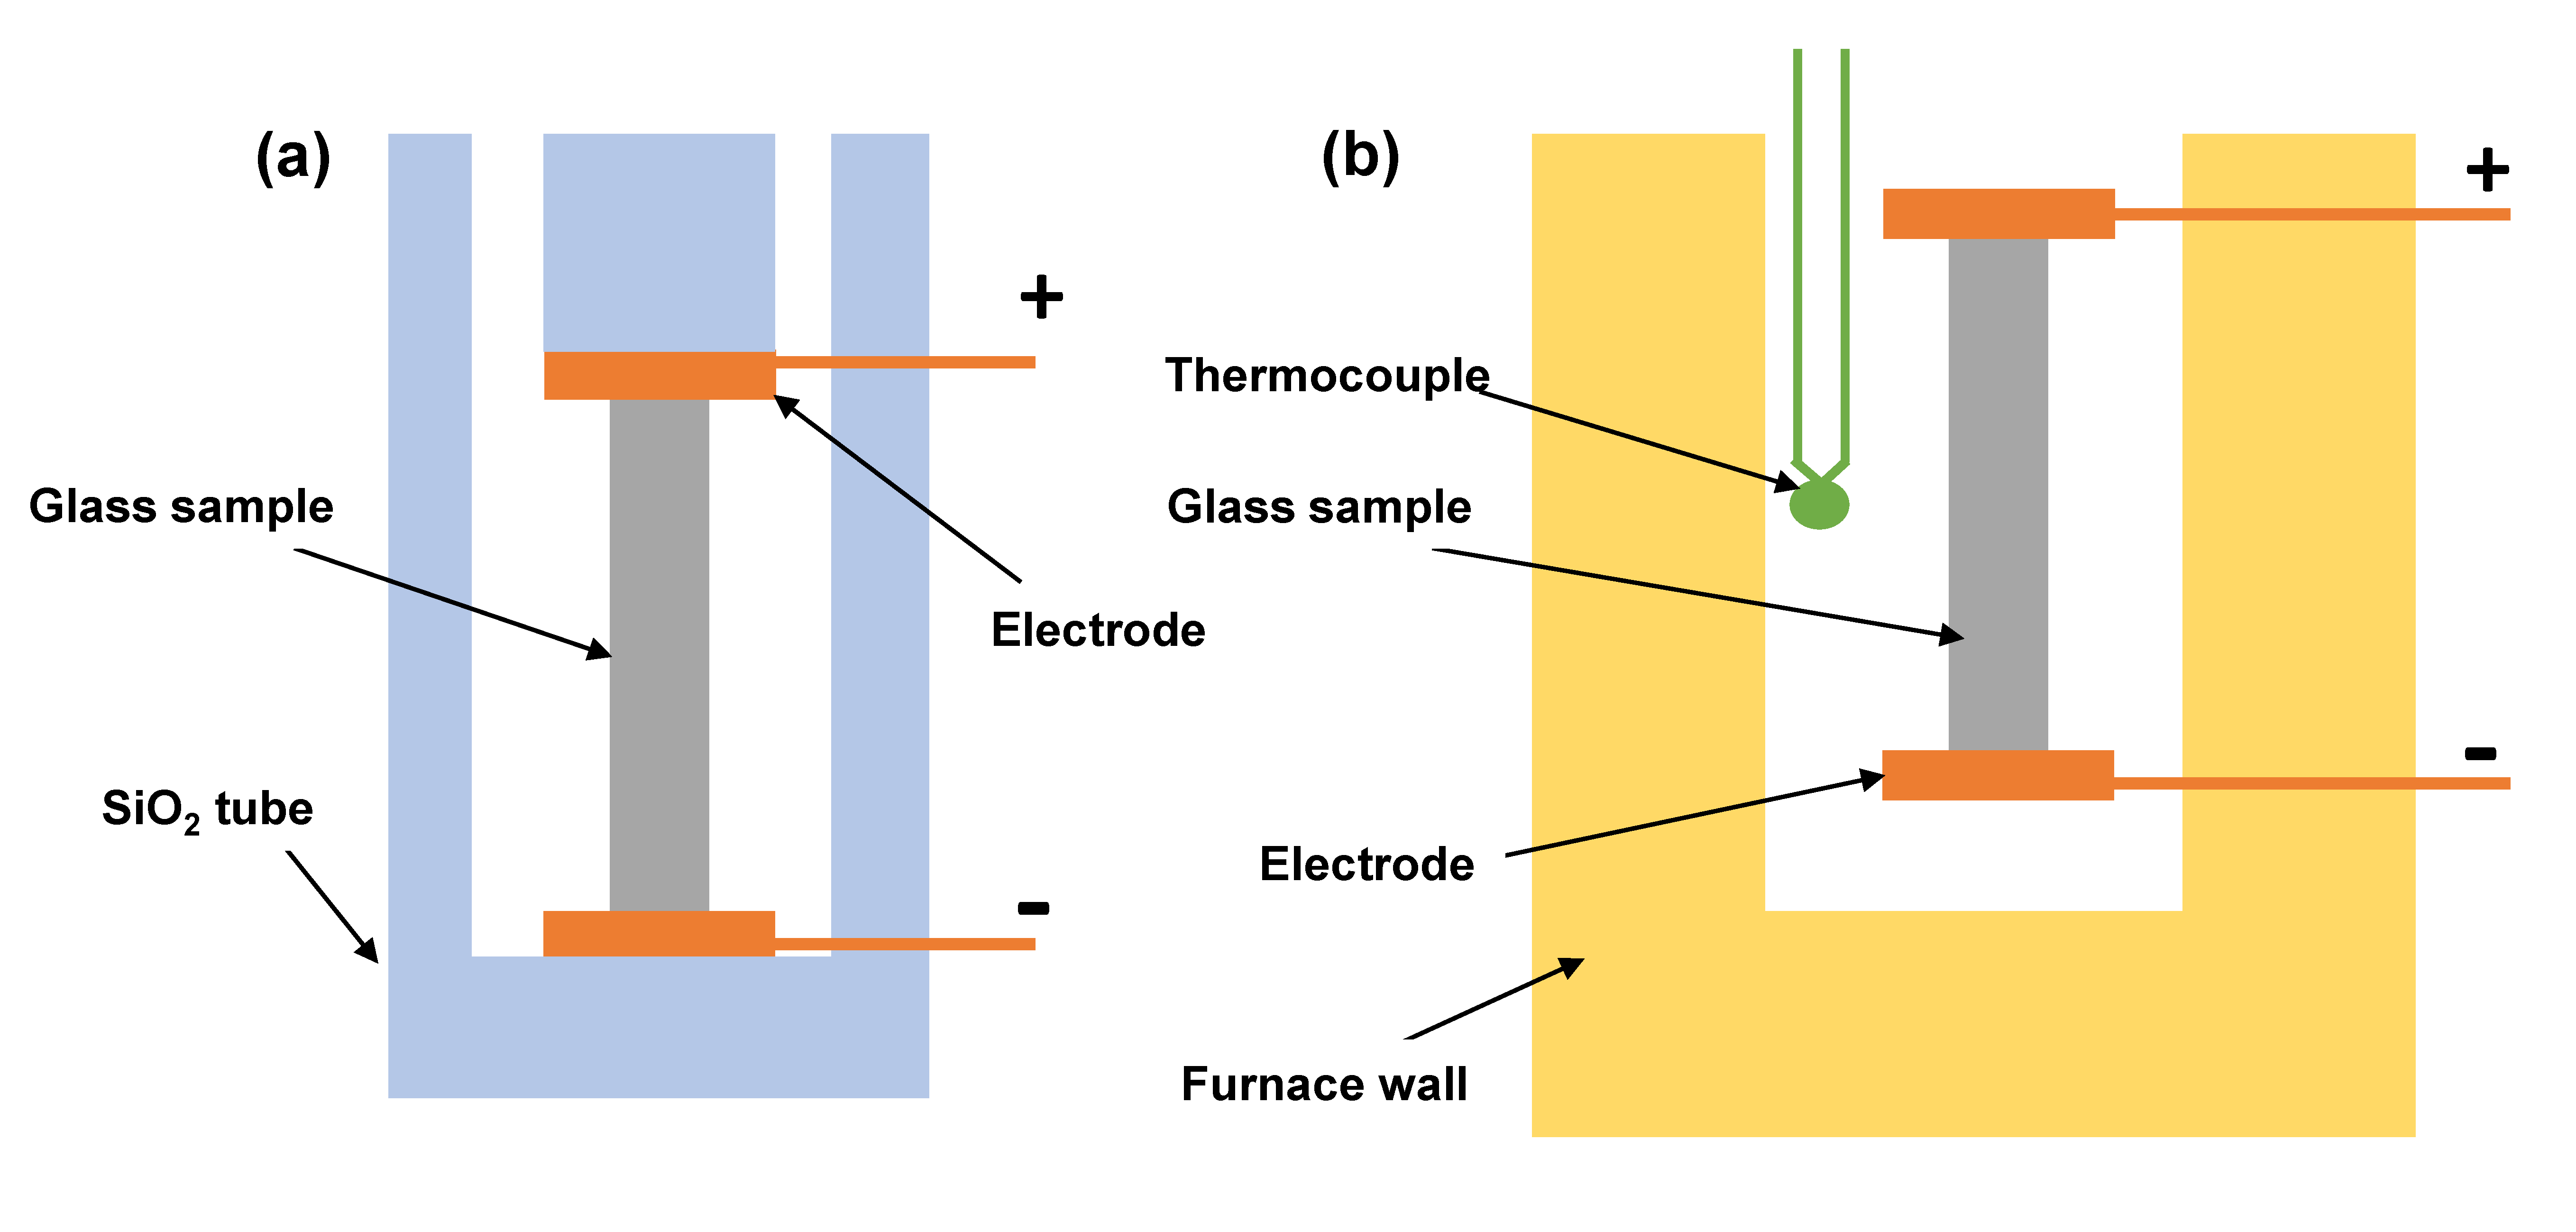
Specimens (20 × 4 × 4 mm3) were cut from a glass sheet of commercial soda-lime silicate float glass with the following composition (wt%): 71.4 SiO2; 1.0 Al2O3; 13.9 Na2O; 0.3 K2O; 4.1 MgO; 9.1 CaO; and 0.2 others. The glass transition temperature was evaluated in previous work by the dilatometric method and resulted in being 568 °C. The electrodes were painted on the squared faces (4 × 4 mm2) using platinum paste (C60903P5, Gwent Chemicals, Pontypool, UK) and silver paste (DW-250H-5, Toyobo, Osaka, Japan). Two different electrode configurations were adopted: (a) both surfaces painted with Ag paste (Ag configuration in the following); (b) both surfaces painted with Pt paste (Pt configuration in the following). The samples were placed in a fused silica tube used as a sample holder, and the painted surfaces were placed in contact with two Pt disks with a diameter of about 9 mm (Figure 1a). The sample holder was placed within a furnace (Figure 1b) (Nabertherm HT16/16, Carbolite Gero, Hope, UK), and the Pt disks were connected to a power supply (Glassman EW series 5 kV-120 mA, Glassman, Hauppauge, NY, USA). The specimens were heated up, and the temperature close to the glass bars was checked with a K-thermocouple placed near the sample holder. The experiments were performed for each electrode configuration at three furnace temperatures: 450 °C, 490 °C, and 550 °C.
An increasing DC voltage was applied by the power supply. Voltage and current data were collected using a digital multimeter (Keithley-2100, Keithley, Solon, OH, USA) (acquisition frequency = 1 Hz). The power supply was turned on 5 min after the furnace reached the required temperature, allowing homogeneous and complete heating of the glass. The initial DC voltage was zero; then, it was increased by 100 V (50 V cm−1) every 60 s (step-like function), until the flash was observed.
The sample temperature evolution during the process was estimated while accounting for the power generated by the Joule effect:
the power loss caused by radiation:
and the convection:
where V is the applied voltage, I the flowing current, σ the Stefan–Boltzmann constant, S the surface of the sample exposed to the environment and available for heat exchange, ε the glass emissivity (ε = 0.97) and h the convective heat transfer coefficient (in this case, h ranges between 1.79 and 11.43 W m−2 K−1, and it is a function of the sample temperature). The h coefficient has been calculated following the procedures reported in Perry’s Chemical Engineer Handbook [48]. Ts is the absolute temperature of the sample, while Tf is the absolute temperature of the furnace. Convection was assumed to be natural, and no motion of the fluid was forced. The sample temperature was considered to be homogeneous, neglecting the formation of localized hot spots, as evidenced in other studies [47]. The variation of the sample temperature as a function of time can be evaluated as:
where ∂Tsi is the temperature differential of the sample, cp is the specific heat of soda lime silicate glass (cp = 0.84 J g−1 K−1), and m is the mass of the sample.
Some additional experiments were carried out outside the furnace to record the flash event with a camera CANON EOS-750D and a thermo-camera FLIRT-T62101. In this case, the glass samples were initially heated up with a thermal gun at around 400 °C, and then the power supply was turned on and the multimeter registered the voltage and current data as in the experiments performed within the furnace. Here, the power supply was working under current control during the entire experiment, this meaning that it was forcing a certain selected current to flow in the circuit. Four current densities were applied to the samples: 0.3, 0.7, 2, and 4 mA mm−2.
Scanning electron microscopy (SEM, Jeol JSM5500) observations and energy-dispersive X-ray spectroscopy (EDXS) microanalyses were carried out after the experiments.
3. Results
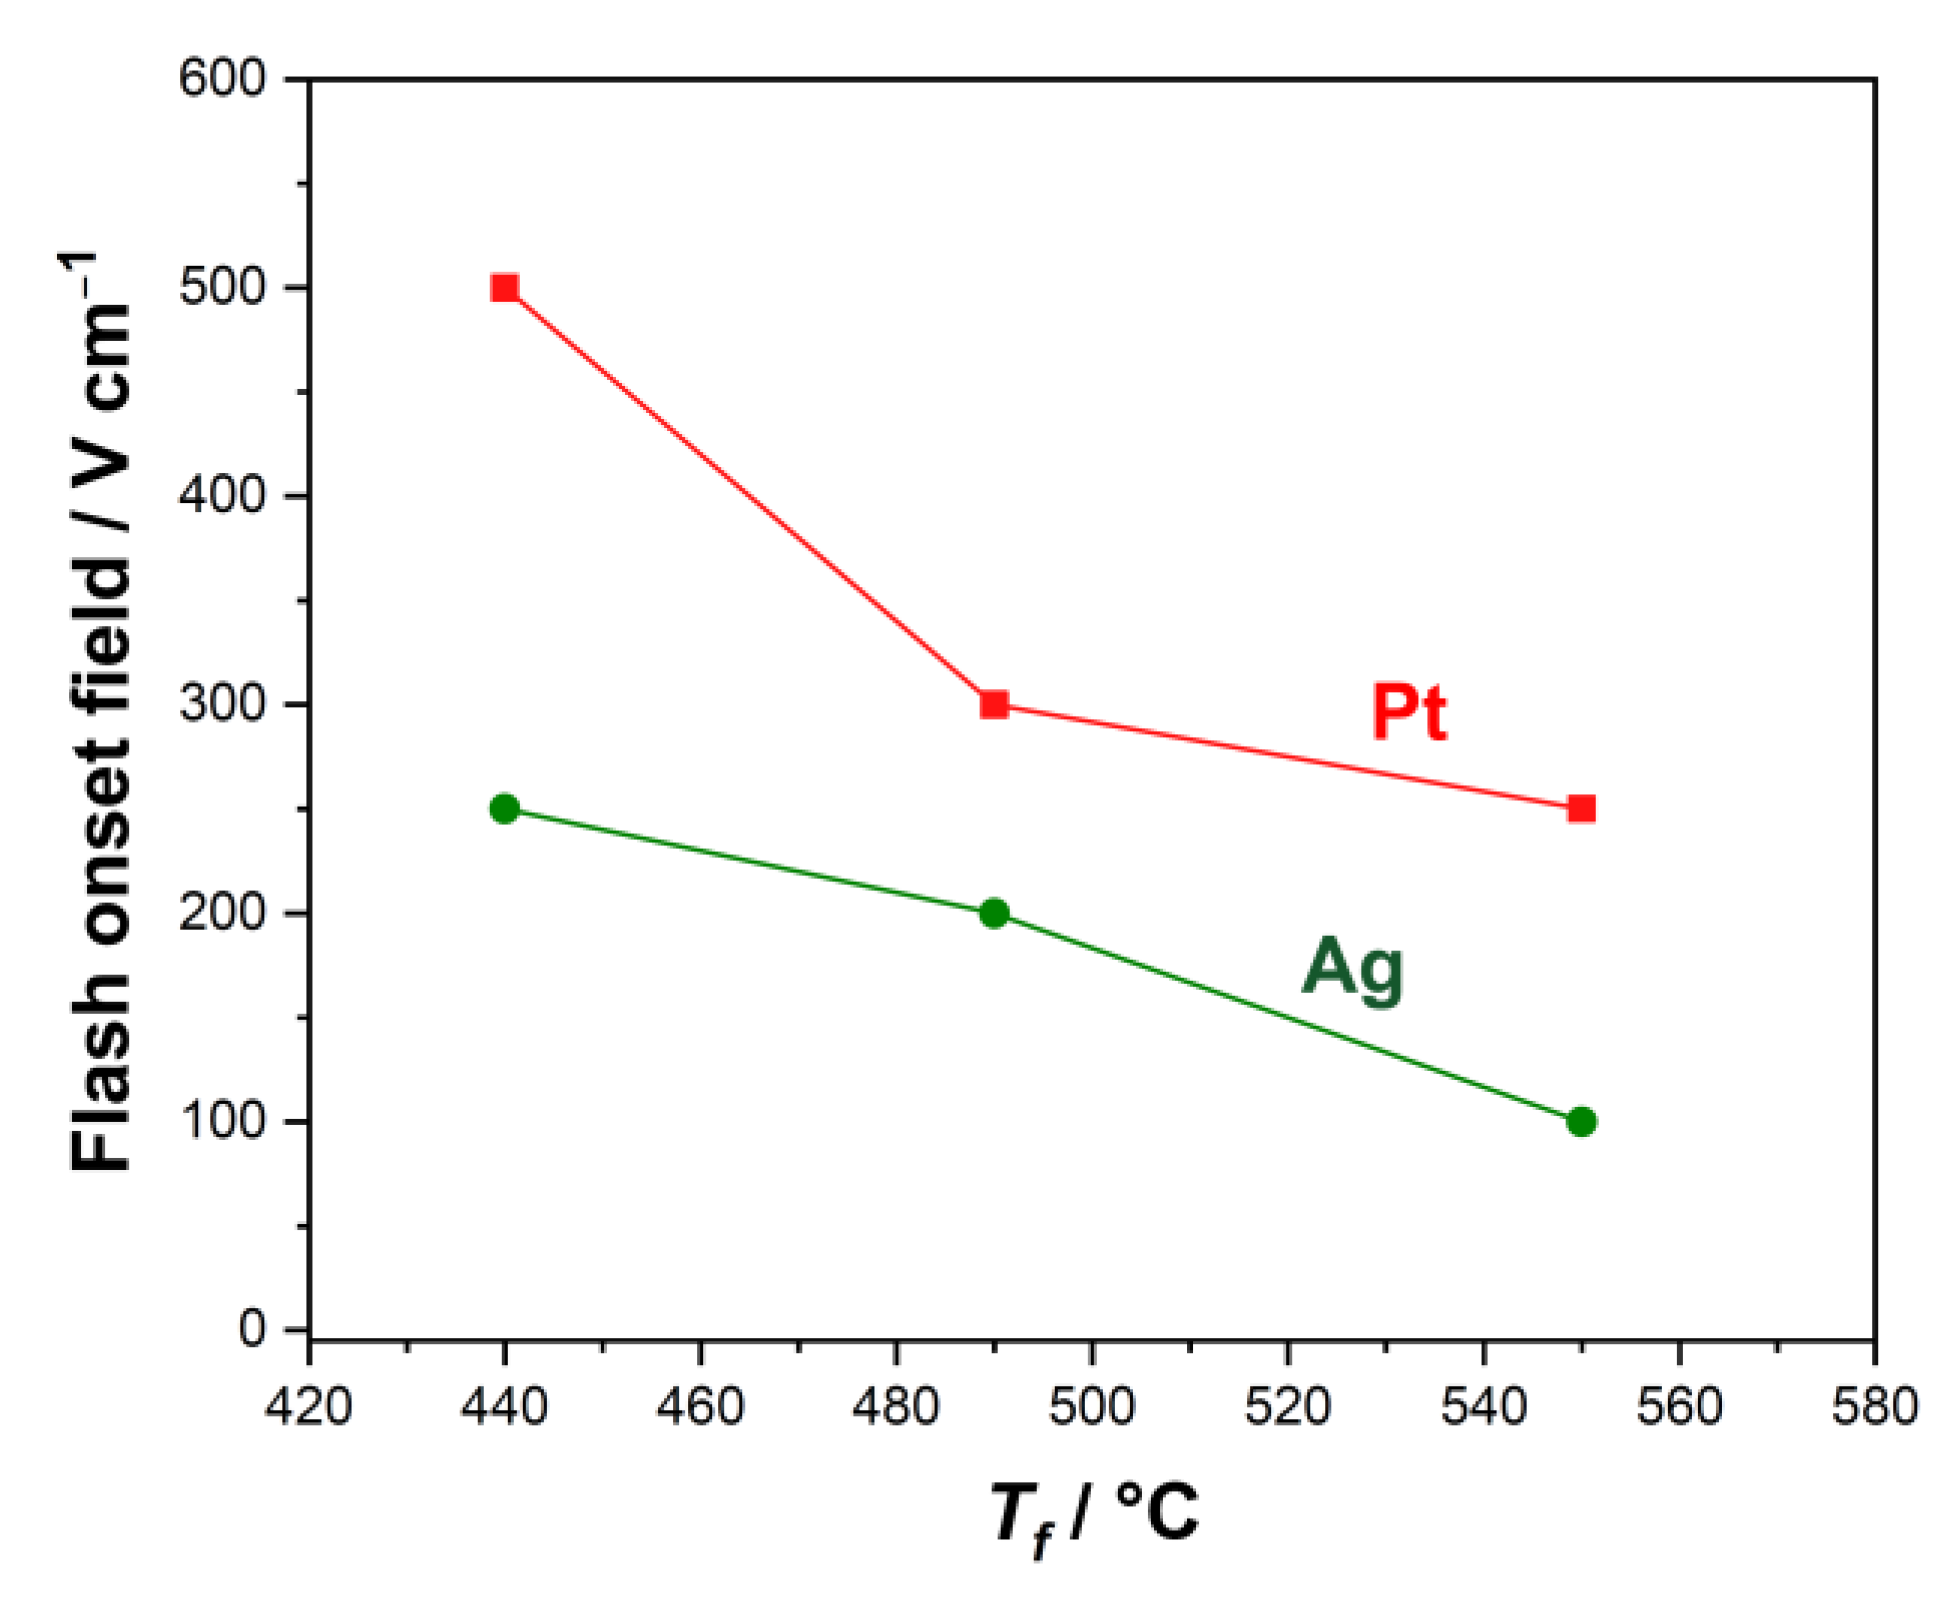
Figure 2 shows the electric data recorded during the flash experiments carried out at 450 °C, 490 °C and 550 °C with the two different electrodes (Pt, Figure 2a–c, and Ag, Figure 2d–f) configurations. The electric field was increased stepwise by 50 V cm−1 every 60 s. The last step reported for each configuration corresponds to the electric field at which the current sharply increased because of the flash transition. The calculated onset field for the flash event is reported in Figure 3. One can observe that the lower the furnace temperature, the higher the electric field needed to activate the flash transition. This is related to the fact that conduction in glasses is a thermally activated phenomenon that is enhanced at a high temperature, and the present findings are in substantial agreement with previous results obtained for different ceramic systems under FS [12]. More interestingly, the results in Figure 2 and Figure 3 point out three additional outcomes:
- The flash onset field is doubled when Pt electrodes are used;
- At the same temperature, samples with Ag electrodes are characterized by a higher conductivity (i.e., the electric current in Ag-plated samples is much larger than that in Pt-plated ones before the flash);
- A nonlinear conductivity trend is detected: the electric current sharply increases when an onset electric field is applied (Figure 2), this rise in the electric current being sharper when Pt electrodes are considered.
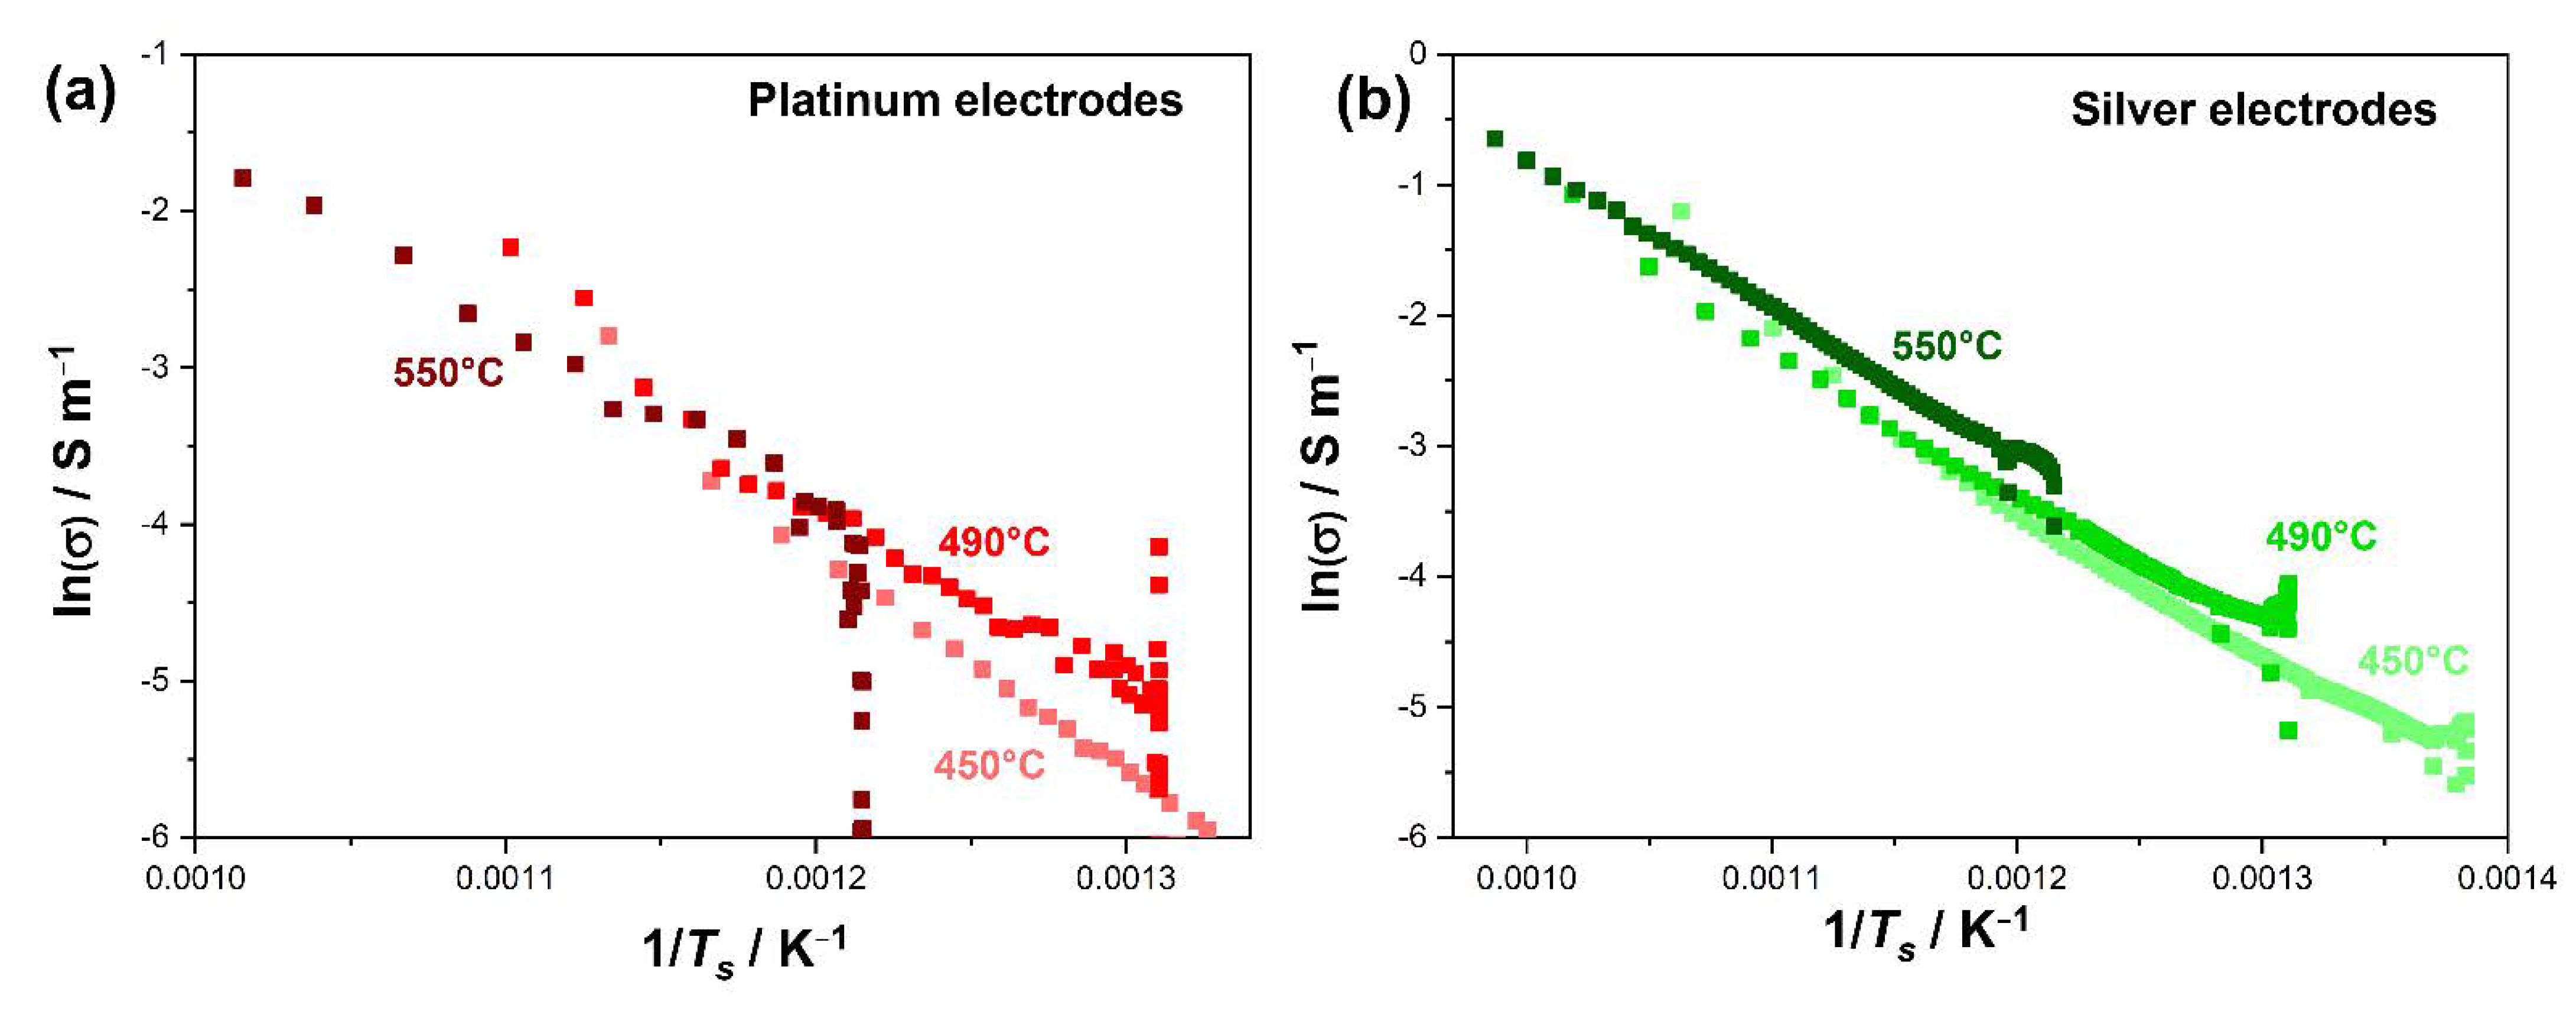
The logarithm of the glass conductivity during the experiments is reported in Figure 4 as a function of the inverse of the sample temperature in the case of platinum and silver electrodes (Figure 4). The sample temperature was estimated by integrating Equation (4). From the slopes of the plots in Figure 4, the activation energy for conduction was calculated. It resulted in a range of 0.94–0.98 eV and 1.03–1.21 eV when Ag and Pt electrodes were considered, respectively.
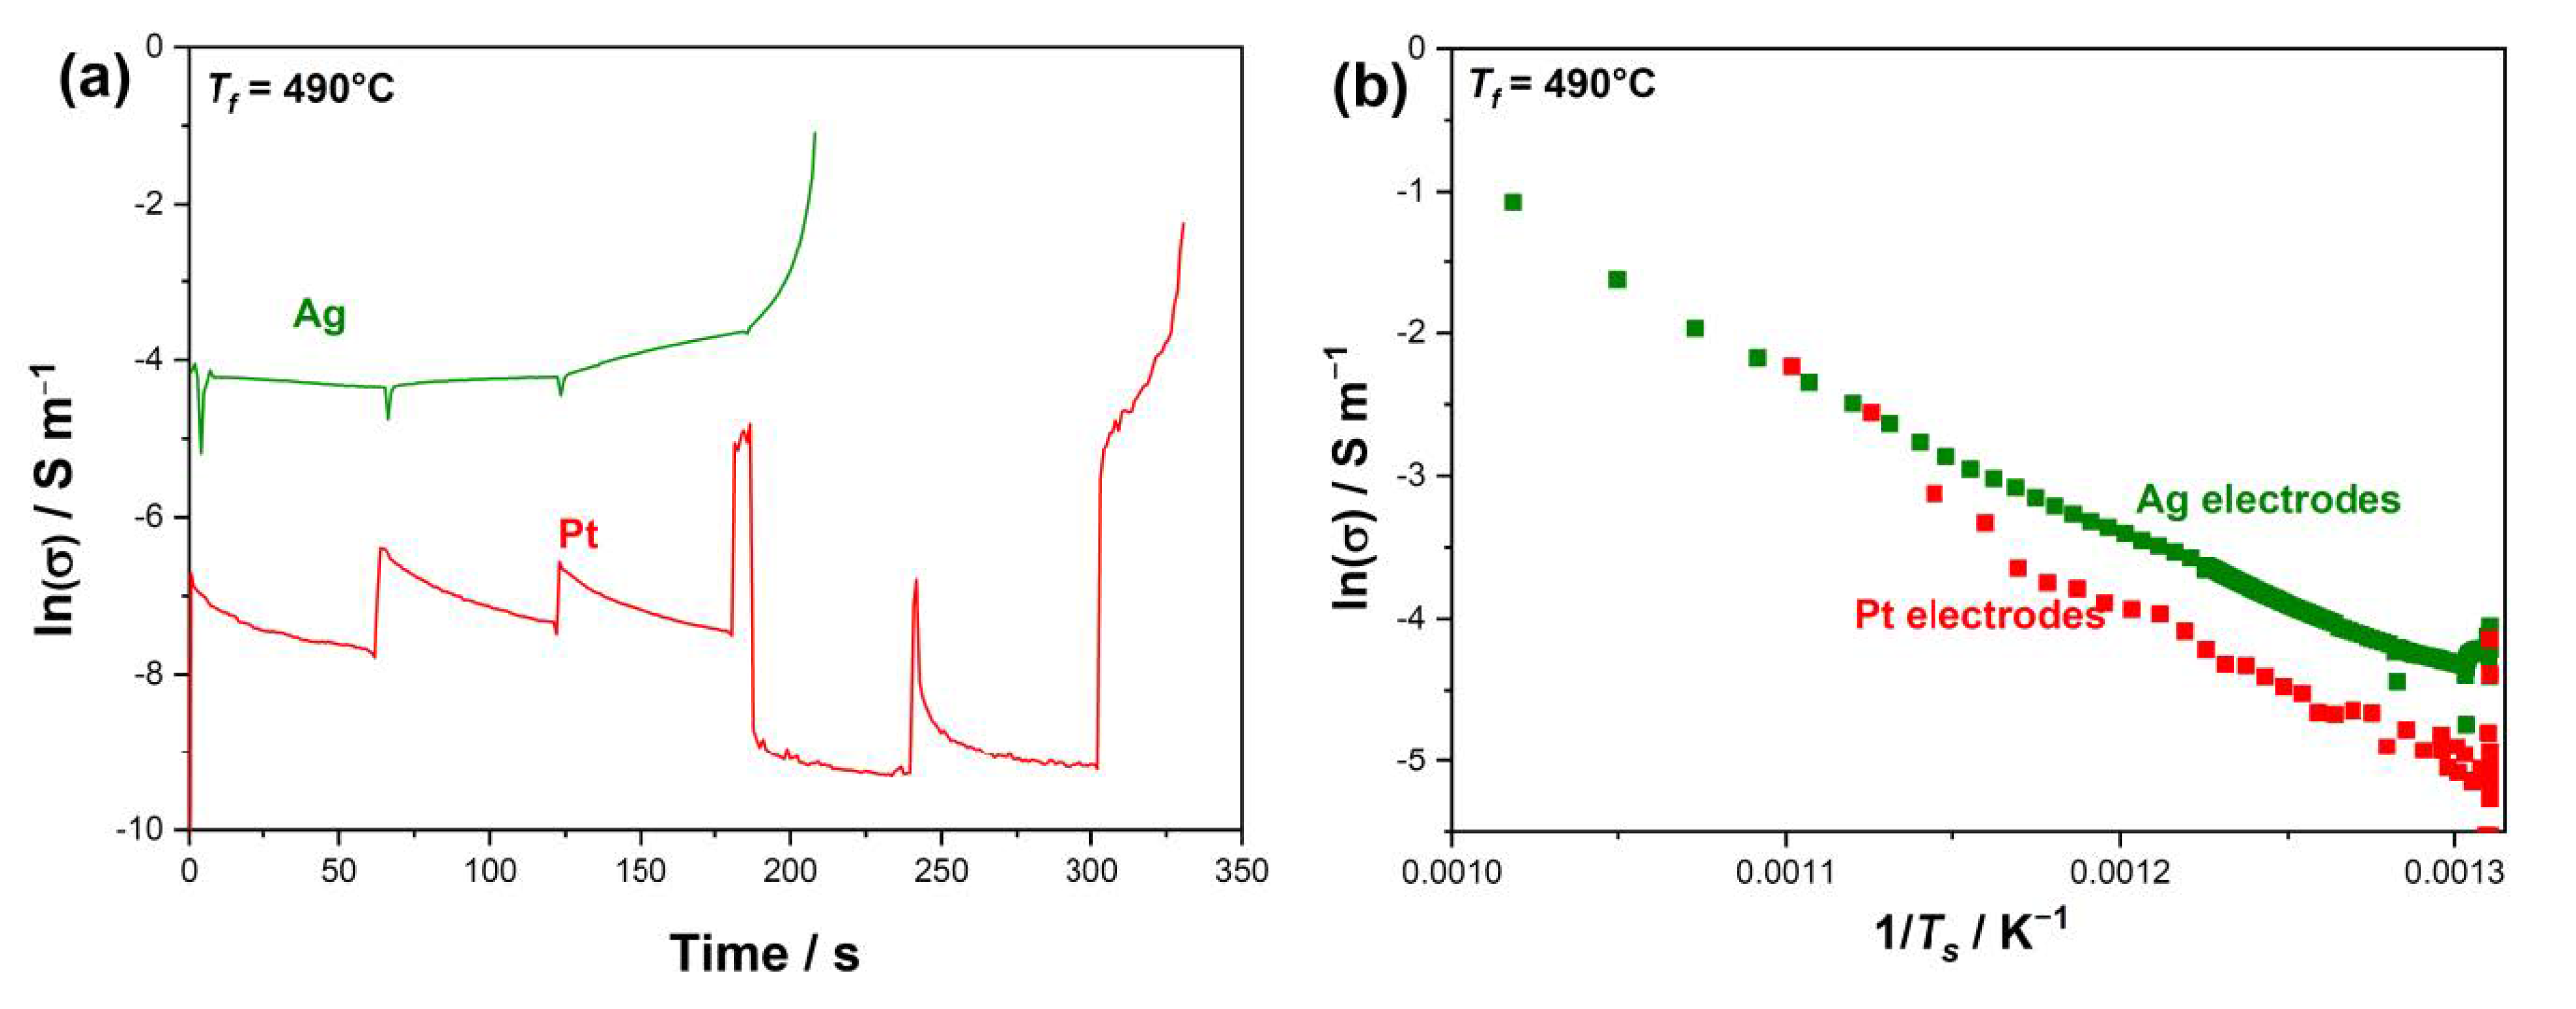
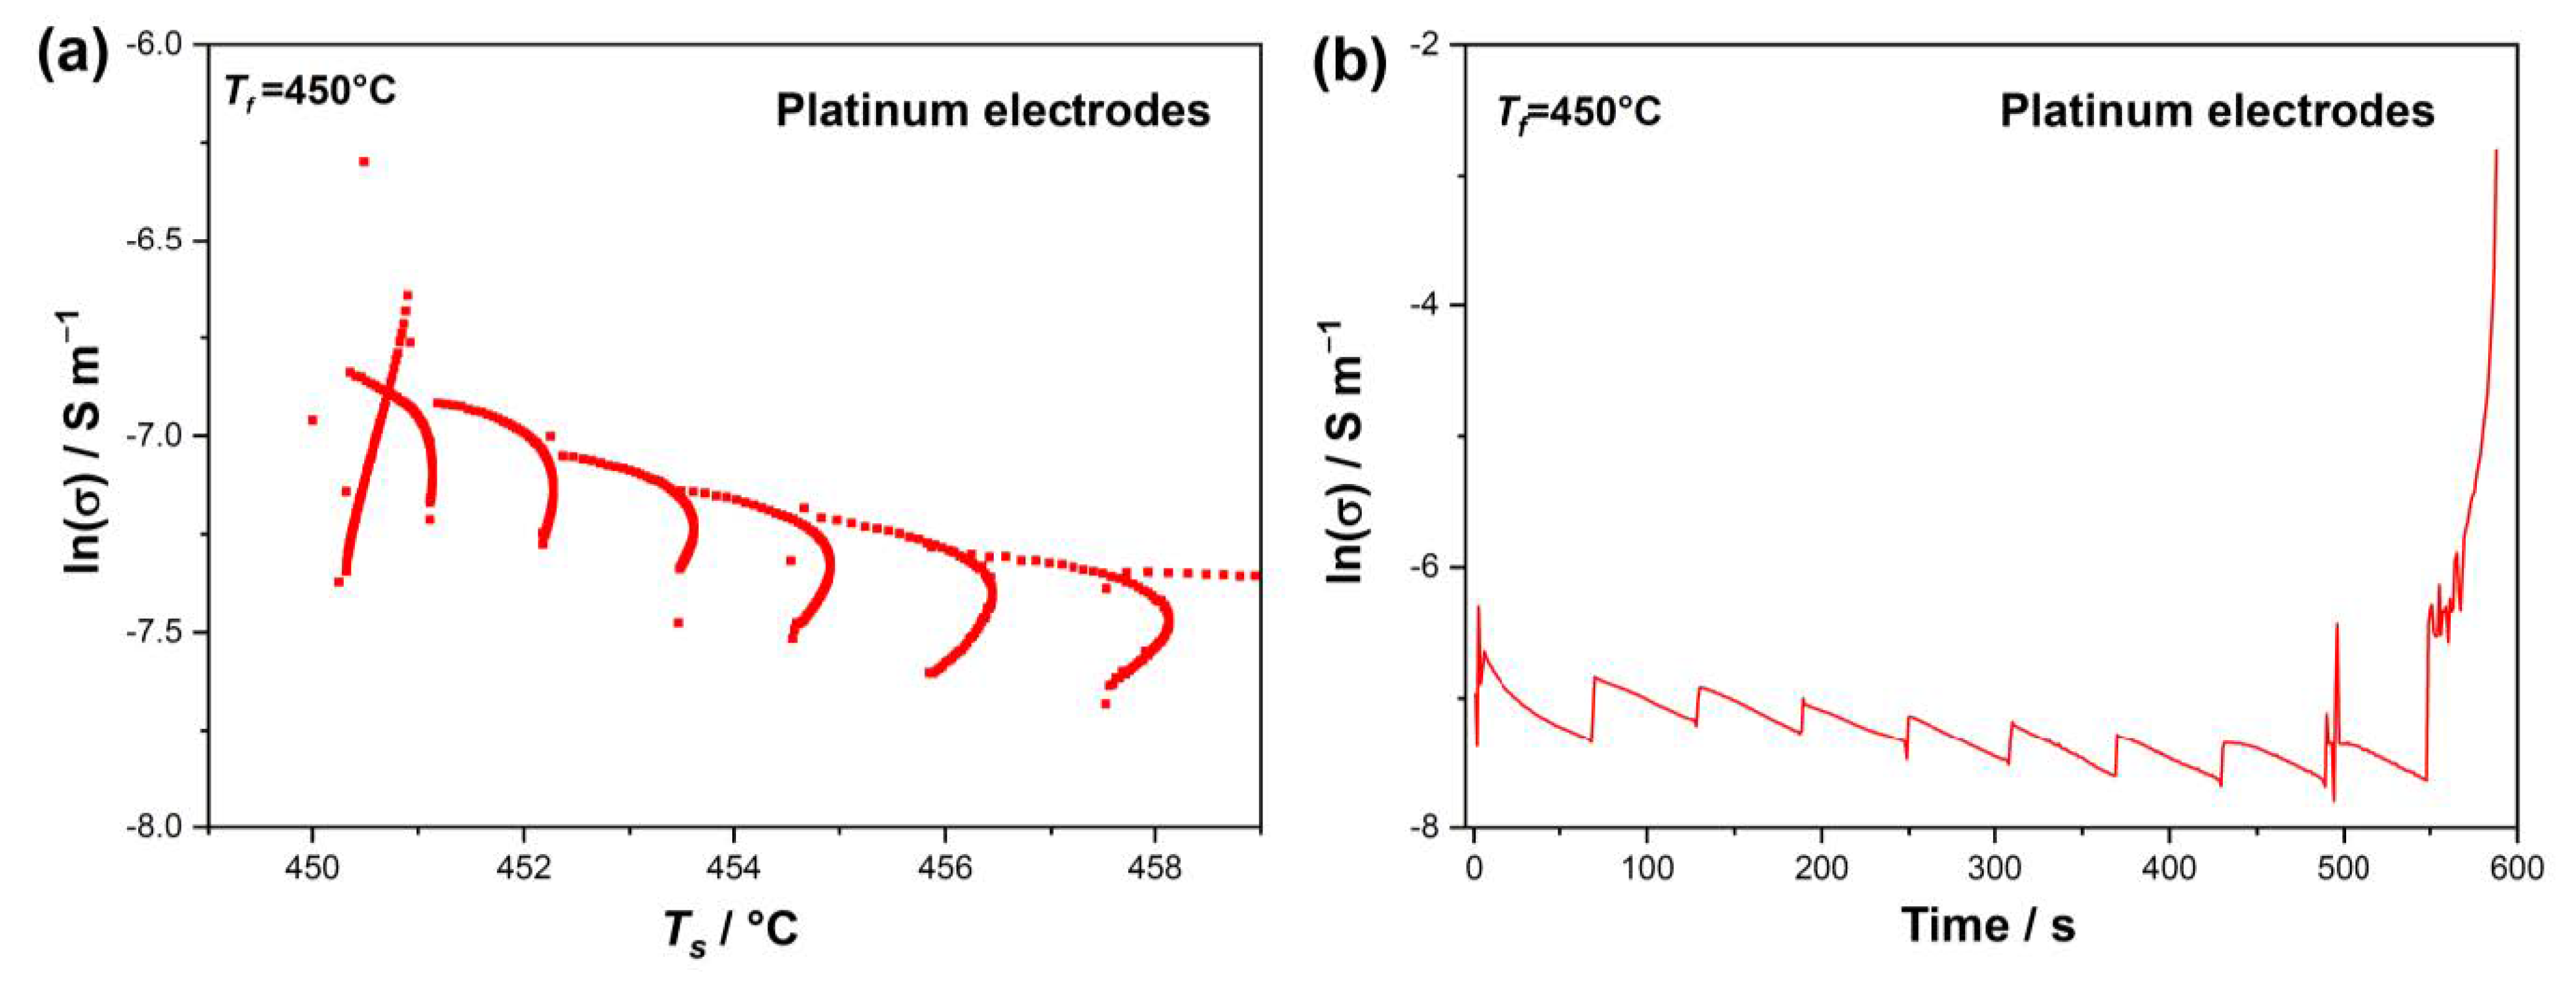
Figure 5a shows the conductivity evolution, in a logarithmic scale, for samples processed at Tf = 490 °C. A sawtooth-like plot is obtained as a function of time in the case of the Pt-plated samples. Every 60 s, the voltage was manually increased and the conductivity underwent a sharp increase and then decreased at a constant voltage step. Similar phenomena can also be recognized in the Pt-plated samples treated at 450 °C (Figure 6b) and 550 °C. The conductivity increase at the voltage steps does not appear as a thermally activated effect since the estimated sample temperature increased only by 8 °C during the voltage steps (Figure 6a). Conversely, during the flash incubation, the electrical conductivity seems to decline during the process despite the sample temperature increasing (due to the progressive increase of the applied voltage). This phenomenon is visible in the case of Pt electrodes and cannot be observed when Ag electrodes are employed. The Ag configuration showed a smoother trend, as reported in Figure 4a, and the conductivity remained almost constant until the flash was ignited. Moreover, the electrical conductivity was larger in the case of Ag electrodes (Figure 5).
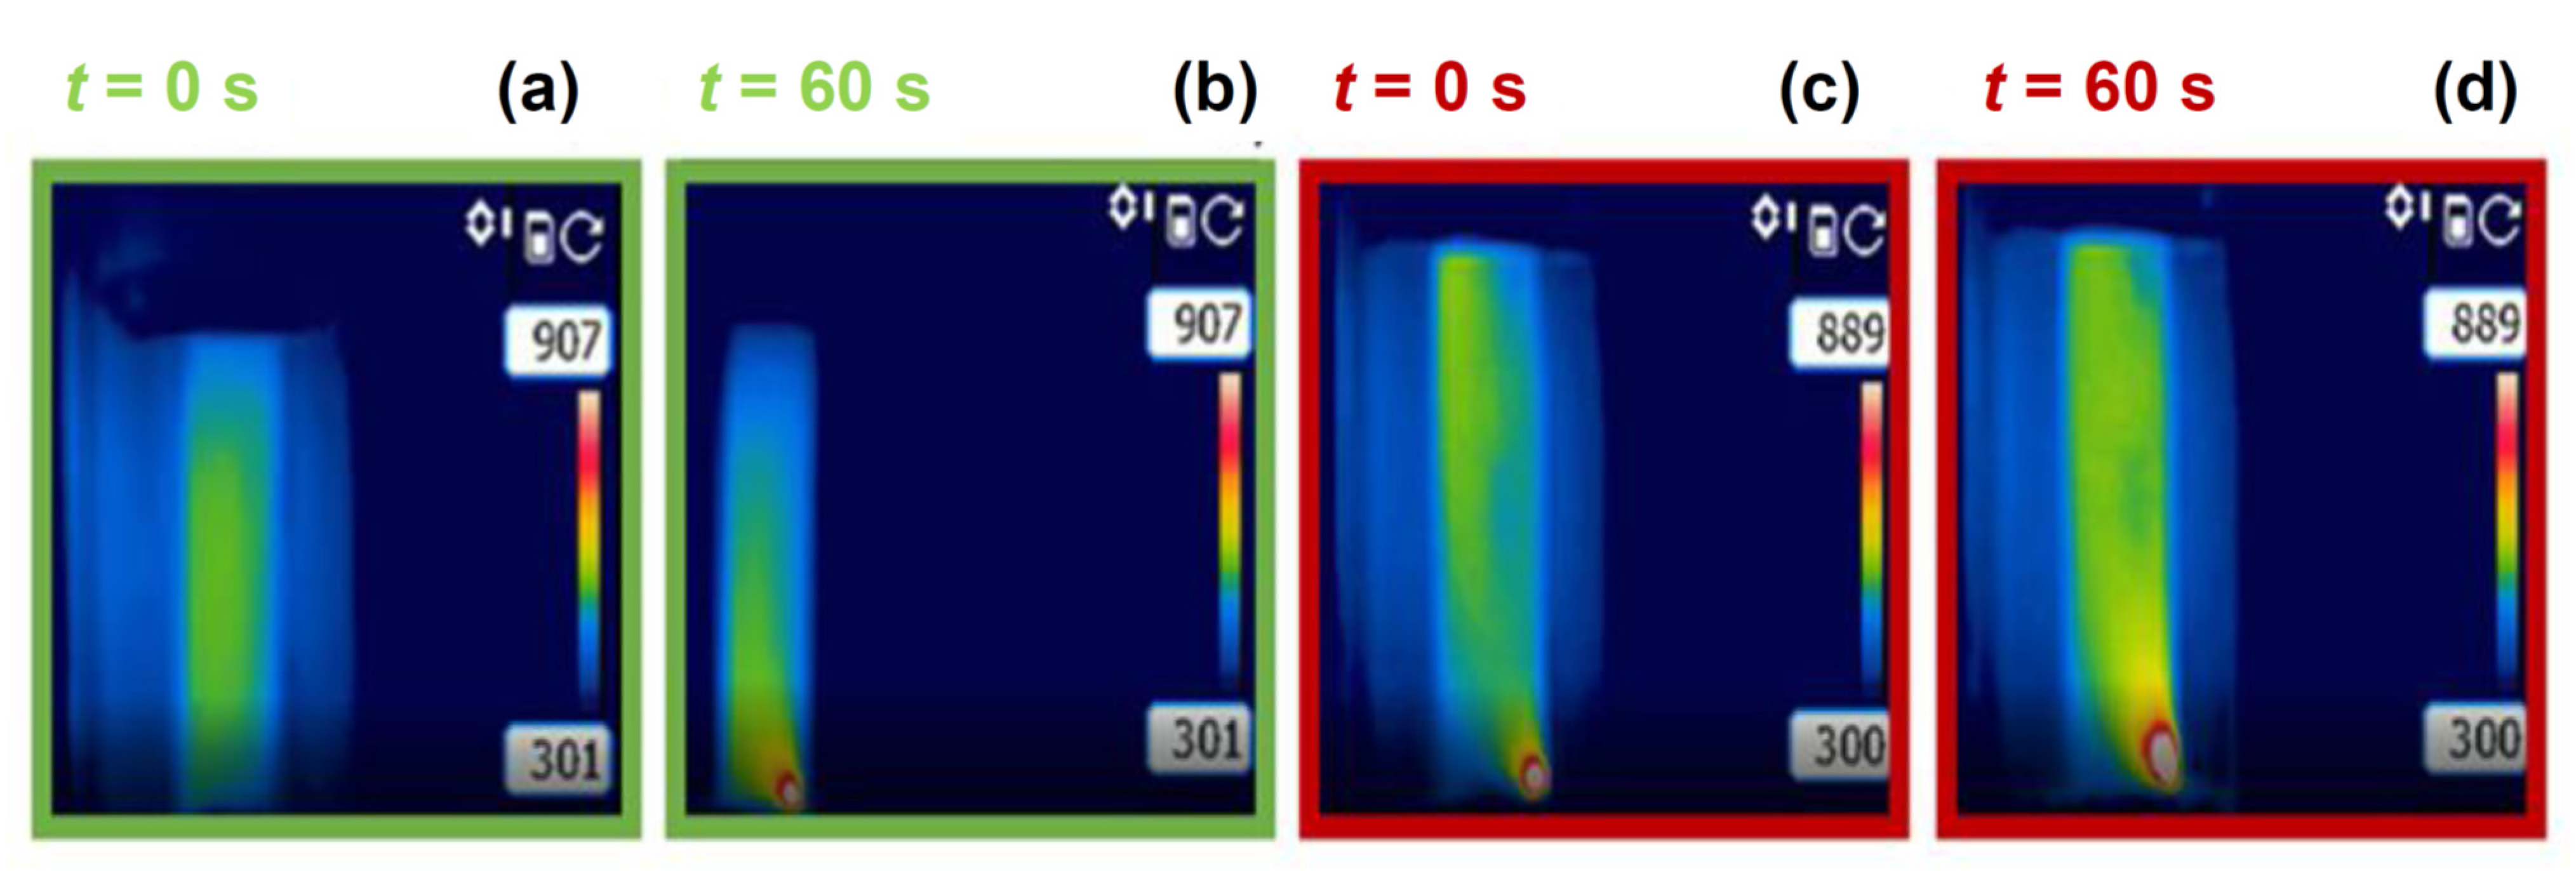
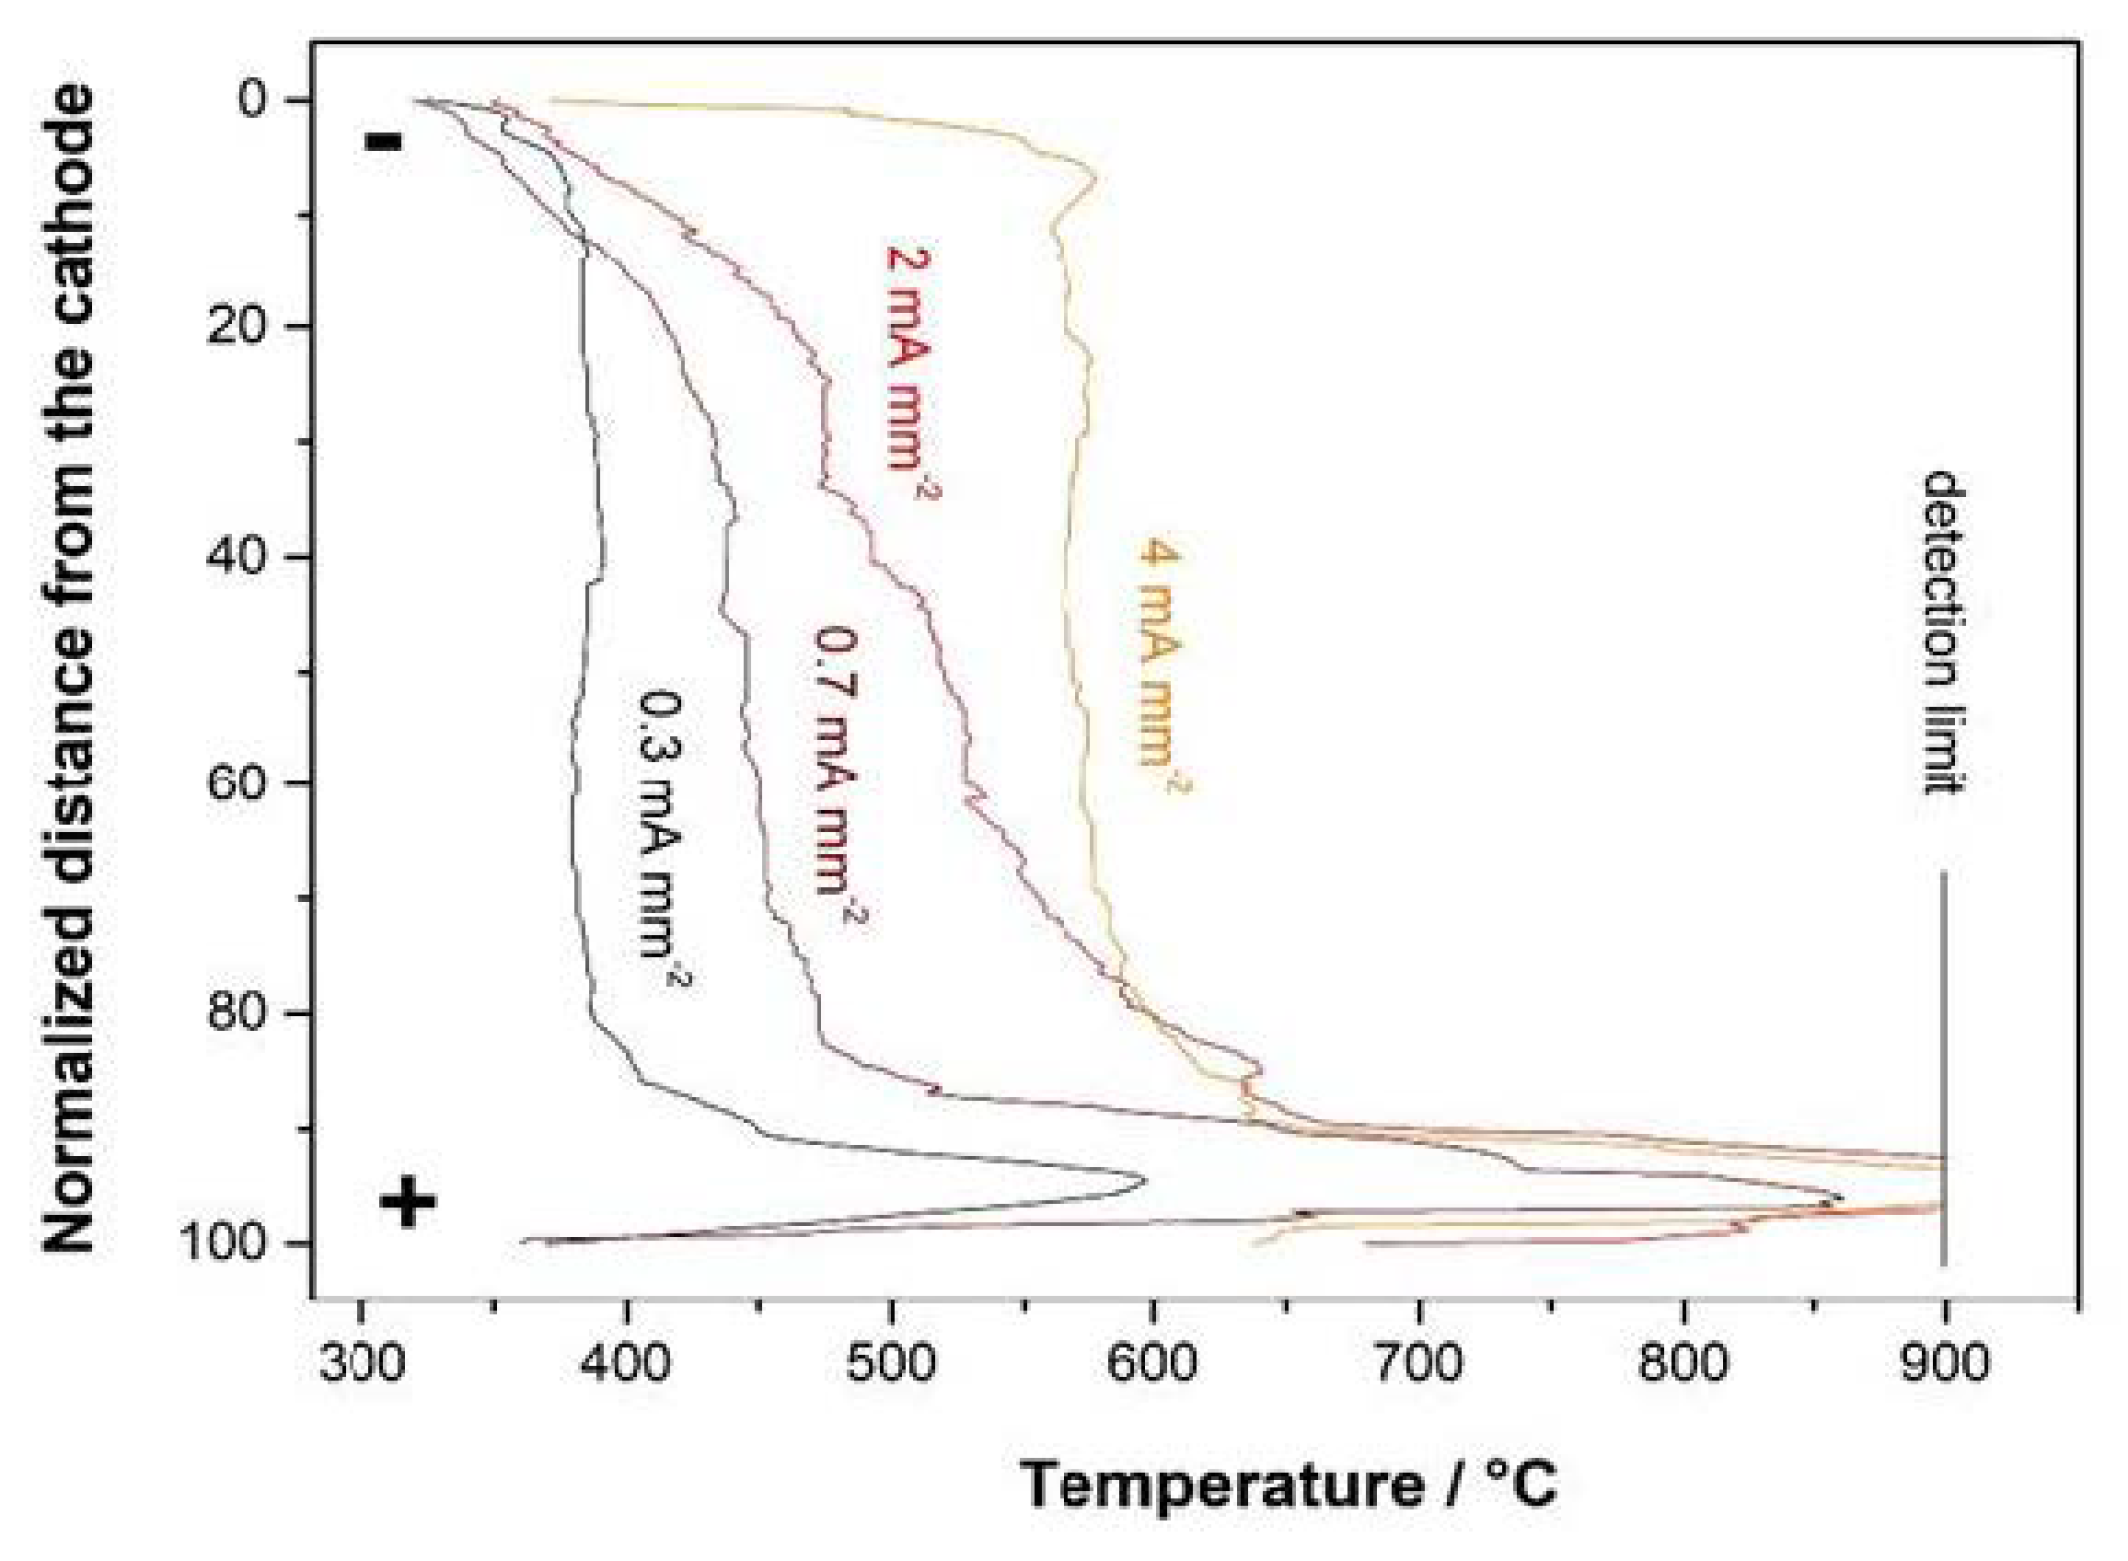
To observe the effect of the different electrode configurations on flash Stage III, out-of-furnace experiments were carried out and recorded by a digital camera and a thermal camera. Figure 7 and Figure 8 show some video stills of the sample treated with 2 mA mm−2. Ag-plated samples were characterized by homogeneous heating in the first part of the experiments, with no visible glowing. Nevertheless, about 1 min after the electric current started to flow, a bright glowing originating from the anodic region (+) was observed, as shown in Figure 8 and Figure 9 (the detection limit reported in Figure 9 is the maximum temperature that the thermal camera can detect). This was associated with localized anodic overheating, which is well visible in the thermal camera images (Figure 8). On the other hand, the glowing in the Pt samples appeared just after the application of the current. This behavior was confirmed for all the applied current densities, as reported in Figure 10, where the anodic hot spot incubation time is plotted against the applied current density.
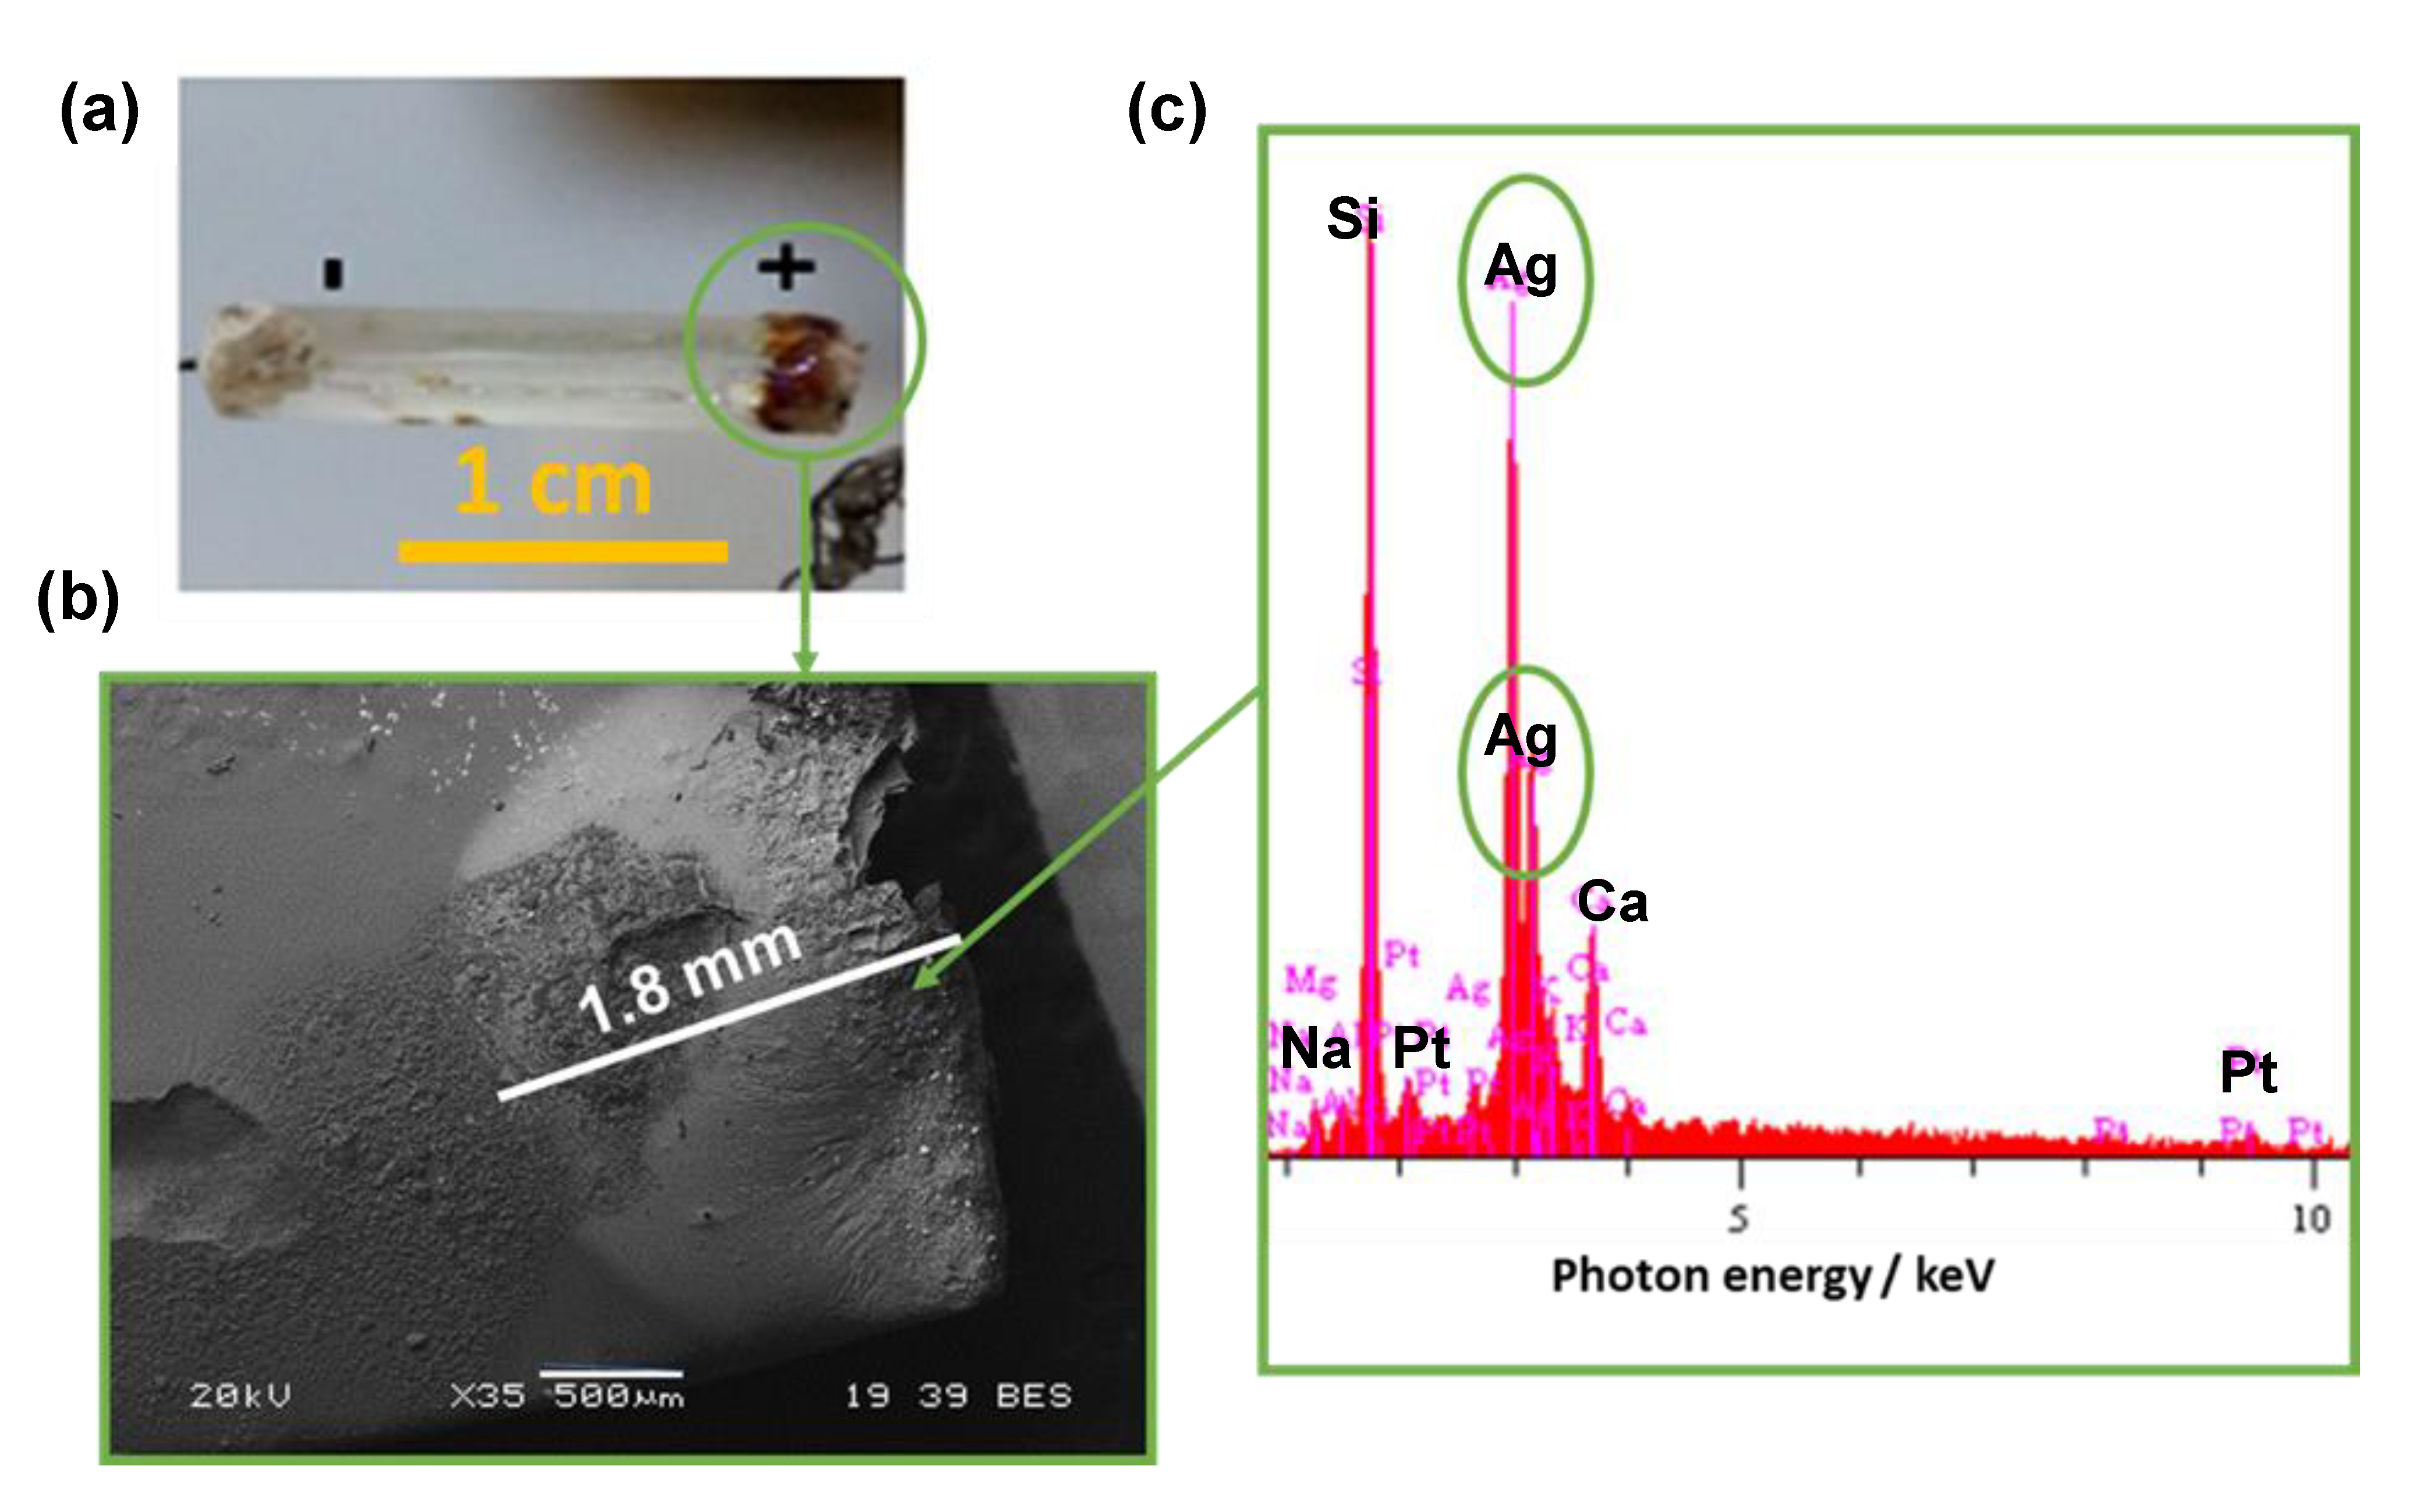
The samples with Ag electrodes showed a clear chromatic alteration in the anodic region, which became brownish after the treatment (Figure 11a). The SEM micrographs (in backscattered electron mode) and EDXS analysis point out that the brownish region contains a relevant amount of silver (Figure 11b,c).
4. Discussion
The results point out the complex behavior of the electric properties of soda lime silicate glass during flash processes. The flash behavior appears dependent not only on the composition, field, current and temperature but also on the electrode material. The flash onset changes with the electrode configuration, as shown in Figure 2 and Figure 3, and the flash transition requires a higher field to be ignited in Pt-plated samples.
The variations in terms of the flash onset conditions are strongly bonded by the differences measured in the electrical properties, where the samples treated with Ag electrodes appear more conductive (Figure 5). The result is consistent with the literature on FS since it is well known that the higher the electrical conductivity, the lower the flash onset field [12]. These results could be of broader interest as glass is one of the most commonly used electrical insulators. It is clear that the insulating properties of glass change with the applied electrode. In other words, the dielectric strength of glass at a high temperature strongly depends on the electrode material.
The estimated activation energies for conductivity are slightly larger than those expected from the literature. The activation energy for Na+ diffusion in soda-lime-silica glass should be around 0.72 eV according to the theory of Anderson and Stuart [49]. Other studies proposed values of activation energy for sodium migration in alkali-based glasses between 0.6 and 1.1 eV [50,51]. The present results, ≈1 eV, lay in the upper part of this range but appear not completely unreasonable, especially for Ag-plated samples (0.94–0.98 eV). Larger activation energy was calculated for Pt-plated samples (1.03–1.21 eV), but this reflects a limitation due to the inhomogeneous temperature profile (Figure 7 and Figure 8). In other words, the activation energy measured with Pt electrodes is only an “apparent” value as the temperature distribution and the conductivity are not homogeneous throughout the sample length.
Differences between the two electrode configurations can also be observed in Stage III of FS: in the case of Pt electrodes, Joule heating is inhomogeneous, whereas it is homogeneous (at least for the first part of the process) when Ag electrodes are used.
The mechanism behind the observed behavior is related to the different blocking properties of the two electrodes against the ionic current. Pt is substantially a cation blocking electrode, and an alkali depletion layer develops in the anodic region. There, the electrical resistivity increases, causing a local growth of the electric power dissipation. This has already been extensively documented in the literature [41,43,47]. However, herein we show for the first time that this also has a strong effect in impeding the flash transition. In fact, the growth of the alkali depletion layer at the anode (+) causes an increase in the overall resistance of the system. For this reason, the electrical resistivity in Figure 5 and Figure 6 tends to decrease in the constant-voltage step. On the other hand, when the voltage is increased (step-like), the electric field in the alkali depletion layer sharply increases. Since the local electric field is expected to be in the order of 106 V cm−1 [41], the electronic conductivity is nonlinear but field-dependent (Frenkel showed a similar behavior when describing the pre-breakdown regime [52]). This could explain the instantaneous intensification of the electrical conductivity at the voltage steps and the reported sawtooth-like conductivity profile. In summary: (i) the applied electric field induces a movement of charge carriers (Na+) towards the cathode (−), forming a sodium-depleted layer at the anode (+); (ii) the alkali-depleted layer is highly resistive, and it induces a resistance increase in the constant voltage step; and (iii) intensification of the local electric field in the depletion layer, which causes a nonlinear conductivity trend, is induced at each voltage step. The activation of the flash transition in the Pt-plated sample requires the dielectric breakdown of the highly resistive alkali depletion layer and high voltage. Once the current starts to flow, the field is not homogeneous along the gauge length, and this induces an inhomogeneous Joule heating.
In Ag-plated samples, the formation of the depletion layer is partially counterbalanced by the diffusion of silver cations into the anodic region. Silver diffusion inside the glass from the metallic electrode is confirmed by SEM/EDXS analyses (Figure 11). Moreover, the brownish coloration of the anodic region may suggest the formation of Ag nanoclusters [53]. In other words, in the case of Ag electrodes, a sufficiently successful electrochemical transfer at the interface between the electrode and the glass takes place, and silver behaves as a cation nonblocking electrode. In the Ag configuration, Na+ moving towards the cathode are substituted by silver cations Ag+ in the anodic region. Although both Ag+ and Ag2+ exist, the former is more stable and most likely to form. The conversion from an electronic to ionic current at the glass/metal interface in the anodic region (+) very likely proceeds through the oxidation of Ag atoms:
In other words, the electric potential causes the oxidation of metallic silver, the silver ions are accommodated within the glass structure in the sodium sites, and an electron is collected by the positively charged metal electrode. We could expect a similar behavior when considering other cation nonblocking electrodes, like for instance alkali salts in the molten state. Other metal electrodes acting as cation-nonblocking could be possibly made of copper, which in the 1+ oxidation state could easily substitute Na+ ions. However, the effectiveness in preventing a thermal gradient would depend a lot on the oxidation rate of the metal electrode and the mobility of its ions within the glass. Finally, metals possessing oxidation states different from 1+ are probably less suitable for eliminating the thermal gradients upon flash.
For these reasons, the total conductivity in Ag-plated samples is larger, and this facilitates the flash transition. The electrode behavior, however, is not completely reversible, and when high currents are applied for “long” periods a localized overheating develops at the anode because of the formation of a highly resistive region (Figure 7, Figure 8, Figure 9 and Figure 10).
5. Conclusions
The ignition of the flash process in soda-lime silicate glass is a function of the electrodes’ material. Pt electrodes appear to be blockers for the current flow, while Ag electrodes result in a lower flash onset field. The use of electrodes like silver, able to continuously substitute Na+ ions migrating towards the cathodic region, leads to the easier occurrence of the flash. The mechanism explaining this result is the diffusion of Ag cations, filling the gaps left by migrating Na+ and so partially counterbalancing the formation of a highly resistive alkali-depleted layer at the anode.
This also has an impact on the Joule heating homogeneity during the steady stage of the process: Ag electrodes allow homogeneous heating of the specimen, whereas the process is highly inhomogeneous when Pt is used, which only occurs in the case of Ag electrodes when severe current and treating time conditions are used.
Author Contributions
M.C.: experimental investigations, original paper writing. V.M.S.: paper revision, funding. G.D.S.: paper revision, funding. M.B.: supervision, data curation, paper revision. All authors have read and agreed to the published version of the manuscript.
Funding
V.M.S., G.D.S., and M.B. kindly acknowledge the support from the Italian Ministry of University and Research (MIUR) within the programs PRIN 2017—2017FCFYHK “DI-RECTBIOPOWER”, PRIN2017—2017PMR932 “Nanostructured Porous Ceramics for Environmental and Energy Applications” and Departments of Excellence 2018–2022 (DII-UNITN). M.B. gratefully acknowledges Ceramics MDPI Travel Grant 2020 for the support.
Data Availability Statement
The data presented in this study are openly available in [Mendeley Data] at [http://0-dx-doi-org.brum.beds.ac.uk/10.17632/3wyv4xyjnh.1, accessed on 23 February 2021], reference [Flash Ignition in Soda Soda-Lime Silicate Glass using different metallic electrodes].
Acknowledgments
V.M. Sglavo, M. Biesuz, and G.D Sorarù kindly acknowledge the support from the Italian Ministry of University and Research (MIUR) within the programs PRIN2017—2017FCFYHK “DIRECTBIOPOWER”, PRIN2017—2017PMR932 “Nanostructured Porous Ceramics for Environmental and Energy Applications” and Departments of Excellence 2018-2022 (DII-UNITN).
Conflicts of Interest
The authors declare that they have no known competing financial or personal relationships that could have appeared to influence the work reported in this paper.
References
- Joule, J.P. On the Heat evolved by Metallic Conductors of Electricity, and in the Cells of a Battery during Electrolysis. London, Edinburgh, Dublin Philos. Mag. J. Sci. 1841, 19, 260–277. [Google Scholar]
- Asai, S. Electromagnetic Processing of Materials. In Fluid Mechanics and Its Applications; Springer: Dordrecht, The Netherlands, 2012; Volume 99, ISBN 978-94-007-2644-4. [Google Scholar]
- Biesuz, M.; Sauders, T.; Ke, D.; Reece, M.J.; Hu, C.; Grasso, S. A review of electromagnetic processing of materials (EPM): Heating, sintering, joining and forming. J. Mater. Sci. Technol. 2020. [Google Scholar] [CrossRef]
- Williams, N.T.; Parker, J.D. Review of resistance spot welding of steel sheets Part 1 Modelling and control of weld nugget formation. Int. Mater. Rev. 2004, 49, 45–75. [Google Scholar] [CrossRef]
- Biesuz, M.; Grasso, S.; Sglavo, V.M. What’s new in ceramics sintering? A short report on the latest trends and future prospects. Curr. Opin. Solid State Mater. Sci. 2020, 24, 100868. [Google Scholar] [CrossRef]
- Orrù, R.; Licheri, R.; Locci, A.M.; Cincotti, A.; Cao, G. Consolidation/synthesis of materials by electric current activated/assisted sintering. Mater. Sci. Eng. R 2009, 63, 127–287. [Google Scholar] [CrossRef]
- Bram, M.; Laptev, A.; Prasad Mishra, T.; Nur, K.; Kindelmann, M.; Ihrig, M.; Pereira da Silva, J.; Steinert, R.; Peter Buchkremer, H.; Litnovsky, A.; et al. Application of Electric Current Assisted Sintering Techniques for the Processing of Advanced Materials. Adv. Eng. Mater. 2020. [Google Scholar] [CrossRef]
- Mattan Ze’ev, B.; Shomrat, N.; Tsur, Y. Recent Advances in Mechanism Research and Methods for Electric-Field-Assisted Sintering of Ceramics. Adv. Mater. 2018, 30, 1706369. [Google Scholar] [CrossRef]
- Dancer, C.E.J. Flash sintering of ceramic materials. Mater. Res. Express 2016, 3, 102001. [Google Scholar] [CrossRef] [Green Version]
- Francis, J.S.C. A Study on the Phenomena of Flash Sintering with Tetragonal Zirconia. Ph.D. Thesis, University of Colorado Boulder, Boulder, CO, USA, 2013. [Google Scholar]
- Yu, M.; Grasso, S.; Mckinnon, R.; Saunders, T.; Reece, M.J. Review of flash sintering: Materials, mechanisms and modelling. Adv. Appl. Ceram. 2017, 116, 24–60. [Google Scholar] [CrossRef] [Green Version]
- Biesuz, M.; Sglavo, V.M. Flash sintering of ceramics. J. Eur. Ceram. Soc. 2019, 39, 115–143. [Google Scholar] [CrossRef]
- Cologna, M.; Rashkova, B.; Raj, R. Flash sintering of nanograin zirconia in <5 s at 850 °C. J. Am. Ceram. Soc. 2010, 93, 3556–3559. [Google Scholar] [CrossRef]
- Muccillo, R.; Kleitz, M.; Muccillo, E.N.S. Flash grain welding in yttria stabilized zirconia. J. Eur. Ceram. Soc. 2011, 31, 1517–1521. [Google Scholar] [CrossRef]
- Todd, R.I.; Zapata-Solvas, E.; Bonilla, R.S.; Sneddon, T.; Wilshaw, P.R. Electrical characteristics of flash sintering: Thermal runaway of Joule heating. J. Eur. Ceram. Soc. 2015, 35, 1865–1877. [Google Scholar] [CrossRef]
- Zhang, Y.; Jung, J.-I.; Luo, J. Thermal runaway, flash sintering and asymmetrical microstructural development of ZnO and ZnO–Bi2O3 under direct currents. Acta Mater. 2015, 94, 87–100. [Google Scholar] [CrossRef] [Green Version]
- Lebrun, J.M.; Raj, R. A first report of photoemission in experiments related to flash sintering. J. Am. Ceram. Soc. 2014, 97, 2427–2430. [Google Scholar] [CrossRef]
- Naik, K.; Jha, S.K.; Raj, R. Correlations between conductivity, electroluminescence and flash sintering. Scr. Mater. 2016, 118, 1–4. [Google Scholar] [CrossRef]
- Biesuz, M.; Luchi, P.; Quaranta, A.; Martucci, A.; Sglavo, V.M. Photoemission during flash sintering: An interpretation based on thermal radiation. J. Eur. Ceram. Soc. 2017, 37, 3125–3130. [Google Scholar] [CrossRef]
- Naik, K.S.; Sglavo, V.M.; Raj, R. Flash sintering as a nucleation phenomenon and a model thereof. J. Eur. Ceram. Soc. 2014, 34, 4063–4067. [Google Scholar] [CrossRef]
- Zhang, Y.; Nie, J.; Chan, J.M.; Luo, J. Probing the densification mechanisms during flash sintering of ZnO. Acta Mater. 2017, 125, 465–475. [Google Scholar] [CrossRef] [Green Version]
- Ji, W.; Parker, B.; Falco, S.; Zhang, J.Y.; Fu, Z.Y.; Todd, R.I. Ultra-fast firing: Effect of heating rate on sintering of 3YSZ, with and without an electric field. J. Eur. Ceram. Soc. 2017, 37, 2547–2551. [Google Scholar] [CrossRef]
- Chaim, R. On the kinetics of liquid-assisted densification during flash sintering of ceramic nanoparticles. Scr. Mater. 2019, 158, 88–90. [Google Scholar] [CrossRef]
- Ren, K.; Wang, Q.; Lian, Y.; Wang, Y. Densification kinetics of flash sintered 3mol% Y2O3stabilized zirconia. J. Alloys Compd. 2018, 747, 1073–1077. [Google Scholar] [CrossRef]
- Chaim, R. Liquid Film Capillary Mechanism for Densification of Ceramic Powders during Flash Sintering. Materials 2016, 9, 280. [Google Scholar] [CrossRef] [Green Version]
- Mishra, T.P.; Avila, V.; Neto, R.R.I.; Bram, M.; Guillon, O.; Raj, R. On the role of Debye temperature in the onset of flash in three oxides. Scr. Mater. 2019, 170, 81–84. [Google Scholar] [CrossRef]
- Liu, D.; Cao, Y.; Liu, J.; Gao, Y.; Wang, Y. Effect of oxygen partial pressure on temperature for onset of flash sintering 3YSZ. J. Eur. Ceram. Soc. 2018, 38, 817–820. [Google Scholar] [CrossRef]
- Vasylkiv, O.; Borodianska, H.; Sakka, Y.; Demirskyi, D. Flash spark plasma sintering of ultrafine yttria-stabilized zirconia ceramics. Scr. Mater. 2016, 121, 32–36. [Google Scholar] [CrossRef]
- Grasso, S.; Saunders, T.; Porwal, H.; Milsom, B.; Tudball, A.; Reece, M.; Chen, I.W. Flash Spark Plasma Sintering (FSPS) of α and β SiC. J. Am. Ceram. Soc. 2016, 99, 1534–1543. [Google Scholar] [CrossRef] [Green Version]
- Manière, C.; Lee, G.; Olevsky, E.A. All-Materials-Inclusive Flash Spark Plasma Sintering. Sci. Rep. 2017, 7, 15071. [Google Scholar] [CrossRef]
- Manière, C.; Lee, G.; Torresani, E.; Gerling, J.F.; Yakovlev, V.V.; Martin, D.; Olevsky, E.A. Flash microwave pressing of zirconia. J. Am. Ceram. Soc. 2020. [Google Scholar] [CrossRef]
- Du, B.; Gucci, F.; Porwal, H.; Grasso, S.; Mahajan, A.; Reece, M.J. Flash spark plasma sintering of magnesium silicide stannide with improved thermoelectric properties. J. Mater. Chem. C 2017, 5, 1514–1521. [Google Scholar] [CrossRef] [Green Version]
- Gaur, A. Flash-Sintering of MnCo2O4 and (La, Sr) (Co, Fe) O3 Ceramics for Potential Application in SOFC. Ph.D. Thesis, University of Trento, Trento, Italy, 2014. [Google Scholar]
- Akbari-Fakhrabadi, A.; Mangalaraja, R.V.; Sanhueza, F.A.; Avila, R.E.; Ananthakumar, S.; Chan, S.H. Nanostructured Gd-CeO2 electrolyte for solid oxide fuel cell by aqueous tape casting. J. Power Sources 2012, 218, 307–312. [Google Scholar] [CrossRef]
- Spiridigliozzi, L.; Biesuz, M.; Dell’Agli, G.; Di Bartolomeo, E.; Zurlo, F.; Sglavo, V.M.; Dell’Agli, G.; Di Bartolomeo, E.; Zurlo, F.; Sglavo, V.M.; et al. Microstructural and electrical investigation of flash-sintered Gd/Sm-doped ceria. J. Mater. Sci. 2017, 52, 7479–7488. [Google Scholar] [CrossRef]
- Ojaimi, C.L.; Ferreira, J.A.; Chinelatto, A.L.; Chinelatto, A.S.A.; Pallone, E.M.d.J.A. Microstructural analysis of ZrO2/Al2O3 composite: Flash and conventional sintering. Ceram. Int. 2020, 46, 2473–2480. [Google Scholar] [CrossRef]
- Zapata-Solvas, E.; Bonilla, S.; Wilshaw, P.R.; Todd, R.I. Preliminary investigation of flash sintering of SiC. J. Eur. Ceram. Soc. 2013, 33, 2811–2816. [Google Scholar] [CrossRef]
- Nie, J.; Zhang, Y.; Chan, J.M.; Huang, R.; Luo, J. Water-assisted flash sintering: Flashing ZnO at room temperature to achieve ~98% density in seconds. Scr. Mater. 2018, 142, 79–82. [Google Scholar] [CrossRef]
- McLaren, C.; Heffner, W.; Tessarollo, R.; Raj, R.; Jain, H. Electric field-induced softening of alkali silicate glasses. Appl. Phys. Lett. 2015, 107, 1–6. [Google Scholar] [CrossRef]
- McLaren, C.T.; Heffner, W.R.; Raj, R.; Jain, H. AC electric field-induced softening of alkali silicate glasses. J. Am. Ceram. Soc. 2018, 101, 2277–2286. [Google Scholar] [CrossRef]
- McLaren, C.T.; Kopatz, C.; Smith, N.J.; Jain, H. Development of highly inhomogeneous temperature profile within electrically heated alkali silicate glasses. Sci. Rep. 2019, 9, 1–14. [Google Scholar] [CrossRef] [Green Version]
- McLaren, C.; Roling, B.; Raj, R.; Jain, H. Mechanism of electric field-induced softening (EFIS) of alkali silicate glasses. J. Non. Cryst. Solids 2017, 471, 384–395. [Google Scholar] [CrossRef]
- Pinter, L.; Biesuz, M.; Sglavo, V.M.; Saunders, T.; Binner, J.; Reece, M.; Grasso, S. DC-electro softening in soda lime silicate glass: An electro-thermal analysis. Scr. Mater. 2018, 151, 14–18. [Google Scholar] [CrossRef]
- Biesuz, M.; Pinter, L.; Saunders, T.; Reece, M.; Binner, J.; Sglavo, V.; Grasso, S. Investigation of Electrochemical, Optical and Thermal Effects during Flash Sintering of 8YSZ. Materials 2018, 11, 1214. [Google Scholar] [CrossRef] [PubMed] [Green Version]
- Caliman, L.B.; Bouchet, R.; Gouvea, D.; Soudant, P.; Steil, M.C. Flash sintering of ionic conductors: The need of a reversible electrochemical reaction. J. Eur. Ceram. Soc. 2016, 36, 1253–1260. [Google Scholar] [CrossRef]
- Grimley, C.A.; Prette, A.L.G.; Dickey, E.C. Effect of boundary conditions on reduction during early stage flash sintering of YSZ. Acta Mater. 2019, 174, 271–278. [Google Scholar] [CrossRef]
- Biesuz, M.; Cipriani, M.; Sglavo, V.M.; Sorarù, G.D. Electrode-dependent Joule heating in soda lime silicate glass during flash processes. Scr. Mater. 2020, 182, 94–98. [Google Scholar] [CrossRef]
- Green, D.W.; Perry, R.H. Perry’s Chemical Engineers’ Handbook; McGraw-Hill: New York, NY, USA, 2008; ISBN 0071593136. [Google Scholar]
- Anderson, O.L.; Stuart, D.A. Calculation of Activation Energy of Ionic Conductivity in Silica Glasses by Classical Methods. J. Am. Ceram. Soc. 1954, 37, 573–580. [Google Scholar] [CrossRef]
- Amma, S.; Lanagan, M.T.; Kim, S.H.; Pantano, C.G. Ionic Conductivity in Sodium-Alkaline Earth-Aluminosilicate Glasses. J. Am. Ceram. Soc. 2016, 99, 1239–1247. [Google Scholar] [CrossRef]
- Eldin, F.M.E.; El Alaily, N.A. Electrical conductivity of some alkali silicate glasses. Mater. Chem. Phys. 1998, 52, 175–179. [Google Scholar] [CrossRef]
- Frenkel, J. On pre-breakdown phenomena in insulators and electronic semi-conductors. Phys. Rev. 1938, 54, 647–648. [Google Scholar] [CrossRef]
- Kumar, P.; Mathpal, M.C.; Tripathi, A.K.; Prakash, J.; Agarwal, A.; Ahmad, M.M.; Swart, H.C. Plasmonic resonance of Ag nanoclusters diffused in soda-lime glasses. Phys. Chem. Chem. Phys. 2015, 17, 8596–8603. [Google Scholar] [CrossRef]
Figure 1.
(a) Sample holder configuration. (b) Sample positioning within the furnace, together with the thermocouple.
Figure 1.
(a) Sample holder configuration. (b) Sample positioning within the furnace, together with the thermocouple.

Figure 2.
Electric field and current for the experiments carried out in the furnace using Pt configurations at (a) 450 °C, (b) 490 °C and (c) 550 °C, and Ag configurations at (d) 450 °C, (e) 490 °C, and (f) 550 °C.
Figure 2.
Electric field and current for the experiments carried out in the furnace using Pt configurations at (a) 450 °C, (b) 490 °C and (c) 550 °C, and Ag configurations at (d) 450 °C, (e) 490 °C, and (f) 550 °C.

Figure 3.
Flash onset field triggering a dielectric breakdown as a function of the applied electrode configuration and the experimental temperature (error < 50 V cm−1).
Figure 3.
Flash onset field triggering a dielectric breakdown as a function of the applied electrode configuration and the experimental temperature (error < 50 V cm−1).

Figure 4.
The logarithm of conductivity as a function of the estimated sample temperature for (a) Pt-plated and (b) Ag-plated samples.
Figure 4.
The logarithm of conductivity as a function of the estimated sample temperature for (a) Pt-plated and (b) Ag-plated samples.

Figure 5.
(a) Logarithm of conductivity as a function of time for the samples treated at 490 °C. (b) The logarithm of conductivity as a function of 1/T for the samples treated at 490 °C.
Figure 5.
(a) Logarithm of conductivity as a function of time for the samples treated at 490 °C. (b) The logarithm of conductivity as a function of 1/T for the samples treated at 490 °C.

Figure 6.
(a) Logarithm of conductivity in the temperature range of 450 °C and 462 °C for the Pt sample treated at Tf = 450 °C. (b) The logarithm of conductivity as a function of time for the Pt sample tested at 450 °C.
Figure 6.
(a) Logarithm of conductivity in the temperature range of 450 °C and 462 °C for the Pt sample treated at Tf = 450 °C. (b) The logarithm of conductivity as a function of time for the Pt sample tested at 450 °C.

Figure 7.
Digital camera images of the (a,b) Ag- and (c,d) Pt-plated samples treated with 2 mA mm−2. The electric current is applied at t = 0 s.
Figure 7.
Digital camera images of the (a,b) Ag- and (c,d) Pt-plated samples treated with 2 mA mm−2. The electric current is applied at t = 0 s.

Figure 8.
Thermal camera images of the (a,b) Ag- and (c,d) Pt-plated samples treated with 2 mA mm−2. The electric current is applied at t = 0 s. Top of the sample = cathodic region (−); Bottom of the sample = anodic region (+).
Figure 8.
Thermal camera images of the (a,b) Ag- and (c,d) Pt-plated samples treated with 2 mA mm−2. The electric current is applied at t = 0 s. Top of the sample = cathodic region (−); Bottom of the sample = anodic region (+).

Figure 9.
Temperature profile for the Ag-plated samples with four different applied current densities.
Figure 9.
Temperature profile for the Ag-plated samples with four different applied current densities.

Figure 10.
Hot spot incubation time for the platinum (red)- and silver (green)-plated samples, as a function of the applied current density.
Figure 10.
Hot spot incubation time for the platinum (red)- and silver (green)-plated samples, as a function of the applied current density.

Figure 11.
(a) Picture of an Ag-plated sample after flash treatment at 2 mA mm−2, where a brownish region is visible at the anode (+). (b) SEM micrograph and (c) EDXS spectrum of its anodic region.
Figure 11.
(a) Picture of an Ag-plated sample after flash treatment at 2 mA mm−2, where a brownish region is visible at the anode (+). (b) SEM micrograph and (c) EDXS spectrum of its anodic region.

Publisher’s Note: MDPI stays neutral with regard to jurisdictional claims in published maps and institutional affiliations. |
© 2021 by the authors. Licensee MDPI, Basel, Switzerland. This article is an open access article distributed under the terms and conditions of the Creative Commons Attribution (CC BY) license (http://creativecommons.org/licenses/by/4.0/).
Share and Cite
MDPI and ACS Style
Cipriani, M.; Sglavo, V.M.; Sorarù, G.D.; Biesuz, M. Electrode Material Effect on the Flash Ignition in Soda-Lime Silicate Glass. Ceramics 2021, 4, 70-82. https://0-doi-org.brum.beds.ac.uk/10.3390/ceramics4010007
AMA Style
Cipriani M, Sglavo VM, Sorarù GD, Biesuz M. Electrode Material Effect on the Flash Ignition in Soda-Lime Silicate Glass. Ceramics. 2021; 4(1):70-82. https://0-doi-org.brum.beds.ac.uk/10.3390/ceramics4010007
Chicago/Turabian StyleCipriani, Mattia, Vincenzo M. Sglavo, Gian Domenico Sorarù, and Mattia Biesuz. 2021. "Electrode Material Effect on the Flash Ignition in Soda-Lime Silicate Glass" Ceramics 4, no. 1: 70-82. https://0-doi-org.brum.beds.ac.uk/10.3390/ceramics4010007