Article

A Study of the Impact of Graphite on the Kinetics of SPS in Nano- and Submicron WC-10%Co Powder Compositions

1
Materials Science Department, Physico-Technical Research Institure, Lobachevsky State University of Nizhny Novgorod, 603022 Nizhny Novgorod, Russia
2
A.A. Baykov Institute of Metallurgy and Materials Science, Russian Academy of Science, 49 Leninskiy Ave., 119334 Moscow, Russia
*
Authors to whom correspondence should be addressed.
Submission received: 6 May 2021 / Revised: 31 May 2021 / Accepted: 8 June 2021 / Published: 10 June 2021
(This article belongs to the Special Issue Advanced Structural Ceramics II)

Abstract

:
This study investigates the impact of carbon on the kinetics of the spark plasma sintering (SPS) of nano- and submicron powders WC-10 wt.%Co. Carbon, in the form of graphite, was introduced into powders by mixing. The activation energy of solid-phase sintering was determined for the conditions of isothermal and continuous heating. It has been demonstrated that increasing the carbon content leads to a decrease in the fraction of η-phase particles and a shift of the shrinkage curve towards lower heating temperatures. It has been established that increasing the graphite content in nano- and submicron powders has no significant effect on the SPS activation energy for “mid-range” heating temperatures, QS(I). The value of QS(I) is close to the activation energy of grain-boundary diffusion in cobalt. It has been demonstrated that increasing the content of graphite leads to a significant decrease in the SPS activation energy, QS(II), for “higher-range” heating temperatures due to lower concentration of tungsten atoms in cobalt-based γ-phase. It has been established that the sintering kinetics of fine-grained WC-Co hard alloys is limited by the intensity of diffusion creep of cobalt (Coble creep).

1. Introduction

Hard alloys based on tungsten carbide and containing a readily fusible metallic binder (usually cobalt) lend themselves to a wide range of industrial applications [1,2,3,4,5,6,7,8,9,10,11,12]. The development of the wear-resistant cutting tools allowing for a high-speed processing of structural materials (titanium alloys, austenite corrosion-resistant steels, heat-resistant alloys, etc.) is one promising application of the fine-grained hard alloys based on tungsten carbide [1,3,5,6,9,10,11,12]. The fine-grained hard alloys-based tungsten carbide is interesting for applications in dies, roll drums, and engineering products, which are imposed to increased requirements of strength and wear resistance due to a successful combination of a high melting point, high hardness, fracture toughness (see Appendix A, Table A1, [13,14,15,16,17,18,19,20,21,22,23,24,25,26,27,28,29,30,31,32,33,34,35,36,37,38,39,40,41,42,43,44,45,46,47,48,49,50,51,52,53,54,55,56,57,58]), low friction coefficient, and high corrosion resistance.
The traditional structure of such alloys is comprised of α-WC tungsten monocarbide grains that are surrounded by a plastic γ-phase that is present in the form of a solid solution of carbon and tungsten in cobalt [1,2,3,4,5,6,7,8,9,10,11,12]. Depending on the under- or oversaturation of carbon relative to the equilibrium concentration (C0 = 6.14 wt.% [1]), the WC-Co alloys may, in addition to the two main phases, contain ternary carbides (η-phase) or graphite, respectively [2,3,4,5,6]. An increased oxygen concentration in the tungsten carbide powders favors the formation of unwanted phases in the sintered hard alloys (α-W, η-phase, WOx) [1,59,60]. This means that the carbon and oxygen content in the initial WC-Co powders has as much of an impact on the sintering kinetics, grain growth, and properties of hard alloys as their phase composition and the size of tungsten carbide α-WC particles [61,62,63,64]. An analysis of the literature shows that, unfortunately, researchers often do not pay enough attention to the carbon and oxygen content in the powders being sintered (Table A1).
Note that the concentration of carbon has a marked effect on the patterns of tungsten carbide grain growth during the sintering of hard alloys [65,66]. It has been demonstrated in [65] that excessive free carbon (presence of graphite) leads to larger grains, whereas the structure of hard alloys with excessive carbon is more uniform relative to the structure of a hard alloy that is undersaturated with carbon. It has been highlighted that the hard alloys that are oversaturated with carbon exhibit more pronounced facets in tungsten carbide grains, whereas the alloys that are undersaturated with carbon have more rounded grains [65]. These findings are corroborated by other authors [66,67,68,69,70,71]. Note that carbon content has a significant impact on shrinkage patterns in WC-Co powders during sintering. It has been demonstrated in [71] that, in hard alloys that are undersaturated with carbon, shrinkage begins at lower temperatures than in alloys that are oversaturated with carbon. Note that powders with an increased carbon content sinter faster [69,72], while an increased concentration of tungsten in cobalt leads to the lower plasticity of cobalt and a lower intensity of η-phase spreading between α-WC particles [18,19]. Some of the cited papers [20,21,22] suppose that the concentration of carbon may have a strong impact on the diffusion creep of the η-phase, which can control the intensity of shrinkage at early sintering stages in WC-Co hard alloys. The oxygen/carbon ratio in the powders was shown to be important for high density, microstructure uniformity, and high mechanical properties of the hard alloys. Since the oxygen concentration in the powders may increase considerably during storing [73], the question of the joint effect of the oxygen and carbon concentrations on the sintering kinetics of the hard alloys is very important.
The standard process of producing hard alloys is liquid phase conventional sintering. An opportunity of ensuring a uniform spreading of cobalt over the surfaces of the tungsten carbide particles and, hence, an opportunity to form a system of interphase boundaries in WC/Co is an advantage of this technology. It provides the hard alloys with an increased bending strength. An intensive grain growth through Ostwald ripening [1,3,5,64] leading to lower hardness and fracture toughness is a disadvantage of this sintering technology. In recent decades, the production of ultrafine-grained (UFG) hard alloys relied on hot isostatic pressing (HIP), the Field Assisted Sintering Technique (FAST), Spark Plasma Sintering (SPS), etc. (Table A1, [74]). The SPS process provides high-rate (up to 2500 °C/min) sintering by means of applying strong-current millisecond-long pulses (up to 5 kA) to powder loaded into a graphite compression mold that applies pressure to the powder [75,76,77]. This process enables much slower grain growth and the formation of a uniform UFG structure at lower temperatures of compaction (Table A1). There has been detailed research on the effects of cobalt concentration, grain size, and SPS conditions on the mechanical properties of WC-Co hard alloys (Table A1).
The enrichment of the specimens’ surfaces with carbon is an important feature of SPS technology, which should be taken into account when analyzing the powder sintering kinetics [78,79] (see Appendix B). It leads to altering the phase composition and the mechanical properties of the surface layers of the tungsten carbide specimens sintered from the powders with a low carbon content or with an increased oxygen one. Note also that a high heating rate (up to 2500 °C/min) and reduced optimal sintering temperatures make SPS technology very promising for minimizing the decomposition of the tungsten monocarbide α-WC and the formation of the unwanted phases. It leads to a necessity to control the process of surface carbonization in SPS and to control the thickness of the layers removed from the sintered specimens’ surface when grinding. The absence of control over the removed layer’s depth may lead to essential differences in the specimens’ character, particularly, to the contradictions in the issue of the effect of oxygen and carbon on the intensity of the η-phase particle formation and on the grain growth character.
Note also that, for the purposes of obtaining nano- and UFG hard alloys, DC arc plasma synthesis of refractory carbide nanopowders has an apparent potential [80,81,82,83]. It has been demonstrated that DC arc plasma synthesis technology allows SPS to be used to obtain specimens of tungsten carbide and hard alloys with high properties (hardness, fracture toughness) [84,85,86,87]. An increased concentration of oxygen (up to 1–1.5%) adsorbed on the surfaces of nanoparticles is a feature of the plasma chemically synthesized α-WC nanopowders [59,73,88]. It leads to more intensive decomposition of tungsten monocarbide α-WC and to an increased volume fraction of the η-phase particles in the WC-Co hard alloys [59,60]. Therefore, an increased portion of carbon (graphite) is usually added when sintering the plasma chemically synthesized WC-Co nanopowders [86].
This study sets out to investigate the shrinkage mechanisms of nano- and submicron WC-10%Co powders within various temperature and heating rate ranges and to investigate the impact of graphite on the sintering kinetics in UFG WC-Co hard alloys. We compare the kinetics of the high-speed sintering of the submicron WC-10%Co powders obtained using the traditional method of mixing the components (WC and Co) with the one of shrinkage of the WC-10%Co nanopowders obtained using a novel method of depositing thin cobalt films onto the plasma chemically synthesized α-WC nanoparticles. The application of the particles with a “core–hell” structure may ensure the continuity of the interphase boundaries of WC-Co in the sintered hard alloys. It is important for obtaining an increased hardness and fracture toughness of the hard alloys simultaneously. Earlier, the efficiency of this method was demonstrated for WC-4Co hard alloy obtained by liquid-phase sintering in a vacuum [89]. As it has been shown in [89], the hard alloys obtained had a higher density and strength compared to the hard alloys obtained from the WC-4Co composition prepared by powder mixing. In [56], WC-5Co and WC-10Co hard alloys obtained by the liquid-phase SPS of submicron particles (initial sizes of the agglomerates were 300 nm, mean particle sizes after deposition and mixing were 163 nm) with a “core WC–shell Co” structure were investigated. The hard alloys obtained had a high enough density (96–98%). However, the values of hardness of these alloys were low (1278–1370Hv for WC-5Co and 1272–1349Hv for WC-10Co). No information on the phase composition and microstructure was presented in [56].
Detailed investigations of the mechanism of high-speed SPS of the plasma chemically synthesized WC-10%Co nanopowders with a “core (α-WC)-shell (Co)” structure were carried out for the first time. The hard alloys obtained using the solid-phase and liquid-phase SPS of the submicron WC+10%C powders obtained by mixing WC and Co were used as reference.

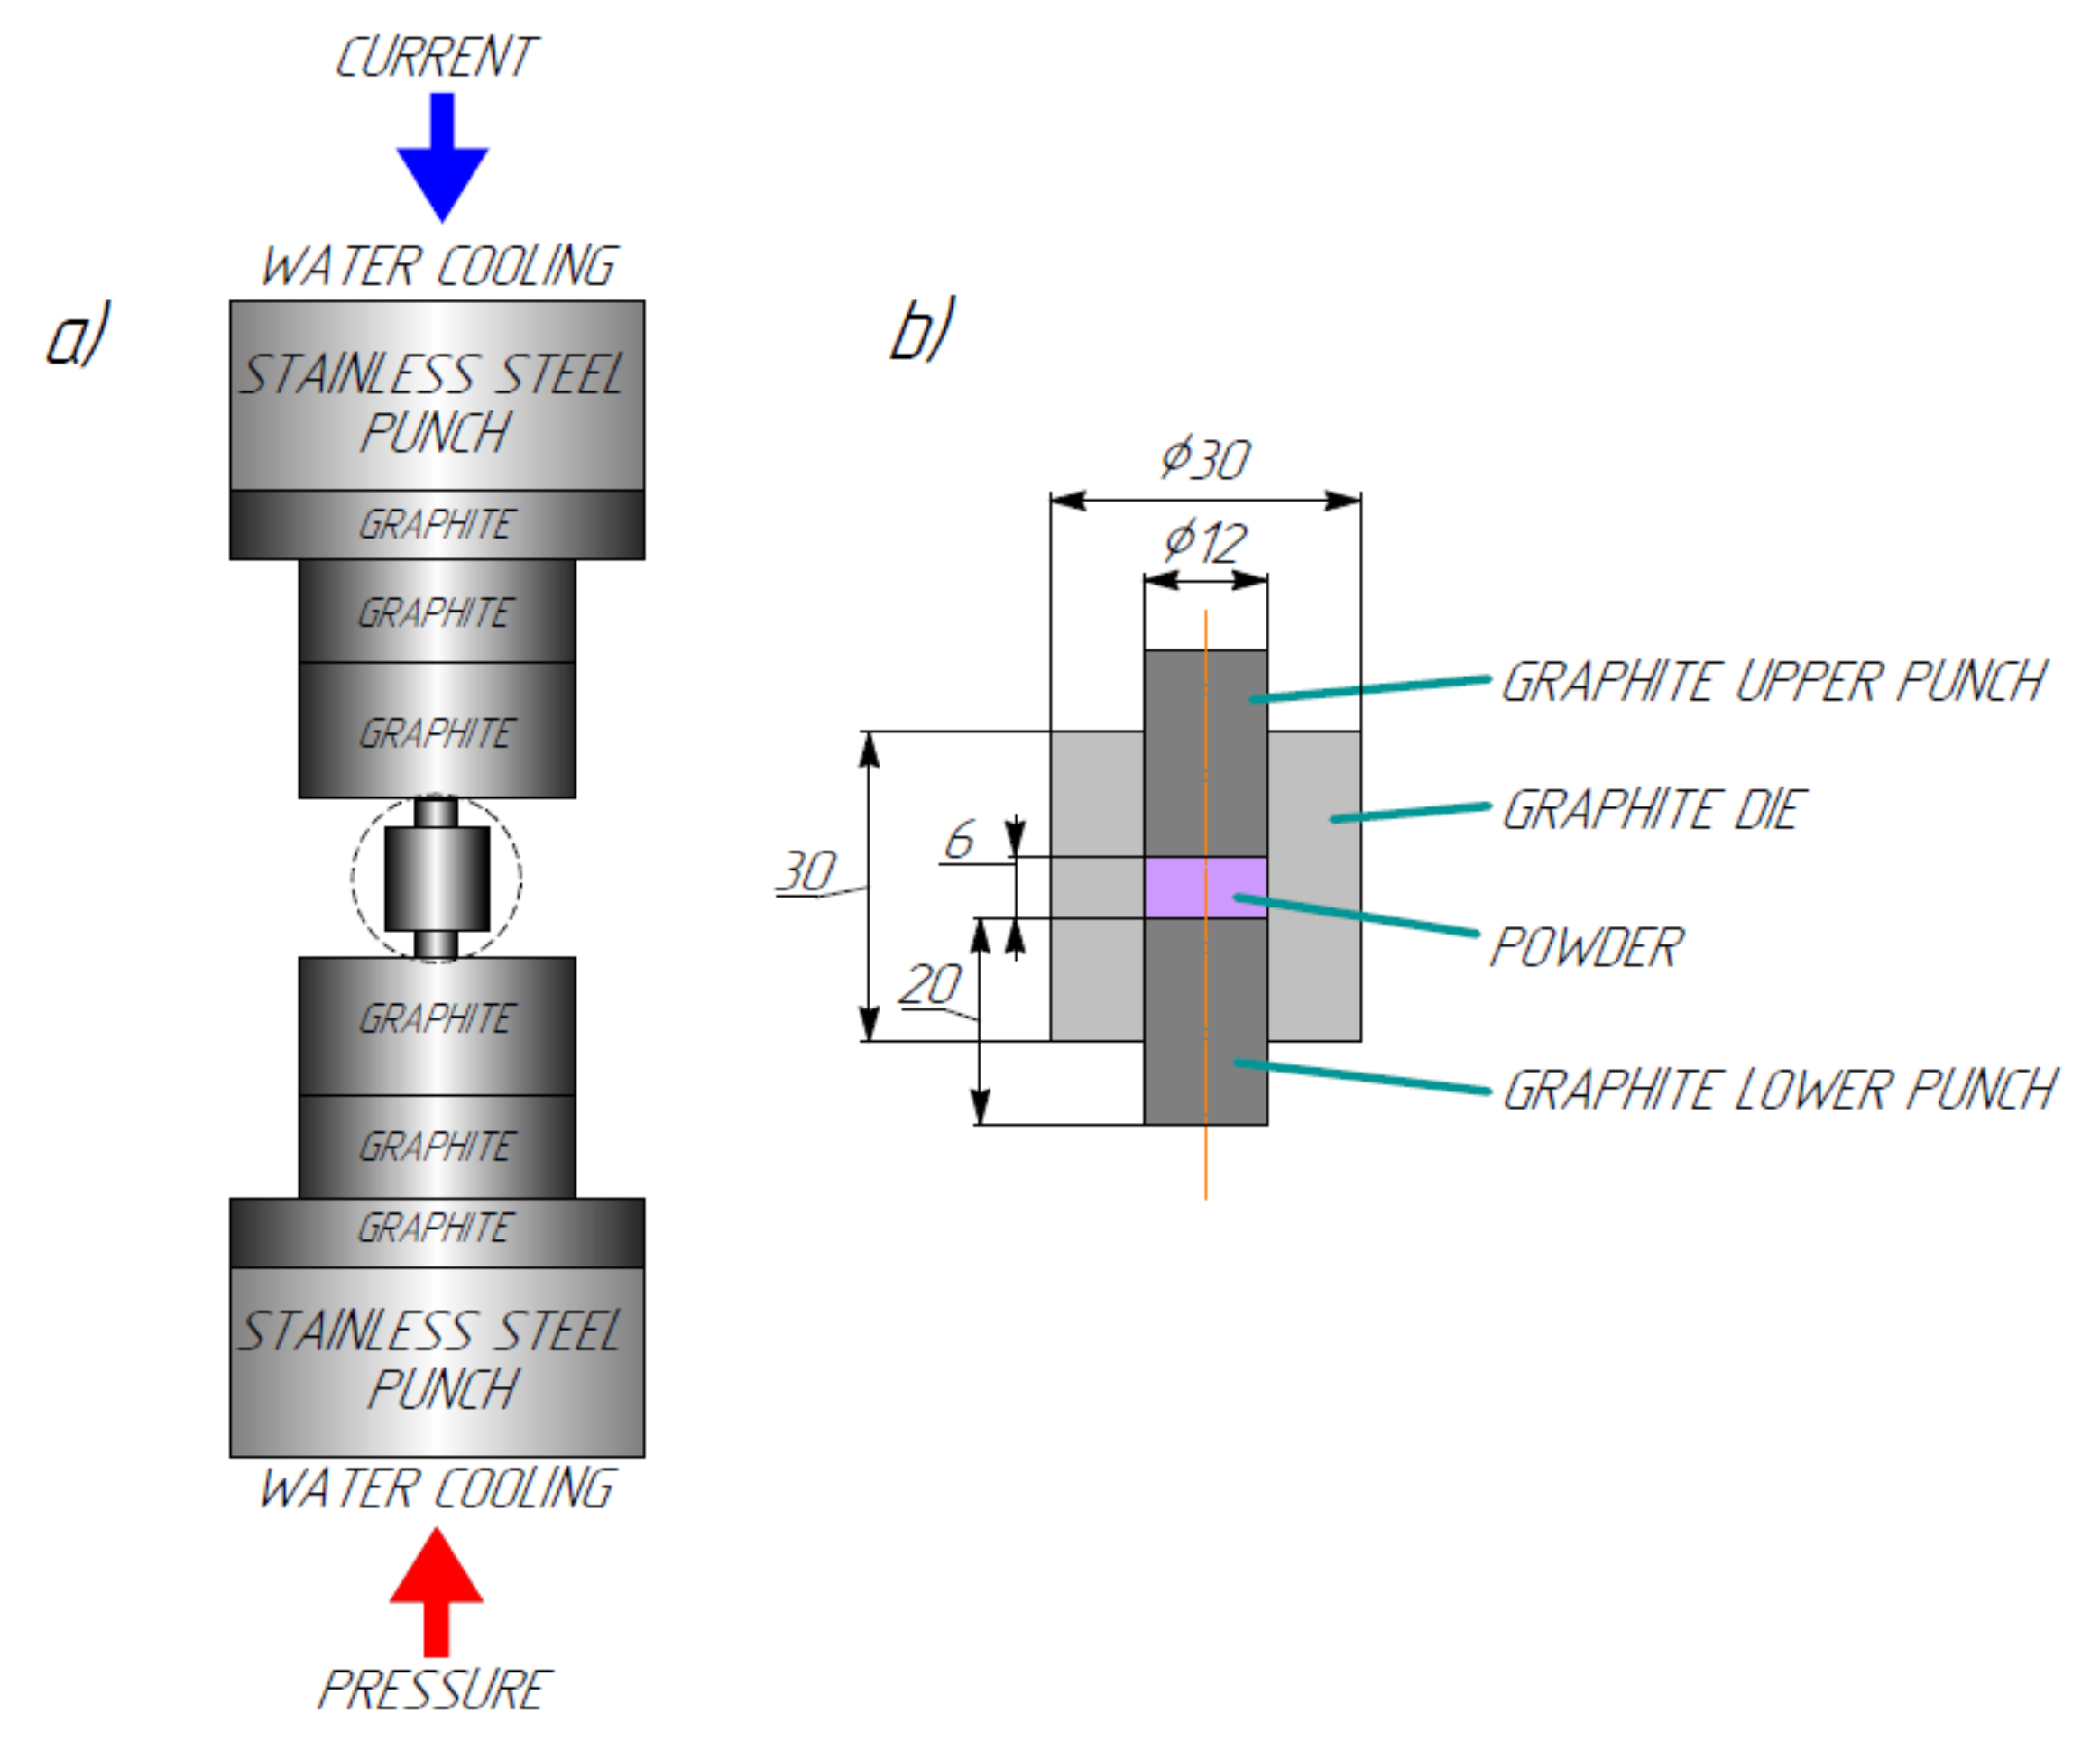
2. Materials and Methods

This study was carried out on submicron powders of α-WC tungsten monocarbide by Alfa-Aesar® (according to the vendor’s certificate specifications, the initial particle sizes were ~0.3–0.5 μm (series 1) and α-WC nanopowder obtained by DC arc plasma synthesis with recovery annealing under hydrogen (series 2).The choice of the nano-and submicron tungsten carbide powders was motivated by the task of obtaining fine-grained hard alloys with improved mechanical properties.
The general chemical compositions of the investigated powders are presented in Table 1. The chemical composition of the factory-made α-WC and α-Co powders is given from the data from the vendor’s (Alfa-Aesar®) certificates. Submicron powders α-WC (99.5%, carbon concentration Ctotal = 6.07 wt.%, oxygen concentration 0.14 wt.%) and α-Co (99.95%, Ctotal = 0.12%, O2 = 0.41%, R0 = 1.6 μm) were mixed to produce a α-WC+10 wt.% α-Co composition. (Hereafter, the α-WC+10 wt.%Co hard alloy composition will be denoted as WC-10Co for brevity). According to the vendor’s certificate (Alfa-Aesar, Haverhill, MA, USA) the α-Co particles were ~1 μm in size. Free carbon (Cfree = 0.1, 0.2, 0.3, 0.4, 0.5 wt.%C) was then introduced into the mixture in the form of colloidal graphite. The α-WC+10 wt.%Co powders were mixed in a FRITSCH®Pulverisette 6 planetary ball mill (Idar-Oberstein, Germany). The milling pot was lined with a carbide alloy; the milling balls were made of a WC-Co hard alloy, with a diameter of 1 mm; grinding in isopropyl alcohol at 150 rpm for 16 h. Graphite was added through a Heilscher UP200pt homogenizer under alcohol. The process of mixing leads to an insufficient increasein the oxygen concentration in ~0.2 wt.%. The Co concentration in the submicron powders of Series #1 after adding the graphite increased by 0.09%,which was attributed to the milling yield from the milling bodies and accessories of the FRITSCH®Pulverisette 6 planetary ball mill.
W-C nanopowders were obtained by restorative synthesis from tungsten oxideWO3 and methane in nitrogen–hydrogen (H2 + N2) DC arc plasma. Specific surface of the powders after the DC arc plasma synthesis was Ssp =22 m2/g. Carbon concentration in the synthesized powders was ~6.5%. A α-WC tungsten carbide synthesis was performed under H2 at 1000 °C. Specific surface of the synthesized tungsten monocarbide nanopowders was Ssp = 7.2 m2/g; carbon concentration in the nanopowders was Ctotal ~ 6.36 wt.%.
WC-10%Co nanopowder composition was obtained by a precipitation of CoCl2⋅6H2O cobalt salt from an ethanol solution, followed by recovery under hydrogen at 750 °C (see [82]). The homogeneity of powders was improved by grinding them in a RETCH®planetary mill (Verder Group, Verder Scientific GmbH & Co, Haan, Germany) using hard-alloy pot and balls, at a 1:5 ratio under ethanol. Oxygen content in the nanopowders was decreased after grinding by means of additional annealing at 800 °C for 2 h.
Mixing was used to introduce 0.5, 1.0, and 1.5% to the obtained WC-10 wt.%Co nanopowder in order to improve the homogeneity of the hard alloy [1]. The procedure for mixing WC-10 wt.%Co nanopowder was the same as for the submicron powders (see above). The oxygen concentration in the synthesized nanopowders was 0.75 wt.% before sintering. An increased concentration of carbon introduced into the plasma chemically synthesized nanopowders is caused by the negative effect of oxygen on the stability of the α-WC phase. As it has been shown in [59,60,86], an increased oxygen concentration in the α-WC nanopowders obtained by DC arc plasma chemical synthesis leads to the formation of η-phase particles.
Samples of 20 mm in diameter and finite height h = 3 mm were compacted by SPS on a Dr. Sinter® model SPS-625 (SPS Syntex, Ltd., Tokyo, Japan). The temperature measurement’s accuracy was ±20 °C. The temperature was measured with a Chino® IR-AHS2 infrared pyrometer (Chino Corporation, Tokyo, Japan) focused on the outside of the graphite mold. Sintering was performed in a vacuum (6 Pa) in the following regimes: (Method I) two-stage heating with a constant rate up to a preset sintering temperature at a constant pressure (σ = const); (Method II) an isothermal holding at a constant pressure (T = const, σ = const); (Method III)an isothermal holding with a step-wise variation of pressure (T = const, σ ≠ const) (Figure 1).
Sintering by Method I was carried out in the following two stages: a stage of low-temperature dwell at 800 °C (10 min) to remove the adsorbed oxygen from the powder surface (degasification) and a stage of preset-rate heating up to a sintering temperature, Ts, followed by free cooling. No exposure at Ts was made. The shrinkage (L) and shrinkage rate (S) of powders were monitored during heating. Empty compression molds were heated and measured in order to correct for the thermal expansion of the mold during actual experiments. The heating rate for sintering was 50 °C/min. Temperatures were brought up to the range of solid-phase (1100 °C) and liquid-phase (1400 °C) sintering. Applied loads were 70 MPa. The dependencies L(T) obtained were used further to determine the sintering activation energy of the powders in the continuous heating regime.
Sintering by methods II and III was performed in order to study the effects of temperature and of the magnitude of the pressure applied on the shrinkage curves and to determine the rheological parameters of the creep law equation. When sintering by Method II, a rapid heating with the heating rate of 50 °C/min up to the preset temperature (750, 800, 850, 900, 950, and 1000 °C) and holding at this temperature during ~90 min at a constant pressure σ = 70 MPa were performed. In the course of the experiment, the dependencies of the shrinkage rates (at the isothermal holding stage) on the sintering temperature were determined. These dependencies were used further to determine the sintering activation energies, Q, in Equation (1).When sintering by Method III, the isothermal holding of the specimens at 800 °C with a step-wise increase in the pressure σ (40, 70, and, 100 MPa) was performed. In the course of the experiment, the dependencies of the shrinkage rates on the magnitude of the applied pressure were determined. These dependencies were used further to determine the magnitudes of the coefficient n in Equation (1), as follows:
ε ˙ = A D / b 2 G Ω / k T σ / G n ,
where ε ˙ is the creep rate, A is the dimensionless coefficient, D = D0exp(Q/kT) is the diffusion coefficient; k is the Boltzmann constant, b is the Burgers vector, G is the shear modulus, and Ω is the atomic volume [90,91].
The specific surface of powders (SBET, m2/g) was measured using a Micromeritics® TriStar 3000 specific surface analyzer (Micromeritics Instruments Corp., Norcross, GA, USA). The accuracy of the SBET was ±0.02 m2/g. The average initial particle size (R0, nm) was calculated according to the following formula: R0= 6/(ρthSBET), where ρth = 15.77 g/cm3 is taken as the theoretical density of tungsten monocarbide. The microstructure of the specimens was studied with a JEOL® JSM-6490 scanning electron microscope(SEM, Jeol Ltd., Tokyo, Japan) with an Oxford Instruments® INCA 350 energy dispersive spectrometer(EDS, Oxford Instruments pls., Oxford, UK). Measurements of the average particle(R)and grain size (d) were taken using the chord method ±0.05 μm in GoodGrains 2.0 software suite (Nizhny Novgorod, Russia).
X-ray diffraction (XRD) analysis of the specimens was performed with a Shimadzu® XRD-700 diffraction meter (Shimadzu, Kyoto, Japan) using the Bragg–Brentano technique (CuKα, λ = 1.5406 Å, imaging rate 0.25°/min, spot exposure 4.8 s). The mass fraction of η-phase particles was determined using the Rietveld method. The accuracy of the mass fraction calculation (η-phase (fη)) was ±2 wt.%. The carbon concentration was identified with a LECO® CS-400 analyzer (LECO Corp., St. Joseph, MI, USA). A LECO® TC-600 analyzer (LECO Corp., St. Joseph, MI, USA) was used to determine the oxygen concentration. The accuracy of determining the content of carbon and oxygen was ±0.01 wt.%. Chemical composition analysis was performed using an Ultima 2 ICP atomic emission spectrometer.
Specimen density (ρ) was measured by hydrostatic weighing on a Sartorius® CPA 225D analytical balance (Göttingen, Germany). For calculations of relative density (ρ/ρth), the theoretical density of WC-10Co hard alloy was taken as ρth = 14.64 g/cm3. The error margin of ρ was ±0.01 g/cm3.
Microhardness, Hv, was measured using a Struers® Duramin-5 (Struers Inc., Cleveland, OH, USA) tester under a load of 2 kg. Minimal fracture toughness factor (KIC) was determined using the Palmquist method, i.e., using the length of the longest radial crack formed in the ceramic after indentation with a Vickers pyramid, as follows: KIC = 0.016(P/c3/2)(E/Hv)1/2, where P is the load at indenter (g), c is the mean distance from the middle of indent to crack apex, and E = 570 GPa is the Young’s elastic modulus of WC-10Co hard alloy. The accuracy of Hv and KIC was ±0.2 GPa and ±0.3 Mpa·m1/2, respectively.
Prior to the investigations, the specimen surfaces were subjected to hydro-abrasive cleaning in order to remove residual graphite, and then, to mechanical grinding and polishing to remove the carbonized layer (see Appendix B). The structure and properties of the specimens were studied in the centers of the polished surfaces.

3. Results

3.1. Sintering of Submicron Powders

Figure 2a shows the microstructure of α-WC+10 wt.%Co submicron powders. The results of SEM investigations have shown the average size of α-WC particles to be R0~0.4–0.5 μm, which matches the vendor’s certificate data (Alfa-Aesar). The XRD results show that each initial composition contains hexagonal α-WC tungsten carbide and hexagonal α-Co (Figure 2c, the black line).The peaks corresponding to the W2C phase were absent in the XRD curves. In the SEM images acquired in the Z-contrast (BEC) regime, the α-Co particles are dark, and the α-WC ones are light.
Figure 3a shows the dependence of shrinkage on heating temperature L(T) for α-WC+10 wt.%Co submicron powders with various concentrations of graphite. L(T) dependencies have a regular three-stage nature, as follows: a stage of slow shrinkage (Stage I) under 800 °C; a stage of intensive shrinkage (Stage II) from 800–820 to 1000–1050 °C; and Stage III (above 1050 °C), where shrinkage intensity becomes low again. As can be seen in Figure 3, the increased concentration of free carbon leads to a shift in the L(T) dependence towards lower sintering temperatures and to a decrease in the typical temperatures T1 and T2 that correspond to ends of Stage I and II, respectively.
The relative density of specimens obtained by SPS is 99.3–99.7% of the theoretical value (Table 2).
Figure 4 and Figure 5 show images of the microstructure of the sintered hard alloys that were obtained by heating at a rate of 50 °C/min up to 1100 °C (solid-phase sintering) (Figure 4) and 1400 °C (liquid-phase sintering) (Figure 5). No dwell was made at the sintering temperature (1100, 1400 °C). The SEM results show that heating to 1400 °C leads to intensive grain growth and the formation of large abnormal grains in the structure. According to [23,39], grain growth during the liquid-phase sintering of WC-10Co alloys occurs by means of dissolution of tungsten and carbon atoms in liquid cobalt, their diffusion, and reprecipitation on the most favorably oriented crystallographic planes of tungsten monocarbide particles. Figure 4 shows that the rate of grain growth within the range of solid-phase sintering is much slower and the grains retain a near-spherical shape. An increased carbon concentration has virtually no observable effect on the growth rate of tungsten carbide particles within the range of solid-phase sintering (average grain size is ~0.5 μm) and leads to a decrease in the sizes of large (abnormal) grains within the range of liquid-phase sintering from ~10 μm at C = 0.1 wt.% to ~2–5 μm at a carbon concentration of 0.5 wt.%C. Note that the increase in the graphite content from 0.1 to 0.5 wt.% did not lead to an essential change in the volume fraction of the abnormally large grains in the liquid-phase sintering.
Figure 6 shows XRD images of specimens obtained by SPS within ranges of solid-phase (Figure 6a) and liquid-phase (Figure 6b) sintering, respectively. Analysis of the XRD results indicates that the specimens that were sintered without graphite contain α-WC phases; γ-phase, which is a solid solution of tungsten and carbon in cobalt; and η-phase, which is a cubic ternary carbide W3Co3C. The weight fraction of η-phase particles in the alloys obtained at 1100 and 1400 °C is 8 and 10 wt.%, respectively. When carbon is added, the intensity of the η-phase peaks decreases and they disappear completely with an addition of 0.2 and 0.3 wt.%C in cases of solid-phase and liquid-phase sintering, respectively.
Further studies were carried out on the WC-10 wt.%Co–0.5 wt.%C carbide alloy where an η-phase could not form, which allows for an investigation of the specific features of the high-rate shrinkage of WC-10 wt.%Co powders with a constant phase composition. The impact of the isothermal exposure temperature (from 750 °C to 1000 °C) and applied pressure (40, 70, 100 MPa) on the shrinkage in the WC-10 wt.%Co–0.5 wt.%C powder were studied.
Figure 7a shows the dependence of shrinkage in WC-10 wt.%Co–0.5 wt.%C submicron particles on the time of isothermal exposure at different temperatures. The obtained dependencies indicate that as the temperature increases, the shrinkage of submicron powders increases too. When the powders are exposed at 1000 °C for ~1.2×10³ s, shrinkage ceases, and the specimen density corresponds to the theoretical density. At 950 °C, the specimen densities increase to 100% of the theoretical density within ~(3.6–4)⋅103 s. Note that prolonged exposure at 900 °C and 850 °C result in a marked increase in density, whereas shrinkage at 750 and 800 °C after exposure for (2–3)×103 s almost ceases at its stationary value.
Figure 8 shows the dependencies of shrinkage on the sintering time at 800 °C under the conditions of a controlled abrupt increase in pressure to 40, 70, and 100 MPa. The dependencies indicate that, as the pressure increases, shrinkage and the shrinkage rate, determined as a tangent line to L(t), increase continuously. This facilitates analysis of the dependence of shrinkage rate on pressure and, in particular, the determination of the densification mechanism in submicron powders (see below).
Figure 9 shows the dependence of microhardness, Hv(C), and fracture toughness, KIC(C), on the graphite content in WC-10Co specimens obtained by solid-phase and liquid-phase sintering. Research findings show that an increase in graphite content boosts the microhardness of WC-10 alloys obtained by solid-phase sintering (a sintering temperature of 1100 °C). Adding 0.5 wt.% graphite raises an alloy’s microhardness from 17.6 to 20.9 GPa. Hv(C) dependence for specimens sintered at 1400 °C has a more complex nature: an increase in the carbon content to 0.3 wt.% results in hardness abating from 16.8 to 12.4 GPa; with a further increase in the carbon (graphite) concentration to 0.5 wt.%, microhardness grows to 15.7–15.9 GPa. Fracture toughness dependencies on carbon concentration, KIC(C), are similar in nature. Note that according to XRD findings, the carbon concentrations at which hardness and fracture toughness are minimal, correspond well to graphite concentrations, leading to the disappearance of η-phase particles.

3.2. Sintering of Nanopowders

According to the XRD phase analysis results, the nanopowder composition after the first stage of DC arc plasma synthesis consisted of several phases with the predomination of tungsten semi-carbide W2C (65 wt.%) with an addition of WC1−x (15 wt.%), α-W (12 wt.%), and graphite (3 wt.%). After annealing in hydrogen at 1000 °C, according to the XRD phase analysis results, the nanopowder composition transformed in tungsten monocarbide α-WC completely.
Figure 2b shows WC-10%wt.Co nanopowder. The average size of α-WC particles is R0~50 nm, which is close to the average particle size, Rth = 6/(Ssp×ρth) ~80 nm. The nanoparticles cluster into easily degradable conglomerates, the presence of which is the apparent cause of the divergence between the experimental and theoretical R0 and Rth values. The XRD results show (Figure 2c, the red line) that the powder composition contains α-WC tungsten monocarbide and two varieties of cobalt with cubic (α-phase) and hexagonal (β-phase) lattices. There were no peaks that would correspond to phases W2C, β-WC, α-W, and WO3 that are present in tungsten carbide nanopowders in cases of suboptimal synthesis conditions [82,83,90]. The α-WC tungsten monocarbide peaks are broadened relative to submicron powders (Figure 2c); there is an overlap of the XRD peaks corresponding to α-WC phase in the area of larger diffraction angles. Note that the peaks of α-WC phase in nanopowders are non-symmetrical and broadened in the area of larger diffraction angles 2Θ, which, according to the Wulff–Bragg’s condition (2dhkl×sinΘ = mλ), we consider to be an indication of a decreased interplanar distance, dhkl, in the near-surface area of α-WC nanoparticles.
To WC-10%Co nanopowder,0.5, 1, and 1.5 wt.% of graphite was admixed. The specimens were then heated at 50 °C/min up to 1100 °C. The shrinkage curves L(T) for WC-10%Co nanopowders with various concentrations of graphite are shown in Figure 3b. Dependencies L(T) for plasma-chemical nanopowders, as well as for submicron powders exhibit three stages, whereas the value of shrinkage, L, in nanopowders is considerably higher than the shrinkage in submicron powders under similar temperatures and time conditions of heating. Note that an increased concentration of graphite decreases shrinkage and lowers the regular temperature of the sintering stage transitions (Stage I → Stage II, Stage II → Stage III), i.e., it results in a shift of the shrinkage curves L(T) towards lower heating temperatures.
Figure 10 shows XRD images of UFG WC-10Co hard alloys obtained by the SPS of plasma-chemical nanopowders with various concentrations of carbon. Analysis of the XRD data shows that the specimen with 0.5 wt.% graphite has both α-WC and γ-phases based on β-Co as well as the η-phase, the fraction of which is fη ~ 33 wt.%. As the concentration of carbon (graphite) increases, the intensity of the η-phase peaks decreases, and they disappear completely at 1.5 wt.%C.Thus, it can be assumed that in order to inhibit the formation of η-phase particles during the SPS of plasma-chemical nanopowders, a much bigger graphite concentration is required than during the SPS of WC-10 wt.%Co submicron powders. This effect stems from the specific nature of α-WC nanopowders obtained by DC arc thermal plasma synthesis—as shown in [59,60,73,82,88], nanopowders obtained this way have an elevated concentration of oxygen adsorbed on the surface of nanoparticles. (According to chemical analysis results, WC-10%Co nanopowders obtained by DC arc plasma synthesis contain 0.75 wt.% oxygen, which significantly exceeds the oxygen concentration in submicron powders (0.14 wt.%)). When heating the WC nanopowders, adsorbed oxygen reacts with carbon and forms CO2 [59,60]. This results in a decrease in the carbon concentration in α-WC nanopowders and facilitates the formation of η-phase particles in the WC-Co system [3,5,81,91].
Figure 11 shows photographic images of UFG hard alloys obtained by SPS from WC-10Co plasma-chemical nanopowders with various concentrations of graphite. When analyzing the images, it can be noted that all of the specimens exhibit abnormal growth of tungsten carbide grains. The SEM results show that the specimen with 1.5 wt.% graphite has a relatively uniform UFG matrix (a grain size under 100 nm), but also large abnormal grains (an average size of up to 1–2 μm). Note that increased graphite concentration in plasma-chemical nanopowders leads to the increased size of abnormally large grains, which have a partially faceted structure after SPS at 1100 °C.
A comparison of Figure 4 and Figure 11 shows that the mean grain sizes in the UFG hard alloys sintered from the “core WC–shell Co” nanoparticles were less than the ones in the hard alloys sintered from the submicron WC+10%Co powders obtained by the usual mixing of WC and Co. However, it is worth noting that the microstructure of the UFG hard alloys obtained from the WC-Co nanoparticles was less uniform than the ones in the hard alloys sintered from the factory-made submicron powders. One of the origins of this, in our opinion, may be the presence of micro-additives of V in the factory-made submicron WC powders (see Table 1).
The density of the specimens obtained by SPS from nanopowders with 0.5 wt.% of graphite is close to the theoretical density of the WC-10 wt.%Co hard alloy (Table 2). When the graphite concentration is increased to 1.5 wt.%, there is a decrease in density to 96.3%; the specimen structure contains individual large pores of micron size (marked with a dashed line in Figure 11c). (Note: the difference of the large pores in Figure 11c from the areas of cobalt in Figure 11a was identified by comparing polished surfaces with a different-contrast SEM and EDS that is capable of determining a local concentration of cobalt).
Research into mechanical properties testifies that an increase in a graphite concentration from 0.5 to 1.5% causes no significant changes in the microhardness of the UFG hard alloy WC-10Co (Hv ~19.3–19.5 GPa), but leads to the minimal fracture toughness coefficient, KIC, growing from 5.7 to 7.7–8.0 MPa×m1/2 (Table 3). Thus, the hardness of UFG hard alloys sintered from nanopowders appears to be somewhat less than that of alloys obtained from submicron powders (Hv = 17.6–20.9 GPa). This result is rather unexpected since it is generally assumed that the hardness of WC-Co alloys is growing as the average grain size is decreasing [92]. We reckon that the lower hardness of UFG alloys could be explained by the higher content of the fraction of η-phase particles in the hard alloys sintered from nanopowders (Table 2). The higher fracture toughness of UFG hard alloys compared to that of fine-grained alloys sintered from submicron powders (KIC = 4.2–5.9 MPa×m1/2, Figure 9) is apparently due to the smaller grains in UFG alloys (Table 3).This fact leads to an increase in the distance that the fracture needs to pass before reaching its critical size, as well as to an increase in the number of obstacles (grain boundaries) that the micro-fracture encounters on its way.

4. Discussion

4.1. Analysis of Kinetics of Isothermal Sintering of Submicron Powders

The analysis of kinetics at the initial stage of sintering was carried out with the creep model that was selected based on the assumptions from [93,94,95,96]. It has been traditionally assumed that the key densification mechanism in WC-Co powders at the initial stage of densification is the creep of the γ-phase based on cobalt. Note that currently there is no universal view on the mechanisms of cobalt creep during sintering of WC-Co hard alloys: it is stated in [95] that the creep of cubic cobalt has a dislocations-based nature, it is demonstrated in [96] that the creep is governed by bulk diffusion, and [72] proposes a supposition that the creep is driven by the Laplace force.
Suppose that at the initial stage of densification, the creep rate ( ε ˙ ) is proportional to the shrinkage rate (S), the value of which can be calculated using the angle of dependence of shrinkage on the time of isothermal exposure L(t) for the established stage (Figure 7a). According to the equation of power law creep, ε ˙ = A D / b 2 G Ω / k T σ / G n (see Equation (1)) [97,98]. Note that a preliminary conclusion on the mechanism of creep can be made based on the value of activation energy, Q, and coefficient n in the power law creep equation [98].
An estimation of the activation energy can be made using the angle of dependence ln( ε ˙ )-Tm/T, where Tm is the melting point (Figure 7b). The calculated activation energy for WC-10 wt.%Co–0.5 wt.%C submicron powders is 7 ± 2 kTm (~78 kJ/mol), which is close to the activation energy of grain-boundary diffusion in cobalt (~90 kJ/mol) [99].
The coefficient n in the power creep equation was determined by analyzing the data on the impact of pressure on the shrinkage rate (Figure 8). The shrinkage rate was determined using the angle of dependence L(t) at the stage of stationary flow (at σ = const). The value of n can be determined using the angle of dependence of the creep rate on pressure represented in a logarithmic coordinate system, ln( ε ˙ )—ln(σ/G). For WC-10 wt.%Co–0.5 wt.%C submicron powders, the coefficient value is n = 1, which, according to [97,98], corresponds to diffusion creep. This type of creep can be governed by bulk (Nabarro–Herring creep) or grain-boundary (Coble creep) diffusion.
The closeness between the values of creep activation energy and grain-boundary diffusion activation energy in cobalt suggests that the densification kinetics in UFG WC-10Co hard alloys at the initial stage of SPS is determined by the intensity of diffusion creep of cobalt according to Coble.

4.2. Analysis of the Kinetics of Non-Isothermal Sintering of Nano- and Submicron Powders

Analysis of the kinetics of non-isothermal sintering was performed using the Young–Cutler model [100], which described the initial stage of non-isothermal sintering of spherical particles in the conditions of simultaneous bulk and grain-boundary diffusion, as well as plastic deformation, as follows:
ε 2 ε / t = 2.63 γ Ω D v ε / k T d 3 + 0.7 γ Ω b D b / k T d 4 + A p ε 2 D / k T ,
where ε is shrinkage, t is time, γ is free energy, Dv is the bulk diffusion coefficient, Db is the grain-boundary diffusion coefficient, d is the grain size, p is pressure, and D is the coefficient of diffusion during plastic deformation. According to [100,101], the angle of dependence of shrinkage on temperature, represented in coordinates ln(T∂ε/∂T)—Tm/T, corresponds to the activation energy of non-isothermal sintering. Figure 12 shows that dependencies ln(T∂ε/∂T)—Tm/T have two stages, with the maximum corresponding to the heating temperature of 900–1000 °C. Note that the presence of a maximum in dependence ln(T∂ε/∂T)—Tm/T indicates a change of the powder densification mechanism during SPS [101].
Table 4 shows activation energies at the first stage of non-isothermal SPS (Qs(I)). Analysis of the results indicates that the dispersion of the initial powder and the concentration of graphite in the initial mixtures have no observable effect on the activation energy at the first stage of the non-isothermal SPS of WC-10%Co hard alloys. Note that the obtained value (Qs(I) ~ 8–11 kTm) is close to the activation energy calculated in §4.1. This provides grounds to conclude that at lower temperatures (below ~900–1000 °C) the kinetics of the SPS of nano- and submicron WC-10%Co powders is governed by the intensity of creep of the readily-fusible γ-phase based on cobalt, which is in good concordance with the data in [102,103,104].
At higher heating temperatures, the angle of dependence ln(∂ε/∂T)—Tm/T (Figure 12) goes negative and estimating the SPS activation energy requires a different approach.
According to [105,106], an estimation of the sintering activation energy can be made with the model of diffusion-based dissolution of pores, which are found near grain boundaries in UFG materials. In order to calculate the activation energy, the shrinkage value is first converted into the densification value using the following formula: ρ(T) = ρexp Lmax/(L0−L(T)), where L0 is the initial press height corresponding to 50% of theoretical density, Lmax is the full specimen shrinkage after sintering, and ρexp is the experimentally measured density of the specimen (hydrostatic weighing). The activation energy of the second stage of non-isothermal sintering, Qs(II), is determined using the angle of dependence ρ(T)/ρth represented in coordinates ln(ln(α × ρ/ρth/(ρ/ρth−1))—Tm/T, where α = 0.5 is the press shrinkage coefficient (Figure 13).
Analysis of the data in Table 4 shows that an increased concentration of graphite in WC-10 wt.%Co composition leads to a decrease in the activation energy, Qs(II), from 35 to 25 kTm for submicron powders and from 25 to 12 kTm for nanopowder compositions. The obtained values correlate with the data in [72,94] and are close to the activation energies of the grain-boundary diffusion of cobalt [99]. Note that a decreased value of activation energy, Qs(II), due to an increased carbon concentration is in concordance with the shift of the shrinkage curves L(T) towards lower heating temperatures (Figure 3 and Figure 13).
On to the discussion of the change of the densification mechanism in nano- and submicron WC-10 wt.%Co powders at the stage of non-isothermal heating during SPS, we believe that the change of the sintering mechanism may be caused by the onset ofthe η-phase particles’ formation. The presence of these particles has a considerable effect on the concentration of tungsten and carbon atoms in γ-phase and, consequentially, on the intensity of diffusion in the hard alloy [107].
Since the temperature of transition between SPS mechanisms (900–1000 °C) is too low for the onset of intensive diffusion-type processes in tungsten carbide, it can be assumed that the second stage of non-isothermal sintering is also governed by the intensity of the diffusion creep of cobalt. In this view, a decrease in the SPS activation energy, Qs(II), along with an increase in carbon concentration (Table 4) is caused by the onset of the dissolution of tungsten and carbon atoms in cubic cobalt within this temperature range [1,96,107]. This results in a higher concentration of carbon and tungsten atoms in cobalt and, consequently, in an increased intensity of their diffusion-based mass transfer through γ-phase, as follows: I = −D × gradCi, where gradCi is the gradient of diffusion substance concentration (Ci). A higher carbon concentration decreases the solubility of tungsten in cobalt and increases the stability of tungsten monocarbide — decreases the tendency of α-WC particles, which have a low homogeneity potential on the W-C diagram, to degrade into graphite and W2C carbide, which leads to the formation of η-phase upon interaction with cobalt.
The proposed supposition is indirectly corroborated by the XRD results and the cobalt peak in the WC-10 wt.%Co–0.5 wt.%C specimens. Analysis of the data in Figure 14a shows that as carbon concentration increases, the cobalt peak (111) β-Co shifts towards larger diffraction angles 2Θ. According to the Wulff–Bragg’s condition (2dhkl × sinΘ = mλ), this corresponds to a decreased interplanar distance, dhkl, and is linked to a decreased number of tungsten atoms in cobalt, the atomic radius of which (rW = 0.141Å) is larger than the size of cobalt atoms (rCo = 0.125Å), and to an increased concentration of carbon in cobalt (rC = 0.077Å).
Note that as the SPS temperature increases, the XRD peak (111) β-Co shifts towards the lower diffraction angles 2Θ (Figure 14b), which indicates an increased concentration of tungsten atoms in γ-phase. This result conforms with the known effect of an increased solubility limit of doping atoms at higher temperatures [1,3,4,5,6,103].
Note also that according to [98], the precipitation of second-phase particles leads to an increase in creep limit and creep activation energy. This means that the second reason for the decreased sintering activation energy due to an increased carbon concentration (Table 4), may be the decreased mass fraction of η-phase particles (Table 2).

5. Conclusions

It has been demonstrated that, during SPS, the temperature dependence of shrinkage in nano- and submicron α-WC+10 wt.%Co powders has three stages: little densification at “lower” heating temperatures (Stage I), intensive densification at “mid-range” SPS temperatures (Stage II), and, again, less intensive shrinkage at “higher” sintering temperatures (Stage III).
It has been demonstrated that an increased concentration of graphite leads to a shift of the shrinkage curves towards lower heating temperatures, to a lower fraction of η-phase particles, and to a decreased size of abnormally large grains in specimens of WC-10Co hard alloys obtained by liquid-phase SPS. Solid-phase SPS was used to obtain specimens of WC-10Co hard alloys where a uniform UFG structure forms at graphite concentrations above 0.2–0.3 wt.%.
It has been established that the densification mechanism at the first stage of heating is plastic flow, the intensity of which is limited by the intensity of the diffusion creep of cobalt. An increased concentration of free carbon in the initial WC-10Co mixture has no effect on the intensity of densification and, by extension, on the SPS activation energy at “mid-range” temperatures. It has been demonstrated that the activation energies of isothermal and non-isothermal sintering in the “mid-range” temperatures are close to the activation energy of grain-boundary diffusion in cobalt.
It has been demonstrated that, at higher temperatures, the activation energy of non-isothermal sintering decreases monotonically as the concentration of graphite in an WC-10Co hard alloy increases. XRD analysis seems to show that the cause of the decreased SPS activation energy may be the change in the concentration of tungsten and carbon atoms in cobalt.
In the solid state SPS, the temperature of finish of shrinkage for the plasma chemically synthesized α-WC+10 wt.%Co nanopowders was 25–50 °C lower than the one for the submicron industrial powders. In the plasma chemically synthesized nanopowders with an increased carbon content, an increased volume fraction of the η-particles and, hence, higher sintering activation energies were observed. The introduction of more than 1 wt.% of graphite into the plasma chemically synthesized nanopowders leads to the disappearance of the η-phase particles and to the reduction in the sintering activation energy down to a value of Qsthat is comparable to the one of the submicron powder compositions WC+10 wt.%Co.

Author Contributions

Methodology, A.N. and V.C.; formal analysis, A.N. and V.C.; investigation, E.L., N.M., M.B., Y.B., N.I., P.A., K.S. and A.M.; data curation, E.L., A.N. and N.M.; writing—original draft preparation, A.N. and V.C.; writing—review and editing, A.N. and V.C.; supervision, V.C.; project administration, N.M.; funding acquisition, N.M. All authors have read and agreed to the published version of the manuscript.

Funding

This research was funded by Russian Science Foundation, grant number 18-73-10177.

Institutional Review Board Statement

Not applicable.

Informed Consent Statement

Not applicable.

Data Availability Statement

Not applicable.

Conflicts of Interest

The authors declare no conflict of interest.

Appendix A

Table A1. Characteristics of specimens of fine-grained hard alloys WC-(8-12)Co obtained by SPS. Overview of the literature data.
Ref.Hard AlloySintering Mode (1)Characteristics of Hard AlloysInitial Powder
V,
°C/min
P,
MPa
Ts,
°C
ts,
min
ρ/ρth,
%
XRD Phase Compositiond,
μm
Hv,
GPa
KIC,
MPa⋅m1/2
[13]WC-11Co2002511005~97No data0.7792.5
HRA
-544 nm (7)
[14]WC-8Co~25–3010–251150–12005–18100No data0.35--0.12–0.15 μm (7)
[15]WC-8Co100060115065 s98.4WC, Co0.4218.8110.5 (3)<0.4 μm (7)
WC-10Co98.90.3817.5611.6 (3)
WC-12Co99.20.36517.3512.2 (3)
[16]WC-10CoNo data301200598.72WC, W2C,
Co
0.717.19-0.491% O
301300599.34~115.31-
[17]WC-11Co10040125010100No data0.5418.311.6200 nm (7), 0.11%Cfree,
0.38%O.
WC-11Co-0.3VC99.8-18.512.3
WC-11Co-0.5VC99.90.3819.011.5
WC-11Co-0.7VC99.60.3817.010.5
[18]WC-12Co600601100597No data~122.515.3 (3)40–80 nm (7)
120099~122.011.9 (3)
[19]WC-10Co10010010001099No data~0.3~18~1240–100 nm (7)
[20]WC-11Co100401200597.0No data----
WC-11Co-0.3VC97.8---
WC-11Co-0.5VC99.5---
WC-11Co-0.2Cr3C297.6---
WC-11Co-0.4Cr3C297.5---
[21]WC-12Co1505011001099.89No data0.8014.510.90.42 μm (7), 5.32–5.36%C, 0.225%O
WC-12Co-0.5VC97.660.5514.910.86
WC-12Co-1VC95.940.4715.711.42
WC-12Co-1.5VC90.08-15.8711.43
WC-12Co-0.75VC-0.25Cr3C296.640.4915.912.1
[22]WC-10Co (2)66011801014.57 g/cm3No data0.4816.4313.10.8 μm (7)
[23]WC-11Co100401200599.6No data---WC: 0.25 μm, 0.38%O, 0.11%Cfree;
Co: 60 nm, 0.32%O,
Cr3C2: 3.6 μm, 0.22%O, 0.18%Cfree;
VC: 2.94 μm, 0.24%O, 0.75%Cfree
WC-11Co-0.3VC99.7-18.3~12
WC-11Co-0.5VC99.8-18.5~11.5
WC-11Co-0.7VC99.4---
WC-11Co-0.2Cr3C299.30.48--
WC-11Co-0.4Cr3C298.80.456--
WC-11Co-0.6Cr3C298.60.435--
WC-11Co-0.3VC-0.2Cr3C299.50.4418.0~13
WC-11Co-0.3VC-0.4Cr3C298.80.36618.6~12.2
WC-11Co-0.3VC-0.6Cr3C298.80.54518.1~12.8
WC-11Co-0.5VC-0.2Cr3C299.60.4118.6~16.2
WC-11Co-0.5VC-0.4Cr3C299.60.3519.2~14.2
WC-11Co-0.5VC-0.6Cr3C297.50.48817.5~14
WC-11Co-0.7VC-0.2Cr3C297.20.55--
WC-11Co-0.7VC-0.4Cr3C2-0.523--
WC-11Co-0.7VC-0.6Cr3C298.0---
[24]WC-12Co100601240--No data0.2815.69~9.4 (4)0.18 μm (7), 6.16%C, 0.09%Cfree
WC-12Co-0.9NbC0.26~16.4~8.8 (4)
WC-12Co-0.9Cr3C20.22~16.5~10.1 (4)
WC-12Co-0.9VC0.1817.26~9.2 (4)
[25]WC-10Co-60115010~98.7No data~0.1787
HRA
~60.2 μm (7). Co: 28 nm
~97.8~0.2394.5 HRA13.50.2 μm (7)
Co: 45 μm
[26]WC-12Co100601240298.9No data0.2715.5-0.18 μm(7), 6.16%C, 0.09%Cfree
WC-12Co-0.9VC98.50.17~17-
[27]WC-10Co-301200-95.7No data---200 nm (7)
[28]WC-12Co10010011005100WC, Co, W3Co3C, W6Co6C~0.30~18.8~9.0 (4)91 nm (7)
100~0.37~18.3~8.9 (4)47 nm (7)
100~0.39~17.8~9.3 (4)127 nm (7)
[29]WC-12Co-0.8C100801100599.94WC, Co0.216~18.3~10.6 (4)40–80 nm(7)
WC-12Co-0.8C-1Cr3C299.790.207~18.6~10.4 (4)
WC-12Co-0.8C-1VC98.950.154~20~10 (4)
[30]WC-12Co-0.8C100801100599.94No data0.21620.49.130–80 nm (7)
WC-12Co-0.8C-1Cr3C299.740.20720.19.3
WC-12Co-0.8C-1VC98.950.15419.610.4
WC-12Co-0.8C-0.5Cr3C2–0.5VC99.150.19019.89.5
WC-12Co-0.8C95.560.24820.38.5
WC-12Co-0.8C-0.5Cr3C298.180.24019.98.8
WC-12Co-0.8C-0.5VC97.990.23519.49.0
[31]WC-12Co100501150699.8No data1.0214.1710.9
WC-12Co-1.3Y2O399.70.9814.4711.9
[32]WC-10Co-
-0.2VC-0.8Cr3C2
SPS1006011601014.54
g/cm3
WC-Co, Co6W6C0.3517.0712.190 nm (7), 5.61%C,0.19%O, 0.19%Cfree
HIP8-14206014.50
g/cm3
0.5015.4313.6
[33]WC-10Co100601150098.0WC-Co0.08520.511.13-
[34]WC-10Co-5TiC85–9057.3120013100WC, Co,
TiC
1.214.84-0.45–0.9 μm (+ 5% 0.1–0.15μm) (7)
[35,36]WC-8Co100701250514.4
g/cm3
WC, Co0.2021.110.460 nm (7). 6.13%C, 0.09%O
[37]WC-3Co400801400-97.1WC, Co-19.48.8-
WC-6Co97.6-17.99.1
WC-9Co98.1-16.49.8
[38,39,40]WC-4Co100301300597.6No data0.22723.2010.45 (5)60 nm (7)
WC-6Co97.80.25821.4711.2 (5)
WC-8Co98.00.31419.8712.27 (5)
WC-10Co98.50.35618.3213.16 (5)
WC-12Co98.60.36217.7913.69 (5)
WC-14Co98.60.37417.4815.46 (5)
WC-8Co-0.2VC-1CBN125098.30.24620.8113.01 (5)
[41]WC-8Co1007013505-WC, Co0.2819.711.5 (6)60 nm (7)
WC-8Co-0.4VC-20.89.7 (6)
WC-8Co-0.4Cr3C2-20.210.0 (6)
WC-8Co-0.4TaC-20.311.3 (6)
WC-8Co-0.8VC0.1721.89.4 (6)
WC-8Co-0.8Cr3C20.2320.210.4 (6)
WC-8Co-0.8TaC0.2519.910.6 (6)
WC-8Co-0.4Cr3C2-0.4VC0.2021.210.4 (6)
WC-8Co-0.4%TaC-0.4VC0.2220.810.3 (6)
WC-8Co-0.4TaC-0.4Cr3C2-20.610.9 (6)
[42]WC-8Co100401300599.42WC, Co,
Al2O3
1.116.2~121.54 μm (7), RAl2O3 = 20 nm
WC-8Co-0.25Al2O399.181.016.9~12.2
WC-8Co-0.5Al2O399.040.917.16~12.95
WC-8Co-0.75Al2O398.980.9516.9~12.1
WC-8Co-1Al2O398.881.016.65~11.6
[43]WC-8Co100501300597.2WC-18.2610.63 (6)2.71 μm (7)
[44]WC-10Co+graphite (3.25%C)-301050398.5WC, Co0.06123.5612.5 (6)-
[45]WC-9Co1004512001093.9No data-14.11-3.5μm (7)
50125092.8-14.95-0.1 μm (7)
[46]WC-10Co-0.2VC-1CBN100301300598.3WC, Co,
VC, cBN
~120.1712.19 (5)60 nm (7)
WC-10Co-0.2VC-5CBN96.3-18.3311.93 (5)
WC-10Co-0.2VC-9CBN89.1-11.5810.25 (5)
WC-10Co-0.5VC-1CBN97.4-19.8711.82 (5)
WC-10Co-0.5VC-5CBN94.1-16.2611.48 (5)
WC-10Co-0.5VC-9CBN90.0-11.1110.13 (5)
WC-10Co-0.8VC-1CBN96.8-20.4811.78 (5)
WC-10Co-0.8VC-5CBN94.0-15.2210.34 (5)
WC-10Co-0.8VC-9CBN89.3-10.759.80 (5)
[47]WC-8%Co1004012505 WC, Co 60 nm (7)
- ultrasonic vibration method99.10.2818.811.4 (6)
- ball-milling method (12 h)97.10.3518.111.7 (6)
- ball-milling method (24 h)94.60.4217.710.5 (6)
[48]WC-10Co505013001099.27WC, Co-13.012.97<1 μm (7)
[49]WC-8CoSPS-5012005-No data~113.516.46-
Sinter-HIP61500--~0.518.7312.09
[50]WC-12Co1005012005~98.1WC, Co,
CeO2
0.3418.712.5200 nm (7), RCeO2 = 10 nm
0.11%Cfree
WC-12Co-0.05CeO2~98.60.2719.0513.4
WC-12Co-0.1CeO2~99.50.2219.9814.4
WC-12Co-0.3CeO2~98.20.2319.6214.3
WC-12Co-0.6CeO2~98.00.2319.112.9
[51]WC-12Co100801100599.9WC, Co0.21618.47-40–80 nm (7)
WC-12Co-1Cr3C299.80.20718.72-
WC-12Co-0.5Cr3C2-0.5VC99.20.1919.23-
WC-12Co-1VC98.90.15419.98-
[52]WC-10Co-0.86VC1006011500-WC, Co, VC, Co3W3C0.12719.610.2-
WC-10Co-1.15VC0.12319.39.9
WC-10Co-2VC0.10220.29.7
WC-10Co-5VC0.09721.09.0
WC-10Co-10VC0.09718.468.0
[53]WC-12Co5079.61220396.9WC, Co0.192~15~9SBET = 3.932m2/g (7)
10063.71250597.10.182~15.4~9
40079.61300195.50.194~13.5~9.2
[54]WC-12%Co--1250599.8No data0.19516.710.6-
[55]WC-9Co-0.6VC100501200-98.83No data0.04213.7613.03.5 μm (7)
WC-9Co-0.6Cr3C2120099.150.03614.5912.3
WC-9Co-0.6VC120097.470.028.5211.2310 nm (7)
130098.430.0426.0510.25
WC-9Co-0.6Cr3C2120097.540.0198.09.0
130098.360.03914.4513.15
WC-12Co-0.6VC120098.350.0379.579.41
130098.780.06514.328.53
WC-12Co-0.6Cr3C2120097.550.0713.1210.15
130099.130.07115.29.23
[56]WC-5Co-5014001098No data-13.71-300 nm (7), “core WC—shell Co”
145098-12.78-
WC-10Co- 14001097-12.72-
145096-13.49-
[57]WC-12Co1006012501098.2WC, Co0.22-
0.591
19.8-
23.6
--
[58]WC-12Co106501130513.8
g/cm3
WC, Co2.2213.1914.62.3 μm (7)
(1) SPS mode: V—heating rate, P—pressure, Ts—sintering temperature, ts—holding time; (2) Pretreatment at 1300 °C with SPS fracture toughness (K1C);(3)—Anstis formula; (4)—Shettly formula; (5)—Charles and Evan formula; (6)—Schubert formula (the rest values in the table use calculations according to the Palmquist formula);(7)—mean sizes of initial WC particles.

Appendix B

Investigation of Uniformity of the Phase Composition of the WC-10Co Hard Alloys Obtained by SPS

Earlier, an intensive carbonization of the surfaces of specimens from hard alloys [86], alloys Ni-W [78,79], and binderless tungsten carbide [87] during SPS was reported. In some works, some differences in the properties of the central parts of the hard alloy specimens and of the side ones were reported [108].
The task of the investigation was to find the depth distributions of the η-phase particles in the WC-10%Co hard alloy specimens. The specimens were obtained by sintering the plasma chemically synthesized WC+10% Co nanopowders without an addition of graphite. A detailed description of the plasma chemically synthesized nanopowders is given in the Materials and Methods section. The sintering temperature was 1050 °C, the heating rate was 100 °C/min, and the pressure was 70 MPa. In the course of sintering specimens 2 and 3, a degassing at 850℃for 10 min was performed in order to remove the oxygen contamination from the nanopowder particle surfaces. Specimen 1 was sintered without degassing. The initial height of the sintered specimens was 3 mm. The graphite punches and mold were protected by graphite washers and by graphite paper for multiple use. A partial “baking” of the graphite washers to the specimen surfaces took place during the course of sintering. To remove residual graphite and to achieve plane-parallel surfaces on the specimens, a mechanical grinding with diamond paste was performed. A total of ~300 μm were removed. A sequential polishing of the specimens’ surfaces with diamond paste down to a roughness level of ~1 μm was performed after each grinding cycle. On average, 30–60 μm per single mechanical processing cycle were removed from the sintered specimens’ surfaces. The specimens’ heights were measured using a micrometer.
The layer-by-layer XRD phase analysis was performed on the top surfaces (from the viewpoint of the positioning of the specimen in the Dr. Sinter® model SPS-625 setup) of the sintered specimens (Figure A1). The calculated “diffraction depth” of the CuKα radiation for the investigated specimens of the WC–Co system did not exceed 7 μm. Therefore, the removing of the layer 30–60μm in thickness was enough to study the specimens’ layers, which did not contribute to the results of the previous stage unambiguously. In the course of the investigations, the parameters of the (101) XRD peaks for α-WC, (111) for β-Co, and (511) for the η-phase (Co3W3C) were analyzed using the corundum number method.
Figure A1. General view (a) and representation of a specimen’s positioning in the Dr. Sinter® model SPS-625 setup (b).
Ceramics 04 00025 g0a1
The results of the XRD investigations of specimens are presented in Figure A2. The labels at the XRD curves match the stages of the layer-by-layer analysis. Label 0 marks the XRD curve of the surface layer of the specimen before mechanical processing, labels 1 and 2 marks the XRD curves of the surface after the two-stage removal of residual graphite, and label 6 marks the XRD curve from the layer closest to the specimen center (at a depth of ~ 550 μm from the surface).
Figure A2. Fragments of the XRD curves from the WC-10Co hard alloy specimens after successive mechanical grinding of the surfaces: (a) the specimen sintered without degassing; (b,c) the specimens sintered with degassing at 850 °C for 10 min.
Ceramics 04 00025 g0a2aCeramics 04 00025 g0a2b
The analysis of the XRD curves presented in Figure A2 has shown the intensity of the (111) β-Co peak to increase with the increasing depth of the removed layer (at the transition from the specimen surface to its center). Starting from the third stage of surface processing (corresponding to the removed layer with a thickness of ~350 μm), the “traces” of the η-phase composed of Co3W3C were observed in the range of expected peaks. However, the intensity of these peaks did not match the 3σ criterion (i.e., did not exceed the triple noise magnitude). At the fourth stage of processing(matching the removed layer with a thickness of ~400 μm), the intensity of the (511) XRD peak from the η-phase (Co3W3C) increased drastically (Figure A2).
To determine the depth distributions of the η-phase in the investigated specimens, the ratios of the intensities of the analytical XRD peaks of the η-phase (Co3W3C) and the α-WC one were plotted vs. the total thicknesses of the removed layers (Figure A3a). On the basis of these data, the dependencies of the mass fractions of the η-phase (Co3W3C) on the removed layer’s thickness were calculated using the corundum number method (Figure A3b, Table A2).
Table A2. The mass fraction of the η-phase in the WC-10Co hard alloy specimens obtained by SPS subject to the removed layer thickness.
Processing
Stage
Depth from the Surface L, μmFraction of the η-Phase (Co3W3C), % Mass
Specimen #1Specimen #2Specimen #3
00000
1150000
2300000
3340“Traces” of η-phase detected
438012.7 ± 0.812.1 ± 0.715.2 ± 0.9
544017.5 ± 0.913.7 ± 0.816.6 ± 0.9
650017.7 ± 0.919.8 ± 0.918.2 ± 0.9
One can see from Figure A3b and from Table A2 the mass fraction of the η-phase (Co3W3C) to increase abruptly from 0 up to ~12–15% mass at a depth of ~400 μm from the specimens’ surfaces. Starting from a depth of ~440 μm, the mass fraction of the η-phase saturated. The calculations according to the corundum number method have shown this value to reach 18 ± 1% mass for the investigated specimens. Unfortunately, the mechanical grinding technique employed did not allow for the performance of further investigations since the thicknesses of the specimens reached the minimum values, and the microcracks arose on the specimen surfaces at further polishing.
Thus far, using layer-by-layer XRD phase analysis, we have found the phase composition of the specimens to be nonuniform. The η-phase particles affecting the mechanical properties of the hard alloy negatively arose at a depth of >100 μm, and the concentration of these ones saturated (at the value ~18 ± 1% mass) at a depth of >400 μm. This indirectly confirms the hypothesis of the carbon diffusion from the graphite punches contacting the sintered specimen surfaces and allows expanding the spectrum of parameters affecting the SPS process of the hard alloys.
Figure A3. Depth distributions of the ratio Iη (511)/Iα-WC (111)(a) and the mass fraction of the η-phase particles (b) in the WC-10% Co hard alloy specimens: line (1)—without degassing; lines (2) and (3)—the specimens sintered with degassing at 850 °C for 10 min.
Ceramics 04 00025 g0a3
In conclusion, it is worth noting that such a high carbon diffusion intensity when sintering tungsten carbide—up to ~400–500 μm in depth at 105 °C—is unusual. As it has been shown in [109], the typical diffusion depth of carbon 14C in dense tungsten carbide does not exceed several microns at temperatures over 2000 °C. The exact physico-chemical origin of such an intensive diffusion is not clear at present, and this effect needs a thorough investigation. In our opinion, the origin of the effect of abnormal carbon diffusion in tungsten carbide can be, first, the formation of a considerable gradient of carbon concentration ΔC between the mold wall and the central part of a specimen when sintering in a graphite mold. This should lead to a drastic increase in the carbon flux intensity from the graphite mold into the specimen surface because of Fick’s equation. A change of the mechanism of carbon diffusion—from the diffusion in the crystal lattice of α-WC to diffusion along the grain boundaries in the ultrafine grained tungsten carbide—may be the second probable origin of the accelerated carbon diffusion. Since the grain boundary diffusion coefficient, Db, is much higher than the one in the crystal lattice, Dv, [109,110], one can expect more intensive carbon diffusion from the surface towards the central part of the hard alloy specimen.
A detailed investigation of the physico-chemical nature of the effect of the abnormal acceleration of carbon diffusion will be the subject of our further work. From the viewpoint of the tasks of the present paper, it is worth noting that in order to obtain correct information on the phase composition of the UFG WC-10Co hard alloy specimens, it is necessary to perform the mechanical grinding and polishing of the specimen surfaces not less than 450–500 μm in depth.

References

  1. Kurlov, A.S.; Gusev, A. Tungsten Carbides. Structure, Properties and Application in Hardmetals; Springer: Cham, Switzerland, 2013; p. 242. [Google Scholar]
  2. Loshak, M.G. Strength and Durability of Hard Alloys; Naukova Dumka: Kiev, Ukraine, 1984; p. 328. (In Russian) [Google Scholar]
  3. Panov, V.S.; Chuvilin, A.M. Technology and Properties of Sintered Hard Alloys and Their Products; MISIS: Moscow, Russia, 2001; p. 428. (In Russian) [Google Scholar]
  4. Upadhyaya, G.S. Cemented Tungsten Carbide. Production, Properties, and Testing; William Andrew Inc.: Norwich, NY, USA, 1998; p. 420. [Google Scholar]
  5. Fal’kovskiy, V.A.; Klyachko, L.I. Hard Alloys; Ore and Metals: Moscow, Russia, 2005; p. 413. (In Russian) [Google Scholar]
  6. García, J.; Ciprés, V.C.; Blomqvist, A.; Kaplan, B. Cemented carbide microstructures: A review. Int. J. Refract. Met. Hard Mater. 2019, 80, 40–68. [Google Scholar] [CrossRef]
  7. Leichtfried, G.; Sauthof, G.; Spriggs, G.E. Refractory, Hard and Inter.-Metallic Materials; Springer: Berlin/Heidelberg, Germany, 2002; p. 267. [Google Scholar]
  8. Kieffer, R.; Benesovsky, F. Hartmetalle; Springer: Vienna, Austria, 1965; p. 198. [Google Scholar]
  9. Konyashin, I.; Klyachko, L. History of cemented carbides in the Soviet Union. Int. J. Refract. Met. Hard Mater. 2015, 49, 9–26. [Google Scholar] [CrossRef]
  10. Panov, V.S. Nanostructured Sintered WC–Co Hard Metals (Review). Powder Met. Met. Ceram. 2015, 53, 643–654. [Google Scholar] [CrossRef]
  11. Konyashin, I.; Ries, B.; Hlawatschek, S.; Mazilkin, A. Novel industrial hardmetals for mining, construction and wear applications. Int. J. Refract. Met. Hard Mater. 2018, 71, 357–365. [Google Scholar] [CrossRef]
  12. Ortner, H.M.; Ettmayer, P.; Kolaska, H. The history of the technological progress of hardmetals. Int. J. Refract. Met. Hard Mater. 2014, 44, 148–159. [Google Scholar] [CrossRef]
  13. Jia, C.-C.; Tang, H.; Mei, X.-Z.; Yin, F.-Z.; Qu, X.-H. Spark plasma sintering on nanometer scale WC–Co powder. Mater. Lett. 2005, 59, 2566–2569. [Google Scholar] [CrossRef]
  14. Wang, X.; Xie, Y.; Guo, H.; Vanderbiest, O.; Vleugels, J. Sintering of WC-Co powder with nanocrystalline WC by spark plasma sintering. Rare Met. 2006, 25, 246–252. [Google Scholar] [CrossRef]
  15. Kim, H.-C.; Shon, I.-J.; Yoon, J.-K.; Doh, J.-M. Consolidation of ultra fine WC and WC–Co hard materials by pulsed current activated sintering and its mechanical properties. Int. J. Refract. Met. Hard Mater. 2007, 25, 46–52. [Google Scholar] [CrossRef]
  16. Xi, X.; Pi, X.; Nie, Z.; Song, S.; Xu, X.; Zuo, T. Synthesis and characterization of ultrafine WC–Co by freeze-drying and spark plasma sintering. Int. J. Refract. Met. Hard Mater. 2009, 27, 101–104. [Google Scholar] [CrossRef]
  17. Sun, L.; Jia, C.-C.; Lin, C.-G.; Cao, R.-J. VC Addition Prepared Ultrafine WC-11Co Composites by Spark Plasma Sintering. J. Iron Steel Res. Int. 2007, 14, 85–89. [Google Scholar] [CrossRef]
  18. Michalski, A.; Siemiaszko, D. Nanocrystalline cemented carbides sintered by the pulse plasma method. Int. J. Refract. Met. Hard Mater. 2007, 25, 153–158. [Google Scholar] [CrossRef]
  19. Cha, S.I.; Hong, S.H.; Kim, B.K. Spark plasma sintering behavior of nanocrystalline WC–10Co cemented carbide powders. Mater. Sci. Eng. A 2003, 351, 31–38. [Google Scholar] [CrossRef]
  20. Sun, L.; Lin, C.; Jia, C.; Jia, X.; Xian, M. Change in relative density of WC-Co cemented carbides in spark plasma sintering process. Rare Met. 2008, 27, 74–77. [Google Scholar] [CrossRef]
  21. Sivaprahasam, D.; Chandrasekar, S.; Sundaresan, R. Microstructure and mechanical properties of nanocrystalline WC–12Co consolidated by spark plasma sintering. Int. J. Refract. Met. Hard Mater. 2007, 25, 144–152. [Google Scholar] [CrossRef]
  22. Zhao, S.; Song, X.; Wang, M.; Liu, G.; Zhang, J. Preparation of ultrafine WC-Co cermets by combining pretreatment and consolidation with spark plasma sintering. Rare Met. 2009, 28, 391–395. [Google Scholar] [CrossRef]
  23. Sun, L.; Yang, T.; Jia, C.; Xiong, J. VC, Cr3C2 doped ultrafine WC–Co cemented carbides prepared by spark plasma sintering. Int. J. Refract. Met. Hard Mater. 2011, 29, 147–152. [Google Scholar] [CrossRef]
  24. Huang, S.; Li, L.; Vanmeensel, K.; Van der Biest, O.; Vleugels, J. VC, Cr3C2 and NbC doped WC–Co cemented carbides prepared by pulsed electric current sintering. Int. J. Refract. Met. Hard Mater. 2007, 25, 417–422. [Google Scholar] [CrossRef]
  25. Zhao, S.; Song, X.; Zhang, J.; Liu, X. Effects of scale combination and contact condition of raw powders on SPS sintered near-nanocrystalline WC–Co alloy. Mater. Sci. Eng. A 2008, 473, 323–329. [Google Scholar] [CrossRef]
  26. Huang, S.; Vanmeensel, K.; Li, L.; Van Der Biest, O.; Vleugels, J. Tailored sintering of VC-doped WC–Co cemented carbides by pulsed electric current sintering. Int. J. Refract. Met. Hard Mater. 2008, 26, 256–262. [Google Scholar] [CrossRef]
  27. Liu, X.; Song, X.; Zhang, J.; Zhao, S. Temperature distribution and neck formation of WC–Co combined particles during spark plasma sintering. Mater. Sci. Eng. A 2008, 488, 1–7. [Google Scholar] [CrossRef]
  28. Bonache, V.; Salvador, M.D.; Amigó, V.; Busquets, D.; Castro, A. Spark Plasma Sintering of Nanocrystalline WC-12Co Cermets. Ceram. Transact. 2010, 209, 367–378. [Google Scholar] [CrossRef]
  29. Bonache, V.; Salvador, M.; Fernández, A.; Borrell, A. Fabrication of full density near-nanostructured cemented carbides by combination of VC/Cr3C2 addition and consolidation by SPS and HIP technologies. Int. J. Refract. Met. Hard Mater. 2011, 29, 202–208. [Google Scholar] [CrossRef] [Green Version]
  30. Bonache, V.; Salvador, M.; Rocha, V.; Borrell, A. Microstructural control of ultrafine and nanocrystalline WC–12Co–VC/Cr3C2 mixture by spark plasma sintering. Ceram. Int. 2011, 37, 1139–1142. [Google Scholar] [CrossRef]
  31. Qin, Y.-Q.; Peng, Y.-Q.; Tian, Y.; Luo, L.-M.; Ma, Y.; Zan, X.; Zhu, X.-Y.; Wu, Y.-C. Effect of Y2O3 on microstructure and mechanical properties of WC-Co-cemented carbides prepared via solid-liquid doping method and spark plasma sintering. Mater. Today Commun. 2020, 24, 101096. [Google Scholar] [CrossRef]
  32. Wei, C.; Song, X.; Fu, J.; Liu, X.; Gao, Y.; Wang, H.; Zhao, S. Microstructure and properties of ultrafine cemented carbides—Differences in spark plasma sintering and sinter-HIP. Mater. Sci. Eng. A 2012, 552, 427–433. [Google Scholar] [CrossRef]
  33. Liu, X.; Song, X.; Wei, C.; Gao, Y.; Wang, H. Quantitative characterization of the microstructure and properties of nanocrystalline WC–Co bulk. Scr. Mater. 2012, 66, 825–828. [Google Scholar] [CrossRef]
  34. Buravlev, I.; Shichalin, O.; Papynov, E.; Golub, A.; Gridasova, E.; Buravleva, A.; Yagofarov, V.; Dvornik, M.; Fedorets, A.; Reva, V.; et al. WC-5TiC-10Co hard metal alloy fabrication via mechanochemical and SPS techniques. Int. J. Refract. Met. Hard Mater. 2021, 94, 105385. [Google Scholar] [CrossRef]
  35. Wang, B.; Jia, J.; Wang, Z.; Yin, Z.; Huang, L.; Yuan, J. Fabrication and performance of graded ultrafine WC–Co cemented carbide tool by one/two-step spark plasma sintering. Ceram. Int. 2021, 47, 8322–8329. [Google Scholar] [CrossRef]
  36. Wang, B.; Wang, Z.; Yuan, J.; Yin, Z.; Huang, L.; Zheng, K. High temperature fracture mechanism of ultrafine WC-Co cemented carbides containing (Ti,W)C. Int. J. Refract. Met. Hard Mater. 2021, 95, 105428. [Google Scholar] [CrossRef]
  37. Dembiczak, T.; Balaga, Z.; Opydo, M.; Kruzel, R.; Garbiec, D.; Dyner, M. The effect of the binder phase and sintering temperature on the properties of Spark Plasma Sintering WC-Co cemented carbides. Manuf. Technol. 2021, 21, 45–50. [Google Scholar] [CrossRef]
  38. Wang, Z.; Yu, B.; Liu, K.; Yin, Z.; Yuan, J.; Zhu, Y. Performance and wear mechanism of spark plasma sintered WC-Based ultrafine cemented carbides tools in dry turning of Ti–6Al–4V. Ceram. Int. 2020, 46, 20207–20214. [Google Scholar] [CrossRef]
  39. Liu, K.; Wang, Z.; Yin, Z.; Cao, L.; Yuan, J. Effect of Co content on microstructure and mechanical properties of ultrafine grained WC-Co cemented carbide sintered by spark plasma sintering. Ceram. Int. 2018, 44, 18711–18718. [Google Scholar] [CrossRef]
  40. Wang, Z.; Wang, B.; Yin, Z.; Liu, K. Tribological behavior of spark plasma sintered ultrafine-grained WC-cobalt cemented carbides in dry sliding. Proc. Inst. Mech. Eng. Part C J. Mech. Eng. Sci. 2020, 234, 2707–2715. [Google Scholar] [CrossRef]
  41. Wang, B.; Wang, Z.; Yin, Z.; Yuan, J.; Jia, J. Preparation and properties of the VC/Cr3C2/TaC doped ultrafine WC-Co tool material by spark plasma sintering. J. Alloy. Compd. 2020, 816, 152598. [Google Scholar] [CrossRef]
  42. Su, W.; Zou, J.; Sun, L. Effects of nano-alumina on mechanical properties and wear resistance of WC-8Co cemented carbide by spark plasma sintering. Int. J. Refract. Met. Hard Mater. 2020, 92, 105337. [Google Scholar] [CrossRef]
  43. Yang, Y.; Luo, L.-M.; Zan, X.; Zhu, X.-Y.; Zhu, L.; Wu, Y.-C. Synthesis of Y2O3-doped WC-Co powders by wet chemical method and its effect on the properties of WC-Co cemented carbide alloy. Int. J. Refract. Met. Hard Mater. 2020, 92, 105324. [Google Scholar] [CrossRef]
  44. Peng, Y.; Wang, H.; Zhao, C.; Hu, H.; Liu, X.; Song, X. Nanocrystalline WC-Co composite with ultrahigh hardness and toughness. Compos. Part. B Eng. 2020, 197, 108161. [Google Scholar] [CrossRef]
  45. Al Wohaibi, S.; Mohammed, A.S.; Laoui, T.; Hakeem, A.S.; Adesina, A.Y.; Patel, F. Tribological Characterization of Micron-/Nano-Sized WC-9%Co Cemented Carbides Prepared by Spark Plasma Sintering at Elevated Temperatures. Materials 2019, 12, 920. [Google Scholar] [CrossRef] [Green Version]
  46. Wang, Z.; Liu, Y.; Liu, K.; Wang, B. Mechanical properties and microstructure of spark plasma sintered WC-8 wt.%Co-VC-cBN ultrafine grained cemented carbide. Ceram. Int. 2019, 45, 23658–23665. [Google Scholar] [CrossRef]
  47. Wang, B.; Wang, Z.; Yin, Z.; Liu, K.; Yuan, J. Effects of powder preparation and sintering temperature on consolidation of ultrafine WC-8Co tool material produced by spark plasma sintering. Ceram. Int. 2019, 45, 19737–19746. [Google Scholar] [CrossRef]
  48. Langa, T.; Olubambi, P.; Shabalala, T.; Shongwe, M.B. Densification and structural transformation during spark plasma sintering of WC-Co-YSZ-cBN systems. Int. J. Refract. Met. Hard Mater. 2018, 72, 341–348. [Google Scholar] [CrossRef]
  49. Yuan, X.; Song, X.; Chien, H.; Li, J.; Rohrer, G.S. Effect of densification mechanism on the Σ2 grain boundary plane distribution in WC–Co composites. Mater. Lett. 2013, 92, 86–89. [Google Scholar] [CrossRef]
  50. Sun, X.; Wang, Y.; Li, D. Mechanical properties and erosion resistance of ceria nano-particle-doped ultrafine WC–12Co composite prepared by spark plasma sintering. Wear 2013, 301, 406–414. [Google Scholar] [CrossRef]
  51. Espinosa-Fernández, L.; Borrell, A.; Salvador, M.; Gutierrez-Gonzalez, C. Sliding wear behavior of WC–Co–Cr3C2–VC composites fabricated by conventional and non-conventional techniques. Wear 2013, 307, 60–67. [Google Scholar] [CrossRef]
  52. Liu, X.M.; Song, X.Y.; Bin Wang, H.; Gao, Y.; Wang, Y. Effect of VC Addition on Microstructure and Mechanical Properties of Ultrafine Grained WC-Co Alloys. Adv. Mater. Res. 2014, 893, 444–448. [Google Scholar] [CrossRef]
  53. Mandel, K.; Krüger, L.; Schimpf, C. Study on parameter optimisation for field-assisted sintering of fully-dense, near-nano WC–12Co. Int. J. Refract. Met. Hard Mater. 2014, 45, 153–159. [Google Scholar] [CrossRef]
  54. Mandel, K.; Krüger, L.; Krause, R.; Radajewski, M. The influence of stress state on the compressive strength of WC–Co with different Co contents. Int. J. Refract. Met. Hard Mater. 2014, 47, 124–130. [Google Scholar] [CrossRef]
  55. Al-Aqeeli, N.; Mohammad, K.; Laoui, T.; Saheb, N. The Effect of Variable Binder Content and Sintering Temperature on the Mechanical Properties of WC–Co–VC/Cr3C2 Nanocomposites. Mater. Manuf. Process. 2014, 30, 327–334. [Google Scholar] [CrossRef]
  56. Lee, S.; Hong, H.S.; Kim, H.-S.; Hong, S.-J.; Yoon, J.-H. Spark plasma sintering of WC–Co tool materials prepared with emphasis on WC core–Co shell structure development. Int. J. Refract. Met. Hard Mater. 2015, 53, 41–45. [Google Scholar] [CrossRef]
  57. Wang, X.; Wang, H.; Moscatelli, R.; Liu, X.; Song, X. Cemented carbides with highly oriented WC grains and formation mechanisms. Mater. Sci. Eng. A 2016, 659, 76–83. [Google Scholar] [CrossRef]
  58. Ogunmuyiwa, E.N.; Sacks, N.; Bergström, L.; Akhtar, F. Effect of 10 wt% VC on the Friction and Sliding Wear of Spark Plasma–Sintered WC–12 wt% Co Cemented Carbides. Tribol. Trans. 2017, 60, 276–283. [Google Scholar] [CrossRef]
  59. Kurlov, A.; Gusev, A. Peculiarities of vacuum annealing of nanocrystalline WC powders. Int. J. Refract. Met. Hard Mater. 2012, 32, 51–60. [Google Scholar] [CrossRef]
  60. Kurlov, A.S. Effects of vacuum annealing on the particle size and phase composition of nanocrystalline tungsten carbide powders. Russ. J. Phys. Chem. A 2013, 87, 654–661. [Google Scholar] [CrossRef]
  61. Konyashin, I.; Zaitsev, A.; Sidorenko, D.; Levashov, E.; Ries, B.; Konischev, S.; Sorokin, M.; Mazilkin, A.; Herrmann, M.; Kaiser, A. Wettability of tungsten carbide by liquid binders in WC–Co cemented carbides: Is it complete for all carbon contents? Int. J. Refract. Met. Hard Mater. 2017, 62, 134–148. [Google Scholar] [CrossRef]
  62. Wang, H.; Song, X.; Liu, X.; Gao, Y.; Wei, C.; Wang, Y.; Guo, G. Effect of carbon content of WC–Co composite powder on properties of cermet coating. Powder Technol. 2013, 246, 492–498. [Google Scholar] [CrossRef]
  63. Sugiyama, I.; Mizumukai, Y.; Taniuchi, T.; Okada, K.; Shirase, F.; Tanase, T.; Ikuhara, Y.; Yamamoto, T. Carbon content dependence of grain growth mode in VC-doped WC–Co hardmetals. Int. J. Refract. Met. Hard Mater. 2015, 52, 245–251. [Google Scholar] [CrossRef]
  64. Konyashin, I.; Hlawatschek, S.; Ries, B.; Lachmann, F.; Dorn, F.; Sologubenko, A.; Weirich, T. On the mechanism of WC coarsening in WC–Co hardmetals with various carbon contents. Int. J. Refract. Met. Hard Mater. 2009, 27, 234–243. [Google Scholar] [CrossRef]
  65. Chabretou, V.; Allibert, C.H.; Missiaen, J.M. Quantitative analysis of the effect of the binder phase composition on grain growth in WC-Co sintered materials. J. Mater. Sci. 2003, 38, 2581–2590. [Google Scholar] [CrossRef]
  66. Wang, Y.; Heusch, M.; Lay, S.; Allibert, C. Microstructure Evolution in the Cemented Carbides WC-Co, I. Effect of the C/W Ratio on the Morphology and Defects of the WC Grains. Phys. Status Solidi 2002, 193, 271–283. [Google Scholar] [CrossRef]
  67. Gu, L.; Huang, J.; Xie, C. Effects of carbon content on microstructure and properties of WC–20Co cemented carbides. Int. J. Refract. Met. Hard Mater. 2014, 42, 228–232. [Google Scholar] [CrossRef]
  68. Kim, S.; Han, S.-H.; Park, J.-K.; Kim, H.-E. Variation of WC grain shape with carbon content in the WC–Co alloys during liquid-phase sintering. Scr. Mater. 2003, 48, 635–639. [Google Scholar] [CrossRef]
  69. Nino, A.; Takahashi, K.; Sugiyama, S.; Taimatsu, H. Effects of Carbon Addition on Microstructures and Mechanical Properties of Binderless Tungsten Carbide. Mater. Trans. 2012, 53, 1475–1480. [Google Scholar] [CrossRef] [Green Version]
  70. Wei, C.; Song, X.; Fu, J.; Lv, X.; Wang, H.; Gao, Y.; Zhao, S.; Liu, X. Effect of Carbon Addition on Microstructure and Properties of WC–Co Cemented Carbides. J. Mater. Sci. Technol. 2012, 28, 837–843. [Google Scholar] [CrossRef]
  71. Bounhoure, V.; Lay, S.; Charlot, F.; Antoni-Zdziobek, A.; Pauty, E.; Missiaen, J. Effect of C content on the microstructure evolution during early solid state sintering of WC–Co alloys. Int. J. Refract. Met. Hard Mater. 2014, 44, 27–34. [Google Scholar] [CrossRef]
  72. Petersson, A. Sintering shrinkage of WC–Co and WC–(Ti,W)C–Co materials with different carbon contents. Int. J. Refract. Met. Hard Mater. 2004, 22, 211–217. [Google Scholar] [CrossRef]
  73. Krasovskii, P.V.; Blagoveshchenskii, Y.V.; Grigorovich, K.V. Determination of oxygen in W-C-Co nanopowders. Inorg. Mater. 2008, 44, 954–959. [Google Scholar] [CrossRef]
  74. Fang, Z.Z.; Wang, X.; Ryu, T.; Hwang, K.S.; Sohn, H. Synthesis, sintering, and mechanical properties of nanocrystalline cemented tungsten carbide—A review. Int. J. Refract. Met. Hard Mater. 2009, 27, 288–299. [Google Scholar] [CrossRef]
  75. Tokita, M. Spark Plasma Sintering (SPS) Method, Systems, and Applications. Chapter 11.2.3. In Handbook of Advanced Ceramics, 2nd ed.; Academic Press: Cambridge, MA, USA, 2013; Volume 11, pp. 1149–1177. [Google Scholar] [CrossRef]
  76. Olevsky, E.A.; Dudina, D.V. Field-Assisted Sintering; Springer: Cham, Switzerland, 2018; p. 425. [Google Scholar]
  77. Tokita, M. Progress of Spark Plasma Sintering (SPS) Method, Systems, Ceramics Applications and Industrialization. Ceramics 2021, 4, 160–198. [Google Scholar] [CrossRef]
  78. Dudina, D.; Ukhina, A.; Bokhonov, B.; Mali, V.; Anisimov, A.; Bulina, N.; Skovorodin, I. Nickel-graphite composites of variable architecture by graphitization-accompanied spark plasma sintering and hot pressing and their response to phase separation. Sci. Sinter. 2015, 47, 237–248. [Google Scholar] [CrossRef]
  79. Dudina, D.V.; Bokhonov, B.B.; Ukhina, A.V.; Anisimov, A.G.; Mali, V.; Esikov, M.A.; Batraev, I.; Kuznechik, O.O.; Pilinevich, L.P. Reactivity of materials towards carbon of graphite foil during Spark Plasma Sintering: A case study using Ni–W powders. Mater. Lett. 2016, 168, 62–67. [Google Scholar] [CrossRef]
  80. Samokhin, A.V.; Alekseev, N.V.; Kornev, S.A.; Sinaiskii, M.A.; Blagoveschenskiy, Y.V.; Kolesnikov, A.V. Tungsten Carbide and Vanadium Carbide Nanopowders Synthesis in DC Plasma Reactor. Plasma Chem. Plasma Process. 2013, 33, 605–616. [Google Scholar] [CrossRef]
  81. Blagoveshchenskiy, Y.V.; Isayeva, N.V.; Blagoveshchenskaya, N.V.; Melnik, Y.I.; Chuvildeyev, V.N.; Nokhrin, A.V.; Sakharov, N.V.; Boldin, M.S.; Smirnov, Y.S.; Shotin, S.V.; et al. Methods of compacting nanostructured tungsten–cobalt alloys from Nanopowders obtained by plasma chemical synthesis. Inorg. Mater. Appl. Res. 2015, 6, 415–426. [Google Scholar] [CrossRef]
  82. Isaeva, N.V.; Blagoveshchenskii, Y.V.; Blagoveshchenskaya, N.V.; Mel’nik, Y.I.; Samokhin, A.V.; Alekseev, N.V.; Astashov, A. Preparation of nanopowders of carbides and hard-alloy mixtures applying low-temperature plasma. Russ. J. Non-Ferrous Met. 2014, 55, 585–591. [Google Scholar] [CrossRef]
  83. Blagoveshchenskiy, Y.V.; Isaeva, N.V.; Sinaiskiy, M.A.; Ankudinov, A.B.; Zelensky, V.A. Tuning the Properties of Refractory Carbide Nanopowders. Inorg. Mater. Appl. Res. 2018, 9, 924–929. [Google Scholar] [CrossRef]
  84. Chuvil’deev, V.; Blagoveshchenskiy, Y.; Nokhrin, A.; Boldin, M.; Sakharov, N.; Isaeva, N.; Shotin, S.; Belkin, O.; Popov, A.; Smirnova, E.; et al. Spark plasma sintering of tungsten carbide nanopowders obtained through DC arc plasma synthesis. J. Alloy. Compd. 2017, 708, 547–561. [Google Scholar] [CrossRef]
  85. Chuvil’deev, V.N.; Moskvicheva, A.V.; Lopatin, Y.G.; Blagoveshchenskii, Y.V.; Isaeva, N.V.; Mel’Nik, Y.I. Sintering of WC and WC-Co nanopowders with different inhibitor additions by the SPS method. Dokl. Phys. 2011, 56, 114–117. [Google Scholar] [CrossRef]
  86. Lantsev, E.; Malekhonova, N.; Nokhrin, A.; Chuvil’deev, V.; Boldin, M.; Andreev, P.; Smetanina, K.; Blagoveshchenskiy, Y.; Isaeva, N.; Murashov, A. Spark plasma sintering of fine-grained WC hard alloys with ultra-low cobalt content. J. Alloy. Compd. 2021, 857, 157535. [Google Scholar] [CrossRef]
  87. Lantsev, E.; Malekhonova, N.; Nokhrin, A.; Chuvil’deev, V.; Boldin, M.; Blagoveshchenskiy, Y.; Andreev, P.; Smetanina, K.; Isaeva, N.; Shotin, S. Influence of oxygen on densification kinetics of WC nanopowders during SPS. Ceram. Int. 2021, 47, 4294–4309. [Google Scholar] [CrossRef]
  88. Krasovskii, P.V.; Malinovskaya, O.S.; Samokhin, A.V.; Blagoveshchenskiy, Y.V.; Kazakov, V.A.; Ashmarin, A.A. XPS study of surface chemistry of tungsten carbides nanopowders produced through DC thermal plasma/hydrogen annealing process. Appl. Surf. Sci. 2015, 339, 46–54. [Google Scholar] [CrossRef]
  89. He, R.; Wang, J.; He, M.; Yang, H.; Ruan, J. Synthesis of WC composite powder with nano-cobalt coatings and its application in WC-4Co cemented carbide. Ceram. Int. 2018, 44, 10961–10967. [Google Scholar] [CrossRef]
  90. Blagoveshchensky, Y.V.; Alexeev, N.V.; Samokhin, A.V.; Isaeva, N.V.; Sinaysky, M.A.; Tsvetkov, Y.V. Effect of the Conditions of Formation of W–C Nanopowders in a Plasma Jet on the Synthesis of Hexagonal Tungsten Carbide. Inorg. Mater. Appl. Res. 2019, 10, 566–571. [Google Scholar] [CrossRef]
  91. Kurlov, A.; Gusev, A.; Rempel, A. Vacuum sintering of WC-8 wt.%Co hardmetals from WC powders with different dispersity. Int. J. Refract. Met. Hard Mater. 2011, 29, 221–231. [Google Scholar] [CrossRef]
  92. Roebuck, B. Extrapolating hardness-structure property maps in WC/Co hardmetals. Int. J. Refract. Met. Hard Mater. 2006, 24, 101–108. [Google Scholar] [CrossRef]
  93. Petersson, A.; Ågren, J. Sintering shrinkage of WC–Co materials with different compositions. Int. J. Refract. Met. Hard Mater. 2005, 23, 258–266. [Google Scholar] [CrossRef]
  94. Gille, G.; Szesny, B.; Leitner, G. A new 0.4 μm WC powder as well as powder-related properties and sintering behaviour of 0.6 to 30 μm WC-Co hardmetals. J. Adv. Mater. 1999, 31, 9–22. [Google Scholar]
  95. De Macedo, H.; Da Silva, A.; Melo, D. The spreading of cobalt, nickel and iron on tungsten carbide and the first stage of hard metal sintering. Mater. Lett. 2003, 57, 3924–3932. [Google Scholar] [CrossRef]
  96. Petersson, A. Cemented Carbide Sintering: Constitutive Relations and Microstructural Evolution. Ph.D. Thesis, Department of Materials Science and Engineering, Royal Institute of Technology, Stockholm, Sweden, 2004. [Google Scholar]
  97. Poirier, G.-P. Plasticité À Haute Température des Solidescristallins; Eyrolles: France, Paris, 1976; p. 301. [Google Scholar]
  98. Frost, H.J.; Ashby, M.F. Deformation-Mechanism Maps: The Plasticity and Creep of Metals and Ceramics; Pergamon Press: Oxford, UK, 1982; p. 165. [Google Scholar]
  99. Larikov, L.N.; Isaichev, V.I. Diffusion in Metals and Alloys; Naukova Dumka: Kiev, Ukraine, 1989; p. 512. (In Russian) [Google Scholar]
  100. Young, W.S.; Cutler, I.B. Initial Sintering with Constant Rates of Heating. J. Am. Ceram. Soc. 1970, 53, 659–663. [Google Scholar] [CrossRef]
  101. Kumar, A.N.; Watabe, M.; Kurokawa, K. The sintering kinetics of ultrafine tungsten carbide powders. Ceram. Int. 2011, 37, 2643–2654. [Google Scholar] [CrossRef]
  102. Johnson, D.L. New Method of Obtaining Volume, Grain-Boundary, and Surface Diffusion Coefficients from Sintering Data. J. Appl. Phys. 1969, 40, 192–200. [Google Scholar] [CrossRef]
  103. Lavergne, O.; Robaut, F.; Hodaj, F.; Allibert, C. Mechanism of solid-state dissolution of WC in Co-based solutions. Acta Mater. 2002, 50, 1683–1692. [Google Scholar] [CrossRef]
  104. Gille, G.; Szesny, B.; Dreyer, K.; Berg, H.V.D.; Schmidt, J.; Gestrich, T.; Leitner, G. Submicron and ultrafine grained hardmetals for microdrills and metal cutting inserts. Int. J. Refract. Met. Hard Mater. 2002, 20, 3–22. [Google Scholar] [CrossRef]
  105. Chuvil’deev, V.N.; Boldin, M.S.; Dyatlova, Y.G.; Rumyantsev, V.I.; Ordanyan, S.S. A comparative study of the hot pressing and spark plasma sintering of Al2O3–ZrO2–Ti(C,N) powders. Inorg. Mater. 2015, 51, 1047–1053. [Google Scholar] [CrossRef]
  106. Golovkina, L.; Orlova, A.; Nokhrin, A.; Boldin, M.; Chuvil’deev, V.; Sakharov, N.; Belkin, O.; Shotin, S.; Zelenov, A. Spark Plasma Sintering of fine-grain ceramic-metal composites based on garnet-structure oxide Y2.5Nd0.5Al5O12 for inert matrix fuel. Mater. Chem. Phys. 2018, 214, 516–526. [Google Scholar] [CrossRef]
  107. Meredith, B.; Milner, D.R. Densification Mechanisms in the Tungsten Carbide—Cobalt System. Powder Met. 1976, 19, 38–45. [Google Scholar] [CrossRef]
  108. Huang, S.; Vanmeensel, K.; Li, L.; Van Der Biest, O.; Vleugels, J. Influence of starting powder on the microstructure of WC–Co hardmetals obtained by spark plasma sintering. Mater. Sci. Eng. A 2008, 475, 87–91. [Google Scholar] [CrossRef]
  109. Buhsmer, C.P.; Crayton, P.H. Carbon self-diffusion in tungsten carbide. J. Mater. Sci. 1971, 6, 981–988. [Google Scholar] [CrossRef]
  110. Pelleg, J. Diffusion in Ceramics; Springer: Cham, Switzerland, 2016; p. 448. [Google Scholar]
Figure 1. Schematic representation of sintering regimes for α-WC+10 wt.%Co powders.
Ceramics 04 00025 g001
Figure 2. Microstructure (a,b) and XRD images (c) of α-WC+10 wt.%Co powder compositions: (a) submicron powder (Series #1); (b) nanopowder (Series #2). In (c),the black lines are submicron powders, and the red lines are nanopowders.
Ceramics 04 00025 g002aCeramics 04 00025 g002b
Figure 3. Dependencies of shrinkage on heating temperature L(T) for submicron (a) and nanopowders (b) α-WC+10 wt.%Co with various graphite concentrations.
Ceramics 04 00025 g003
Figure 4. Microstructure of WC-10Co hard alloys obtained by solid-phase SPS without additional graphite (a,b), with 0.3 wt.% (c,d) and with 0.5 wt.% (e,f) of graphite.
Ceramics 04 00025 g004aCeramics 04 00025 g004b
Figure 5. Microstructure of WC-10Co hard alloys obtained by liquid-phase SPS with various concentrations of graphite: 0.1 (a,b), 0.2 (c,d), 0.3 (e,f), 0.4 (g,h) and 0.5 wt.% (i,j). In the photographs with high magnifications (b,d,f,h,j), images of the fine-grained matrices (without the abnormally large grains) are presented.
Ceramics 04 00025 g005aCeramics 04 00025 g005bCeramics 04 00025 g005c
Figure 6. XRD results for WC-10Co specimens with various graphite concentrations obtained by solid-phase (a) and liquid-phase (b) SPS: Line (1)—0 wt.%, (2)—0.1 wt.%, (3)—0.2 wt.%, (4)—0.3 wt.%, (5)—0.4 wt.%, (6)—0.5 wt.% graphite.
Ceramics 04 00025 g006
Figure 7. Dependence of shrinkage of submicron α-WC+10 wt.%Co +0.5 wt.%C powder on exposure times at different temperatures (a) and dependence of shrinkage rate at isothermal exposure on reciprocal homological temperature of SPS (b). In (b), Tm is the melting point of WC.
Ceramics 04 00025 g007
Figure 8. Dependence of shrinkage and pressure on time of stepped sintering with isothermal exposure of submicron α-WC + 10 wt.%Co powder at 800 °C.
Ceramics 04 00025 g008
Figure 9. Dependence of microhardness (1, 2) and fracture toughness (3, 4) of fine-grained hard alloy WC-10Co on the graphite content. (1, 3)—specimens obtained by solid-phase sintering at 1100 °C, (2, 4)—specimens obtained by liquid-phase sintering at 1400 °C.
Ceramics 04 00025 g009
Figure 10. XRD results for WC-10Co specimens with various graphite concentrations obtained by solid-phase sintering of nanopowders. Line (1)—0.5 wt.%, (2)—1.0 wt.%, (3)—1.5 wt.% graphite.
Ceramics 04 00025 g010
Figure 11. Microstructure of WC-10Co hard alloys obtained by solid-phase SPS of nanopowders with various concentrations of graphite: (a,d)—0.5 wt.%, (b,e)—1.0 wt.%, (c,f)—1.5 wt.% graphite.
Ceramics 04 00025 g011
Figure 12. Dependence of shrinkage on the reciprocal temperature of sintering of submicron (a) and nanopowder (b) α-WC+10 wt.%Co compositions with various graphite concentrations. Determination of the sintering activation energy at “mid-range” temperatures.
Ceramics 04 00025 g012
Figure 13. Dependence of density represented in double-logarithmic coordinates on reciprocal temperature for the WC-10Co hard alloy sintered from submicron powder with a 0.5 wt.% graphite content. Determination of the sintering activation energy at higher temperatures.
Ceramics 04 00025 g013
Figure 14. Position measurements of XRD peak (111) β-100 in an WC-10Co hard alloy obtained by the SPS of submicron powders: (a) impact of graphite concentration at the sintering temperature of 1400 °C; (b) impact of SPS temperature for a 0.5% graphite concentration.
Ceramics 04 00025 g014
Table 1. Chemical composition of initial WC and Co powders.
PowderConcentration, wt.%
WCONCoFeAlTiMoCrTaV
α-WC submicron powder (series #1)balance6.070.14-<10−33 × 10−3<10−3<10−310−310−3<10−30.15
α-WC nanopowder (series #2)balance6.360.750.06<10−39.6 × 10−51.9 × 10−4-5.4 × 10−52 × 10−5--
β-Co powder-0.120.410.04balance2.2 × 10−3------
Table 2. Impact of carbon concentration on density,ρ/ρth; average grain size, d; and optimal temperatures of solid-phase sintering of WC-10Co alloys.
Graphite Concentration,
wt.%
Series 1 PowderSeries 2 Powder
ρ/ρth,
%
d,
μm
fη,
wt.%
T1,
°C
T2,
°C
ρ/ρth,
%
d,
μm
fη,
wt.%
T1,
°C
T2,
°C
099.60.4–0.58<8001100100.2 (*)0.1–0.5>408501050
0.199.70.4–0.56<8001100-----
0.299.50.4–0.50<8001080-----
0.399.40.4–0.50<8001060-----
0.499.50.4–0.50<8001060-----
0.599.30.4–0.50<8001040100.00.1–0.5338501025
1.0-----98.60.1–1148201000
1.5-----96.30.1–50<800990
(*) High values of density (greater than the theoretical value ρth) are owing to the formation of a considerable mass fraction of the η-phase particles having another theoretical density.
Table 3. Impact of carbon concentration on the mechanical properties of the UFG WC-10Co hard alloy. SPS of the plasma-chemical nanoparticles. TSPS = 1100 °C.
Graphite Concentration,
wt.%
Mechanical Properties (1)
Series #1Series #2
Hv,
GPa
KIC,
MPa·m1/2
Hv,
GPa
KIC,
MPa·m1/2
018.65.919.5–20 (2)5–6 (2)
0.520.95.419.35.7
1.0--19.57.7
1.5--19.48.0
(1) Low values of KIC are caused by the following two factors: (1) no additives of the particles-inhibitors of grain growth (Cr3C2, VC, TaC, etc.) allowing for a reduction in the abnormal grain growth intensity and, consequently, forming more fine-grained microstructures with an increased fracture toughness factor that were present in the hard alloy; (2) in the present work, the minimal values of KIC calculated from the maximal radial crack length (not from the mean length of all of the cracks formed) are presented.(2) Data obtained and published earlier.
Table 4. Impact of carbon concentration on activation energies of first and second stages of the non-isothermal solid-phase sintering of WC-10%Co powders.
Graphite Concentration,
wt.%
Activation Energy
Qs(I), kTm (±2.5 kTm)
Activation Energy
Qs(II), kTm (±2 kTm)
Series 1Series 2Series 1Series 2
010143418
0.111-30-
0.29-16-
0.38-17-
0.49-14-
0.5981325
1.0-7-20
1.5-8-12
Publisher’s Note: MDPI stays neutral with regard to jurisdictional claims in published maps and institutional affiliations.

