Systemic Crop Signaling for Automatic Recognition of Transplanted Lettuce and Tomato under Different Levels of Sunlight for Early Season Weed Control


1
Department of Agricultural Engineering, College of Engineering, China Agricultural University, 17 Qinghua East Road, Haidian, Beijing 100083, China
2
Department of Biological and Agricultural Engineering, University of California, Davis, One Shields Avenue, Davis, CA 95616-5270, USA
Challenges 2020, 11(2), 23; https://0-doi-org.brum.beds.ac.uk/10.3390/challe11020023
Submission received: 4 September 2020
/
Revised: 21 September 2020
/
Accepted: 22 September 2020
/
Published: 23 September 2020
Abstract
:Conventional cultivation works to control weeds between the rows, but it ignores the weeds in crop rows which are most competitive with crops. Many vegetable crops still require manual removal of intra-row weeds not otherwise controlled by herbicides or conventional cultivation. The increasing labor costs of weed control and the continued emergences of herbicide-resistant weeds are threatening grower ability to manage weeds and maintain profitability. Intra-row weeders are commercially available but work best in low weed populations. One strategy for rapid weed crop differentiation is to utilize a machine-detectable compound to mark a crop. This paper proposes a new systemic plant signaling technology that can create machine-readable crops to facilitate the automated removal of intra-row weeds in early growth stages. Rhodamine B (Rh–B) is an efficient systemic compound to label crop plants due to its membrane permeability and unique fluorescent properties. The project involves applying solutions of Rh–B at 60 ppm to the roots of lettuce and tomato plants prior to transplantation to evaluate Rh–B persistence in plants under different levels of sunlight. Lettuce and tomato seedlings with the systemic Rh–B should be reliably recognized during their early growth stages. An intelligent robot is expected to be developed to identify the locations of plants based on the systemic signal inside. Reduced light treatments should help to alleviate the photodegradation of Rh–B in plants. After being exposed to full sunlight for 27 days, the systemic Rh–B would be detectable in tomato branches and lettuce ribs, and these plants are tolerant to root treatments with this fluorescent compound. This paper describes the project background and plan as well as the anticipated contributions of the research to allow the machine vision system to reliably identify the crop plants, and thus showing technical feasibility for outdoor weed control.
1. Introduction
Weeds in lettuce and tomatoes are hard to control because of labor shortages, the increasing cost of manual weeding and limited herbicide options. Lettuce is very sensitive to weed competition. Furthermore, there is no tolerance for contamination of bagged lettuce salad mixed with weeds. Thus, weeds must be effectively controlled before lettuce is to be harvested. Effective weed control prevents weeds from competing with crops for sunlight and nutrients, which is of great significance for ensuring crop yields. Typical weed control techniques such as non-chemical, chemical and mechanical methods cannot reliably remove weeds from crops [1]. For instance, cover crops planted during the fallow period not only have limited restrictions on the growth of weeds in the upcoming vegetable crop season but also may have a negative impact on the growth of main crops [2]. Vegetable plants are very susceptible to weed competition yet these crops have very limited herbicide options [3]. Lettuce and tomato are two transplantable high-value specialty crops with a small market but a high potential liability for crop damage caused by herbicides. Herbicides are not a priority for the agrochemical industry for these vegetable crops, meaning there is no effective herbicide for them. Current mechanical cultivation has the capacity to remove inter-row weeds but does not effectively control weeds in the row or near the crop plants [4]. Handweeding is needed in many vegetable crops due to partial weed control provided by incomplete herbicide coverage. However, labor for handweeding is limited and is progressively becoming more expensive. Although abrasive weeding can reduce labor by 66%, the cost of abrasive grits is very high and the efficiency of this technique is very low as it does not involve automated weed detection [5]. More efficient weed control options are needed for vegetable plants. Development of smart robots to enable the real time recognition of crops and to perform precision weed removal may be such an option. Automated weeding machines can reduce labor input or eliminate the use of herbicides [6]. There are also few restrictions on the deployment of automatic weeders equipped with spray nozzle or cultivator knife [7].
The prerequisite for performing automatic weeding requires precise identification of the location of the crop and distinguishing it from weeds before triggering weeding actions [8]. Plant sensing technology based on specific prior knowledge makes the classification of crops and weeds more intelligent [9]. Spectroscopic sensors have been extensively utilized for identification of crop plants [10,11]. Cereal (such as wheat and chickpea) and vegetable (such as tomato) plants were successfully discriminated from weeds based on the reflectance spectroscopy and discriminant analysis models [12,13]. When spectral signals are integrated into the system along with image features, objects with unique spectral features can be visualized from the captured images [14,15,16,17]. Hyperspectral imaging is able to obtain hundreds of bands at each pixel of an image plane for real-time detections [18,19,20,21], but the excessive redundant information contained in the image makes it difficult to achieve high-speed recognitions of targets [22,23]. For example, an automatic weeder developed based on hyperspectral imaging and machine learning successfully removed the in-row weeds of a tomato field in real time, but the tractor speed was restricted by the line scanning configuration of the spectral imaging device [24]. Furthermore, the existing learning methods such as support vector machines, Bayesian classifiers, convolutional neural networks (CNN) and artificial neural networks (ANN) are not reliable enough for plant differentiation under complex backgrounds [25,26,27]. However, it is possible to select a very limited number of feature bands to design a more feasible device for rapid imaging. Single or two fluorescence wavebands chosen from numerous spectral images have already been used for rapid determination of contaminants on Romaine lettuce leaves [28]. Fluorescence imaging provides the spatial information for visualizing the unique fluorescence signal in specimens [29,30]. In a recent study, ultraviolet (UV) fluorescence imaging was used for the accurate detection of aflatoxin in corn kernels [31]. In addition, topical markers and plant labels directly applied to the foliage or stem of vegetable plants including tomato and lettuce were successfully detected based on this imaging technology [32].
Compared to topical markers and plant labels, a systemic crop signaling compound is more preferable if its trace amounts applied to crop roots or seeds can be translocated up into the foliage with no harm for the crop growth, and it is photostable for a period of time in outdoor environments to facilitate detection. Such compounds should not leak from crop plants to weeds and soil so that reliable detection is maintained. The permeability of a signal molecule for foliar uptake is related to their lipophilicity and molecular weight, which can be expressed using the octanol water partition coefficient (log Kow) [33]. Moderately polar compounds (log Kow between 0 to 2) absorbed by roots through symbiotic and extraplasmic pathways are transported from the xylem to plant shoots [34]. Fluorescent tracers applied to roots of crops such as corn and broad bean can flow upward via an apoplastic pathway into the stele of roots [35]. The ideal fluorescent compound will contain a fluorophore that generates a strong and unique fluorescence signal in response to exposure to excitation light. Normally, very low doses of fluorophores are able to generate significant fluorescence emissions. Rhodamine B (Rh–B) with the Log Kow of 1.5 is a safe fluorescent compound on the United States Environmental Protection Agency (USEPA) 4B list. No waiver or tolerance is required when the use of this compound does not exceed 60 ppm on treated seeds and 2% by weight of formulated products because this dose is unlikely to cause residues in or on food according to the code of federal regulations. USEPA believes that the current use of Rh–B has no harmful effects on the environment or public health.
Crop signaling is a new crop identification technology that can automatically distinguish crops from weeds at early growth stages [36]. This technique is able to accurately recognize the systemic marker that exists in target crops but not in the weeds. For example, crop signaling has realized accurate classification of weeds (such as groundsel and burning nettle) and snap beans treated based on Rh–B tracer following seed pathway [37]. The highest fluorescence emission was detected on seeds treated with 100 ppm (0.1 g L−1) Rh–B solution compared to seeds treated with other Rh–B concentrations [38]. After the seeds were sowed, the systemic Rh–B tracer was transported to snap bean stems, but it was difficult to continue to reach the plant leaves. Similar results of systemic uptake of Rh–B also appeared on soybean seedlings [39]. Compared to the seed pathway, Su et al. [40] further proved that Rh–B can be more readily transported from the stem to the entire plant of snap bean through the uptake based on the root pathway. Considering the translocation of fluorescent compounds in plants varies with plant species, it is recommended to use other alternative vegetable crops such as lettuce and tomato. Previous studies have found that the seed coats of tomato and lettuce are not permeable to Rh–B [41]. Accordingly, it was more feasible to try to apply this signaling compound to the root systems of tomato and lettuce plants rather than their seed coats.
Fluorescent compounds are affected by degradation under excitation wavelengths. Specifically, the photodegradation of Rh–B is caused by UV and green light [42,43]. After a sufficient period of time, Rh–B would be completely degraded because of fluorescence decay [44]. During the critical period of weed removal, it is meaningful to ensure the detectability of Rh–B fluorescence in plants [45]. In a recent study, the systemic Rh–B applied to roots of celery transplants was detectable for 27 days in plant shoots in a natural outdoor environment (Figure 1) [46]. Nevertheless, it is not known how susceptible Rh–B is to decay in different levels of sunlight. The movement of Rh–B in the plant over time should be examined due to photobleaching. Furthermore, it is unverified whether tomato and lettuce seedlings containing Rh–B signal after growing outdoors for about 4 weeks can still be detectable by computer vision. If the dye fluorescence in most parts of plants were photodegraded after a period of time, chlorophyll fluorescence images are expected to be used as the basis for crop material extraction. Additionally, the effect of fluorescent compounds on plant vigor should be assessed due to their potential toxicity to plant cells [47].
The focus of this research proposal is to investigate the persistence of Rh–B in lettuce and tomato seedlings under different illumination treatments. Three illumination conditions including one full (100%) sun treatment (with 100% sun intensity and the 100% solar spectrum) and two reduced light treatments based on green houses will be considered. The plants in the polycarbonate greenhouse have 0% solar UV since polycarbonate absorbs UV light, and only visible illumination at 50% of the normal sunlight reached the plants. The glass greenhouse has both solar UV and solar visible light at the 20% light level. The specific objectives of this proposal are (1) to establish a systemic crop signaling technique using systemic Rh–B at 60 ppm to identify tomato and lettuce plants, (2) to assess photostability of Rh–B tracer under these three illumination levels, (3) to visualize the Rh–B treated plants after 27 days of exposure to sunlight, and (4) to determine if the application of the Rh–B to the seedlings before transplanting affected their foliage biomass after transplanting. We believe that this is the first study to assess the signal level of systemic Rh–B in lettuce and tomato plants after sunlight exposure to allow machine vision detection.
2. Research Analyses of Rh–B in Lettuce and Tomato
2.1. Fluorescence Signals
The 523 nm green LED light illuminates Romaine lettuce generating a profile containing both spectral reflection and emission. The spectrum below 550 nm corresponds to the reflectance of the LED light on the lettuce leaf. Most of the excitation light above 550 nm is blocked by the 550 nm short-wave filter. Romaine lettuce has green leaves with sturdy ribs (also known as the main vein) down their centers. For leaf ribs containing Rh–B, the fluorescence emission with a local maximum intensity is observed at approximately 585 nm and 685 nm. The camera bandpass filter at 575 nm tailored to the emission of the Rh–B is used to capture the fluorescence signal between 562 and 588 nm. The fluorescence emission observed at about 685 or 730 nm was an autofluorescence signature associated with plant chlorophyll [38]. In this project, the 675 nm bandpass filter specifically for chlorophyll fluorescence emission (peak at 685 nm) is employed to obtain the chlorophyll image which can be used as the basis for extracting the plant material.
The fluorescence images associated with Rh–B and chlorophyll in lettuce plants were respectively captured by the imaging system using 575 and 675 nm filters. The chlorophyll content reaches the highest in the mesophyll of leaves [48]. The intensity of chlorophyll fluorescence centered at 675 nm in leaf midribs is weaker than that in green parts of the leaves. Rh–B dye has significant fluorescence emission on the inner and outer layers of lettuce leaves. The intensity of the Rh–B signal at the leaf midrib is greater than other parts (such as secondary vein and apex) of the leaf because this indicates that the Rh–B tracer is transferred from the root to the leaf through the xylem [40]. Overall, such a system has the potential to monitor the growth of green plants and to identify target crops based on chlorophyll and Rh–B fluorescence.
2.2. Photostability of Chlorophyll
As a photosynthetic pigment in vegetable crops, chlorophyll is very sensitive to photodegradation [49]. For example, Falco et al. [50] demonstrated that gold nanoparticles translocated to soybean plants greatly decreased the fluorescence intensity of chlorophyll emitted by leaves. Chlorophyll appears a more effective indicator of the toxicity of exogenous substances applied to plants in comparison to the growth characteristics of plants [51]. Thus, the photostability of chlorophyll fluorescence in lettuce seedlings under full sunlight should be investigated to determine whether Rh–B has a potential effect on chlorophyll. The chlorophyll fluorescence intensities in the control group and the Rh–B treated group showed no significant difference on both the first day and the 22nd day of plants transplanting. Similar results were obtained for lettuce plants grown under different illumination conditions (20%, 50%, and 100%). Solar radiation data were plotted to show the variations of sunlight with time. A visibility of 100% represents a reference standard for chlorophyll fluorescence. After lettuce transplanting, the visibility of chlorophyll fluorescence fluctuated at different durations. The variations of growing conditions such as temperature and humidity may stress the plant and ultimately influence its chlorophyll fluorescence [52]. Nevertheless, no significant differences in the chlorophyll visibility among different groups were observed at different time points. This fluorescence visibility remained at a level comparable to the initial value throughout, regardless of the lighting conditions, and whether or not the plants contained the Rh–B tracer. This indicates that the illumination condition and Rh–B treatment have no significant effect on plant chlorophyll fluorescence.
2.3. Visibility of Rh–B under Full Sunlight Irradiation
The visibility of Rh–B in the above ground tissues of lettuce and tomato grown under outdoor daylight over time should be assessed. The plants hydroponically exposed to 60 ppm Rh–B for 36 h showed a strong translocation of this fluorescent compound in the leaves. The difference between Rh–B treated plants and control plants was very clear after evaluating their fluorescence intensities. The ratio of the visibility of mean fluorescence of lettuce plants at each time point is obtained by calculating the ratio of the average intensity of a specific date to the original intensity of the initial date. The visibility of 100% implies the reference standard of mean intensity of Rh–B in entire leaves of the plants. Furthermore, the intensity of full sunlight as a function of time was plotted. The cumulative effect of solar radiation on Rh–B fluorescence decay over time should be presented. It took about 22 days for Rh–B visibility to drop from 100% to about 35% as the Rh–B intensity decreased with increasing irradiation time. Its intensity dropped slowly in the first week, then the signal decreased steadily as sunlight intensity become stronger. The decline in Rh–B visibility in the third week was greater than that in the second week. The visibility of Rh–B at day 22 was still significantly higher than that of the control group. The visibility of Rh–B fluorescence can remain for more than 3 weeks in lettuce under full sunlight.
The translocation and photobleaching of Rh–B in tomato above ground tissues including stems and leaves over time was examined. Compared with the control plant, the fluorescence of Rh–B is observed in the stems and veins of tomato plants at 0 day (after hydroponic exposure for 48 h). The Rh–B compound is transported through the veins reaching the leaves. Stronger Rh–B signals were imaged at the leaves in the lower layer of the plant exposed to sunlight for 6 days. Compared with the initial stage, the intensity of Rh–B signal in plant leaves did not weaken but increased. This is probably because the Rh–B residues in the soil pellet continue to flow upward to the leaves after plant transplantation. The rate of fluorescence decay of Rh–B in the leaves was lower than its accumulation. However, when the tomato plants were transplanted outdoors for 13 days, the fluorescence intensity of the dye in plant leaves was significantly lower than that of the previous week. The Rh–B fluorescence in the main stem of tomato plant became very weak after transplanting for 21 days. Although the dye fluorescence in most parts of tomato plants gradually disappeared, the strong Rh–B signal remained in the lateral branches of the plant at 27 days. Overall, Rh–B can be detected in tomato plants grown outdoors for about 4 weeks, which is of great benefit for the accurate identification of vegetable crops.
2.4. Effects of Light Conditions on Rh–B Photostability
The effects of three sunlight conditions (20%, 50%, and 100% illuminations) on Rh–B photodegradation were investigated. The intensity of Rh–B fluorescence of lettuce continued to increase after transplanting and reached the maximum on the 6th day because the Rh–B internalized within or adhering to seedling roots continued to transport upwards and to accumulate in lettuce leaves. During this period, the decay of average fluorescence of Rh–B in abaxial surfaces of lettuce plants was lower than its accumulation under all three light conditions. After, the Rh–B emission under full sunlight decreased rapidly and eventually decreased to less than those under 20% or 50% light condition. Nevertheless, the Rh–B fluorescence on abaxial surfaces is detectable for about 4 weeks under 100% solar radiation. The rate of Rh–B photodegradation is subject to different light conditions. The results of the Rh–B signal were expected to show that there are significant differences in the mean fluorescence intensity of the abaxial surfaces of lettuce plants after 27 days of transplanting. These differences exist between the control group and the Rh–B treated group, as well as among different Rh–B treated groups under three light conditions. The visibility of Rh–B in lettuce abaxial surface during the 2nd week was stronger than its initial visibility. The visibility of Rh–B under full sunlight dropped to less than 20% after 27 days, which was lower than those at 20% and 50% illumination conditions, but still higher than that of the control group. Significant differences in Rh–B fluorescence were observed between the treatment group and the control group under each of the above irradiations. For plants in three treatment groups, the Rh–B signal mainly appeared in the outer leaves, while there was no dye fluorescence observed in the new leaves of the inner layer. Similar results have already been observed in celery plants (both top view and bottom view) grown outdoors for about 4 weeks (Figure 2) [53]. It is known that Romaine lettuce in North America is sold as a whole head after removing the outer leaves, which means that only the inner leaves without the marker will be consumed by consumers. Overall, the 20% and 50% illuminations can help to slow the decay of Rh–B fluorescence. Rh–B signals on abaxial surfaces can be effectively detected in lettuce plants under three light conditions for 27 days.
The movement and persistence of Rh–B on adaxial surfaces (top view) of lettuce and tomato plants should also be evaluated. The fluorescence intensities of Rh–B under three illumination conditions would be steadily weakened after plant transplantation. On the 27th day, the Rh–B fluorescence of adaxial surfaces under the 20% illumination was higher than that under the 50% illumination, while the fluorescence value under the full daylight was the lowest. The mean Rh–B fluorescence on the entire adaxial surface was higher than the intensity of the samples from the control group. Similarly, the stems of celery plants showed very strong Rh–B signals, as seen from the top view of Figure 2. The fluorescent signals of Rh–B are anticipated to be clearly detected at the ribs of the outer leaves of lettuce. Besides lettuce crops, similar results are expected to be obtained in Rh–B-treated tomato seedlings as well. After a 27-day outdoor exposure, the Rh–B fluorescence on the entire adaxial surfaces of both the lettuce and tomato plants under reduced sunlight (20% or 50%) irradiations should show higher photostability than that under 100% sunlight. These reduced light treatments are experimental and not feasible for real outdoor weed control. The Rh–B fluorescence in treated plants is stronger than that in the control group under 100% sunlight condition, which will make it possible to identify the crop plants in the field based on the Rh–B marker. In recent studies, the locations of lettuce and tomato were successfully determined using topical fluorescent markers or plant labels directly applied to the crop plants [54,55]. The stem soil entry locations of these vegetable crops in the top view and side view images were easily recognized by measuring the center of mass. Based on their proposed crop signaling approaches, real-time weed control can be achieved in field experiments. Accordingly, the anticipated results of our study would show the reliability of Rh–B as a robot-identifiable systemic signal for outdoor weed control.
2.5. Effects of Rh–B on Plant Growth
Since Rh–B may pose a potential risk to the normal growth of lettuce and tomato, the effect of Rh–B on the plant vigor would be assessed. Lettuce plants in the first experiment are treated with Rh–B solution of 60 ppm for 36 h. Plants are harvested and weighed after growing in outdoor soil for 3 weeks. The results are expected to show that there is no difference in the biomass of fresh foliage of lettuce between Rh–B treated group and control group. In the second experiment, both lettuce and tomato seedlings are soaked in the Rh–B solution for 48 h before transplanting to soil and growing under three illumination conditions. The foliar biomass is measured 4 weeks after transplanting. No difference is anticipated to be observed in foliage biomass between Rh–B treated and control plants, regardless of lettuce or tomato. Furthermore, there would be no difference in tomato fruit yield between the control group and the treatment group. This suggests that Rh–B in tomato tissues have no negative impact on subsequent generations. Overall, the application of this dosage of Rh–B to seedling roots of both lettuce and tomato for 48 h does not inhibit plant growth. The Rh–B fluorescence parameters taken from the seedlings are related to the intensities of the optical signals of this compound. The chlorophyll fluorescence parameter of the entire crop plant will also be determined to evaluate the chlorosis. Although the seedlings may not show obvious symptoms of toxicity including chlorosis and wilting toxicity, the content of the Rh–B compound in lettuce leaves and tomato fruits should be tested for food safety in future study.
3. Materials and Methods
3.1. Fluorescence Macroscope and Spectroscopic Sensor
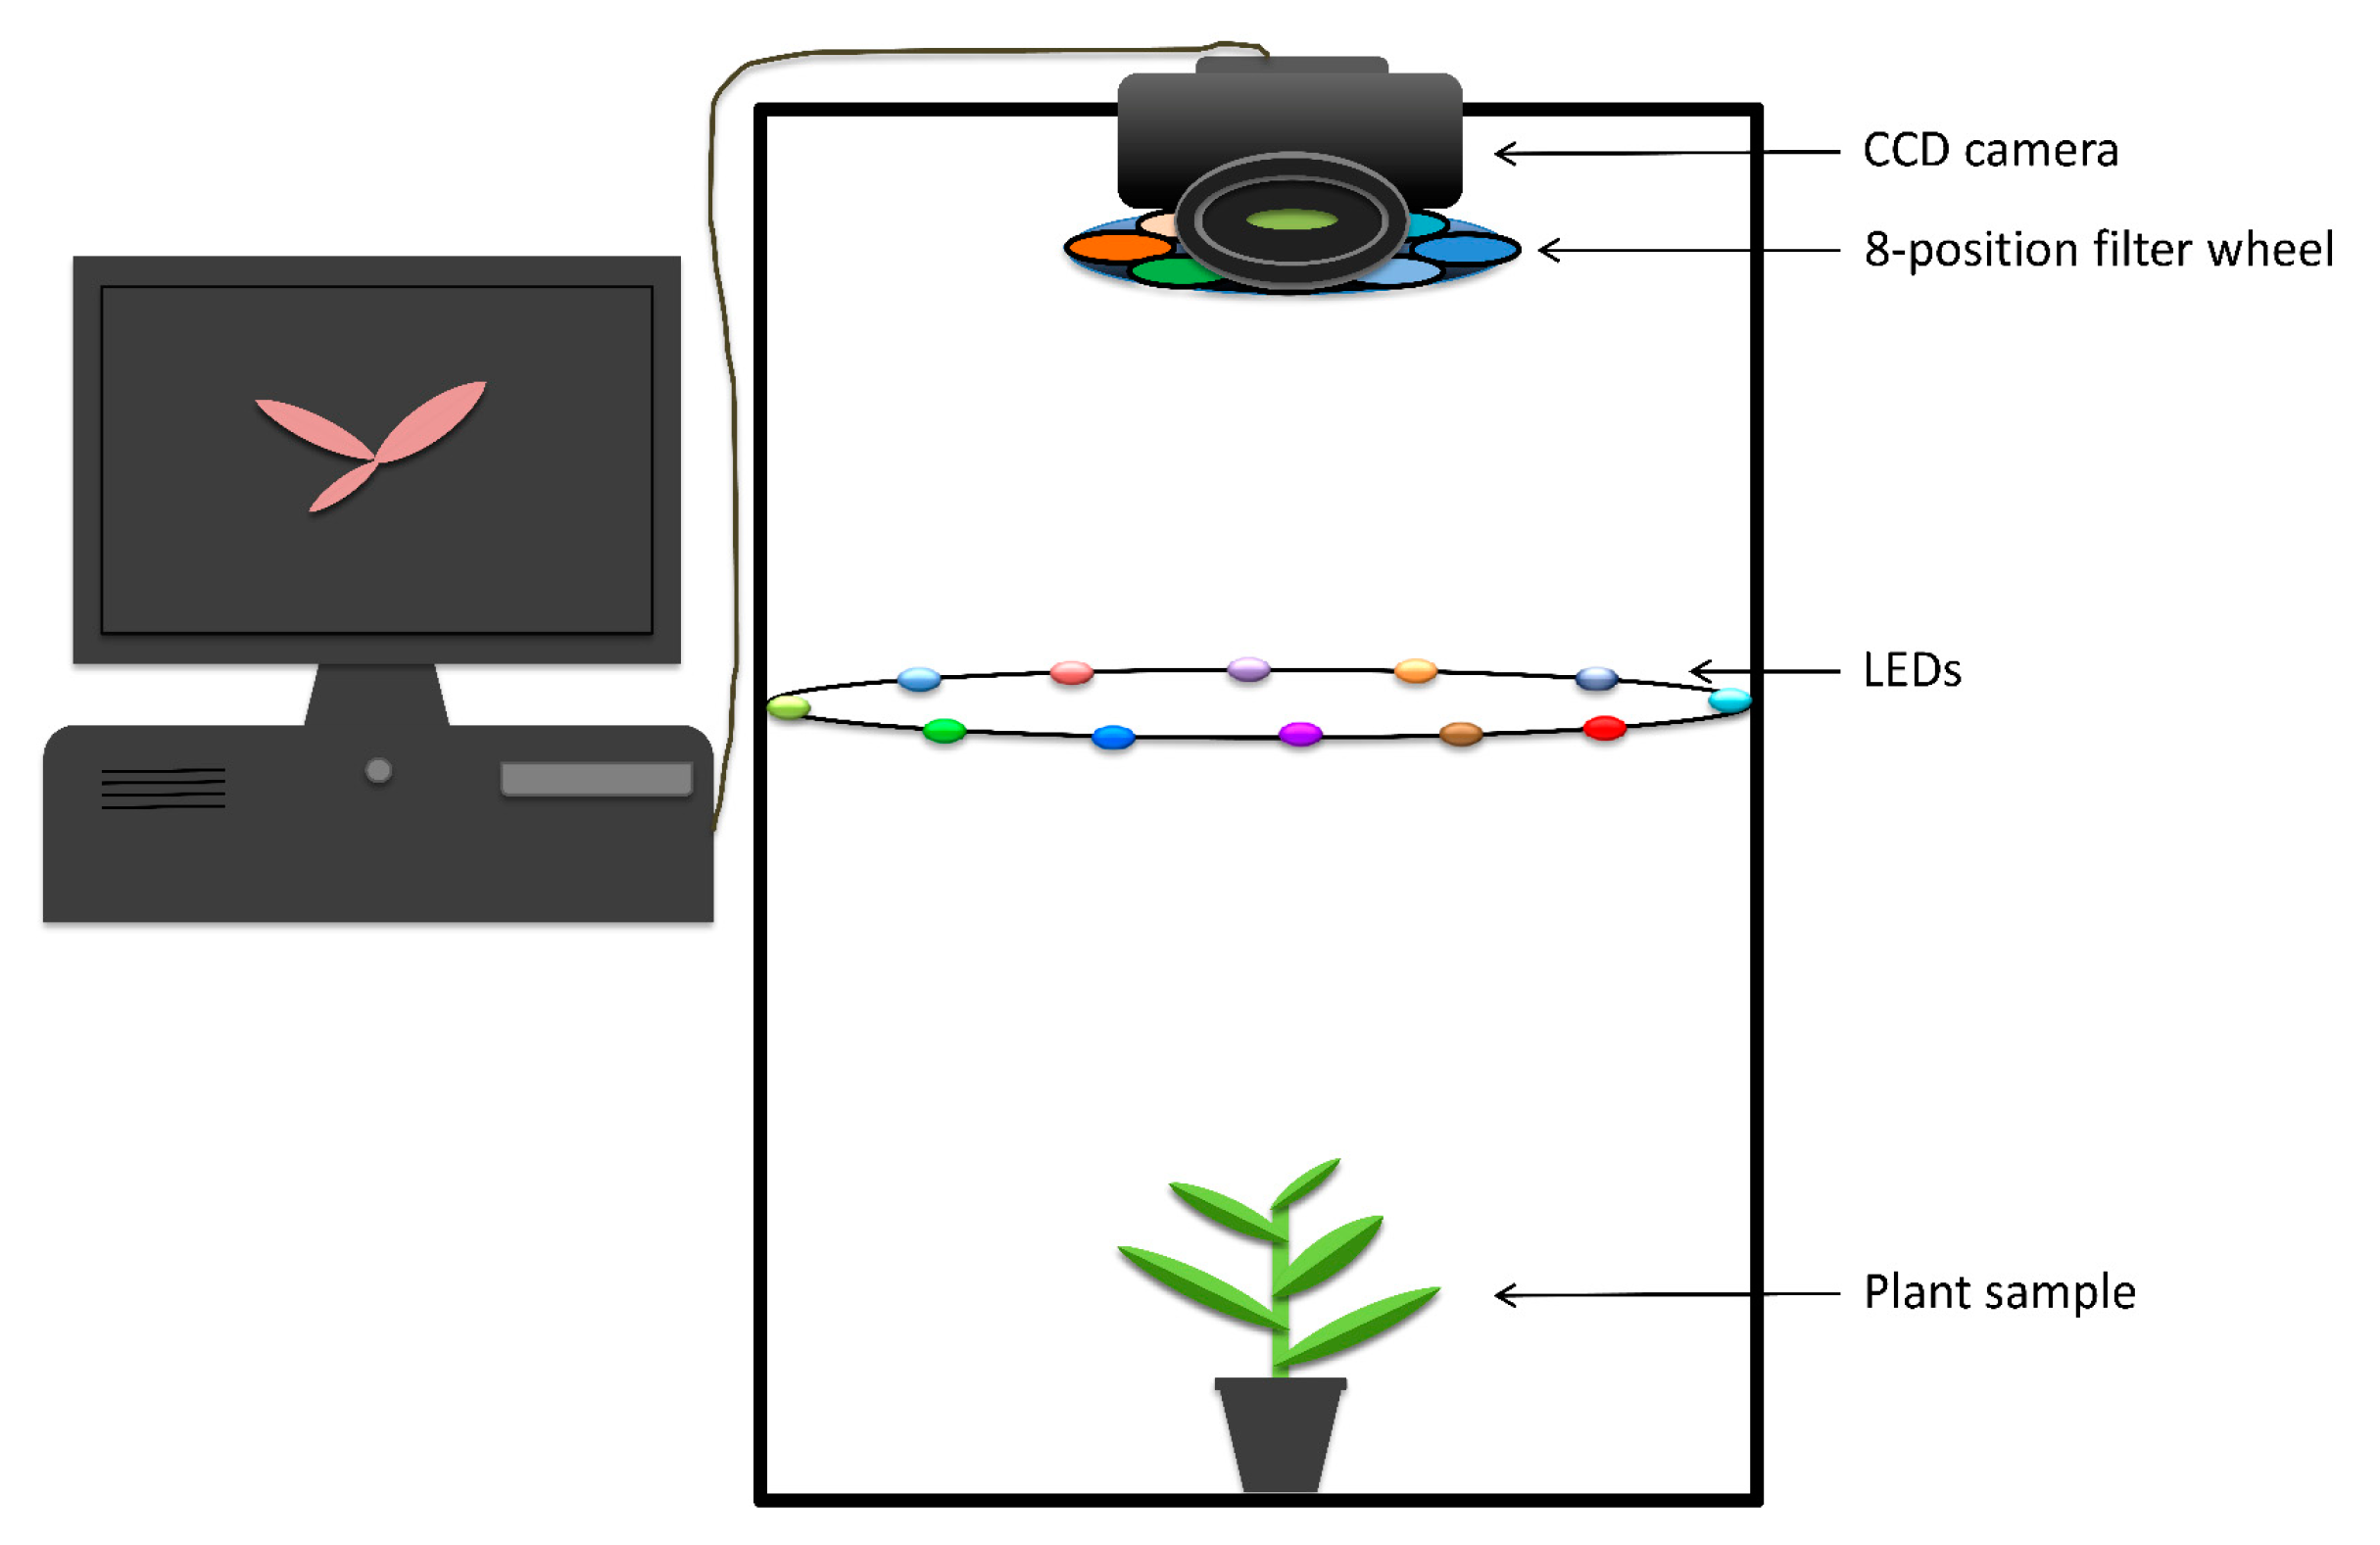
The fluorescence imaging system used in this project consists of a desktop computer and an imaging chamber (Figure 3). The chamber includes a multispectral monochrome camera, a green illumination device, and a couple of optical filters. Computer software is used to control the imaging unit and the light panel to capture plant fluorescence images. The imaging unit (QSI 660 6.1, Quantum Scientific Imaging, Inc., Poplarville, MS, USA) is a charge coupled device (CCD) camera located in the upper part of the chamber. The camera is coupled with a filter wheel with two bandpass emission filters centred at 675 nm (FF02-675/67-31-D) and 575 nm (FF03-575/25-31-D) to ensure that only the wavelengths emitted from a plant reach the detector. The lamp panel positioned in the center consists of 12 light-emitting diode (LED) lamps (peak intensity at 523 nm) (Model LZ4-40G108-0000, 10 Watt, LED Engin Inc., San Jose, CA, USA). A total of 12 short-pass filters (FES0550, 25 mm, 10 Watt, Thorlabs Inc., Newton, NJ, USA) are mounted in front of 523 nm LEDs to block any light more than 550 nm. A mirror is placed on the bottom right side of the chamber to allow a side view of a target plant located at the bottom of the chamber.
A spectrometer in the region of 350 to 1050 nm (model Glacier X, thermoelectrically cooled, 2048 element, B&W Tek, Newark, DE, USA) is utilized to collect the emission light of lettuce leaf under the 523 nm LED. Spectral data are recorded by placing the optic probe of spectrometer in the imaging chamber in close to lettuce leaf ribs containing Rh–B and control leaves (healthy and green), respectively. A computer is used to perform control of the spectrometer.
3.2. Plant Treatment and Imaging
Two experiments are planned to be conducted to investigate whether the application of 60 ppm Rh–B to plants roots before transplanting could affect their subsequent growth and the photostability of Rh–B in plants under different light conditions (seven hours of solar radiation per day). In the first trial, the root pellets of 360 Romaine lettuce seedlings from a commercial transplant supplier are submerged in a Rh–B solution of 60 ppm or deionized (DI) water for 36 h (180 samples per treatment). On day 1, day 8, day 15, and day 22, the plants are placed in the imaging chamber for image collection. After, both 360 Romaine lettuces and 360 tomatoes will be planted in the second trial. In addition to the Rh–B and control treatments, the factor of illumination was added in this study. The three light conditions are (1) 20% sunlight for plants grown in a glass greenhouse with an illumination level of 20% of natural sunlight (both visible and UV light were at this level), (2) 50% sunlight for plants grown in a polycarbonate greenhouse with all UV light absorbed by the polycarbonate (no UV light on the plants) and the visible portion was 50% of the level of natural sunlight, and (3) 100% sunlight for plants grown outdoors (9 plants for each group). The fluorescence images of plants are collected after transplanting at different days 0, 6, 13, 20, and 27 days. All plants are illuminated by the 523 nm green light. For each plant, two images are acquired based on filters at 675 nm and 575 nm, respectively. The 675 nm image (exposure time = 2 s) is for chlorophyll fluorescence, while the 575 nm image (exposure time = 5 s) is for Rh–B fluorescence. Besides a top view, a side view is provided by a mirror nearby the plant. After harvesting, the above ground fresh biomass of each plant will be collected.
3.3. Visualization of Fluorescence Signals
After imaging of Rh–B and chlorophyll, quantitative measurements of their fluorescence intensities will be performed. The average intensity measurement of a plant in an image typically requires three steps, involving region of interest (ROI) selection, segmentation of background, and calculation of the mean intensity from the ROI. Fluorescence intensity in each ROI is extracted by using the open source software (Fiji ImageJ, National Institutes of Health, Bethesda, MD, USA). The main operations are as follows: (a) converting an original image into a pseudo color image; (b) setting a threshold to select entire leaves of both control and treated plants as the ROI using “Image −> Adjust −> Threshold”; (c) selecting measurement parameters (such as the standard deviation and the mean gray value) to be acquired using the “Analyze −> Set Measurements” command; (d) Extracting the mean value of the pixels bounded by the ROI using the “Analyze −> Measure” command. Differences of the mean intensity of plant fluorescence signals were evaluated by Tukey honestly significant difference (HSD) test, and analysis of variance (ANOVA) based on IBM SPSS Statistics 24.0 version (SPSS Inc., Chicago, IL, USA).
4. Discussion
Visibility of Rh–B tracer and its application on the vigor of lettuce and tomato are evaluated under three illumination conditions. In this project, green light at 523 nm is selected instead of UV light to excite Rh–B, because the green light illumination proved to have higher performance [40]. Although the uptake of Rh–B via roots to the aerial parts of both lettuce and tomato crops can be observed, the translocation and accumulation of this dye differ between the two different plant architectures. The translocation of Rh–B and its accumulation in plant above ground tissues are regulated by leaf architecture and transpiration flow pattern. Rh–B has been shown to move through tomato stems to leaves, but the dye in lettuce is transported directly to leaf ribs since the Romaine lettuce plant does not have a stem. This means that Rh–B tracer can readily reach the leaves of lettuce plants, but it has to travel a longer distance (from roots to subapical tissues) to be transported to different layers of tomato leaves. As the Rh–B solution can more easily reach the leaves on side branches that are closer to tomato roots, the accumulation of Rh–B in those lower leaves is higher than that of upper leaves. Overall, the distribution of Rh–B in lettuce leaves appears similar, while the Rh–B aggregation in different parts of the tomato plants is very non-homogeneous.
It is feasible to use the Rh–B solution following the root pathway to distinguish control plants from vegetable plants containing this marker. The systemic Rh–B solution of 60 ppm applied to lettuce roots for 36 h is detectable for about 3 weeks under full sunlight, while the same concentration of Rh–B applied to plant roots for 48 h is detected in both lettuce and tomato plants for about 4 weeks regardless of sunlight conditions (33%, 75% or 100%). The duration of treatment of plant roots with Rh–B solution affects the visibility of the fluorescent signal in plant leaves. The solar radiation level is also a factor affecting the visibility of Rh–B in plants. A reduced dose of excitation light is helpful for reduction of photobleaching [56]. In this project, the reduced light treatments (20% and 50%) would extend the persistence of Rh–B fluorescence on plants, but these experimental lights are not feasible for weed control in the field. The 60 ppm Rh–B is considered a safe dose for lettuce and tomato plants. In a recent study, Su, Slaughter and Fennimore [46] demonstrated that the application of 60 ppm Rh–B to celery roots for more than 48 h would significantly impact the plant vigor and growth. Therefore, this dose of Rh–B allows lettuce and tomato plants grown under sunlight to be continuously detected for about 4 weeks and these vegetable plants can tolerate the root treatment of this solution. Nevertheless, more research is expected to be conducted in different seasons and latitudes to further evaluate the photobleaching of Rh–B and its effects on plant development. The absorption and transmission of Rh–B may also depend on the plant species. For example, the same Rh–B may behave differently in various plants with different genetic traits. The impact of the Rh–B dye on other plant species should be assessed to study the effectiveness of the crop signaling technique.
This systemic crop signaling could provide useful spatial information for finding the location of crop plants in the field. As the fluorescence emission of Rh–B lasted about 4 weeks under natural conditions, the Rh–B signal in crop plants could be constantly detected during that period. The chlorophyll images captured in the study can be used as the basis for extracting plant materials containing Rh–B labels. Based on the fluorescence images of Rh–B and chlorophyll, the plant root or main stem can be exactly located. In the recent study of Raja, Nguyen, Slaughter and Fennimore [55], the lettuce plants with topical markers were effectively classified from weeds using two images including one white light illuminated image for all green plants and one UV light illumination image for the topical marker. Although the Rh–B signal in the top view images of plants appears a little bit difficult to detect after 27 days, the position of the plant in the field can still be easily located based on stronger Rh–B signals in the side view images. For example, Raja, Slaughter, Fennimore, Nguyen, Vuong, Sinha, Tourte, Smith and Siemens [36] developed a multi-view imaging system that successfully determined the location of tomato plants, especially when the fluorescent labels (plastic straws) applied to the plants were not visible from the top because of the occlusion of crops or weeds. The plant position was readily calculated based on the plant label geometric appearance in the six mirror images on different sides of the plant. The detection results were successfully used to guide the path of a robotic weed knife, thereby automatically controlling weeds in lettuce and tomato crops [54]. In order to realize the real-time detection of various vegetable crops with systemic Rh–B, it is required to develop a more sensitive computer vision system that can acquire images within 3 to 5 milliseconds to meet the speed of over 3 km h−1. The ultimate goal of this project is to develop an intelligent machine using systemic crop signaling to automatically identify vegetable crops and remove universal intra-row weeds at early growth stages in the field.
5. Conclusions
Rh–B is used as a temporary systemic signal to indicate the location of lettuce and tomato plants grown under different levels of sunlight. The Rh–B at 60 ppm could be transported into the plant leaves through the root system and detected in adaxial and abaxial surfaces of plant leaves. The systemic Rh–B does not show negative effect on the plant vigor. Reduced solar radiations are helpful for mitigating Rh–B fluorescence decay. After plant roots are exposed to the Rh–B solution for 48 h, the Rh–B signal in lettuce and tomato plants is identifiable for 27 days under full sunlight without risk of crop yield loss, making it an indispensable signal for potential applications in plant/machine interaction. In conclusion, systemic crop signaling using root treatment can reliably recognize transplanted lettuce and tomato plants for early season weed control. On-line recognition of crop locations in the field would assist in the successful execution of automated tasks, such as precision spraying and in-row weeding.
Funding
This research received no external funding.
Conflicts of Interest
The author declares no conflict of interest.
References
- Fennimore, S.A.; Slaughter, D.C.; Siemens, M.C.; Leon, R.G.; Saber, M.N. Technology for automation of weed control in specialty crops. Weed Technol. 2016, 30, 823–837. [Google Scholar] [CrossRef]
- Mennan, H.; Jabran, K.; Zandstra, B.H.; Pala, F. Non-Chemical Weed Management in Vegetables by Using Cover Crops: A Review. Agronomy 2020, 10, 257. [Google Scholar] [CrossRef] [Green Version]
- Westwood, J.H.; Charudattan, R.; Duke, S.O.; Fennimore, S.A.; Marrone, P.; Slaughter, D.C.; Swanton, C.; Zollinger, R. Weed management in 2050: Perspectives on the future of weed science. Weed Sci. 2018, 66, 275–285. [Google Scholar] [CrossRef] [Green Version]
- Tillett, N.; Hague, T.; Grundy, A.; Dedousis, A. Mechanical within-row weed control for transplanted crops using computer vision. Biosyst. Eng. 2008, 99, 171–178. [Google Scholar] [CrossRef]
- Wortman, S.E.; Forcella, F.; Lambe, D.; Clay, S.A.; Humburg, D. Profitability of abrasive weeding in organic grain and vegetable crops. Renew. Agric. Food Syst. 2020, 35, 215–220. [Google Scholar] [CrossRef]
- Lee, W.S.; Slaughter, D.; Giles, D. Robotic weed control system for tomatoes. Precis. Agric. 1999, 1, 95–113. [Google Scholar] [CrossRef]
- Fennimore, S.A.; Cutulle, M. Robotic weeders can improve weed control options for specialty crops. Pest Manag. Sci. 2019, 75, 1767–1774. [Google Scholar] [CrossRef]
- Su, W.-H. Advanced Machine Learning in Point Spectroscopy, RGB- and Hyperspectral-Imaging for Automatic Discriminations of Crops and Weeds: A Review. Smart Cities 2020, 3, 767–792. [Google Scholar] [CrossRef]
- Slaughter, D.C. The biological engineer: Sensing the difference between crops and weeds. In Automation: The Future of Weed Control in Cropping Systems; Springer: Berlin, Germany, 2014; pp. 71–95. [Google Scholar]
- Thorp, K.; Tian, L. A review on remote sensing of weeds in agriculture. Precis. Agric. 2004, 5, 477–508. [Google Scholar] [CrossRef]
- Su, W.-H.; Bakalis, S.; Sun, D.-W. Potato hierarchical clustering and doneness degree determination by near-infrared (NIR) and attenuated total reflectance mid-infrared (ATR-MIR) spectroscopy. J. Food Meas. Charact. 2019, 13, 1218–1231. [Google Scholar] [CrossRef]
- Slaughter, D.; Lanini, W.; Giles, D. Discriminating weeds from processing tomato plants using visible and near-infrared spectroscopy. Trans. ASAE 2004, 47, 1907. [Google Scholar] [CrossRef]
- Shapira, U.; Herrmann, I.; Karnieli, A.; Bonfil, D.J. Field spectroscopy for weed detection in wheat and chickpea fields. Int. J. Remote Sens. 2013, 34, 6094–6108. [Google Scholar] [CrossRef] [Green Version]
- Su, W.-H.; Sun, D.-W. Advanced analysis of roots and tubers by hyperspectral techniques. In Advances in Food and Nutrition Research; Elsevier: Amsterdam, The Netherlands, 2019; Volume 87, pp. 255–303. [Google Scholar]
- Su, W.-H.; Bakalis, S.; Sun, D.-W. Fingerprinting study of tuber ultimate compressive strength at different microwave drying times using mid-infrared imaging spectroscopy. Dry. Technol. 2019, 37, 1113–1130. [Google Scholar] [CrossRef]
- Su, W.-H.; Sun, D.-W. Evaluation of spectral imaging for inspection of adulterants in terms of common wheat flour, cassava flour and corn flour in organic Avatar wheat (Triticum spp.) flour. J. Food Eng. 2017, 200, 59–69. [Google Scholar] [CrossRef]
- Su, W.-H.; Sun, D.-W. Facilitated wavelength selection and model development for rapid determination of the purity of organic spelt (Triticum spelta L.) flour using spectral imaging. Talanta 2016, 155, 347–357. [Google Scholar] [CrossRef]
- Su, W.-H.; Bakalis, S.; Sun, D.-W. Chemometric determination of time series moisture in both potato and sweet potato tubers during hot air and microwave drying using near/mid-infrared (NIR/MIR) hyperspectral techniques. Dry. Technol. 2019, 38, 1–18. [Google Scholar] [CrossRef]
- Su, W.-H.; Bakalis, S.; Sun, D.-W. Chemometrics in tandem with near infrared (NIR) hyperspectral imaging and Fourier transform mid infrared (FT-MIR) microspectroscopy for variety identification and cooking loss determination of sweet potato. Biosyst. Eng. 2019, 180, 70–86. [Google Scholar] [CrossRef]
- Su, W.-H.; Sun, D.-W. Chemical imaging for measuring the time series variations of tuber dry matter and starch concentration. Comput. Electron. Agric. 2017, 140, 361–373. [Google Scholar] [CrossRef]
- Su, W.-H.; Sun, D.-W. Potential of hyperspectral imaging for visual authentication of sliced organic potatoes from potato and sweet potato tubers and rapid grading of the tubers according to moisture proportion. Comput. Electron. Agric. 2016, 125, 113–124. [Google Scholar] [CrossRef]
- Su, W.-H.; He, H.-J.; Sun, D.-W. Non-destructive and rapid evaluation of staple foods quality by using spectroscopic techniques: A review. Crit. Rev. Food Sci. Nutr. 2017, 57, 1039–1051. [Google Scholar] [CrossRef]
- Su, W.-H.; Sun, D.-W. Comparative assessment of feature-wavelength eligibility for measurement of water binding capacity and specific gravity of tuber using diverse spectral indices stemmed from hyperspectral images. Comput. Electron. Agric. 2016, 130, 69–82. [Google Scholar] [CrossRef]
- Zhang, Y.; Staab, E.S.; Slaughter, D.C.; Giles, D.K.; Downey, D. Automated weed control in organic row crops using hyperspectral species identification and thermal micro-dosing. Crop Prot. 2012, 41, 96–105. [Google Scholar] [CrossRef]
- Zhang, Y.; Slaughter, D.C.; Staab, E.S. Robust hyperspectral vision-based classification for multi-season weed mapping. ISPRS J. Photogramm. Remote Sens. 2012, 69, 65–73. [Google Scholar] [CrossRef]
- Bakhshipour, A.; Jafari, A. Evaluation of support vector machine and artificial neural networks in weed detection using shape features. Comput. Electron. Agric. 2018, 145, 153–160. [Google Scholar] [CrossRef]
- Lee, S.H.; Chan, C.S.; Wilkin, P.; Remagnino, P. Deep-Plant: Plant Identification With Convolutional Neural Networks. In Proceedings of the 2015 IEEE International Conference on Image Processing (ICIP), Quebec, QC, Canada, 27–30 September 2015; pp. 452–456. [Google Scholar]
- Cho, H.; Kim, M.S.; Kim, S.; Lee, H.; Oh, M.; Chung, S.H. Hyperspectral Determination of Fluorescence Wavebands for Multispectral Imaging Detection of Multiple Animal Fecal Species Contaminations on Romaine Lettuce. Food Bioprocess Technol. 2018, 11, 774–784. [Google Scholar] [CrossRef]
- Su, W.H.; Sun, D.W. Multispectral imaging for plant food quality analysis and visualization. Compr. Rev. Food Sci. Food Saf. 2018, 17, 220–239. [Google Scholar] [CrossRef] [Green Version]
- Larsson, M.; Favilla, R.; Strömberg, T. Assessment of advanced glycated end product accumulation in skin using auto fluorescence multispectral imaging. Comput. Biol. Med. 2017, 85, 106–111. [Google Scholar] [CrossRef] [Green Version]
- Han, D.; Yao, H.; Hruska, Z.; Kincaid, R.; Rajasekaran, K.; Bhatnagar, D. Development of High-Speed Dual-Camera System for Batch Screening of Aflatoxin Contamination of Corn Using Multispectral Fluorescence Imaging. Trans. ASABE 2019, 62, 381–391. [Google Scholar] [CrossRef]
- Kennedy, H.; Fennimore, S.A.; Slaughter, D.C.; Nguyen, T.T.; Vuong, V.L.; Raja, R.; Smith, R.F. Crop signal markers facilitate crop detection and weed removal from lettuce and tomato by an intelligent cultivator. Weed Technol. 2019, 34, 1–32. [Google Scholar] [CrossRef]
- Inoue, J.; Chamberlain, K.; Bromilow, R.H. Physicochemical factors affecting the uptake by roots and translocation to shoots of amine bases in barley. Pestic. Sci. 1998, 54, 8–21. [Google Scholar] [CrossRef]
- Hsu, F.C.; Marxmiller, R.L.; Yang, A.Y. Study of root uptake and xylem translocation of cinmethylin and related compounds in detopped soybean roots using a pressure chamber technique. Plant Physiol. 1990, 93, 1573–1578. [Google Scholar] [CrossRef] [Green Version]
- Peterson, C.A.; Emanuel, M.E.; Humphreys, G. Pathway of movement of apoplastic fluorescent dye tracers through the endodermis at the site of secondary root formation in corn (Zea mays) and broad bean (Vicia faba). Can. J. Bot. 1981, 59, 618–625. [Google Scholar] [CrossRef]
- Raja, R.; Slaughter, D.C.; Fennimore, S.A.; Nguyen, T.T.; Vuong, V.L.; Sinha, N.; Tourte, L.; Smith, R.F.; Siemens, M.C. Crop signalling: A novel crop recognition technique for robotic weed control. Biosyst. Eng. 2019, 187, 278–291. [Google Scholar] [CrossRef]
- Su, W.-H.; Fennimore, S.A.; Slaughter, D.C. Computer Vision Technology for Identification of Snap Bean Crops using Systemic Rhodamine B. In Proceedings of the ASABE Annual International Meeting, Boston, MA, USA, 7–10 July 2019; American Society of Agricultural and Biological Engineers: Saint Joseph, MI, USA, 2019; p. 1. [Google Scholar]
- Su, W.-H.; Fennimore, S.A.; Slaughter, D.C. Fluorescence imaging for rapid monitoring of translocation behaviour of systemic markers in snap beans for automated crop/weed discrimination. Biosyst. Eng. 2019, 186, 156–167. [Google Scholar] [CrossRef]
- Wang, Z.; Amirkhani, M.; Avelar, S.A.; Yang, D.; Taylor, A.G. Systemic Uptake of Fluorescent Tracers by Soybean (Glycine max (L.) Merr.) Seed and Seedlings. Agriculture 2020, 10, 248. [Google Scholar] [CrossRef]
- Su, W.-H.; Fennimore, S.A.; Slaughter, D.C. Development of a systemic crop signalling system for automated real-time plant care in vegetable crops. Biosyst. Eng. 2020, 193, 62–74. [Google Scholar] [CrossRef]
- Salanenka, Y.A.; Taylor, A.G. Seedcoat permeability: Uptake and post-germination transport of applied model tracer compounds. HortScience 2011, 46, 622–626. [Google Scholar] [CrossRef]
- Qu, P.; Zhao, J.; Shen, T.; Hidaka, H. TiO2-assisted photodegradation of dyes: A study of two competitive primary processes in the degradation of RB in an aqueous TiO2 colloidal solution. J. Mol. Catal. A Chem. 1998, 129, 257–268. [Google Scholar] [CrossRef]
- Watanabe, T.; Takizawa, T.; Honda, K. Photocatalysis through excitation of adsorbates. 1. Highly efficient N-deethylation of rhodamine B adsorbed to cadmium sulfide. J. Phys. Chem. 1977, 81, 1845–1851. [Google Scholar] [CrossRef]
- Wilhelm, P.; Stephan, D. Photodegradation of rhodamine B in aqueous solution via SiO2@ TiO2 nano-spheres. J. Photochem. Photobiol. A Chem. 2007, 185, 19–25. [Google Scholar] [CrossRef]
- Song, L.; Hennink, E.; Young, I.T.; Tanke, H.J. Photobleaching kinetics of fluorescein in quantitative fluorescence microscopy. Biophys. J. 1995, 68, 2588–2600. [Google Scholar] [CrossRef]
- Su, W.-H.; Slaughter, D.C.; Fennimore, S.A. Non-destructive evaluation of photostability of crop signaling compounds and dose effects on celery vigor for precision plant identification using computer vision. Comput. Electron. Agric. 2020, 168, 105155. [Google Scholar] [CrossRef]
- O’brien, J.; Wilson, I.; Orton, T.; Pognan, F. Investigation of the Alamar Blue (resazurin) fluorescent dye for the assessment of mammalian cell cytotoxicity. Eur. J. Biochem. 2000, 267, 5421–5426. [Google Scholar] [CrossRef] [PubMed]
- Borsuk, A.M.; Brodersen, C.R. The spatial distribution of chlorophyll in leaves. Plant Physiol. 2019, 180, 1406–1417. [Google Scholar] [CrossRef] [Green Version]
- Sadiq, I.M.; Pakrashi, S.; Chandrasekaran, N.; Mukherjee, A. Studies on toxicity of aluminum oxide (Al2O3) nanoparticles to microalgae species: Scenedesmus sp. and Chlorella sp. J. Nanoparticle Res. 2011, 3287–3299. [Google Scholar] [CrossRef]
- Falco, W.; Botero, E.; Falcão, E.; Santiago, E.; Bagnato, V.; Caires, A. In vivo observation of chlorophyll fluorescence quenching induced by gold nanoparticles. J. Photochem. Photobiol. A Chem. 2011, 225, 65–71. [Google Scholar] [CrossRef]
- Rico, C.M.; Hong, J.; Morales, M.I.; Zhao, L.; Barrios, A.C.; Zhang, J.-Y.; Peralta-Videa, J.R.; Gardea-Torresdey, J.L. Effect of cerium oxide nanoparticles on rice: A study involving the antioxidant defense system and in vivo fluorescence imaging. Environ. Sci. Technol. 2013, 47, 5635–5642. [Google Scholar] [CrossRef]
- Lawson, T.; Vialet-Chabrand, S. Chlorophyll fluorescence imaging. In Photosynthesis; Covshoff, S., Ed.; Springer: Berlin, Germany, 2018; pp. 121–140. [Google Scholar]
- Su, W.-H.; Fennimore, S.A.; Slaughter, D.C. Development of a Novel Root Treatment Technique Using Systematic Fluorescent Compounds for Precision Weed Control. In Proceedings of the 2020 ASABE Annual International Virtual Meeting, Omaha, NE, USA, 13–15 July 2020; ASABE: St. Joseph, MI, USA, 2020; p. 1. [Google Scholar]
- Raja, R.; Nguyen, T.T.; Slaughter, D.C.; Fennimore, S.A. Real-time robotic weed knife control system for tomato and lettuce based on geometric appearance of plant labels. Biosyst. Eng. 2020, 194, 152–164. [Google Scholar] [CrossRef]
- Raja, R.; Nguyen, T.T.; Slaughter, D.C.; Fennimore, S.A. Real-time weed-crop classification and localisation technique for robotic weed control in lettuce. Biosyst. Eng. 2020, 192, 257–274. [Google Scholar] [CrossRef]
- Hoebe, R.; Van Oven, C.; Gadella, T.W.; Dhonukshe, P.; Van Noorden, C.; Manders, E. Controlled light-exposure microscopy reduces photobleaching and phototoxicity in fluorescence live-cell imaging. Nat. Biotechnol. 2007, 25, 249–253. [Google Scholar] [CrossRef]
Figure 1.
Rh–B (Rhodamine B) visibility in celery plants for 27 days under sunlight [46].
Figure 1.
Rh–B (Rhodamine B) visibility in celery plants for 27 days under sunlight [46].

Figure 2.
Pseudo-color images of Rh–B-treated celery grown under sunlight for about 4 weeks [53].
Figure 2.
Pseudo-color images of Rh–B-treated celery grown under sunlight for about 4 weeks [53].

Figure 3.
Photo of the set-up of the fluorescence macroscope [30].
Figure 3.
Photo of the set-up of the fluorescence macroscope [30].

© 2020 by the author. Licensee MDPI, Basel, Switzerland. This article is an open access article distributed under the terms and conditions of the Creative Commons Attribution (CC BY) license (http://creativecommons.org/licenses/by/4.0/).
Share and Cite
MDPI and ACS Style
Su, W.-H. Systemic Crop Signaling for Automatic Recognition of Transplanted Lettuce and Tomato under Different Levels of Sunlight for Early Season Weed Control. Challenges 2020, 11, 23. https://0-doi-org.brum.beds.ac.uk/10.3390/challe11020023
AMA Style
Su W-H. Systemic Crop Signaling for Automatic Recognition of Transplanted Lettuce and Tomato under Different Levels of Sunlight for Early Season Weed Control. Challenges. 2020; 11(2):23. https://0-doi-org.brum.beds.ac.uk/10.3390/challe11020023
Chicago/Turabian StyleSu, Wen-Hao. 2020. "Systemic Crop Signaling for Automatic Recognition of Transplanted Lettuce and Tomato under Different Levels of Sunlight for Early Season Weed Control" Challenges 11, no. 2: 23. https://0-doi-org.brum.beds.ac.uk/10.3390/challe11020023
Note that from the first issue of 2016, this journal uses article numbers instead of page numbers. See further details here.