
Determinants of Smallholders’ Food Security Status in Kalu District, Northern Ethiopia


1
Department of Agricultural Economics, Mizan Tepi University, Mizan-Teferi 5160, Ethiopia
2
Department of Agricultural Economics, Blue Nile Water Institute, Bahirdar University, Bahir Dar 6000, Ethiopia
*
Author to whom correspondence should be addressed.
Challenges 2021, 12(2), 17; https://0-doi-org.brum.beds.ac.uk/10.3390/challe12020017
Submission received: 1 April 2021
/
Revised: 14 June 2021
/
Accepted: 23 June 2021
/
Published: 25 June 2021
Abstract
:This study analyzed the determinants of rural households’ food security in the Kallu district of the Amhara region, Northern Ethiopia. The study used primary data collected from 395 randomly selected rural households. The study employed descriptive statistics and a binary logit model to estimate the status and determinants of smallholders’ food security, respectively. Of the total sample households, 47.30% are food insecure. The binary logit model results showed that sex and education level of the household head, livestock ownership, credit access, and technology adoption have positive and significant effects on food security, while age and market distance are negatively associated with the probability to be food secure. The results suggest that improving access to marketing and financial services will contribute to improving the food security status of smallholders.
1. Introduction
Food security is among the major issues addressed in the international development agendas, including the sustainable development goals (SDGs). This demonstrates its equal importance for both developed and developing countries. A FAO (Food and Agricultural Organization) report indicated that, globally, 815 million people are undernourished, and the trend is even increasing compared to previous years. The majority of undernourished people are from developing countries [1].
Ethiopia is among Sub-Saharan African countries repeatedly mentioned in connection with the food insecurity problem. The daily calorie consumption in Ethiopia is below 2100 kcal/person/day [2]. By the year 2019, about 8.1 million people would require emergency food assistance. Although there have been efforts to achieve food security at the household level in Ethiopia, nearly 25 percent of the population still lives below the nationally defined poverty line [3]. Among others, land fragmentation, land degradation, crop failure, and high food price have contributed to a high prevalence of food insecurity in the country. Combining these aforementioned challenges with recurring droughts over the years has substantially eroded the productive resources of households, such as cultivation land, forests, and pastures, leading to high rates of environmental degradation and increased pressure on farmland. This, in turn, has aggravated the vulnerability of smallholder farmers in the country, especially during seasonal food shortages.
In Ethiopia, most food shortages have been geographically concentrated along with two broad belts. The first belt consists of the mixed farming production system area of the central and northern highlands. The second belt covers the low-lying agro-pastoral lands ranging from Wollo in the North, through Hararghe and Bale, to Sidamo and Gamo Gofa in the South [4]. The Amhara National Regional State belongs to the first drought-prone belt, which is characterized by rugged terrain, highly degraded soil, climate variability, population pressure, deforestation, and overgrazing [5]. Therefore, ensuring food security remains to be the focus of the regional and federal government of Ethiopia.
The study area (Kalu) is one of the drought-prone districts of the Amhara region, where the majority of rural inhabitants’ livelihood solely depends on subsistence farming and low productive livestock rearing [6]. Among others, the fastest-growing rural populations coupled with intensive crop cultivation results in severe land degradation and food insecurity in the study area [7]. To this end, a closer understanding of the level and causes of food security in the Kalu district can be considered as an important case study. Previous studies demonstrated that different factors affect the food security status of smallholders in different parts of the country [8,9,10,11]. This suggests that location-specific studies that account for unobservable differences in socio-cultural, institutional, and economic features will help government practitioners to make informed decisions. In this regard, using unique primary data from the Kalu district of the Amhara region, this study builds on the existing literature by adopting a consumption expenditure approach to measure food security. Specifically, this study aims to examine the status and determinants of smallholder food security in Kalu district, Northern Ethiopia.
2. Conceptual Framework
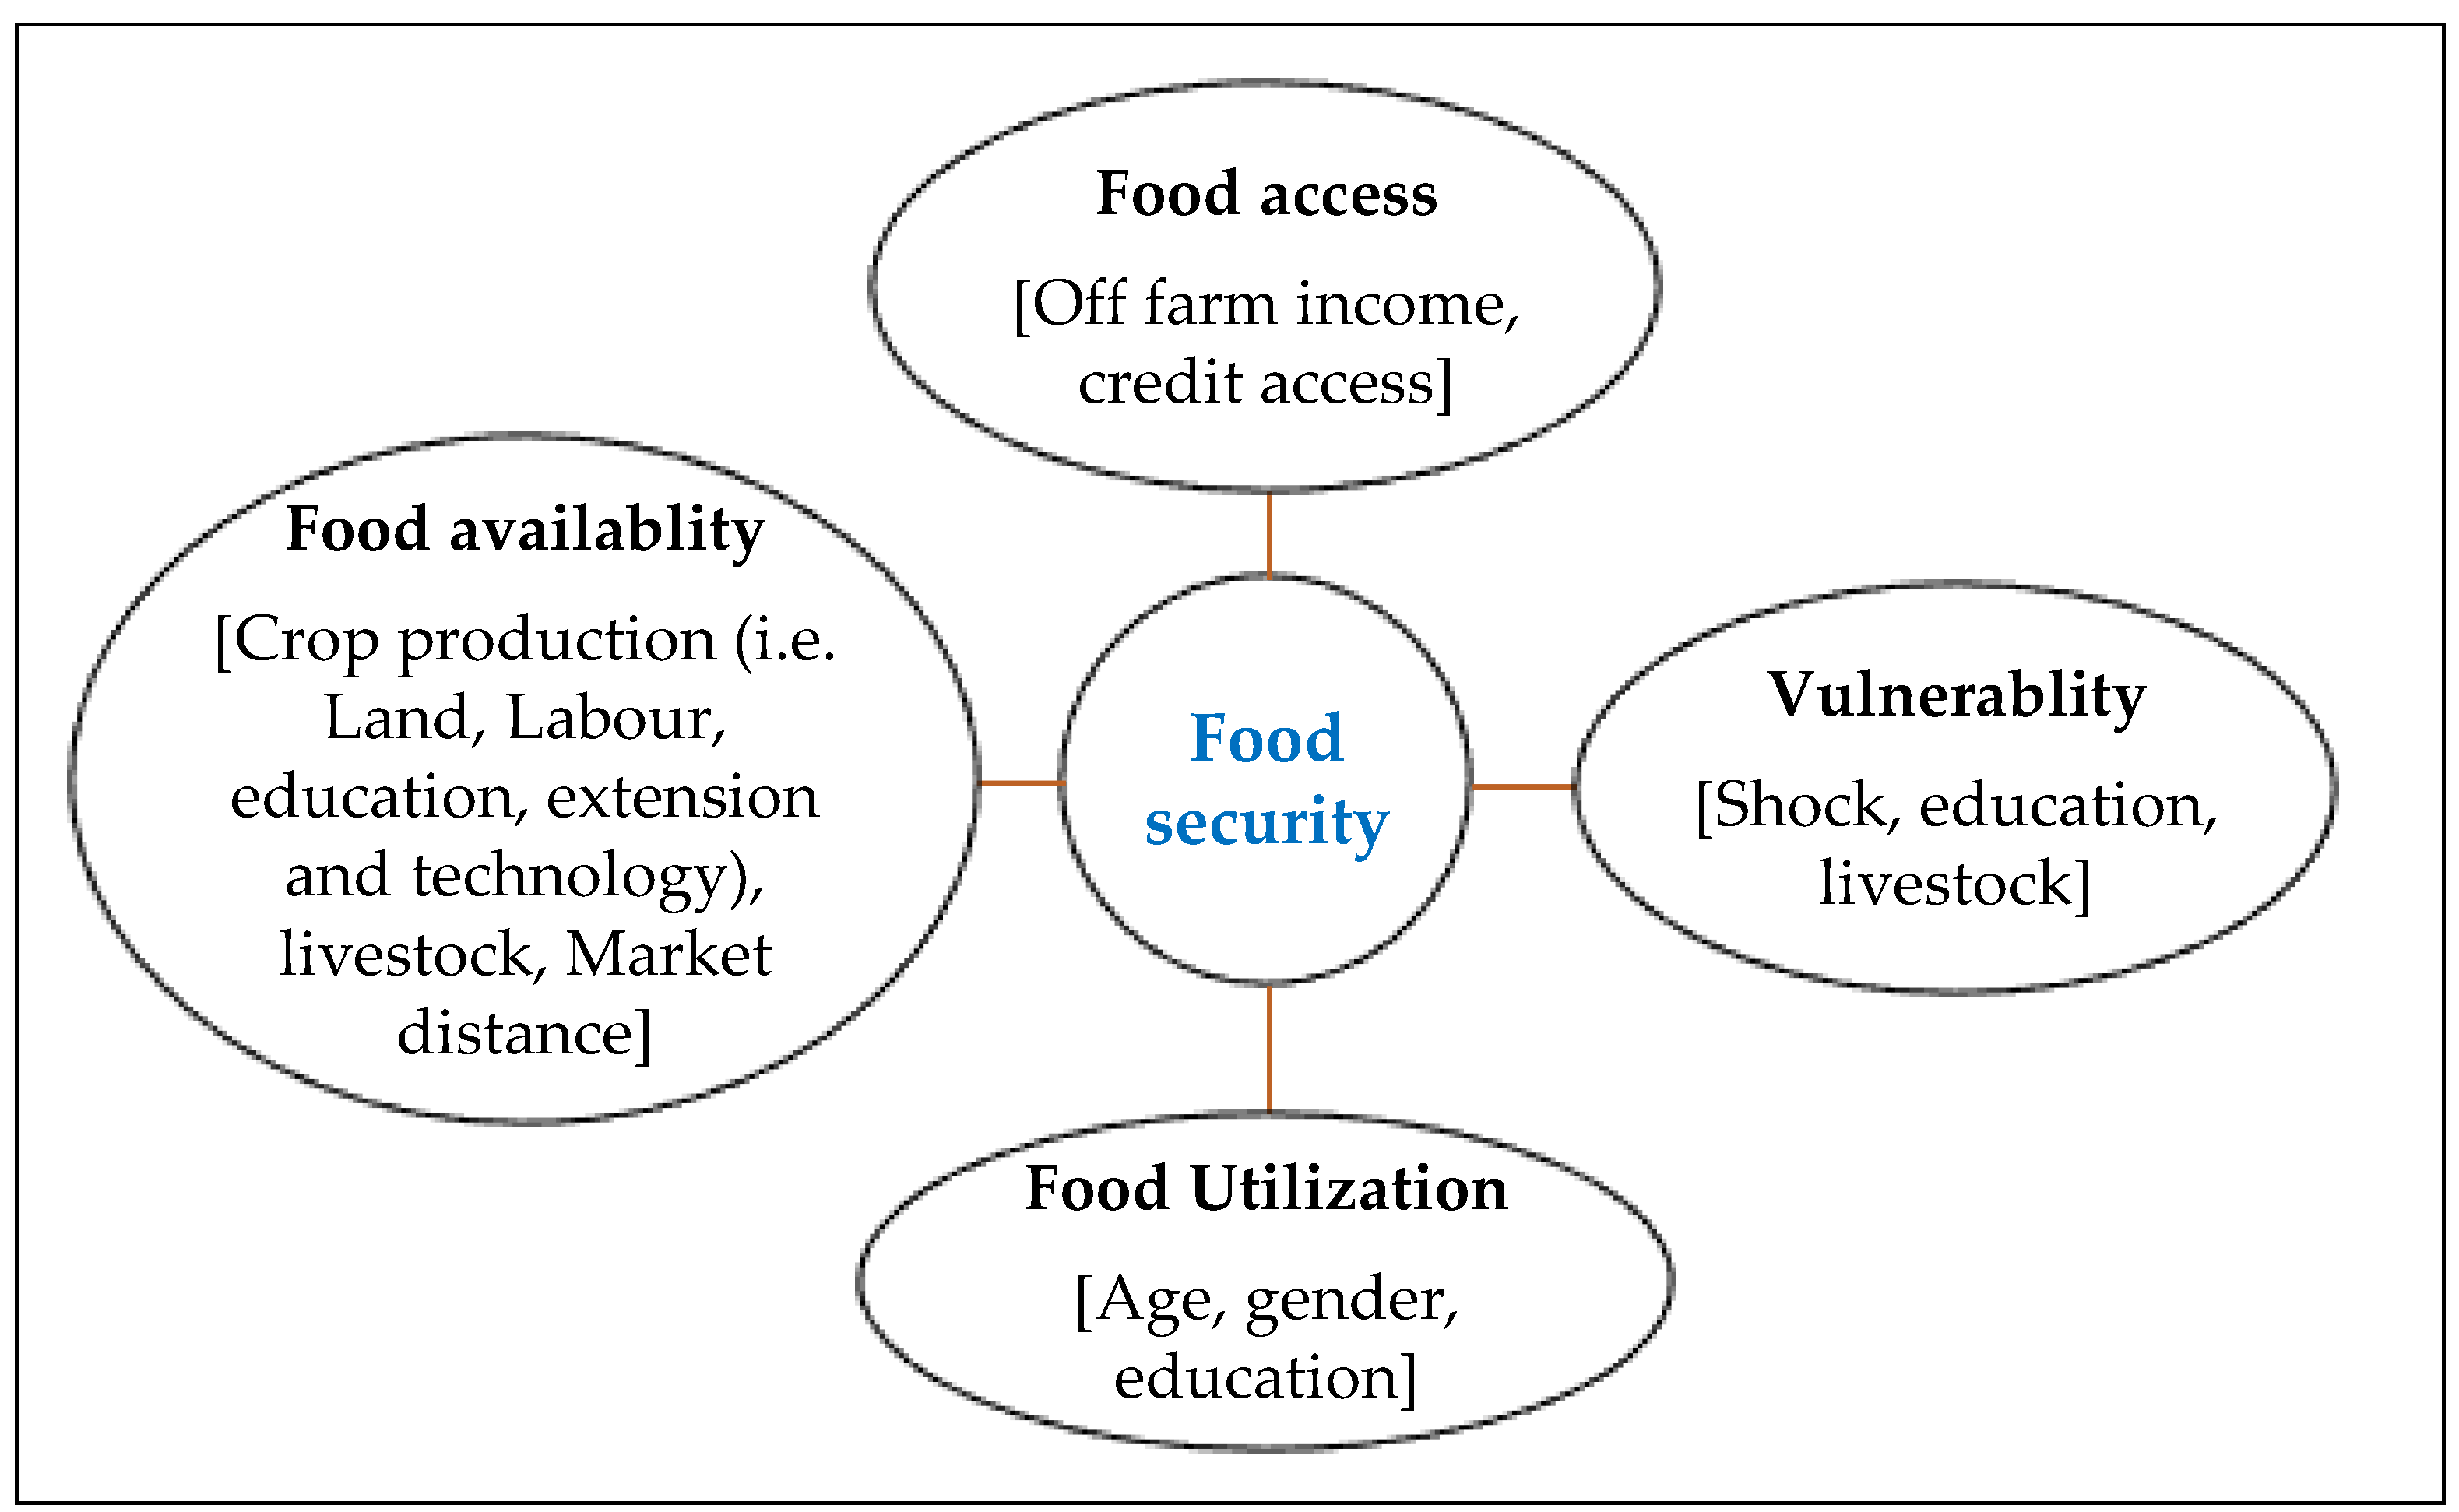
This section presents the conceptual framework of food security. By definition, food security refers to access to food by all people at all times for a healthy life [12]. This study adopts a conceptual framework (Figure 1) that accounts for this definition of food security [13]. The food availability dimension of food security refers to the extent to which food is within reach of the household. In this regard, the current study assumes that this is largely determined by crop production and livestock holding. Accordingly, livestock holding and factors that affect crop production are considered. Equally importantly, food availability is contingent on market access [13]. Another closely related concept is food access. Food access refers to the ability to obtain sufficient food. As a proxy to measure household level ability to buy food, off-farm income and credit access are considered. Likewise, the vulnerability of the household during food shortage affects the food security status of the household, which largely depends on the occurrence of shock, an education level (ability to analyze and forecast), and livestock holding [8]. Food utilization mainly relates to the quality of the diet. The choice of a quality diet can be mainly affected by gender and the education level of the household head. Moreover, food requirements can also be affected by age and gender [13].
3. Methodology
This section describes the sampling method, the data, and methods used in the analysis.
3.1. Description of the Study Area
Kallu is one of the 22 districts in the South Wollo zone of Amhara National Regional State. The predominant (90%) source of livelihood for the majority of the population is a mixed farming system, i.e., crop production and livestock rearing. Despite its importance, agriculture in the district is challenged by factors such as moisture stress, soil erosion, shortage of arable land, draught power shortages, high incidences of pests and diseases, annihilating human and livestock diseases, the untimely supply of meager agricultural inputs, and poor weeds management [14]. This, in turn, has aggravated the food insecurity problem in the area.
The district has a total population of 227,488, out of whom 108,887 (47.86%) are women and 38,351 (16.86%) are urban inhabitants [15]. Kallu district has 35 rural and 6 urban kebeles. The district covers a total area of 851.54 km2, out of which 34% is covered by crop while 56% is covered with bushes and shrubs [16].
3.2. Sampling Technique and Sample Size
The study employed a two-stage sampling procedure to draw samples representing rural households in the study area. In the first stage, four kebeles (namely Addis Mender, Addis Alem, Miawo, and Resa) were selected randomly from 35 rural administrative kebeles of the district. Kebele and district (also called woreda) are the smallest and the second smallest administrative units in Ethiopia, respectively. In the second stage, we employed systematic random sampling, taking one from every 13th in the sampling frame (i.e., 5282 households living in four selected kebeles). Accordingly, a total of 395 sample households were randomly selected from the total of four kebeles—i.e., proportional to the population size of the selected kebeles. The sample size was determined following Yamane [17].
3.3. Data Sources
Before data collection, the Kalu district office of agriculture provided a consent-based support letter from Bahirdar university. Accordingly, the district wrote a letter for respective kebeles recognizing the relevance of the study. This study used primary data collected from smallholder farmers. The data was collected using a well-structured questionnaire. The survey covered information including, but not limited to, age and sex of the household head, family size, educational level of the household head, cultivated land size, the total number of livestock in TLU, improved seed usage, off-farm income per AE, distance from the market center, use of farm credit, and insect and pest infestation. More importantly, a section of the survey deals with costs of consumption items, which was later used to calculate total consumption expenditure.
3.4. Variable Definition and Measurement
3.5. Method of Data Analysis
The study employed descriptive statistics (percentages, mean, and standard deviation) to estimate the status of food security in the study area. Similarly, inferential statistics (i.e., t-test and chi-square test) were used to show the association between the independent variables and the outcome variable.
Based on the cost of calories intake method, the food security line is defined by selecting a “basket” of food items usually consumed by the households. The amount of the basket is decided in such a way that the given bundle meets the predetermined level of minimum caloric requirement by the Ethiopian government (i.e., 2200 kcal) [18]. This “basket” is the estimated cost of the total food consumed over the last seven days of the survey period. This method yields a representative food security line in the sense that it provides a monetary value of the food security line. Following an approach suggested by the international food policy research institute (IFPRI), we classified the sampled households as food secure and food insecure using the minimum acceptable weighted average food requirement per adult equivalent (AE) per day. The adult equivalent conversion factor takes into account the age and sex of each household member [19].
In this study, the dependent variable (i.e., household food security status) is a dichotomous variable taking a value of 1 if the household is food secure and 0 otherwise. Hence, we have two appropriate models at disposal, namely, logit and probit. In practice, however, these models yield estimated choice probabilities that differ by less than 0.02, but the logit model is simpler in estimation than the probit model [20]. Therefore, this study adopted a binary logit model to identify the determinants of food security status (i.e., food secure and insecure groups). Following Gujarati [21], the logistic distribution function for determining factors driving the food security status of smallholder farmers can be specified as:
where is the probability of being food secure and is the log of the odds ratio.
where is an intercept; β1, β2 … βn are coefficients to be estimated; xi refers to explanatory variables.
It should be noted that the estimated coefficients do not directly indicate the effect of change in the corresponding explanatory variables. Thus, the study estimates marginal effects to indicate the effect of change in explanatory variables on the probability (P) of the outcome occurring. The marginal effects are calculated using the linear probability index. In this context, the marginal effect can be interpreted as the change in the probability that the household will be food secure for a unit change in the explanatory variables.
4. Result and Discussion
Before embarking on the main findings of the study, it is important to describe the data and variables used in this study. The food security status of sample households was estimated from recall data of actual consumption expenditures over the past seven days from the survey period. The cost of the calorie was used to identify the food security line. The food security threshold line was estimated using the minimum level of required kilocalories (i.e., 2200 kilocalories per adult equivalent per day) taking into account the typical food diet of the sample households in the study area (Table A1). Accordingly, households whose total yearly consumption expenditure per adult equivalent is less than ETB 3989.77 (i.e., estimated food security threshold line in the study area) are considered as food insecure, and those households with annual food consumption expenditure above ETB 3989.77 per adult equivalent are labeled as food secure. Based on the calculated food security threshold line, 47.30% of sampled households were food insecure.
Table 2 below demonstrates a summary of the variables used in econometric estimation and tests if systematic relationships between socio-demographic characteristics and the food security status of the households exist. The results show that the food secure and insecure groups have a significant difference in most of the explanatory variables. For example, the first panel of Table 2 shows that nearly half of food secured households are literate while only a quarter of the insecure group is literate. Likewise, the second panel of Table 2 demonstrates that food-secure households own significantly larger productive assets (i.e., land and livestock) than their counterparts.
Table 3 presents the main findings of this study (i.e., determinants of food security status). The estimated results revealed that the overall fitness of the model is significant at 1% (Prob > chi2 = 0.0001). The results show that by keeping other factors constant, on average, male-headed households are more likely to be food secure by a factor of 0.197 (19.7%) compared to female-headed households. A possible explanation for this can be because male-headed households have better access to social and physical assets that enables them to produce, purchase, and consume diverse and nutritious food products [9]. Another possible explanation can be because male-headed households can easily pull labor forces and have better farming experience than their counterparts. We also found that younger household heads are more likely to be food secure than otherwise, possibly because they tend to be physically strong to manage their farm and earn income from other nonfarm activities. A previous study in Nigeria [22] also stated that young household heads are stronger and expected to produce more than older household heads. The education level of the household head is another variable that positively contributed to household food security. The justification for this result is intuitive in that literate households can make a more rational and informed decision in the production and marketing of agricultural products. This finding is in line with prior researches [6,19,20].
A mixed agricultural farming system dominates the study area. Hence, livestock has a paramount contribution to household crop production and hence food security. In Ethiopia, the dominant share of smallholder farmers often uses oxen labor for plowing and threshing activities. Livestock is also a source of income (i.e., from the sale of livestock and livestock products), source of supplementary food, and means of transport. Besides, livestock serves as a coping mechanism during crop failure and other calamities. Accordingly, consistent with our prior expectations and findings of previous studies [23], households with better livestock holding are found to be more food secure than otherwise.
Credit access is another variable that positively contributed to food security, possibly by resolving the liquidity constraint of smallholder farmers. It is a common phenomenon that a considerable number of smallholders lack cash at the time where they need it most—i.e., planting time. During planting time, farmers face liquidity constraints to purchase agricultural inputs and for smoothening consumption. Our result also showed that access to credit had a positive and significant effect on household food security. This result conforms with previous findings [24,25].
As shown in Table 3, a 1 km increase from market centers decrease the probability of being food secured by 0.2 percent. There are two possible pathways that market access could affect household food security. If the household is a surplus producer and wants to sell its products, the household with better access (in this case, closer to the market) can benefit from lower transaction costs associated with transportation. On the other hand, if the household also wants to purchase crops to smoothen their consumption, households located closer to the market will benefit from the lower cost. Another possible justification could be because households located nearer to the market center may have a chance to participate in nonfarm activities, and hence are more likely to have more access to food [22,26,27]. Results of this study also demonstrated that agricultural technology adoption has a positive and significant effect on household food security status. The results suggest that those households who adopted improved seed obtained higher yield and hence are more likely to be food secure than their counterparts. This result is in line with previous studies that claim the adoption of agricultural technologies has a positive effect on household food security [26,28].
5. Conclusions
Food insecurity remains the main development agenda in Ethiopia. The causes and extent of the food insecurity problem in the country differ spatially. This study, therefore, attempted to examine the status and driving factors of food security in the Kalu district of South Wollo zone, Amhara region. The study showed that 52.70% of sampled households were food secure while the remaining 47.30% are food insecure. There is no single set of solutions to resolve the problem of food insecurity everywhere. To this aim, the binary logit model results showed that the sex of the household head, education, livestock ownership, credit access, and technology adoption have significant effects on the probability that the household will be food secured. These results have important implications. Specifically, the results suggest that female-headed households are less likely to be food secured than otherwise and hence need affirmative action (e.g., through strengthening access to social and physical capital for women) for inclusive wellbeing. The result also demonstrates that in a mixed farming system, farmers can keep the balance between crop and livestock to attain food security. Output and financial markets were also found to have a significant effect on household food security. Hence, stakeholders (mainly financial institutions) should promote access to financial markets through capacity building (e.g., training and material/in-kind support). Likewise, the local and regional governments can improve the role of market access for food security by constructing all-weather roads connecting kebeles to nearby markets. Last but not least, the results suggested that facilitating access to improved agricultural technologies will help smallholder farmers to improve their food security status. Specifically, assuring an on-time supply of demand-driven agricultural technologies through the existing channel of agricultural cooperatives or the private sector (e.g., trained rural youths or rural agricultural input suppliers) will have a role in reducing rural poverty in Ethiopia in general and in the study area in particular. This will be in line with the efforts by governmental and non-governmental organizations towards promoting agricultural technologies as a means to alleviate the problem of food insecurity.
Author Contributions
Conceptualization, A.M., S.B.W. and E.T.T.; methodology, A.M. and S.B.W.; data collection A.M.; analysis, A.M., S.B.W. and E.T.T.; writing, A.M., S.B.W. and E.T.T. All authors have read and agreed to the published version of the manuscript.
Funding
This research received no external funding.
Institutional Review Board Statement
Not applicable.
Informed Consent Statement
Not applicable.
Data Availability Statement
Data can be available upon request.
Conflicts of Interest
The authors declare no conflict of interest.
Appendix A

Table A1.
Estimation of food security line per year (ETB).
| Food Item | Calori per Kg or Lt [A] | g/mL Consumed per Adult per Day [B] | Calori per Adult/Day [C = ((A/1000) × B)] | Calori per Adult/Day after Scaling up [D = (C × 2200/1530)] | Calori Share (%) [E = (D/2200) 100] | Mean Price per Kg or Lt (ETB) [F] | Value of Food Security Line per Year (ETB) G = [(B/1000) × F × 365] | Exp. Share (%) H = G/3989.7) × 100 |
|---|---|---|---|---|---|---|---|---|
| Teff | 4428 | 1.71 | 7.57 | 12.51 | 0.57 | 32 | 19.97 | 0.50 |
| Sorghum | 3390 | 308.57 | 1046.05 | 1727.97 | 78.54 | 15 | 1689.42 | 42.34 |
| Maize | 3500 | 24.66 | 86.31 | 142.58 | 6.48 | 12 | 108.01 | 2.71 |
| vegetables | 650 | 14.91 | 9.69 | 16.01 | 0.73 | 32 | 174.15 | 4.37 |
| Chickpea | 3640 | 0.27 | 0.98 | 1.62 | 0.07 | 30 | 2.97 | 0.07 |
| Pepper | 400 | 18.56 | 7.42 | 12.26 | 0.56 | 85 | 575.82 | 14.43 |
| Meat | 1430 | 0.71 | 1.02 | 1.68 | 0.08 | 210 | 54.42 | 1.36 |
| Butter | 7170 | 0.43 | 3.08 | 5.09 | 0.23 | 350 | 54.93 | 1.38 |
| Milk | 610 | 1.1 | 0.67 | 1.11 | 0.05 | 23 | 9.23 | 0.23 |
| Egg 1 | 61 | 0.0196 | 0.00 | 0.00 | 0.00 | 5 | 0.036 | 0 |
| Coffee | 0 | 8.57 | 0.00 | 0.00 | 0.00 | 120 | 375.37 | 9.41 |
| Salt | 0 | 8.71 | 0.00 | 0.00 | 0.00 | 25 | 79.48 | 1.99 |
| Sugar | 3870 | 5 | 19.35 | 31.96 | 1.45 | 40 | 73 | 1.83 |
| Edible oil | 8850 | 15.29 | 135.32 | 223.53 | 10.16 | 80 | 446.47 | 11.19 |
| Potato | 770 | 4.03 | 3.10 | 5.13 | 0.23 | 20 | 29.42 | 0.74 |
| Onion | 400 | 22.9 | 9.16 | 15.13 | 0.69 | 30 | 250.76 | 6. 29 |
| Garlic | 1490 | 1.41 | 2.10 | 3.47 | 0.16 | 90 | 46.32 | 1.16 |
| Total | 1331.83 | 2200.06 | 100.00 | 3989.77 | 100 |
1 Egg is measured in number.
Table A2.
Summary of empirical studies.
| No | Author | Year | Study Area | Significant Variables |
|---|---|---|---|---|
| 1. | [28] | 2010 | Ada Berga | Nonfarm incomes, land and livestock holdings, experiences in farming activities, water and soil conservation practices, and fertilizer use. |
| 2. | [29] | 2012 | Kersa | Age of the household head, sex of the household head, household size in adult equivalent, total cropping land in ha, oxen owned, and remittances in Birr |
| 3. | [30] | 2013 | Shashemene | cultivated land size, family size, total farm income, off-farm income, and livestock ownership |
| 4. | [31] | 2015 | Boloso Sore | Family size, age of the household head and access to extension services, credit access, household income, oxen ownership, and cultivable land size |
| 5. | [24] | 2016 | Hawi Gudina | Family size, livestock ownership, distance from market center, access to nonfarm activity, and cash crop production |
| 6. | [26] | 2017 | North Ethiopia | Age of household heads, educational level, TLU, cultivated land size, access to credit, applying chemical fertilizer, and improved seeds |
| 7. | [32] | 2018 | Werie Leke | age of household head, family size, irrigated land holding, market information, and credit utilization |
| 8. | [27] | 2019 | Woliso | age of educational status of household head, livestock ownership, pesticide utilization, ceremonial expense and |
| 9. | [9] | 2019 | Western Ethiopia | sex of household head and access to irrigation, age of the head of the household, cultivated land size, off farm and nonfarm income, and access to credit |
References
- FAO. The State of Food Security and Nutrition in the World; FAO: Rome, Italy, 2017. [Google Scholar]
- Shishay, K.; Messay, M. Determinants of rural household food insecurity in Laelay Maichew Woreda Tigray, Ethiopia. Afr. J. Agric. Food Secur. 2014, 2, 106–112. [Google Scholar]
- USAID. Food Asistance Fact Sheet Ethiopia; USAID: Washington, DC, USA, 2019.
- Tolossa, D. Causes of Seasonal Food Insecurity in Oromiya Zone of Amhara Region: Farmers’ View. In Proceedings of the Contemporary Development Issues in Ethiopia, Kalamazoo, MI, USA, 16–18 August 2001. [Google Scholar]
- Ramakrishna, G.; Demeke, A. An Empirical Analysis of Food Security in Ethiopia: The Case of North Wello. Afr. Dev. 2005, 27. [Google Scholar] [CrossRef]
- Dawd, K.Y.; Musimba, N.K.R.; Ekaya, W.N.; Farah, K.O. The nutritional value of Zizyphus spina-christi for goat production among the pastoralists of Kalu district, South Wello, Ethiopia. Afr. J. Range Forage Sci. 2003, 20, 265–270. [Google Scholar] [CrossRef]
- Kebrom, T.; Lars, L. Land Cover Changes Between 1958 and 1986 in Kalu District, Southern Wello, Ethiopia. Mt. Res. Dev. 2000, 20, 42–51. [Google Scholar]
- Muche, M.; Endalew, B.; Koricho, T. Detrminants of Household Food Security among Southwest Ethiopia Rural Households. Asian J. Agric. Res. 2014, 8, 248–258. [Google Scholar] [CrossRef] [Green Version]
- Sani, S.; Kemaw, B. Analysis of Rural Households Food Security in Western Ethiopia. Food Nutr. Sci. 2019, 10, 249–265. [Google Scholar] [CrossRef] [Green Version]
- Abubeker, M.; Ayalneh, B.; Aseffa, S. Options to reduce poverty among agro-pastoral households of Ethiopia: A case study from Aysaita district of Afar national regional state. J. Dev. Agric. Econ. 2014, 6, 257–266. [Google Scholar] [CrossRef] [Green Version]
- Kidane, H.; Alemu, Z.G.; Kundhlande, G. Causes of Household Food Insecurity in Koredegaga Peasant Association, Oromiya Zone, ETHIOPIA. Agrekon 2005, 44, 543–560. [Google Scholar] [CrossRef]
- Von Braun, J. (Ed.) Improving Food Security of the Poor: Concept, Policy and Programmes; International Food Policy Research Institute: Washington, DC, USA, 1992. [Google Scholar]
- Pieters, H.; Guariso, A.; Vandeplas, A. Conceptual Framework for the Analysis of the Determinants of Food and Nutrition Security; Research in Agricultural & Applied Economics: KU Leuven, Belgium, 2013. [Google Scholar]
- Kassie, G.T.; Maleni, D.; Gwara, S.; Emana, B. Efficiency of Moisture Stress Risk Coping Strategies in North-Eastern Ethiopia: Application of Mean-Variance Efficiency Analysis. Asian Econ. Financ. Rev. 2013, 3, 1018–1032. [Google Scholar]
- CSA. Population Projection of Ethiopia for All Regions at Woreda Level from 2014–2017; Central Statistics Authority of Ethiopia: Addis Ababa, Ethiopia, 2017.
- CSA. National Report on Demographic Data Development Ethiopia; Central Statistics Authority of Ethiopia: Addis Ababa, Ethiopia, 2005.
- Yamane, T. Statistics, an Introductory Analysis, 2nd ed.; Harper and Row Inc.: New York, NY, USA, 1967. [Google Scholar]
- MoFED. Sustainable Development and Poverty Reduction Program, Ethiopia; The Ministry of Finance and Economic Development: Addis Ababa, Ethiopia, 2002.
- Gassmann, F.; Behrendt, C. Cash Benefits in Low-income Countries: Simulating the Effects on Poverty Reduction for Senegal and Tanzania; International Labor Organization: Geneva, Switzerland, 2006. [Google Scholar]
- Aldrich, J.; Nelson, F. Linear Probability, Logit, and Probit Models; SAGE Publications, Inc.: Thousand Oaks, CA, USA, 1984; ISBN 9780803921337. [Google Scholar]
- Gujarati, D.N. Basic Econometrics, 4th ed.; MacGraw, Hill: New York, NY, USA, 2004; ISBN 0072427922. [Google Scholar]
- Babatunde, R.O.; Omotesho, O.A.; Sholotan, O.S. Socio-Economics Characteristics and Food Security Status of Farming Households in Kwara State, North-Central Nigeria. Pakistan J. Nutr. 2007, 6, 49–58. [Google Scholar] [CrossRef] [Green Version]
- Shimeles, A. Dimensions and Determinants of Food Security among Rural Households in Dire Dawa, Eastern Ethiopia; School of Graduate Studies of Alemaya University: Dire Dawa, Ethiopia, 2003. [Google Scholar]
- Fekede, G.; Lemma, Z.; Jemal, Y. Determinants of farm household food security in Hawi Gudina district, West Hararghe zone, Oromia Regional National State, Ethiopia. J. Agric. Ext. Rural Dev. 2016, 8, 12–18. [Google Scholar] [CrossRef] [Green Version]
- Kassie, M.; Jaleta, M.; Mattei, A. Evaluating the impact of improved maize varieties on food security in Rural Tanzania: Evidence from a continuous treatment approach. Food Secur 2014, 6, 217–230. [Google Scholar] [CrossRef]
- Debebe, B. Determinants of food insecurity among rural households in debark woreda, North west Ethiopia. Ethiop. Renaiss. J. Soc. Sci. Humanit. 2017, 4, 57–74. [Google Scholar]
- Tsegamariam, D.; Wakjira, B. Determinants of Rural Household Food Security and Coping Up Mechanisms in the Case of Woliso Woreda Western Ethiopia. World J. Agric. Soil Sci. 2019, 1. [Google Scholar] [CrossRef]
- Beyene, F.; Muche, M. Determinants of Food Security among Rural Households of Central Ethiopia: An Empirical Analysis. Q. J. Int. Agric. 2010, 49, 299–318. [Google Scholar]
- Belay, S. Food insecurity and copping strategies: A perspective from Kersa district, East Hararghe Ethiopia. Food Sci. Qual. Manag. 2012, 5, 19–27. [Google Scholar]
- Mitiku, A.; Bekabil, F.; Beyene, T. Emperical analysis of the determinants of rural households food security in Southern Ethiopia: The case of Shashemene District. J. Agric. Sci. Rev. 2013, 1, 132–138. [Google Scholar]
- Leza, T.; Kuma, B. Determinants of Rural Farm Household Food Security in Boloso Sore District of Wolaita Zone in Ethiopia. Asian J. Agric. Ext. 2015, 5, 57–68. [Google Scholar] [CrossRef]
- Hailu, A.G.; Alemu, B.A.; Negash, Z. Determinants of rural household food insecurity in northern Ethiopia: An empirical study. J. Sustain. Dev. Africa 2018, 20, 32–63. [Google Scholar]
Figure 1.
The conceptual framework for food security.

Table 1.
Definition and measurement of variables.
| Variable | Definition and Measurement |
|---|---|
| Sex | =1 if the head of the household is male and 0 otherwise |
| Age | Age of the household head (years) |
| Education | =1 if the household head is literate and 0 otherwise |
| Active labor | The number of family members in the age of 15 to 64 years |
| Cultivated land | Total cultivated land managed and owned in the last production season (ha) |
| Off-farm income | Total off-farm income in the last one year (thousands of birr) |
| Livestock | Total livestock holding of the household measured in tropical livestock unit (TLU) |
| Credit | =1 if the household head has access to credit and 0 otherwise |
| Market distance | Distance from home to the nearest market (km) |
| Extension contact | =1 if the household head has contacted by the extension agent and 0 otherwise |
| Technology adoption | =1 if the household has adopted improved seed and 0 otherwise |
| Shock | =1 if the household faces insect or pest infection and 0 otherwise |
Table 2.
Summary of explanatory variables by food security status.
| Variable | Pooled Sample (N = 467) | Food Secure (N = 208) | Food Insecure (N = 187) | Mean Difference |
|---|---|---|---|---|
| Panel 1: Dummy variables | Chi-square | |||
| Sex (% of male) | 73.99 | 85.58 | 61.55 | 29.81 ** |
| Education (% of literate) | 38.99 | 50.96 | 25.67 | 26.48 *** |
| Extension contact (% of yes) | 53.67 | 65.38 | 40.67 | 24.24 *** |
| Tech. adoption (% of yes) | 25.32 | 36.54 | 12.83 | 29.26 *** |
| Shock (% yes) | 76.71 | 73.56 | 80.21 | 2.44 ** |
| Credit (% with access) | 21.77 | 25.96 | 17.11 | 4.53 ** |
| Panel 2: Continuous variables | t-test 1 | |||
| Age (years) | 45.92 (14.2) | 44.90 (13.9) | 47.07 (14.54) | 1.51 |
| Active labor (number) | 2.85 (1.31) | 3.09 (1.31) | 2.58 (1.23) | −3.97 *** |
| Cultivated land (ha) | 0.66 (0.38) | 0.69 (0.39) | 0.63 (0.35) | −1.68 * |
| Livestock (TLU) | 1.32 (1.27) | 1.56 (1.32) | 1.03 (1.16) | −4.28 *** |
| Off farm income (‘000 of ETB) | 8.21 (16.39) | 10.23 (18.18) | 5.96 (13.85) | −2.60 *** |
| Market distance (km) | 37.16 (25.65) | 33.07 (20.4) | 41.7 (29.8) | 3.39 *** |
1 Notes: t-test is estimated as a mean difference between food insecure and food secured; ***, ** and * significant at p < 0.01, p < 0.05, and p < 0.1, respectively; values in brackets refer to standard deviations.
Table 3.
Factors affecting the probability of household-level food security status.
| Variable | Marginal Effect 1 | Std. Err. | Z–Value |
|---|---|---|---|
| Sex | 0.197 *** | 0.073 | 2.72 |
| Age | −0.004 * | 0.002 | −1.79 |
| Education | 0.150 ** | 0.059 | 2.52 |
| Active labor | 0.035 | 0.025 | 1.42 |
| Cultivated land | 0.026 | 0.083 | 0.31 |
| Off farm income | 0.003 | 0.001 | 1.64 |
| Livestock | 0.054 ** | 0.025 | 2.12 |
| Credit | 0.125 * | 0.066 | 1.89 |
| Market distance | −0.002 ** | 0.001 | −2.02 |
| Extension contact | 0.086 | 0.062 | 1.39 |
| Technology adoption | 0.158 ** | 0.070 | 2.26 |
| Shock | −0.038 | 0.067 | −0.56 |
1 Notes: *** p < 0.01, ** p < 0.05, * p < 0.1; Dependent variable: =1 if the household is food secured.
Publisher’s Note: MDPI stays neutral with regard to jurisdictional claims in published maps and institutional affiliations. |
© 2021 by the authors. Licensee MDPI, Basel, Switzerland. This article is an open access article distributed under the terms and conditions of the Creative Commons Attribution (CC BY) license (https://creativecommons.org/licenses/by/4.0/).
Share and Cite
MDPI and ACS Style
Mohammed, A.; Wassie, S.B.; Teferi, E.T. Determinants of Smallholders’ Food Security Status in Kalu District, Northern Ethiopia. Challenges 2021, 12, 17. https://0-doi-org.brum.beds.ac.uk/10.3390/challe12020017
AMA Style
Mohammed A, Wassie SB, Teferi ET. Determinants of Smallholders’ Food Security Status in Kalu District, Northern Ethiopia. Challenges. 2021; 12(2):17. https://0-doi-org.brum.beds.ac.uk/10.3390/challe12020017
Chicago/Turabian StyleMohammed, Abdela, Solomon Bizuayehu Wassie, and Ermias Tesfaye Teferi. 2021. "Determinants of Smallholders’ Food Security Status in Kalu District, Northern Ethiopia" Challenges 12, no. 2: 17. https://0-doi-org.brum.beds.ac.uk/10.3390/challe12020017
Note that from the first issue of 2016, this journal uses article numbers instead of page numbers. See further details here.