Rheology and Catastrophic Phase Inversion of Emulsions in the Presence of Starch Nanoparticles

Department of Chemical Engineering, University of Waterloo, Waterloo, ON N2L 3G1, Canada
*
Author to whom correspondence should be addressed.
ChemEngineering 2020, 4(4), 57; https://0-doi-org.brum.beds.ac.uk/10.3390/chemengineering4040057
Submission received: 9 August 2020
/
Revised: 30 September 2020
/
Accepted: 12 October 2020
/
Published: 19 October 2020
(This article belongs to the Special Issue Emulsion Process Design)
Abstract
:Emulsions stabilized by solid nanoparticles, referred to as Pickering emulsions, are becoming increasingly important in applications as they are free of surfactants. However, the bulk properties and stability of Pickering emulsions are far from being well understood. In this work, the rheological behavior and catastrophic phase inversion of emulsions in the presence of starch nanoparticles were studied using in-situ measurements of viscosity and electrical conductivity. The aqueous phase consisting of starch nanoparticles was added sequentially in increments of 5% vol. to the oil phase under agitation condition to prepare the emulsions. The emulsions were water-in-oil (W/O) type at low to moderate concentrations of aqueous phase. At a certain critical volume fraction of aqueous phase, catastrophic phase inversion of W/O emulsion to oil-in-water (O/W) emulsion took place accompanied a sharp jump in the electrical conductivity and a sharp drop in the emulsion viscosity. The W/O emulsions were nearly Newtonian at low concentrations of aqueous phase. At high concentrations of aqueous phase, prior to phase inversion, the W/O emulsions exhibited a shear-thickening behavior. The O/W emulsions produced after phase inversion were shear-thinning in nature. The comparison of the experimental viscosity data with the predictions of emulsion viscosity model revealed only partial coverage of droplet surfaces with nanoparticles. With the increase in the concentration of starch nanoparticles (SNPs) in the aqueous phase of the emulsions, the phase inversion of W/O emulsion to O/W emulsion was delayed to higher volume fraction of aqueous phase. Thus SNPs imparted some stability to W/O emulsions against coalescence and phase inversion.
Keywords:
emulsion; nanoparticles; starch; Pickering; rheology; viscosity; phase inversion; emulsion stability; non-Newtonian1. Introduction
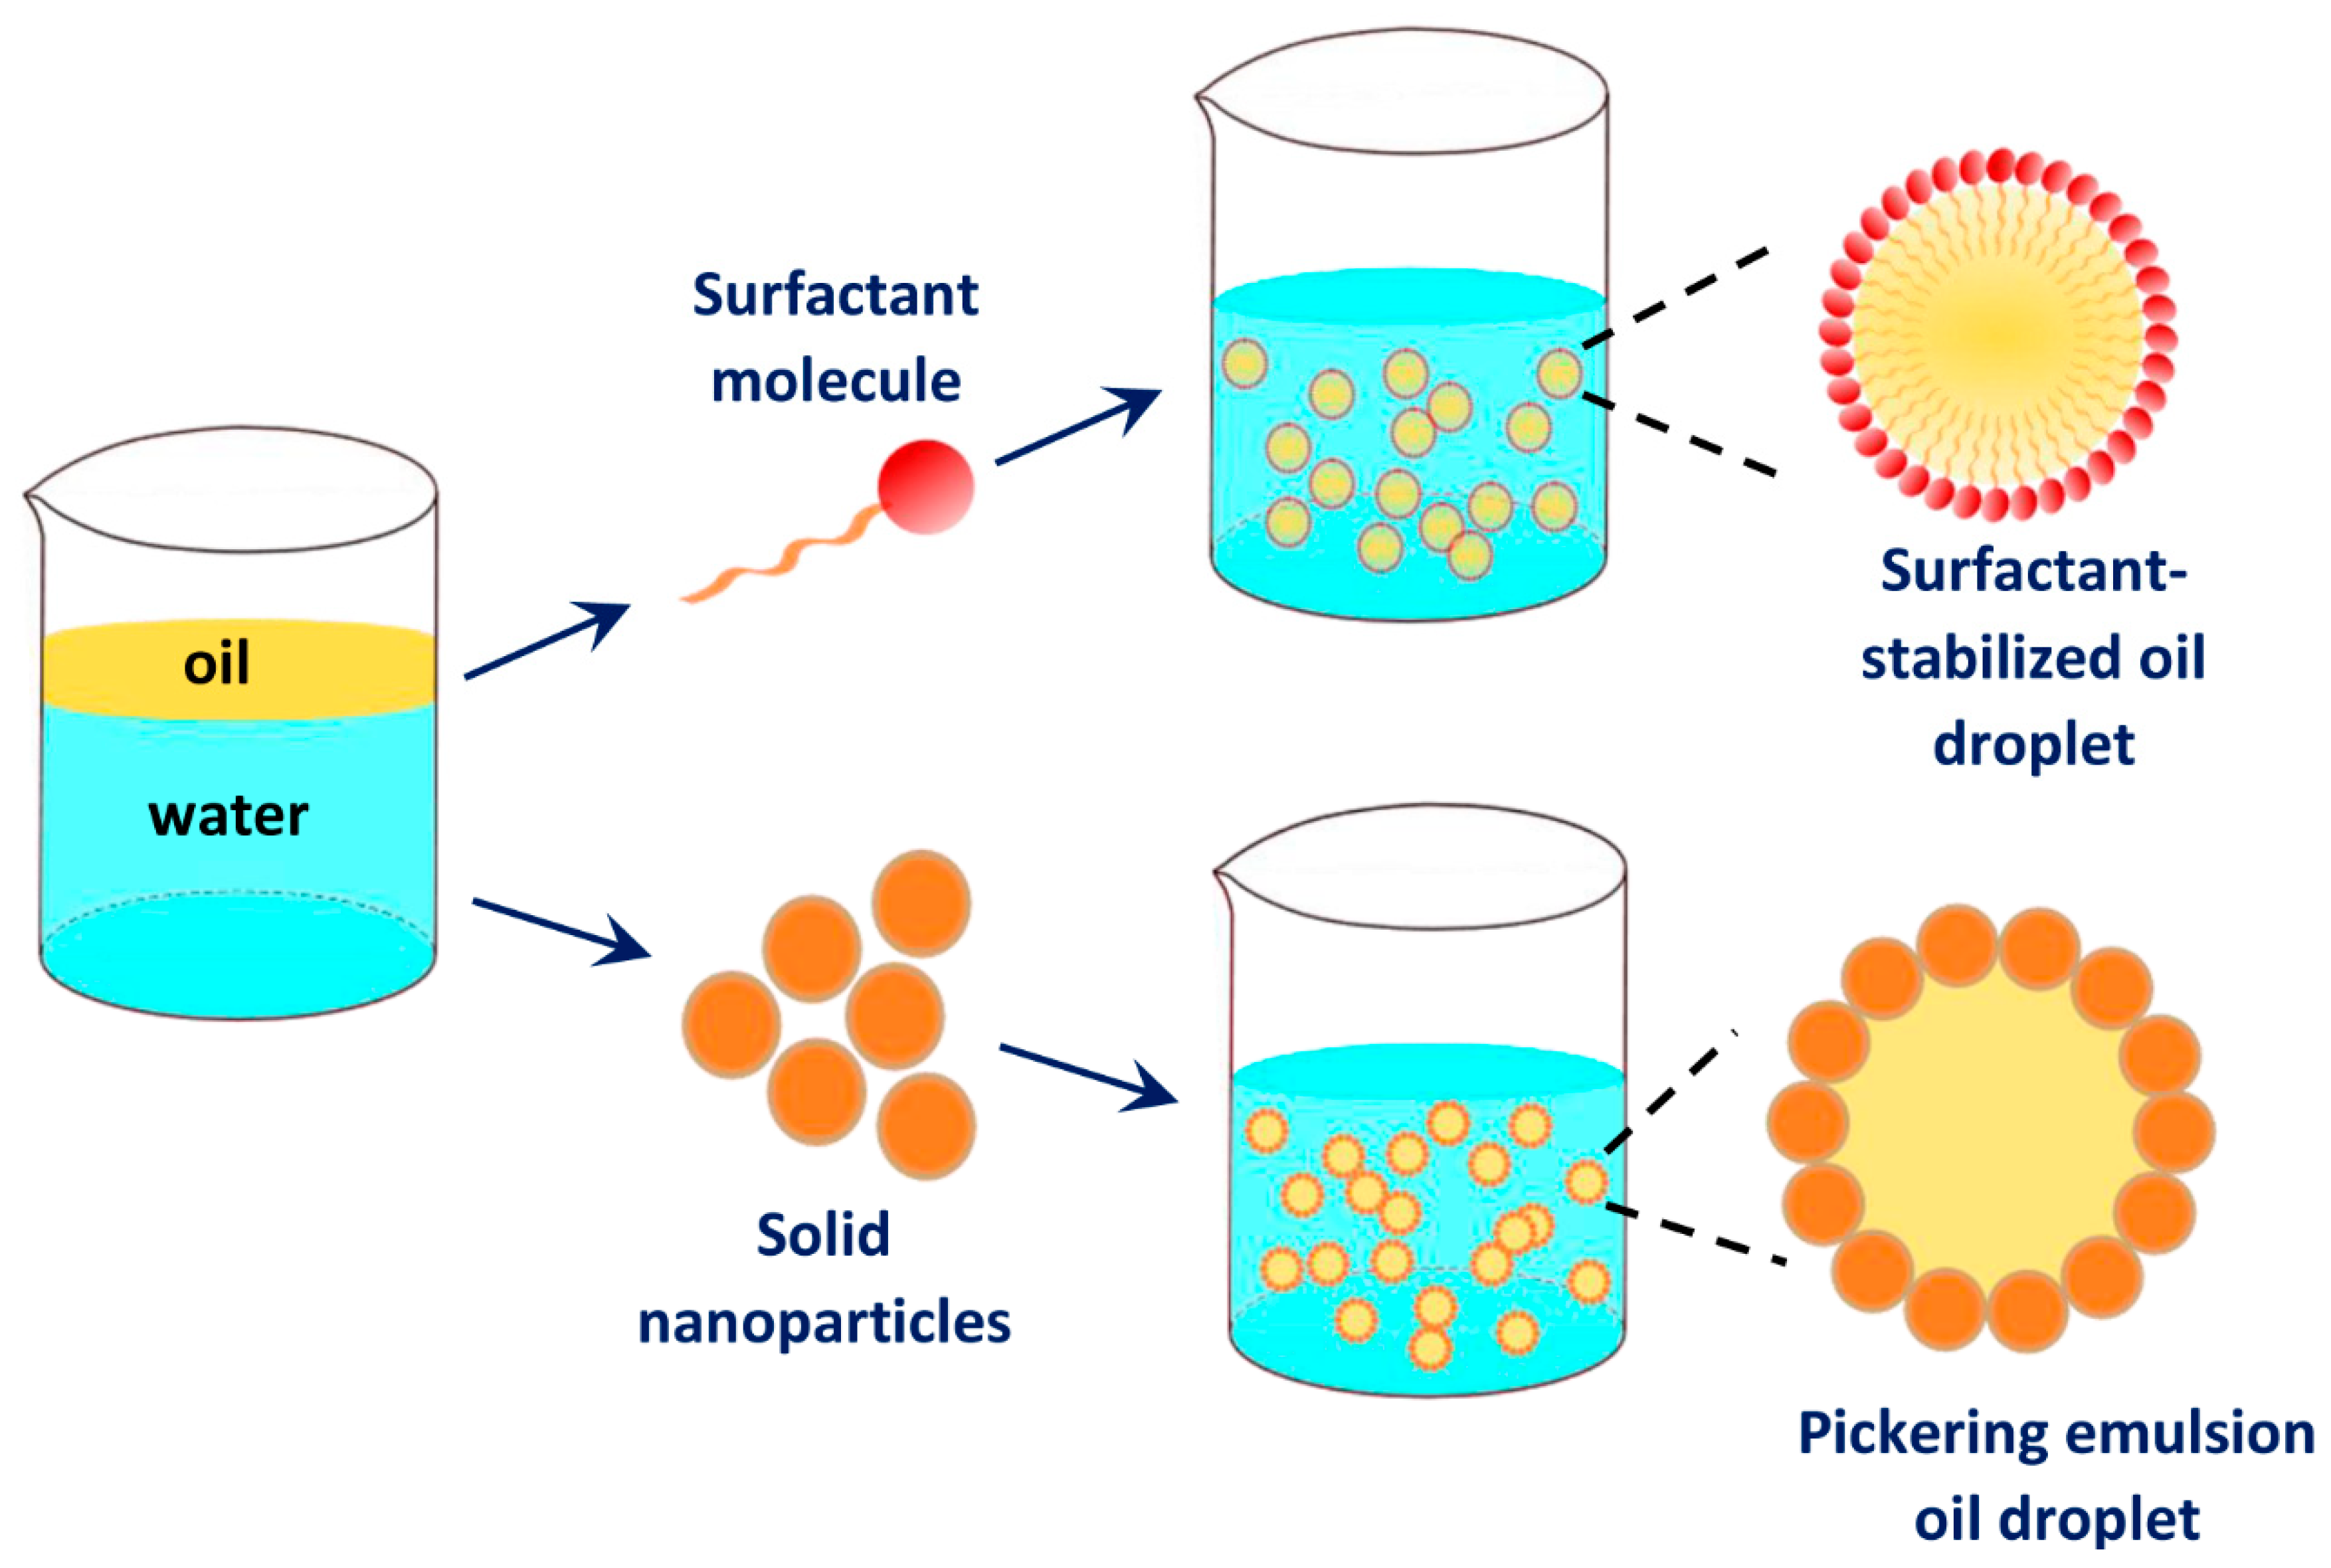
Emulsions are defined as dispersions of two immiscible liquids. They find applications in various fields such as petroleum, pharmaceuticals, foods, cosmetics, paints, etc. [1,2,3,4,5,6,7,8]. Emulsions can be broadly classified into two groups: oil-in-water (O/W) emulsions, where an oil forms the dispersed phase and water forms the continuous phase, and water-in-oil (W/O) emulsions, where water forms the dispersed phase and an oil forms the continuous phase. Some other emulsions (oil-in-oil and multiple) fall outside this classification but they are uncommon. Emulsions are thermodynamically unstable systems. In the absence of an effective interfacial stabilizer, the bare droplets of emulsions tend to coalesce readily. Consequently, emulsions separate out into oil and water phases when the mechanical agitation is stopped. In order to impart kinetic stability to emulsions various interfacial stabilizers such as surfactants and solid nanoparticles are utilized. As an example, Figure 1 shows a schematic diagram of the surfactant-stabilized and nanoparticle-stabilized oil droplets in an O/W emulsion.
Emulsions stabilized with solid nanoparticles are called Pickering emulsions. Stabilization of emulsions by solid nanoparticles, instead of surfactants, is preferred in many applications as solid nanoparticles offer higher resistance to coalescence [9,10,11,12,13,14,15,16,17,18]. Furthermore, the usage of solid nanoparticles as stabilizers eliminates the adverse side effects of surfactants such as irritancy and hemolytic behavior. More recently, a growing awareness of using environment friendly products has led more and more researchers to develop and modify natural materials as interfacial additives for emulsions. Starch nanoparticles are considered to be suitable candidates as interfacial stabilizers for emulsions because they are environmentally friendly, safe and non-toxic [19,20]. Also, from a practical point of view, starch nanoparticles are of low cost, and the rheological properties of emulsions can easily be controlled with the help of such additives.
A good understanding of the rheological behavior and instability of Pickering emulsions is important in the formulation, mixing, storage and pumping of such fluids. However, only a few studies have been published on the rheological properties and instability of Pickering emulsions in the presence of starch nanoparticles. The main instability of emulsions is known to be phase inversion. When phase inversion occurs in emulsion, the dispersed phase becomes the continuous phase and vice versa. There are two types of phase inversion in emulsions: catastrophic and transitional. The catastrophic phase inversion in emulsions is induced by varying the ratio of oil-to-water whereas the transitional inversion is induced by changing the hydrophilic-lipophilic balance (HLB) or affinity of the stabilizer (surfactant or solid nanoparticles) for the two phases. When phase inversion takes place, the physical properties of emulsion such as viscosity and electrical conductivity undergo sharp changes. Pal’s group [17] recently studied the effects of hydrophilic and hydrophobically-modified starch nanoparticles on catastrophic phase inversion of Pickering emulsions. Ogunlaja et al. [17] found that both hydrophilic and hydrophobically-modified starch nanoparticles are effective in delaying the catastrophic phase inversion of emulsions from W/O to O/W type. However, the work of Ogunlaja et al. [17] was restricted to the study of only catastrophic phase inversion in Pickering emulsions. No work was done on the rheology of emulsions in the presence of solid nanoparticles.
The broad objectives of this work are as follows: (a) to study the rheology of emulsions using different concentrations of starch nanoparticles as interfacial additives; and (b) to simultaneously investigate catastrophic phase inversion in emulsions in the presence of starch nanoparticles at different concentrations.
2. Experimental Setup
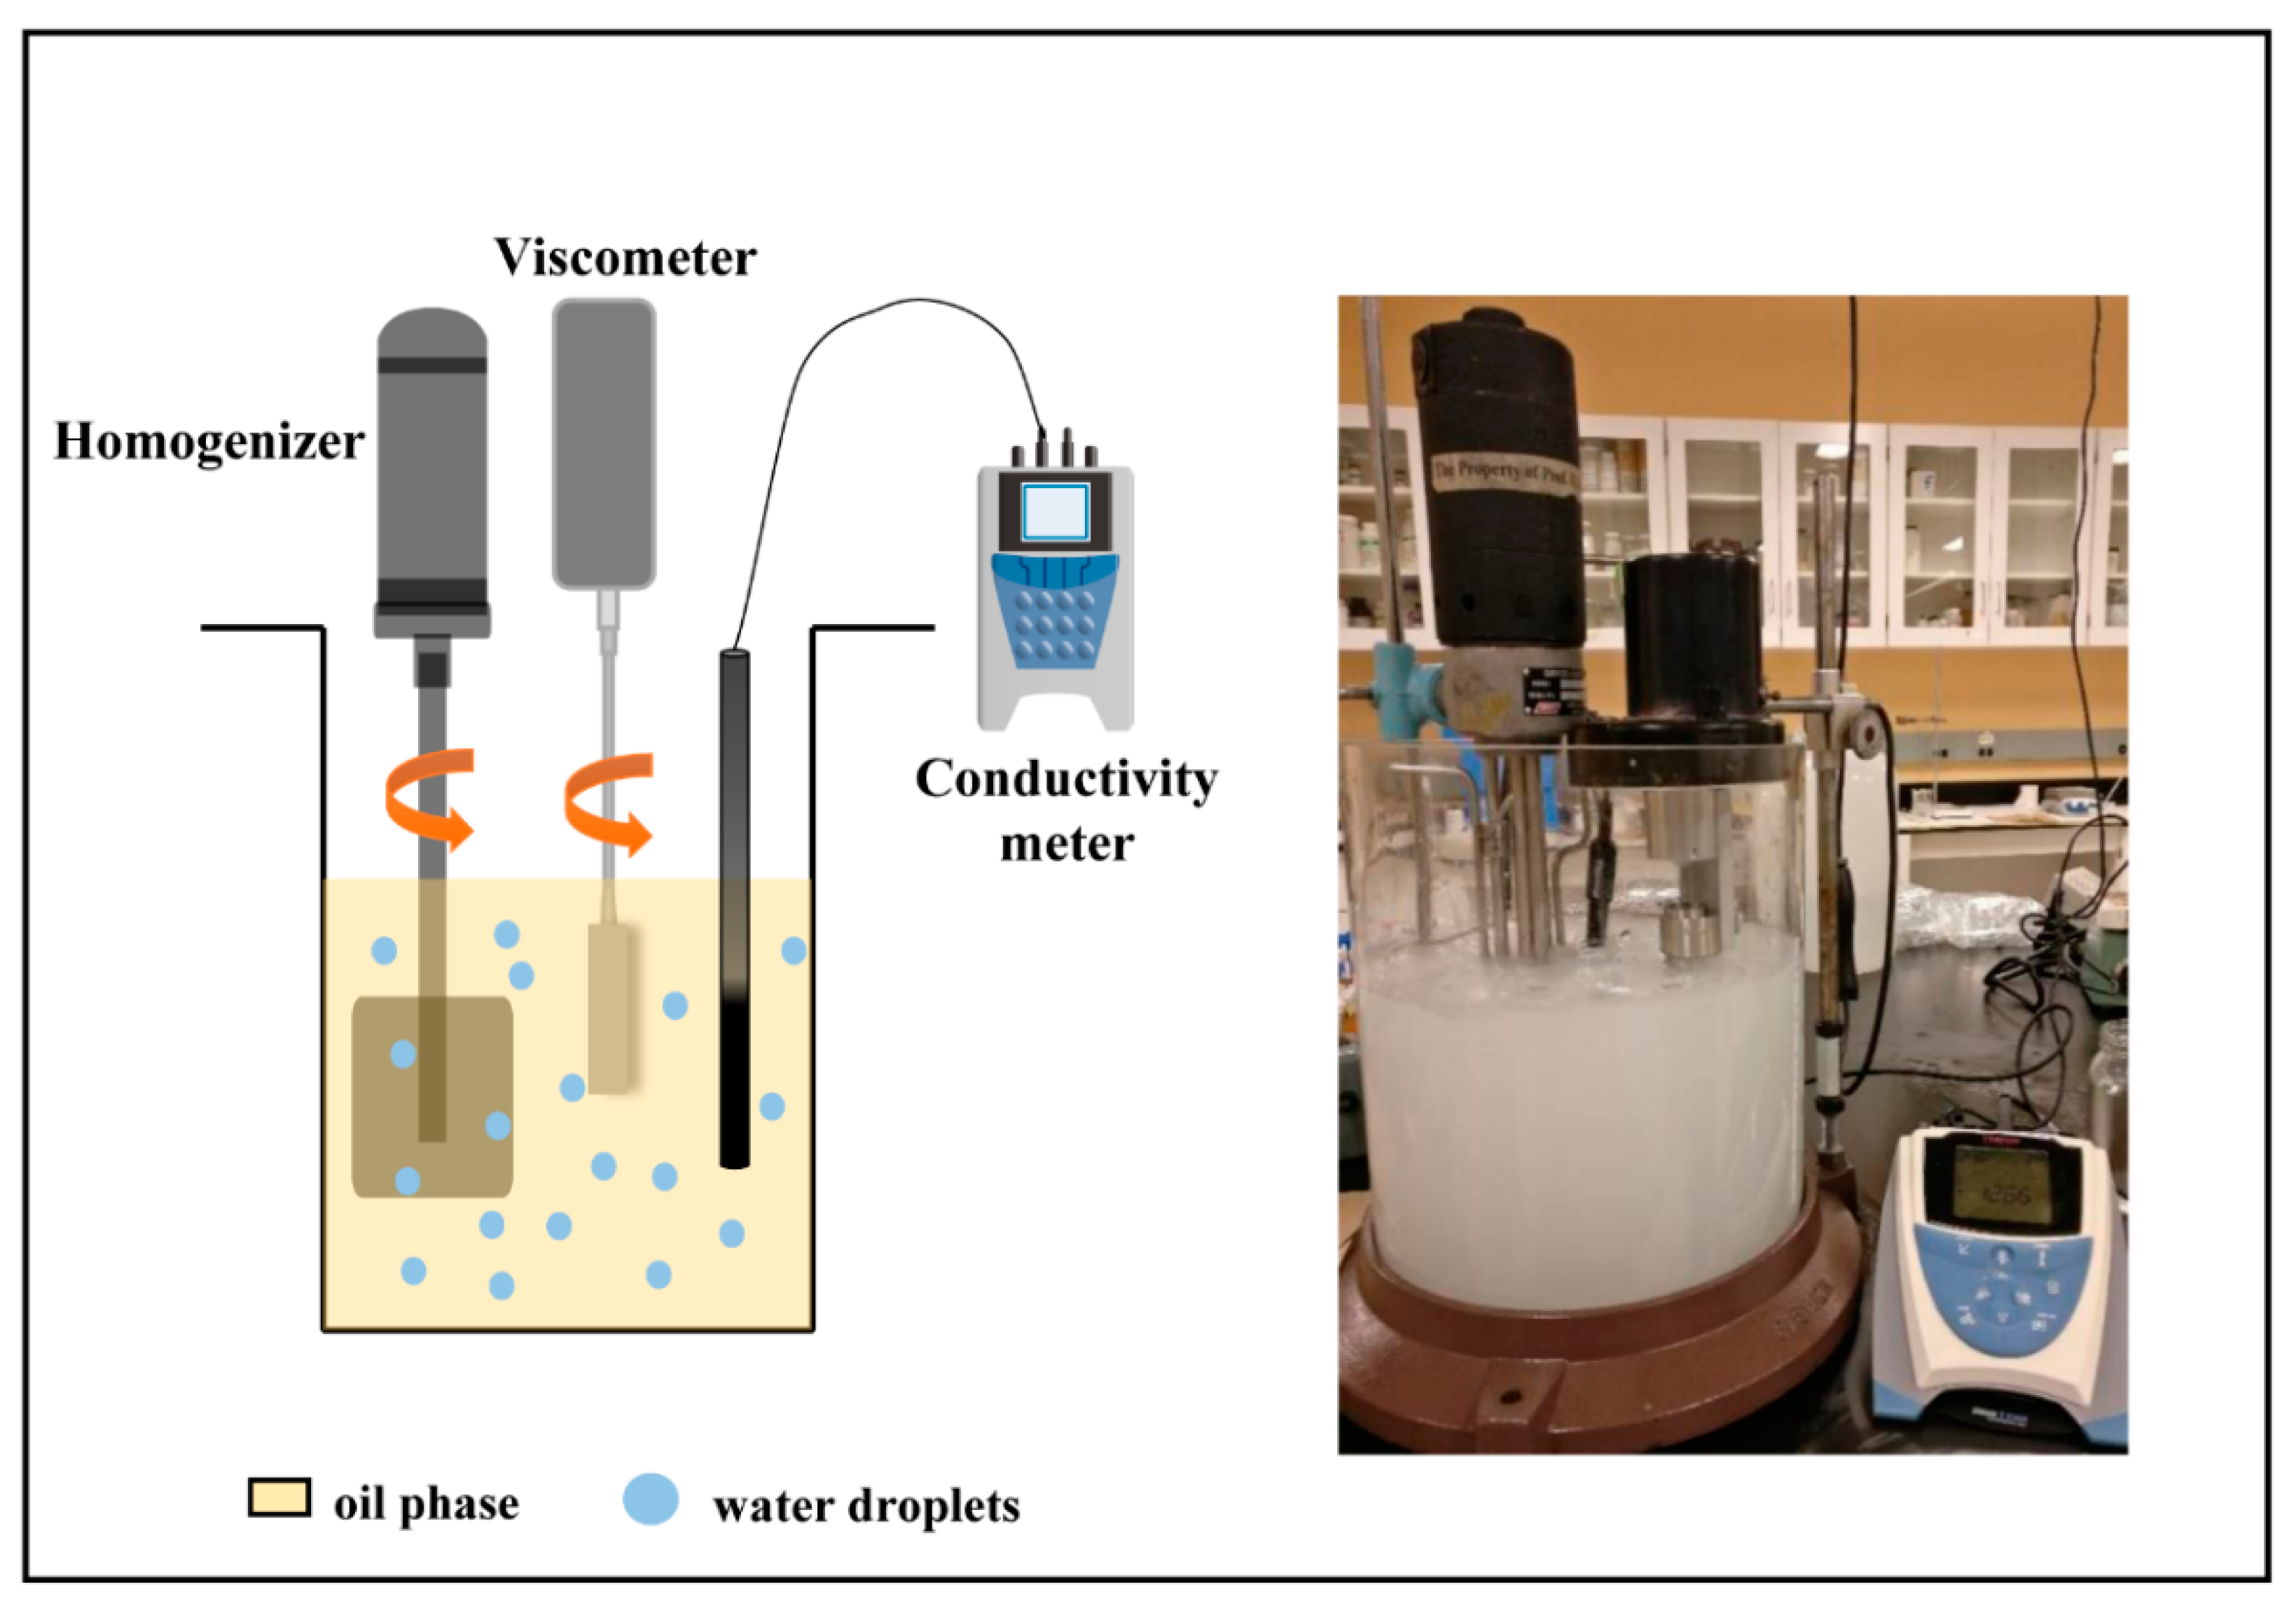
The experimental set-up is shown in Figure 2. The emulsions were prepared in a cylindrical glass vessel equipped with a variable-speed Greerco Gifford-Wood homogenizer (rotor-stator type, model 1-L; supplied by National Oilwell Varco, Dayton, OH, USA) to provide the necessary shear and mixing of fluids. The of capacity of the mixing vessel was approximately 20 L and had the following dimensions: Inside diameter = 29 cm, height = 29.5 cm, and glass wall thickness = 7 mm. A dual channel electrical conductivity probe (range 0–200 mS/cm) with a built-in temperature sensor connected to a Thermo Orion 3 Star conductivity meter (manufactured by Thermo Fischer Scientific Inc., Beverly, MA, USA) was used to continuously monitor the electrical conductivity and temperature of the emulsions while the homogenizer was on.
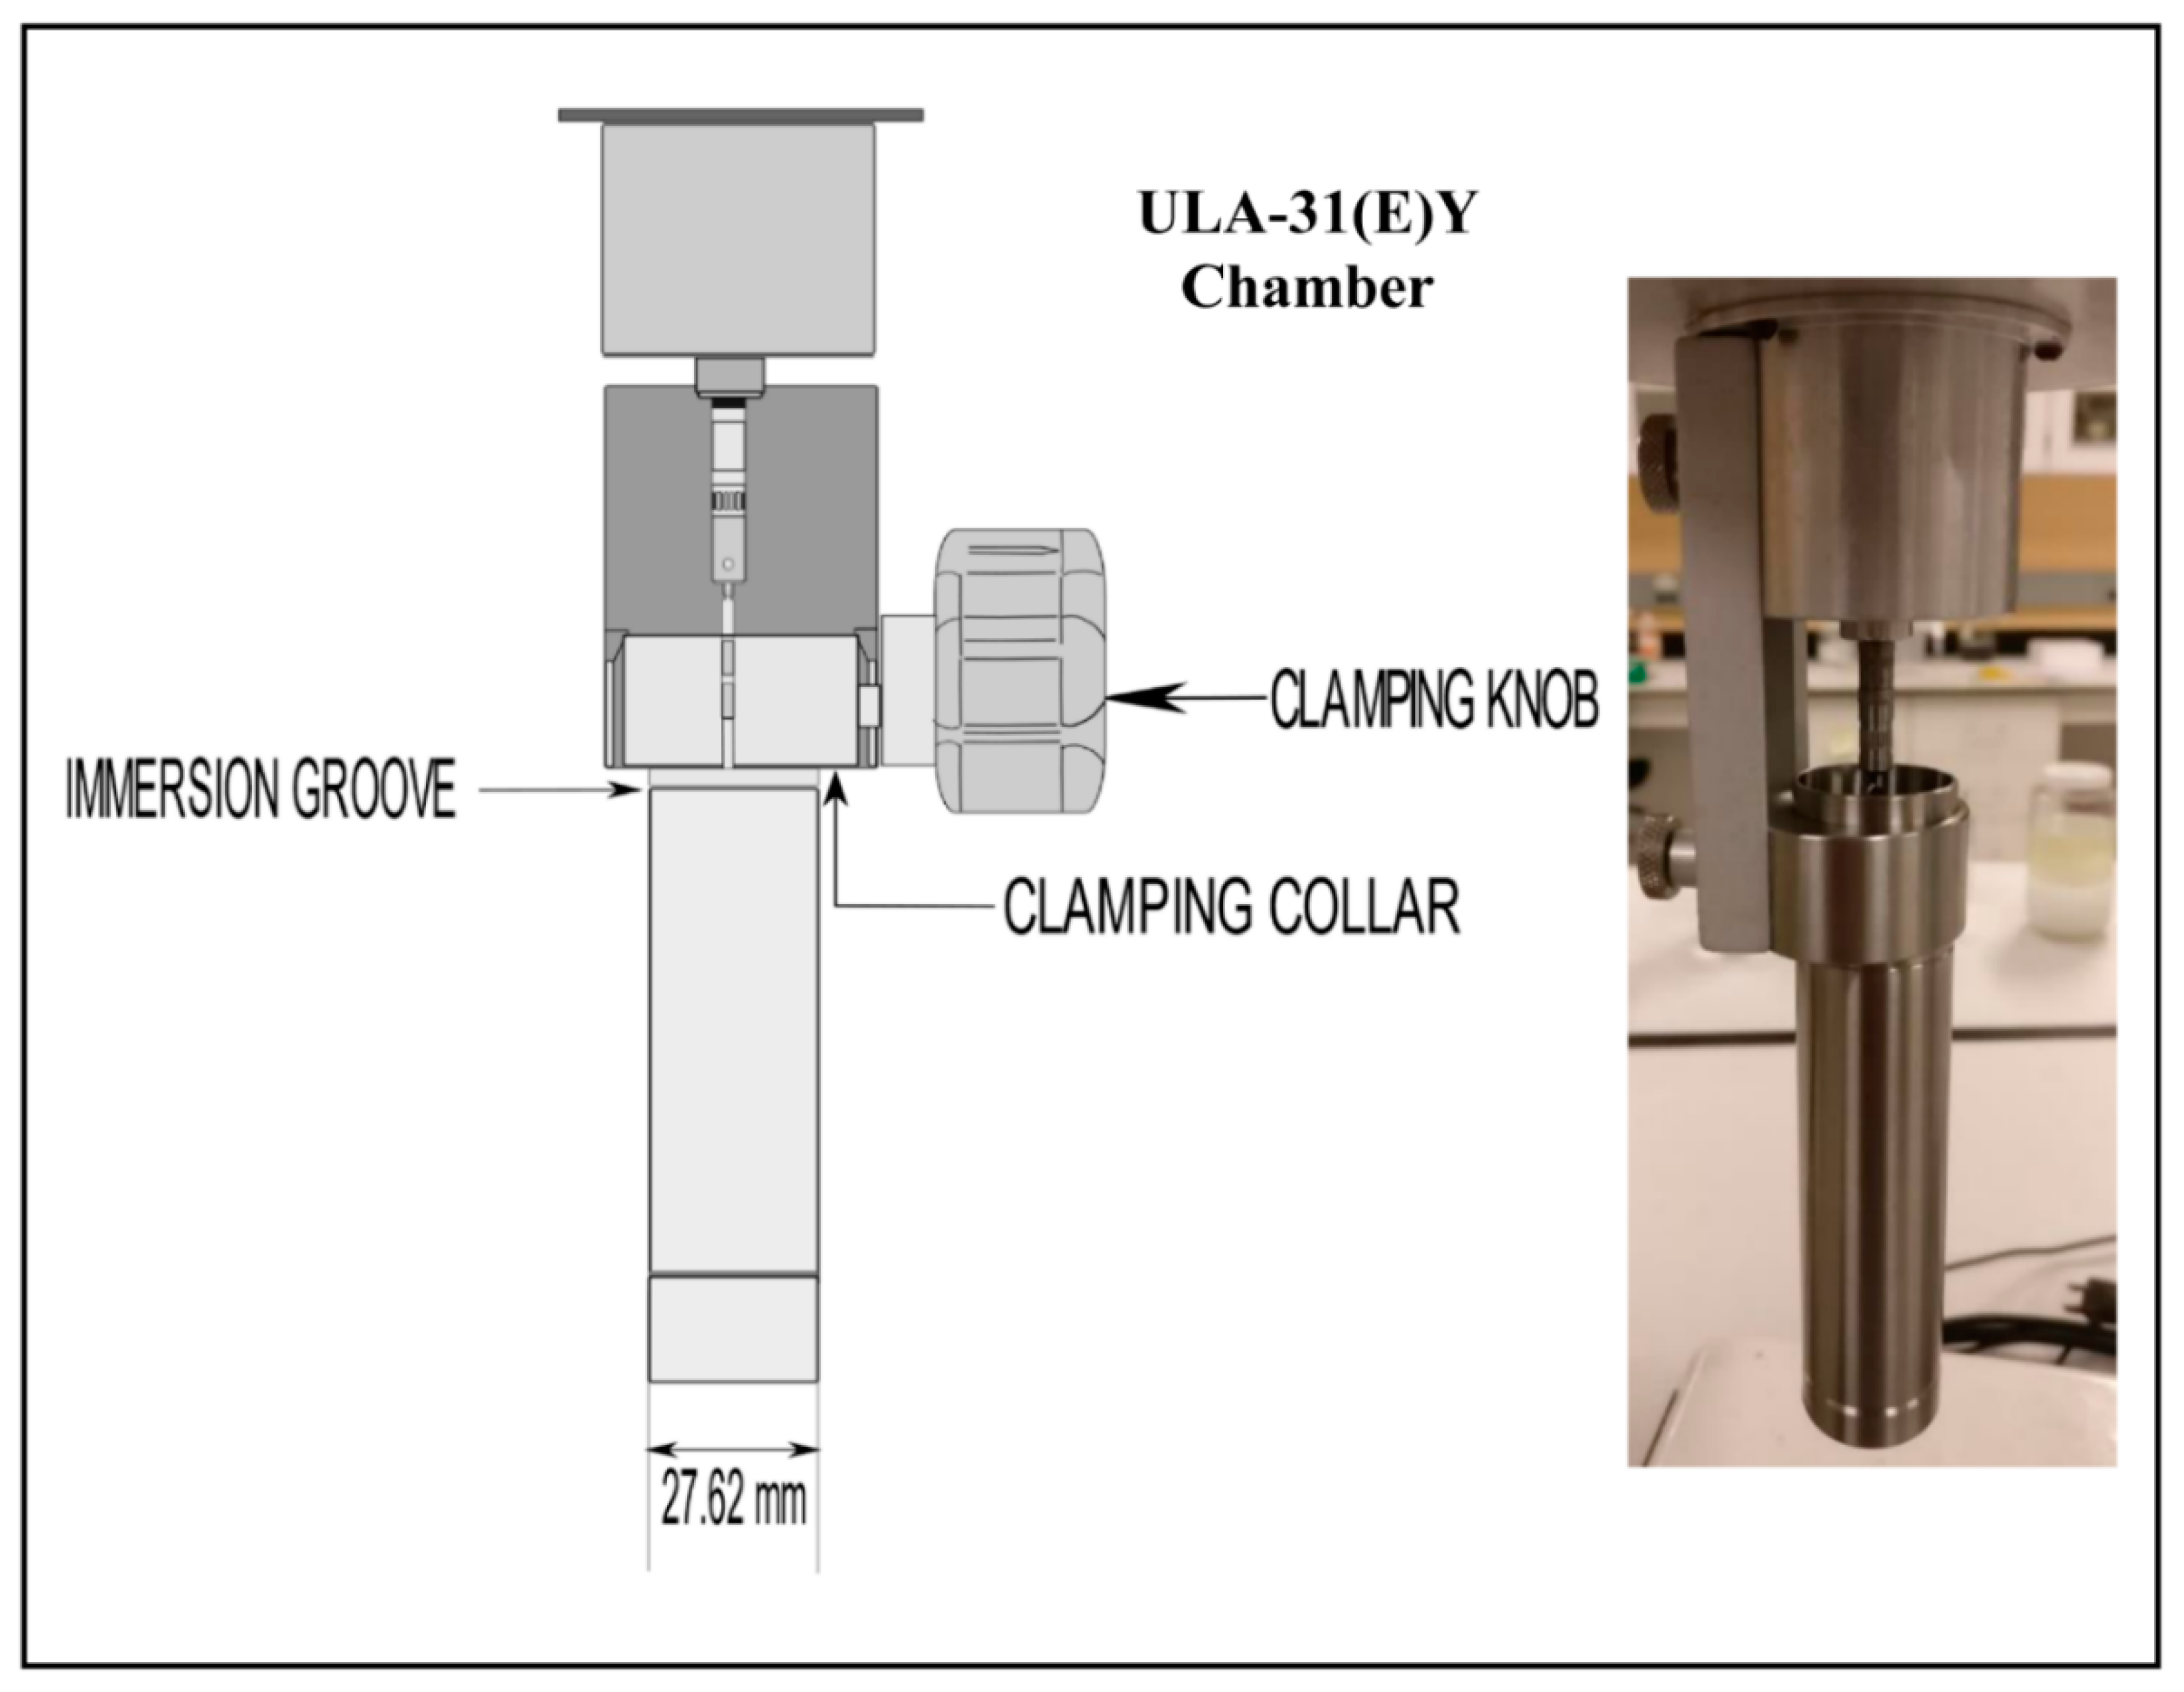
A Brookfield LVT viscometer (manufactured by AMETEK Brookfield, Middleboro, MA, USA) equipped with an enhanced UL adapter was used for in-situ measurements of the viscosity of emulsions at different shear rates while the homogenizer was on. The enhanced UL adapter of the viscometer consisted of a solid cylindrical spindle that rotated inside a cylindrical tube chamber. To vary the shear rate, the spindle could be rotated at eight different speeds ranging from 0.3 to 60 rpm. A schematic diagram and photograph of the UL adapter assembly is shown in Figure 3. The diameter of the inside solid spindle was 18.84 mm and the inside diameter of the outer cylindrical tube chamber was 27.62 mm. Thus, the gap width in which the emulsion is sheared was 4.39 mm. The height or length of the spindle was 74.93 mm. The spindle was immersed in the tank and the viscous drag exerted by an emulsion was measured at different rotation speeds (rpm). To confirm the reproducibility, measurements were repeated at least three times for each rpm and the average value is reported.
The emulsion viscosity as a function of shear rate was determined from the viscometer dial readings at different speeds of rotation of the viscometer spindle. The shear rate in the fluid was calculated from the following expression [16]:
where and are the radii of the outer tube chamber and inner spindle, is the shear rate, and is the speed of rotation of spindle in rpm. The range of shear rate was from 0.117 to 23.46 s−1. The shear stress in the fluid, in units of Pa, was calculated from the viscometer dial reading as follows:
where is the length of the spindle, is the torque factor, and is the dial reading.
3. Experimental Work
3.1. Materials
The emulsions were prepared using the following materials: Deionized water, high-purity NaCl, starch nanoparticles (SNPs), and ultrapure food grade white mineral oil. The SNPs were experimental grade starch nanoparticles provided by EcoSynthetix Inc. (Burlington, ON, Canada). They are engineered starch biopolymer nanoparticles with primary application as a binder in the paper industry. They are obtained through reactive extrusion by modifying native starch. The mean diameter of the SNPs was approximately 21 nm as reported in our earlier study [17]. The oil used was Petro-Canada white mineral oil (code: Purity FG WO-15), supplied by Boucher and Jones Fuels, Waterloo (ON, Canada). The viscosity of the batch of oil used in this study was 26 mPa∙s at 21 °C. Sodium Chloride (99% purity) was supplied by Sigma Aldrich Canada Co. (Oakville, ON, Canada).
3.2. Preparation of Starch Dispersions
The starch nanoparticle dispersions were prepared by slowly sprinkling the known amount of SNPs into a 0.01 mol/L NaCl aqueous solution and ensuring that no clumps of particles were formed. The sole purpose of adding NaCl to the aqueous phase was to increase the electrical conductivity of the solution. To ensure complete dissolution, the solution was homogenized using a high shear Gifford-Wood homogenizer (model 1-L) at 5000–6000 rpm for a duration of at least 60 min at room temperature 22° ± 2 °C.
3.3. Preparation of Emulsions
Water-in-oil (W/O) emulsions were prepared at room temperature using aqueous dispersions of starch nanoparticles as the dispersed phase and oil as the continuous phase. The aqueous phase (SNP dispersion) was added sequentially into the oil phase in increment of approximately 5% by volume while maintaining mixing and shearing by a homogenizer at 5000–6000 rpm. At each concentration of the aqueous phase, the electrical conductivity and viscosity versus shear-rate data of emulsion were collected. The experiments were repeated by varying the concentration of starch nanoparticles in the aqueous phase. The starch nanoparticle concentration was varied from 0.25% to 2% by weight based on the aqueous phase. The range of aqueous phase volume concentration covered in the experiments varied with the SNP concentration of the aqueous phase. For example, when the SNP concentration was 0.25% by weight, the range of aqueous phase volume concentration covered was 0–49.6%. When the SNP concentration was 2% by weight, the aqueous phase volume concentration covered was 0–69.7%. It should be noted that emulsions were of W/O type only up to a certain critical volume fraction of aqueous phase. Above the critical volume fraction of aqueous phase, catastrophic phase inversion of W/O to O/W emulsion took place accompanied by a sharp increase in the electrical conductivity of emulsion. The emulsions produced, before and after inversion, were generally unstable under quiescent (no mixing) conditions. The samples of emulsions when left unstirred in a graduated cylinder separated into oil and water phases within a 24 h period. Thus in-situ measurement of rheology and conductivity under mixing conditions was necessary.
4. Results and Discussion
4.1. Rheological Behavior of Emulsions
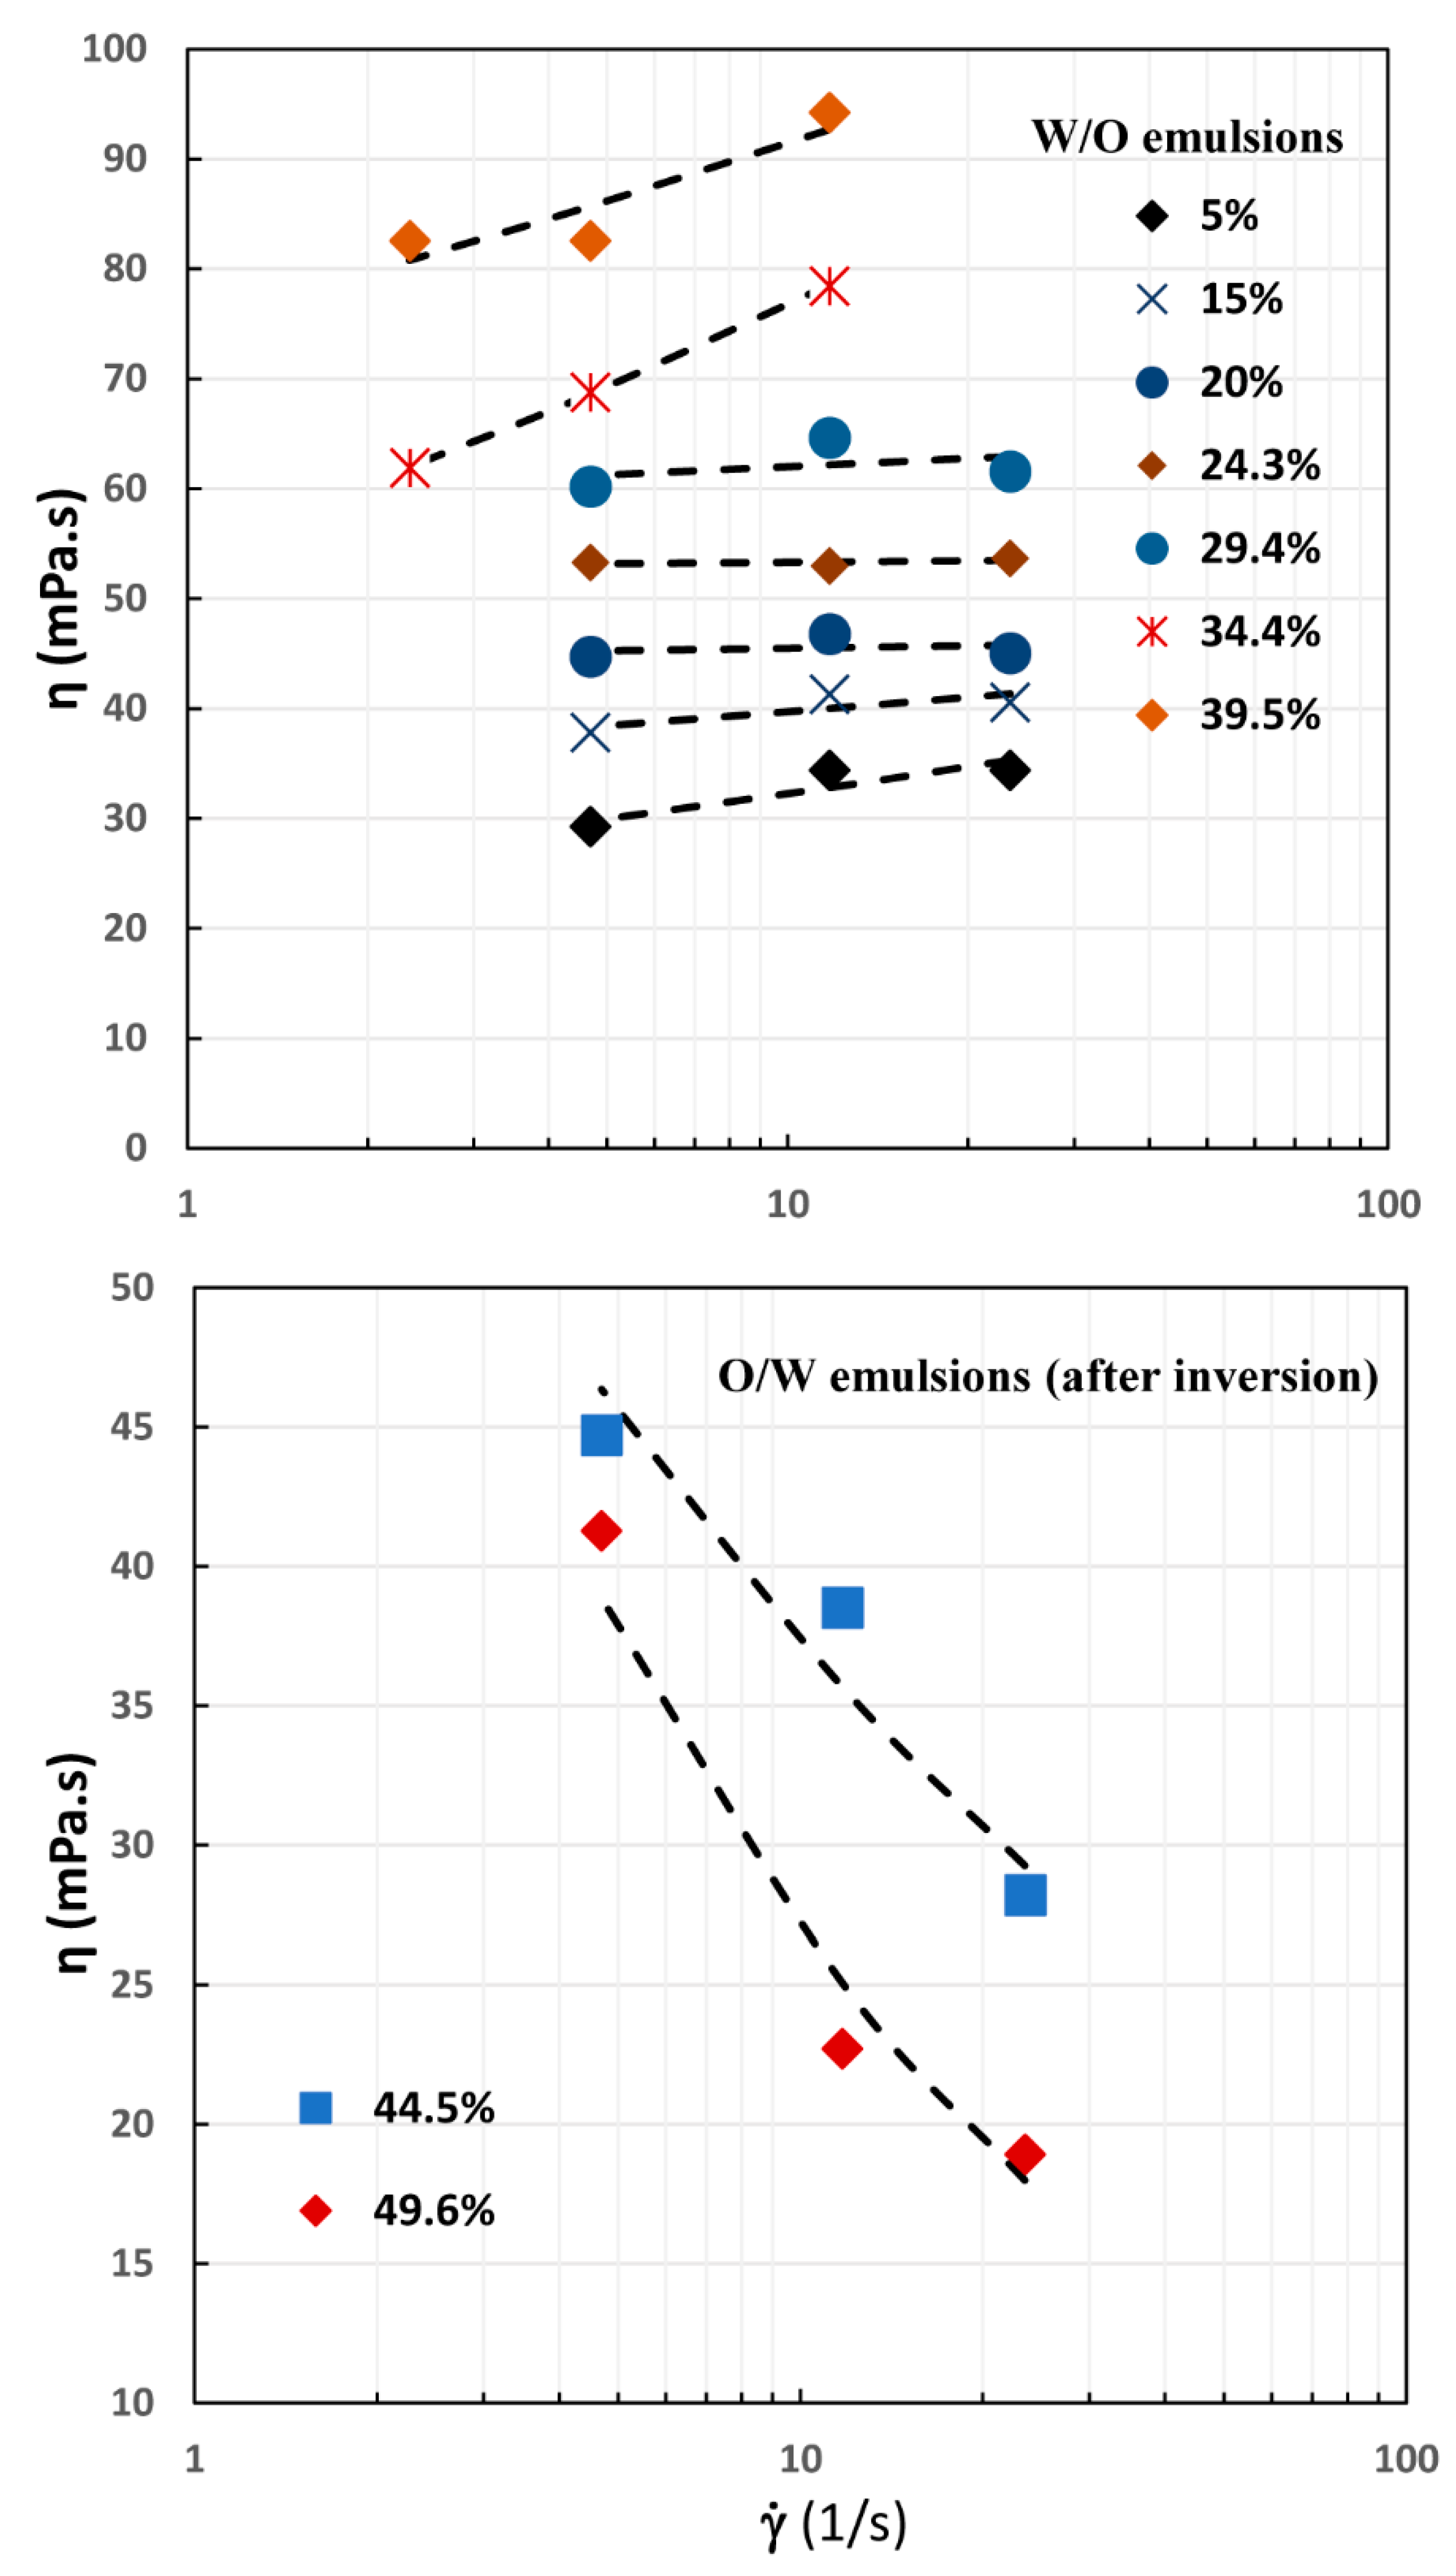
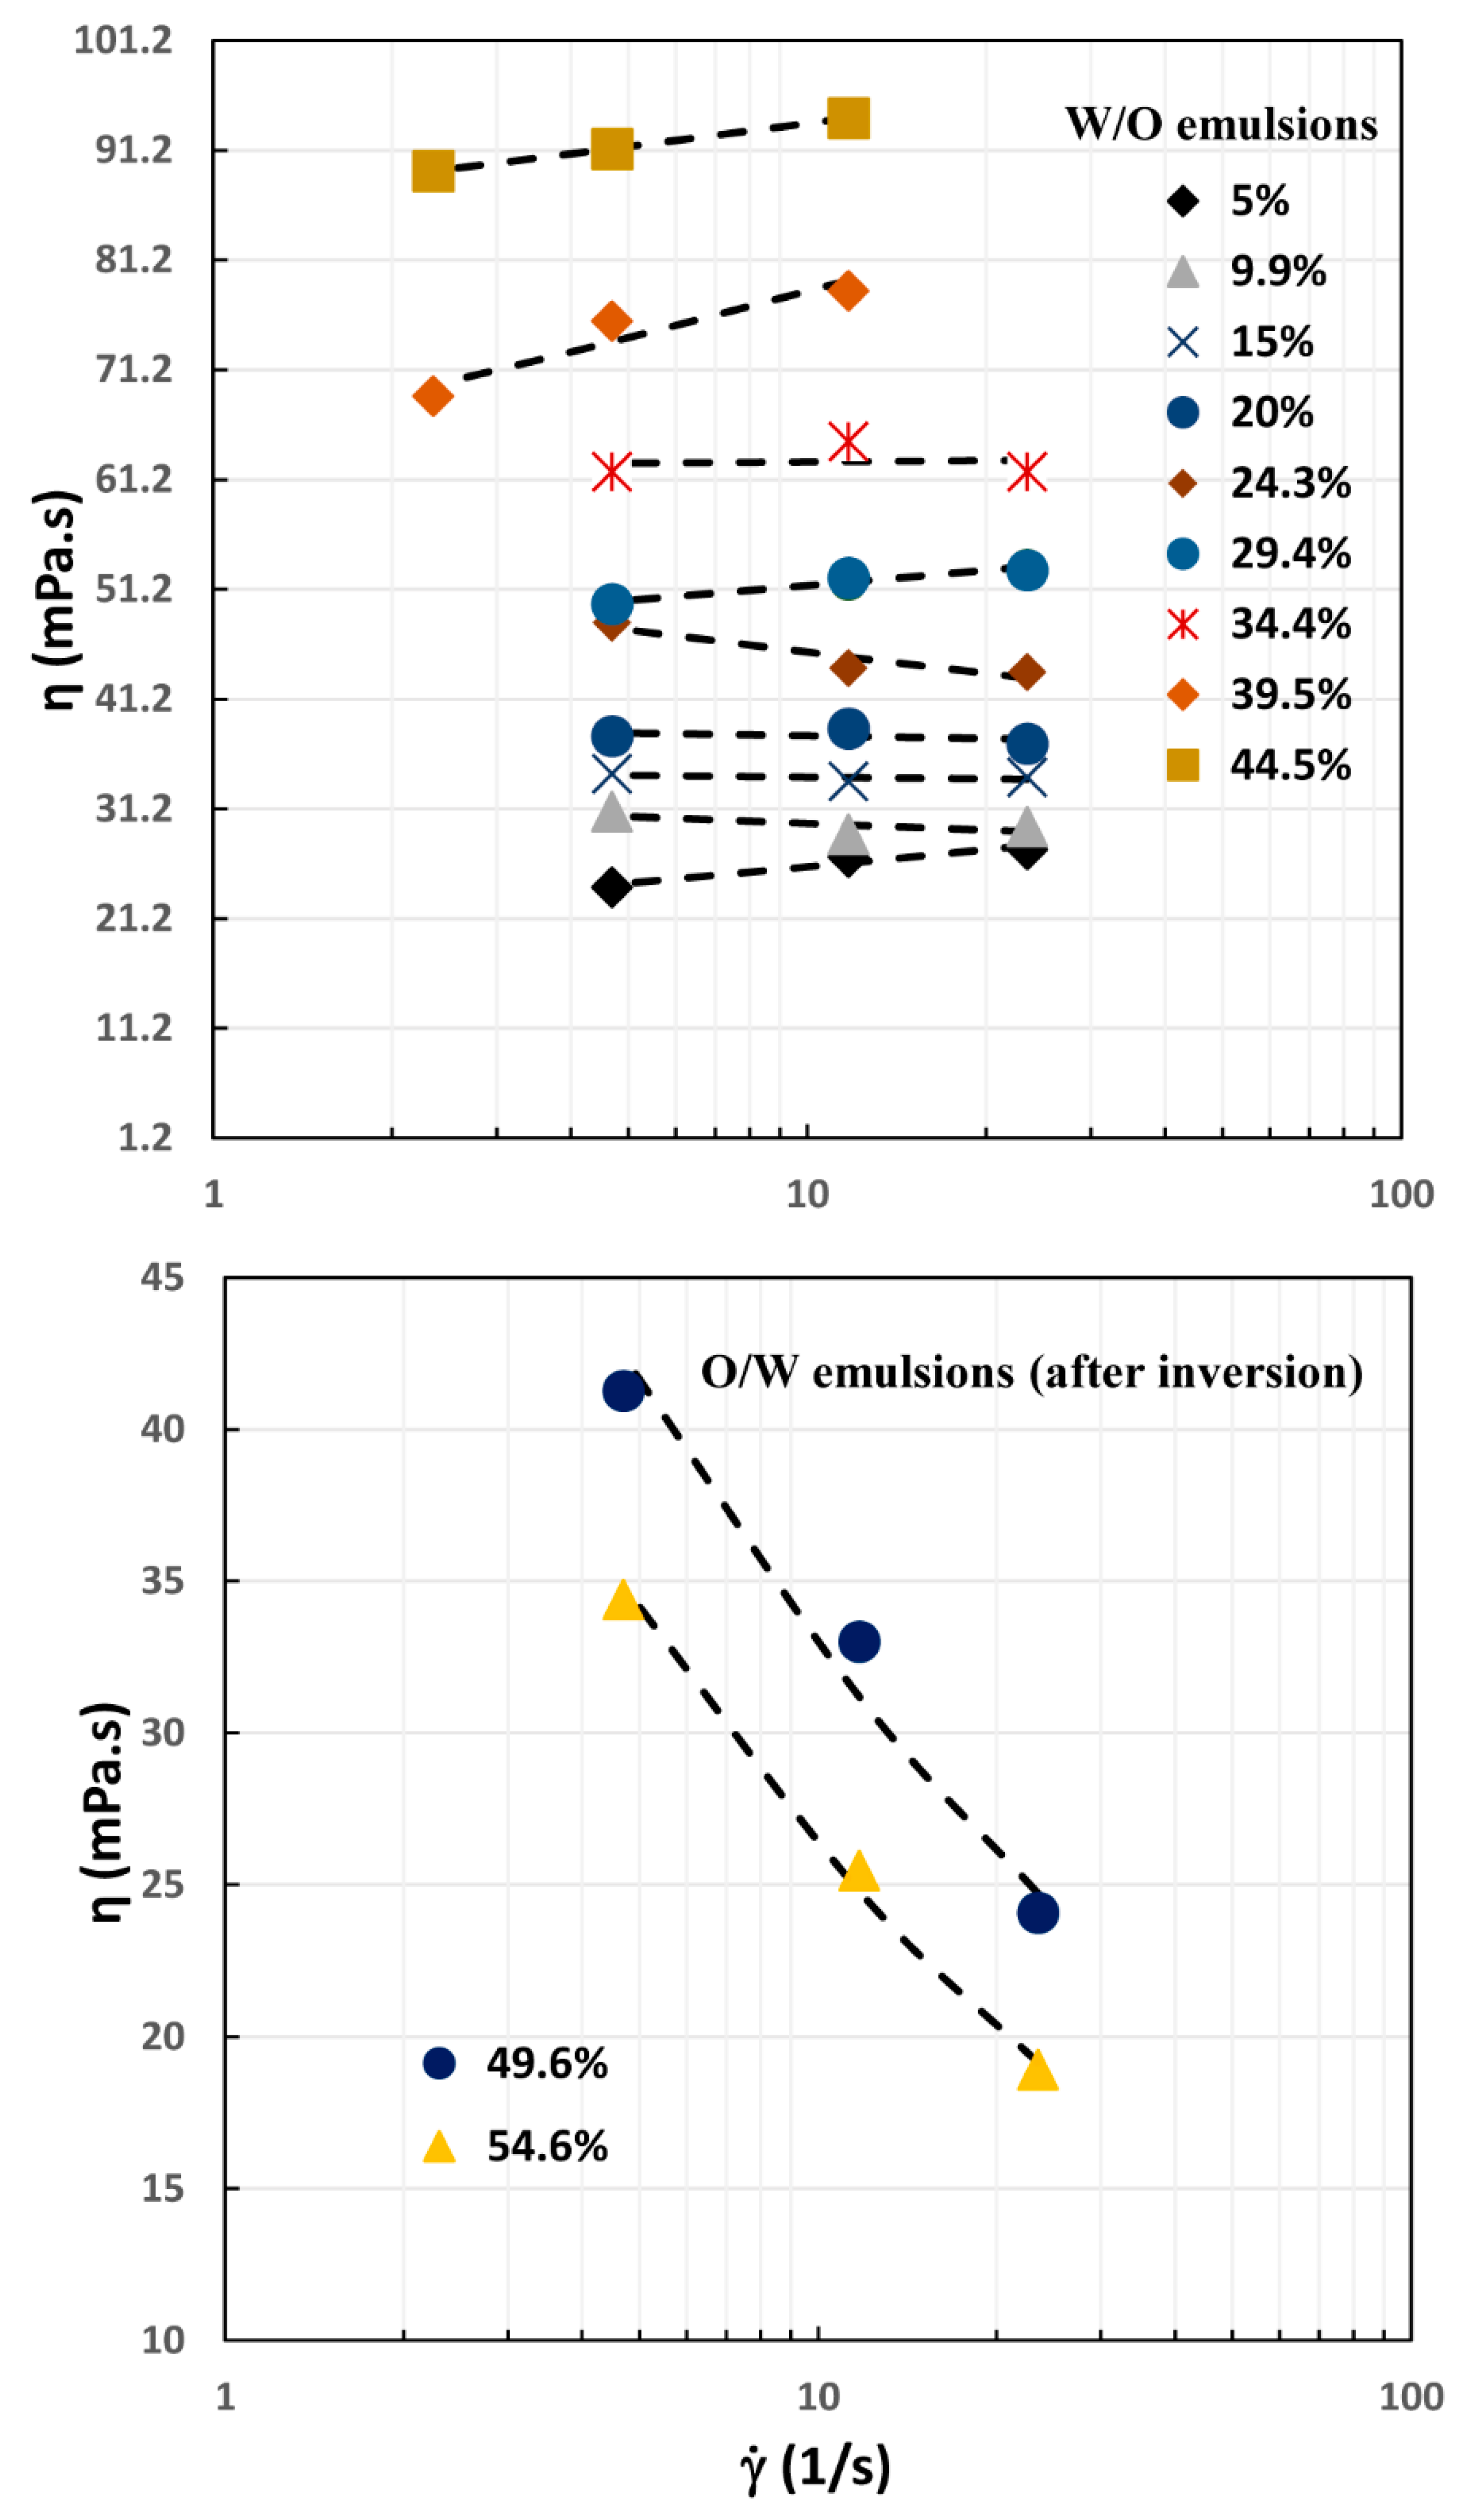
Figure 4 shows the viscosity versus shear rate plots of emulsions before and after catastrophic phase inversion. The aqueous phase of the emulsions was 0.25% wt. SNP dispersion. The emulsions were W/O type up to the aqueous phase volume percent of 39.5 and oil phase volume percent of 60.5. The catastrophic phase inversion of W/O emulsion to O/W type emulsion occurred at the aqueous phase concentration of 44.5% vol. The W/O emulsions were nearly Newtonian up to an aqueous phase (0.25% wt SNP dispersion) volume percent concentration of 29.5. At higher aqueous phase concentrations, the W/O emulsions showed some degree of shear-thickening, that is, the viscosity increased with the increase in shear rate. For example, the flow behavior index (n) of 34.4% vol. W/O emulsion was 1.14. Wolf et al. [21] also reported shear-thickening in Pickering O/W emulsions stabilized by hydrophilic silica nanoparticles. Shear-thickening is often observed in suspensions of solid particles, but not in conventional surfactant-stabilized emulsions. The exact mechanism of shear-thickening in Pickering emulsions is not clear. According to Wolf et al. [21], shear-thickening is observed in Pickering emulsions as the droplets behave more like rigid particles due to coating of droplets by a monolayer of solid nanoparticles. Thus, shear-thickening observed in W/O emulsions of this study could be due to rigidity of water droplets coated with starch nanoparticles. It could also be due to shear-induced changes in the morphology of the emulsion prior to phase inversion. Interestingly, the O/W emulsions obtained after phase inversion were shear-thinning, that is, the viscosity decreased with the increase in shear rate. For example, the flow behavior index (n) of O/W emulsion (44.5% vol. aqueous phase) obtained after phase inversion was 0.71. The shear-thinning observed in O/W emulsions is probably due to de-flocculation of flocs of oil droplets with the increase in shear rate.
It should also be noted that the viscosity of W/O emulsion increased with the increase in the aqueous phase concentration whereas the viscosity of O/W emulsion decreased with the increase in aqueous phase concentration (see Figure 4). The viscosity of an emulsion is known to be strongly dependent on the volume fraction of the dispersed phase [1,6,7,22]. It increases with the increase in the dispersed phase concentration [1,6,7,22]. In the case of W/O emulsions the dispersed phase was water and therefore, the viscosity of W/O emulsion increased with the increase in aqueous phase concentration. The dispersed phase of O/W emulsions was oil. With the increase in aqueous phase concentration of O/W emulsion after phase inversion, the dispersed phase (oil) concentration decreased and therefore, the viscosity of O/W emulsion decreased.
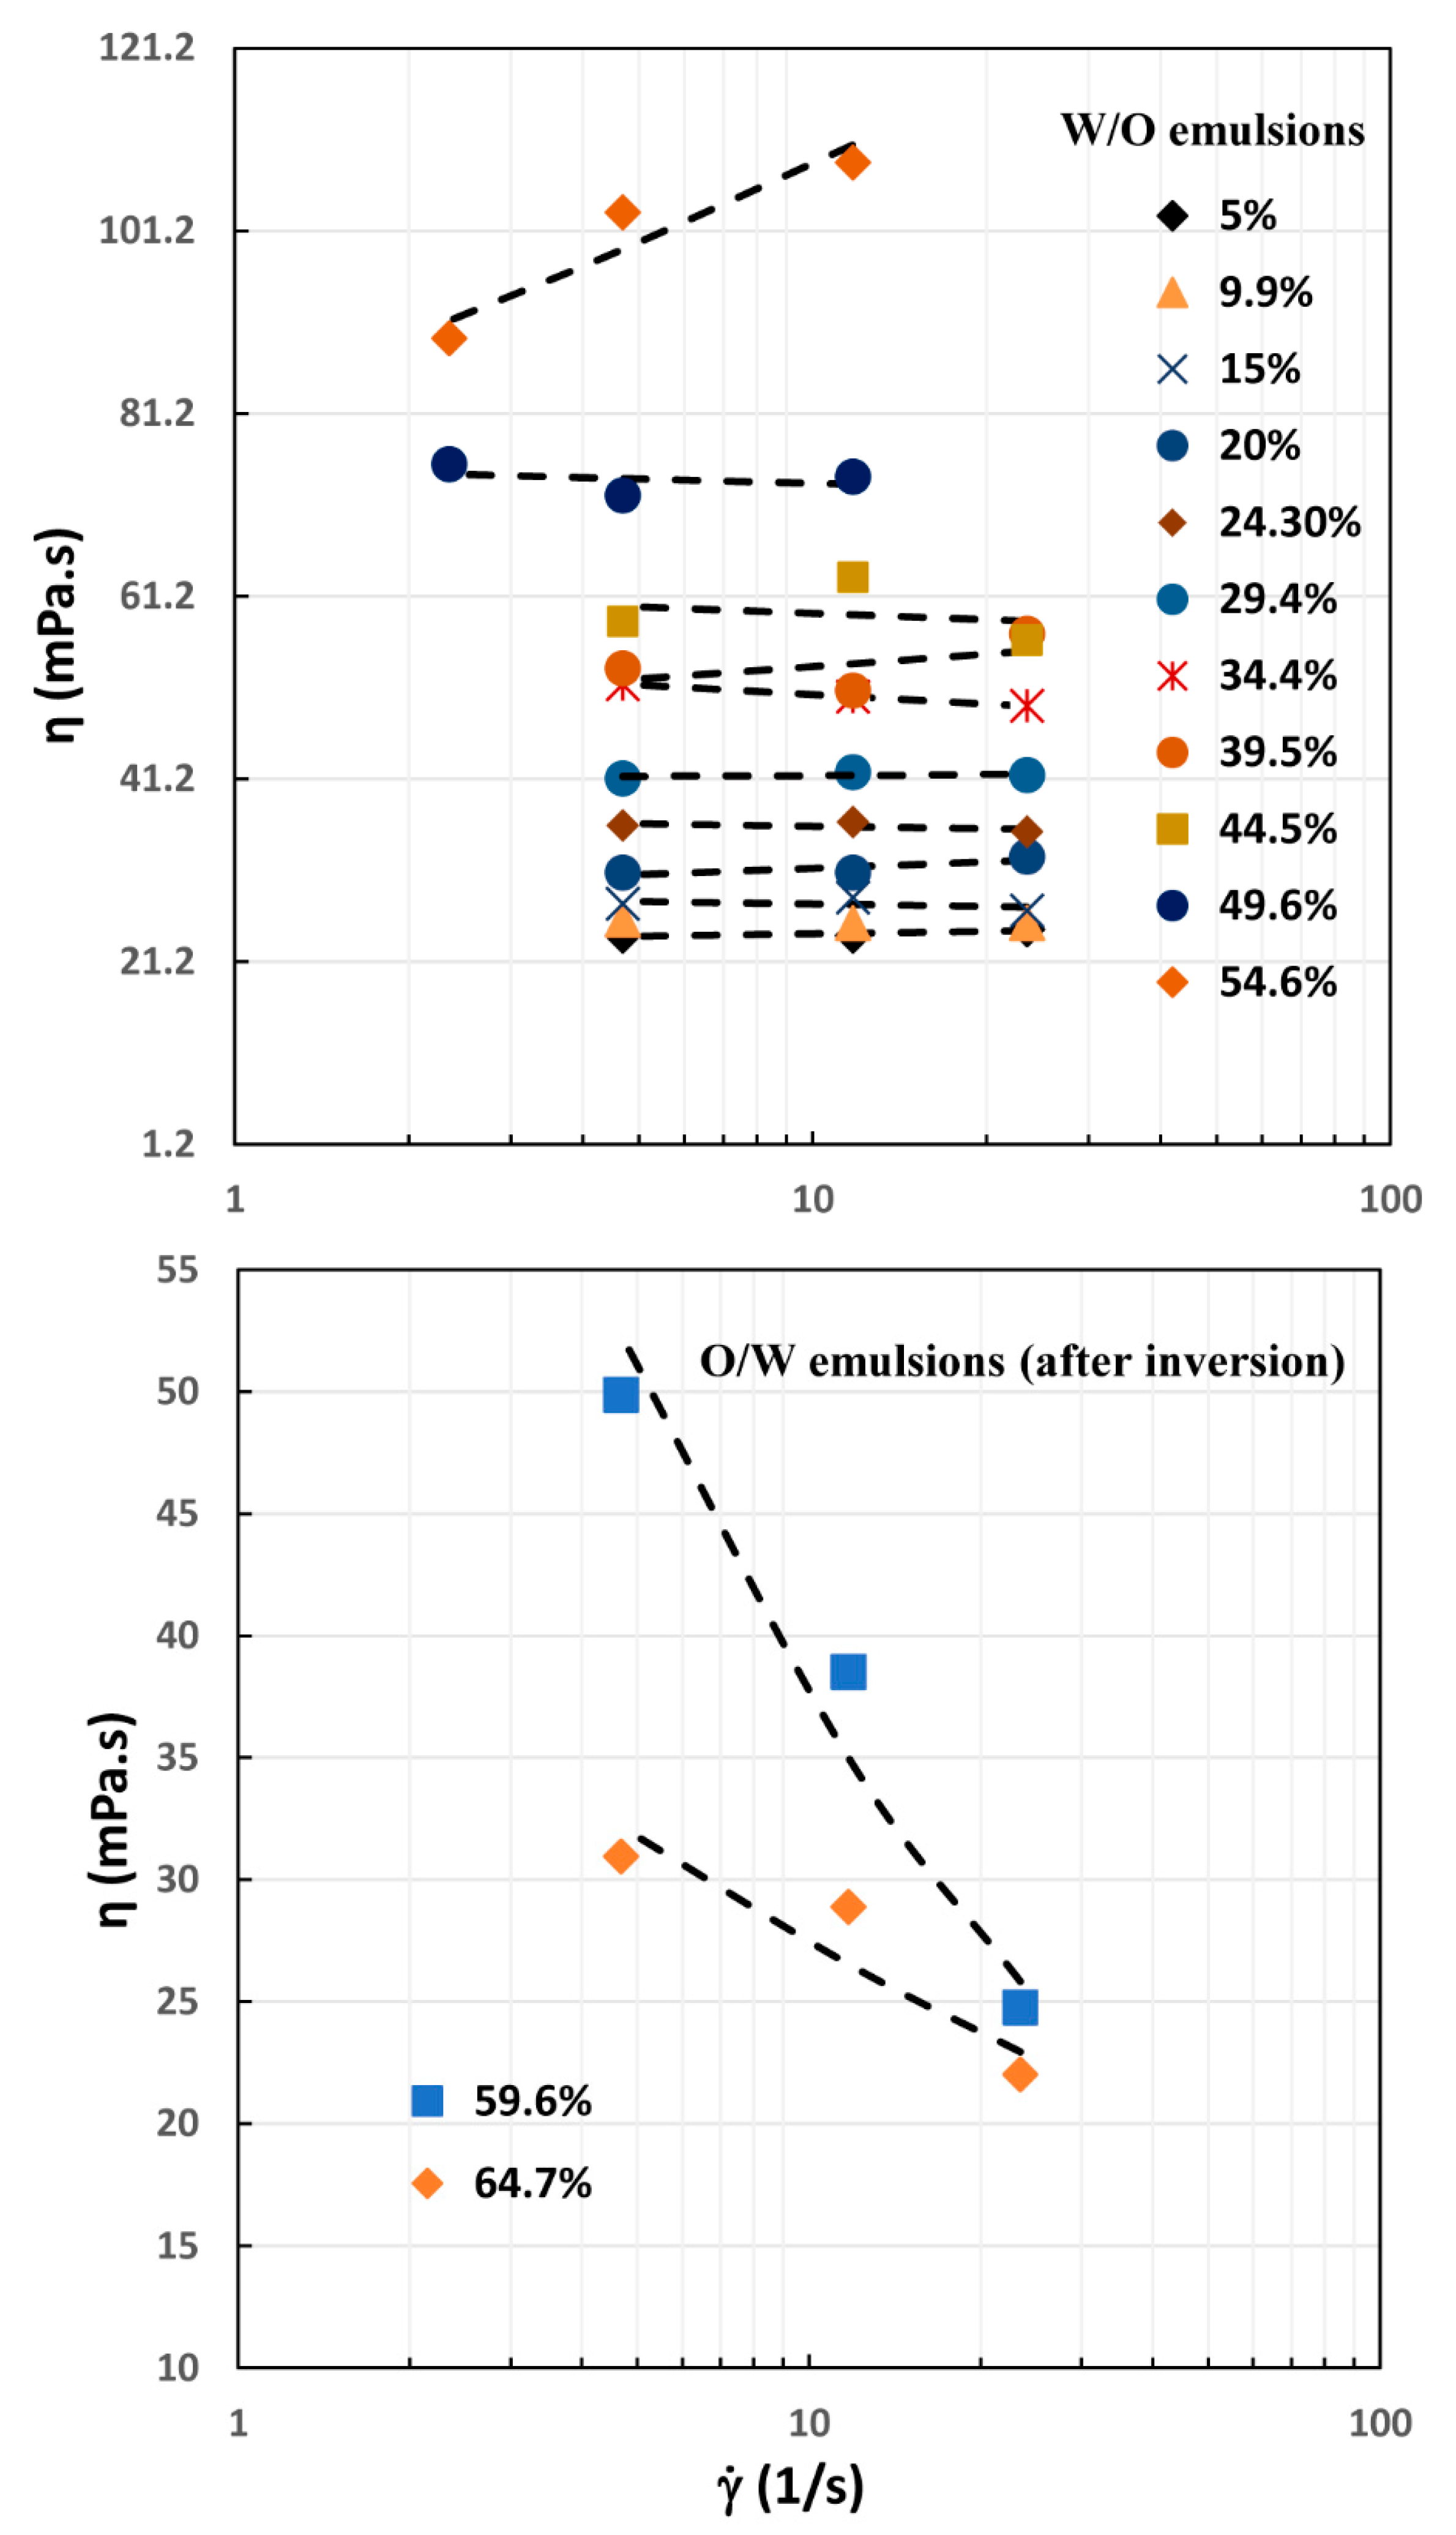
Figure 5 shows the variation of viscosity versus shear rate for emulsions prepared using 0.5% wt. SNP dispersion as the aqueous phase. The emulsions were W/O type up to aqueous phase concentration of 44.5% by volume.
Catastrophic phase inversion of W/O type emulsion to O/W type occurred at the aqueous phase concentration of 49.6% vol. The flow behavior of emulsions was similar to that observed at 0.25% wt. SNP concentration. The W/O emulsions were nearly Newtonian at low concentrations of aqueous phase. At high concentrations of aqueous phase, the W/O emulsions exhibited a slightly shear-thickening behavior. Upon phase inversion of W/O emulsion to O/W emulsion, the inverted emulsions exhibited a high degree of shear-thinning.
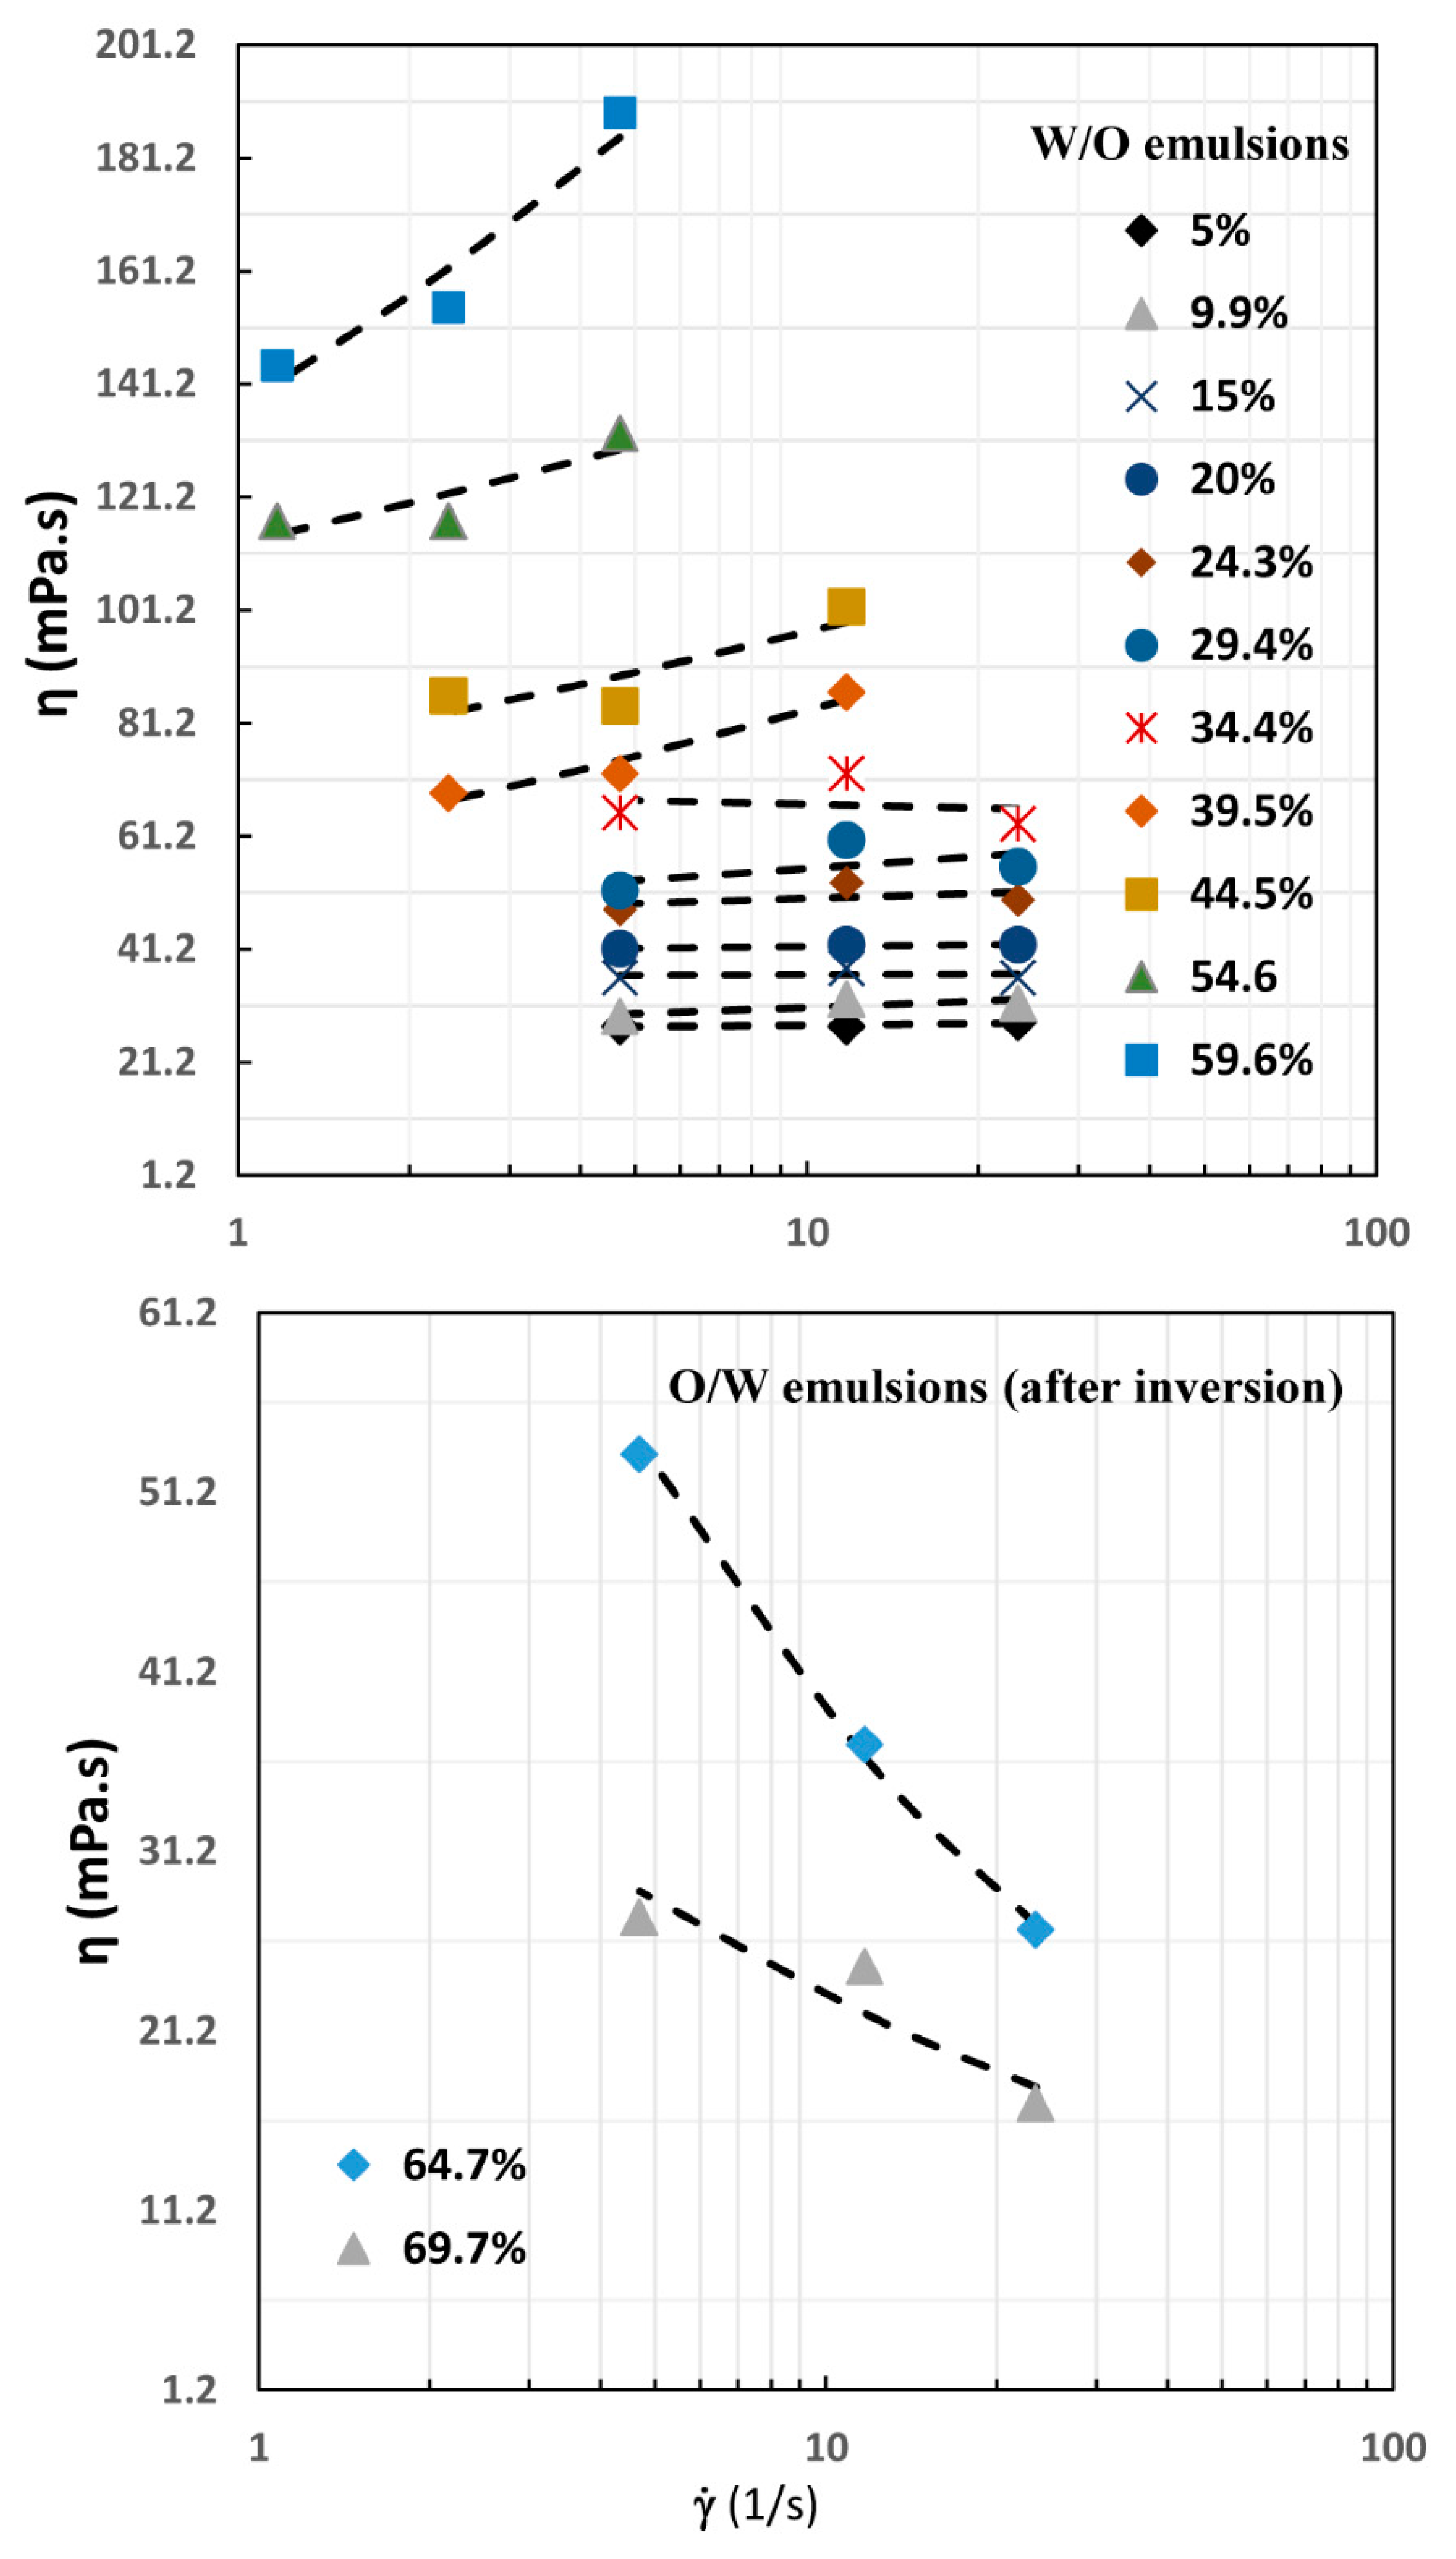
The viscosity versus shear rate plots for emulsions prepared using 1.0% wt. SNP dispersion as the aqueous phase are shown in Figure 6. Trends similar to the previous emulsion (Figure 5) were observed for a higher concentration of nanoparticle dispersion. Increasing the SNP concentration raised the phase inversion concentration of aqueous phase. The phase inversion point shifted from 49.6 to 59.6 vol.% aqueous phase upon increasing the nanoparticle concentration from 0.5 to 1 wt %.
Figure 7 shows the variation of viscosity versus shear rate for emulsions prepared using the aqueous phase with the highest concentration of SNPs, that is, 2.0% by wt. Once again, the flow behavior trends exhibited by these emulsions were similar to those of other emulsions at lower SNP concentrations except that the catastrophic phase inversion was now delayed further to 64.7% by volume aqueous phase.
4.2. Viscosity-Concentration Behavior of Emulsions
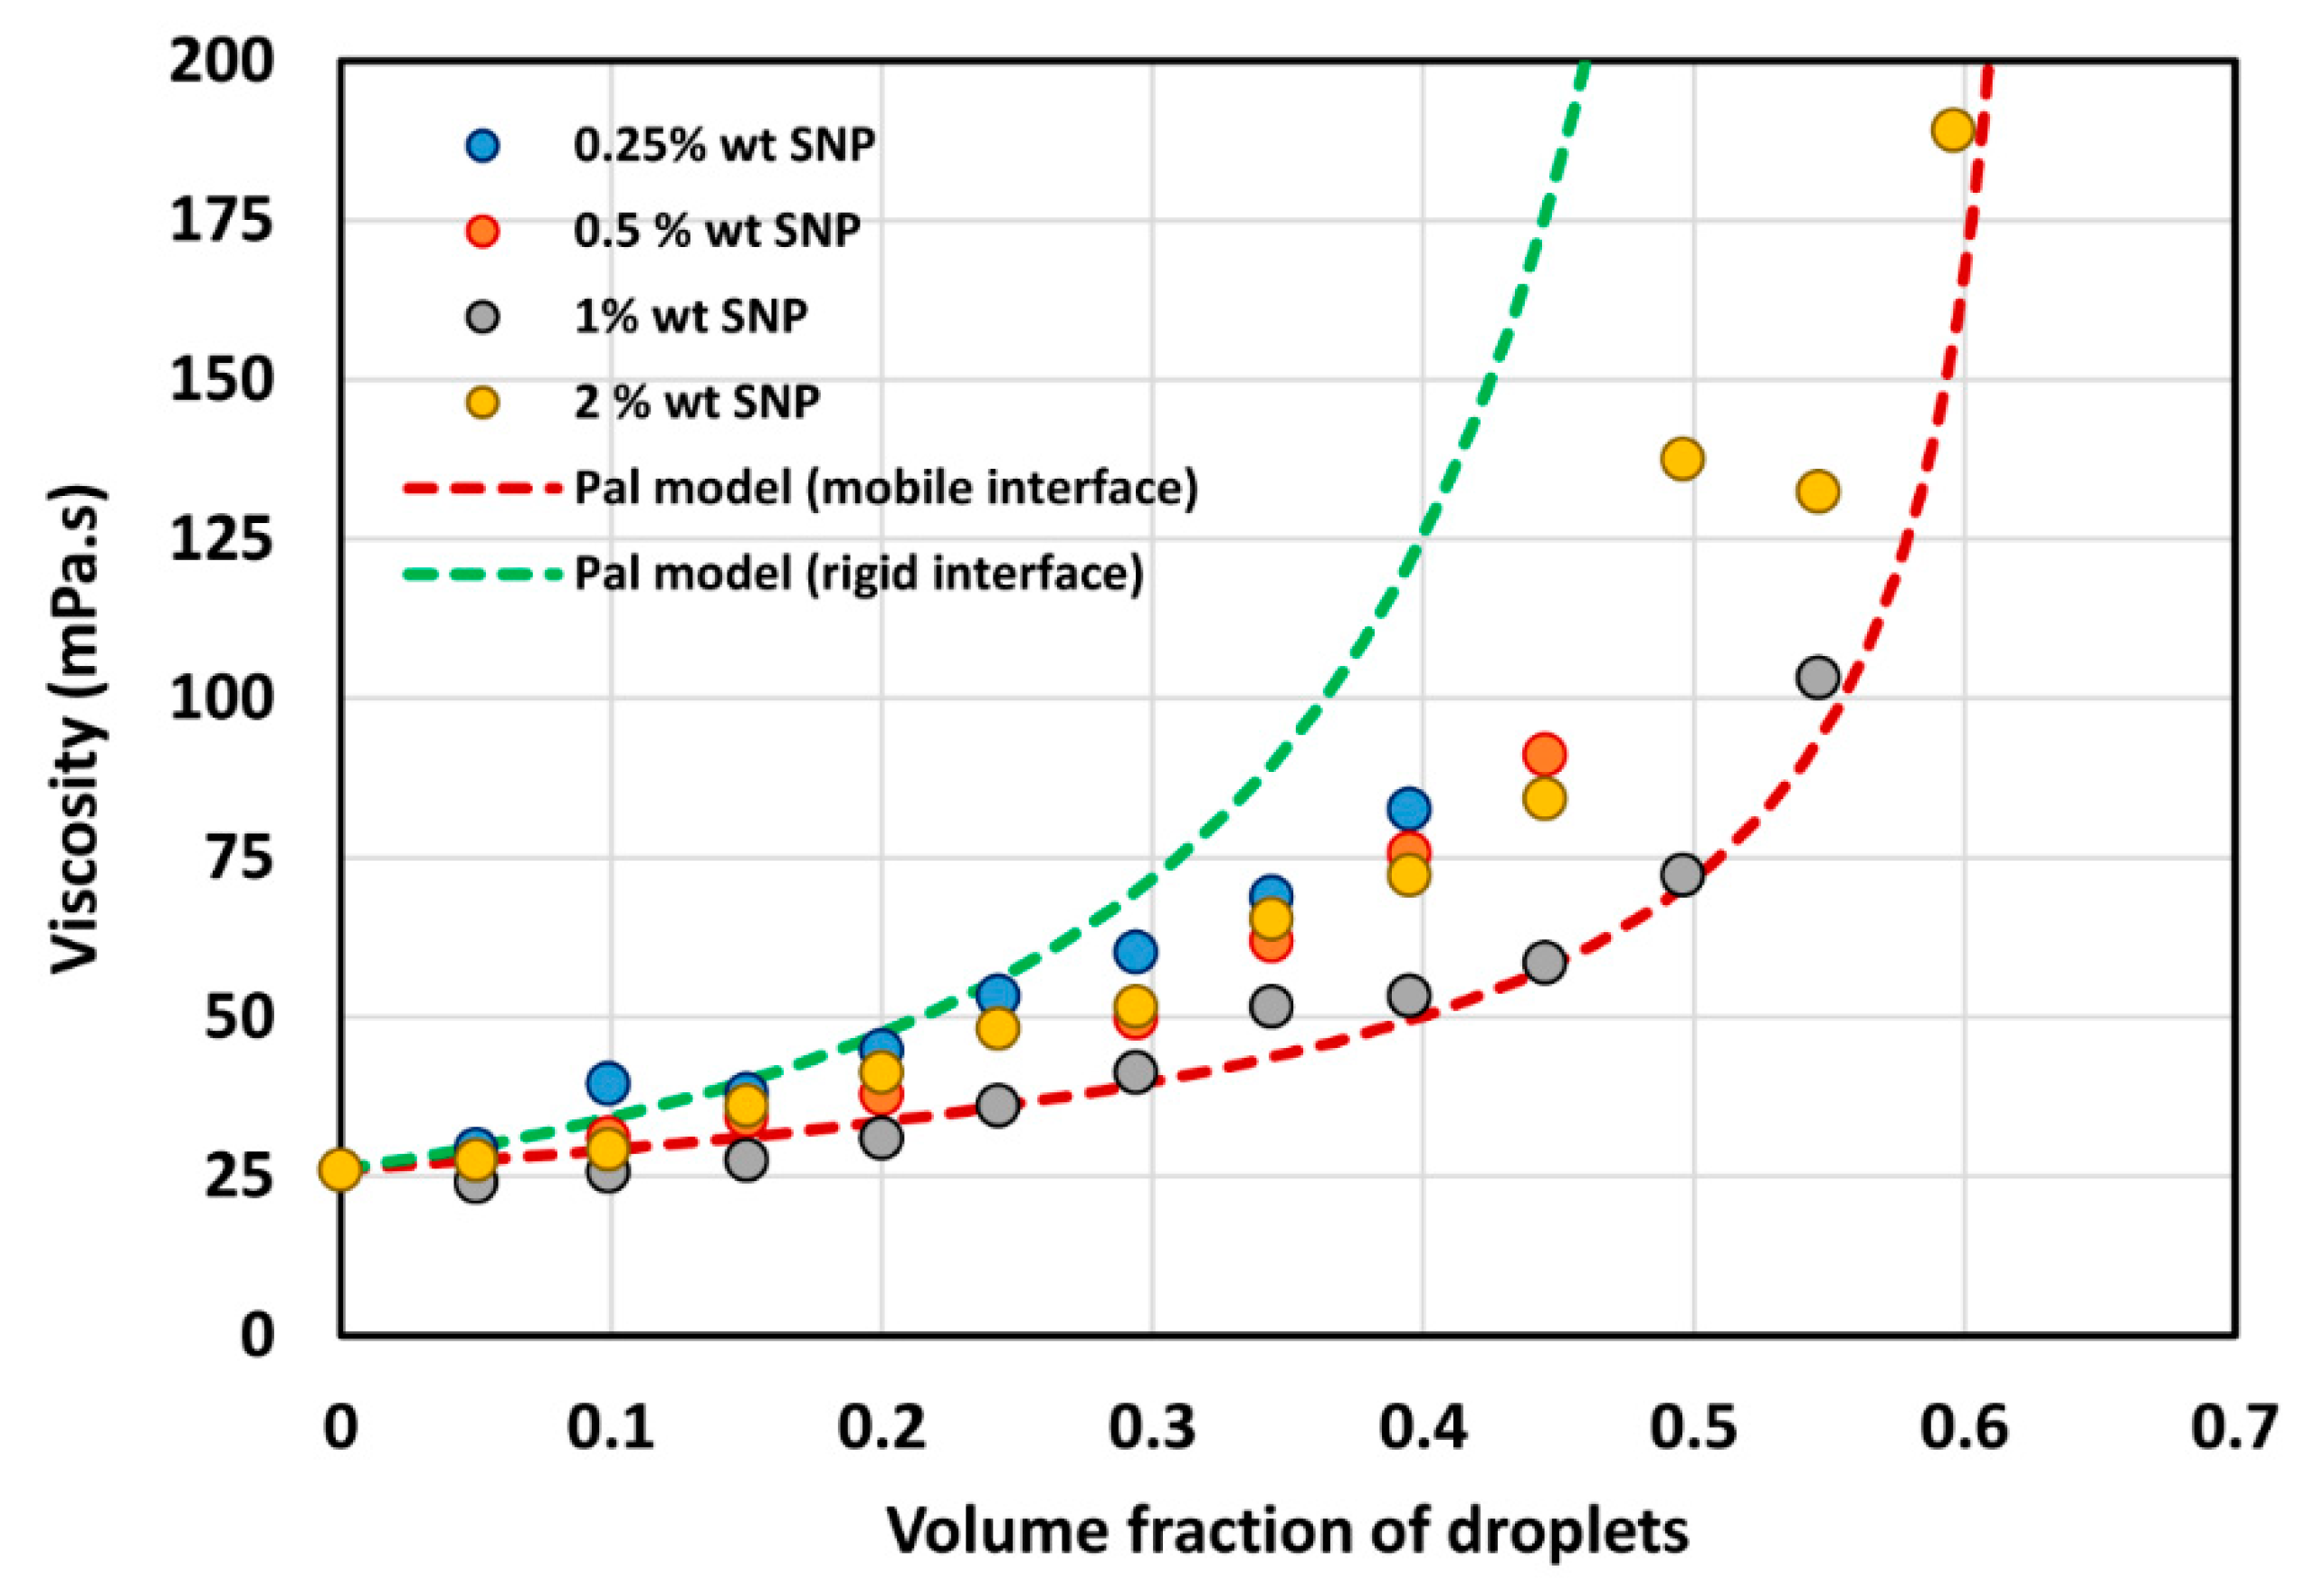
The viscosity data of W/O emulsions at a low shear rate of 4.69 s−1 are plotted in Figure 8 as a function of volume fraction of aqueous-phase (droplets). Note that the aqueous phase of the emulsions consisted of different concentrations of SNPs. The viscosity of W/O emulsion increased with the increase in the volume fraction of the aqueous-phase droplets. However, there was no clear trend of the effect of SNP concentration on emulsion viscosity. The highest viscosity was observed with 0.25% wt. SNP and the lowest viscosity was observed with 1% wt. SNP. The data with 0.5% wt. SNP and 2% wt. SNP fell in between. The reason for this variation of viscosity with SNP concentration is not clear at present.
The experimental viscosity data for W/O emulsions are compared with the predictions of the following Pal model [22]:
where is the relative viscosity of emulsion defined as the ratio of emulsion viscosity η to continuous-phase viscosity , is the ratio of dispersed-phase viscosity to continuous-phase viscosity, is the volume fraction of droplets, and is the maximum packing volume fraction of droplets. For random close packing of spherical droplets, . Equation (3) can be applied to emulsions with mobile interfaces (no additive present at the interface) as well as immobile interfaces (a rigid layer of interfacial additive present at the interface). In the case of immobile interfaces, emulsion droplets behave as solid particles and Equation (3) reduces to the following suspension viscosity model:
The experimental viscosity data for W/O emulsions (see Figure 8) fell in between the predictions of Equations (3) and (4) indicating that the droplets were neither completely rigid nor completely fluidic in nature. Thus it is likely that the surfaces of the droplets were only partially covered with the starch nanoparticles. This is consistent with our earlier study [17] where we found that the interfacial tension of the water/oil interface continued to decrease as the droplet aged at a given nanoparticle concentration of the aqueous phase due to adsorption of starch nanoparticles at the interface. In other words, the droplet surfaces were not saturated with the nanoparticles even after waiting for 3 h. Furthermore, the contact angle made by the particles with the water/oil interface was 46° measured through the aqueous phase, that is, the starch nanoparticles were more hydrophilic and were probably not absorbed strongly at the oil/water interface.
4.3. Catastrophic Phase Inversion in Emulsions
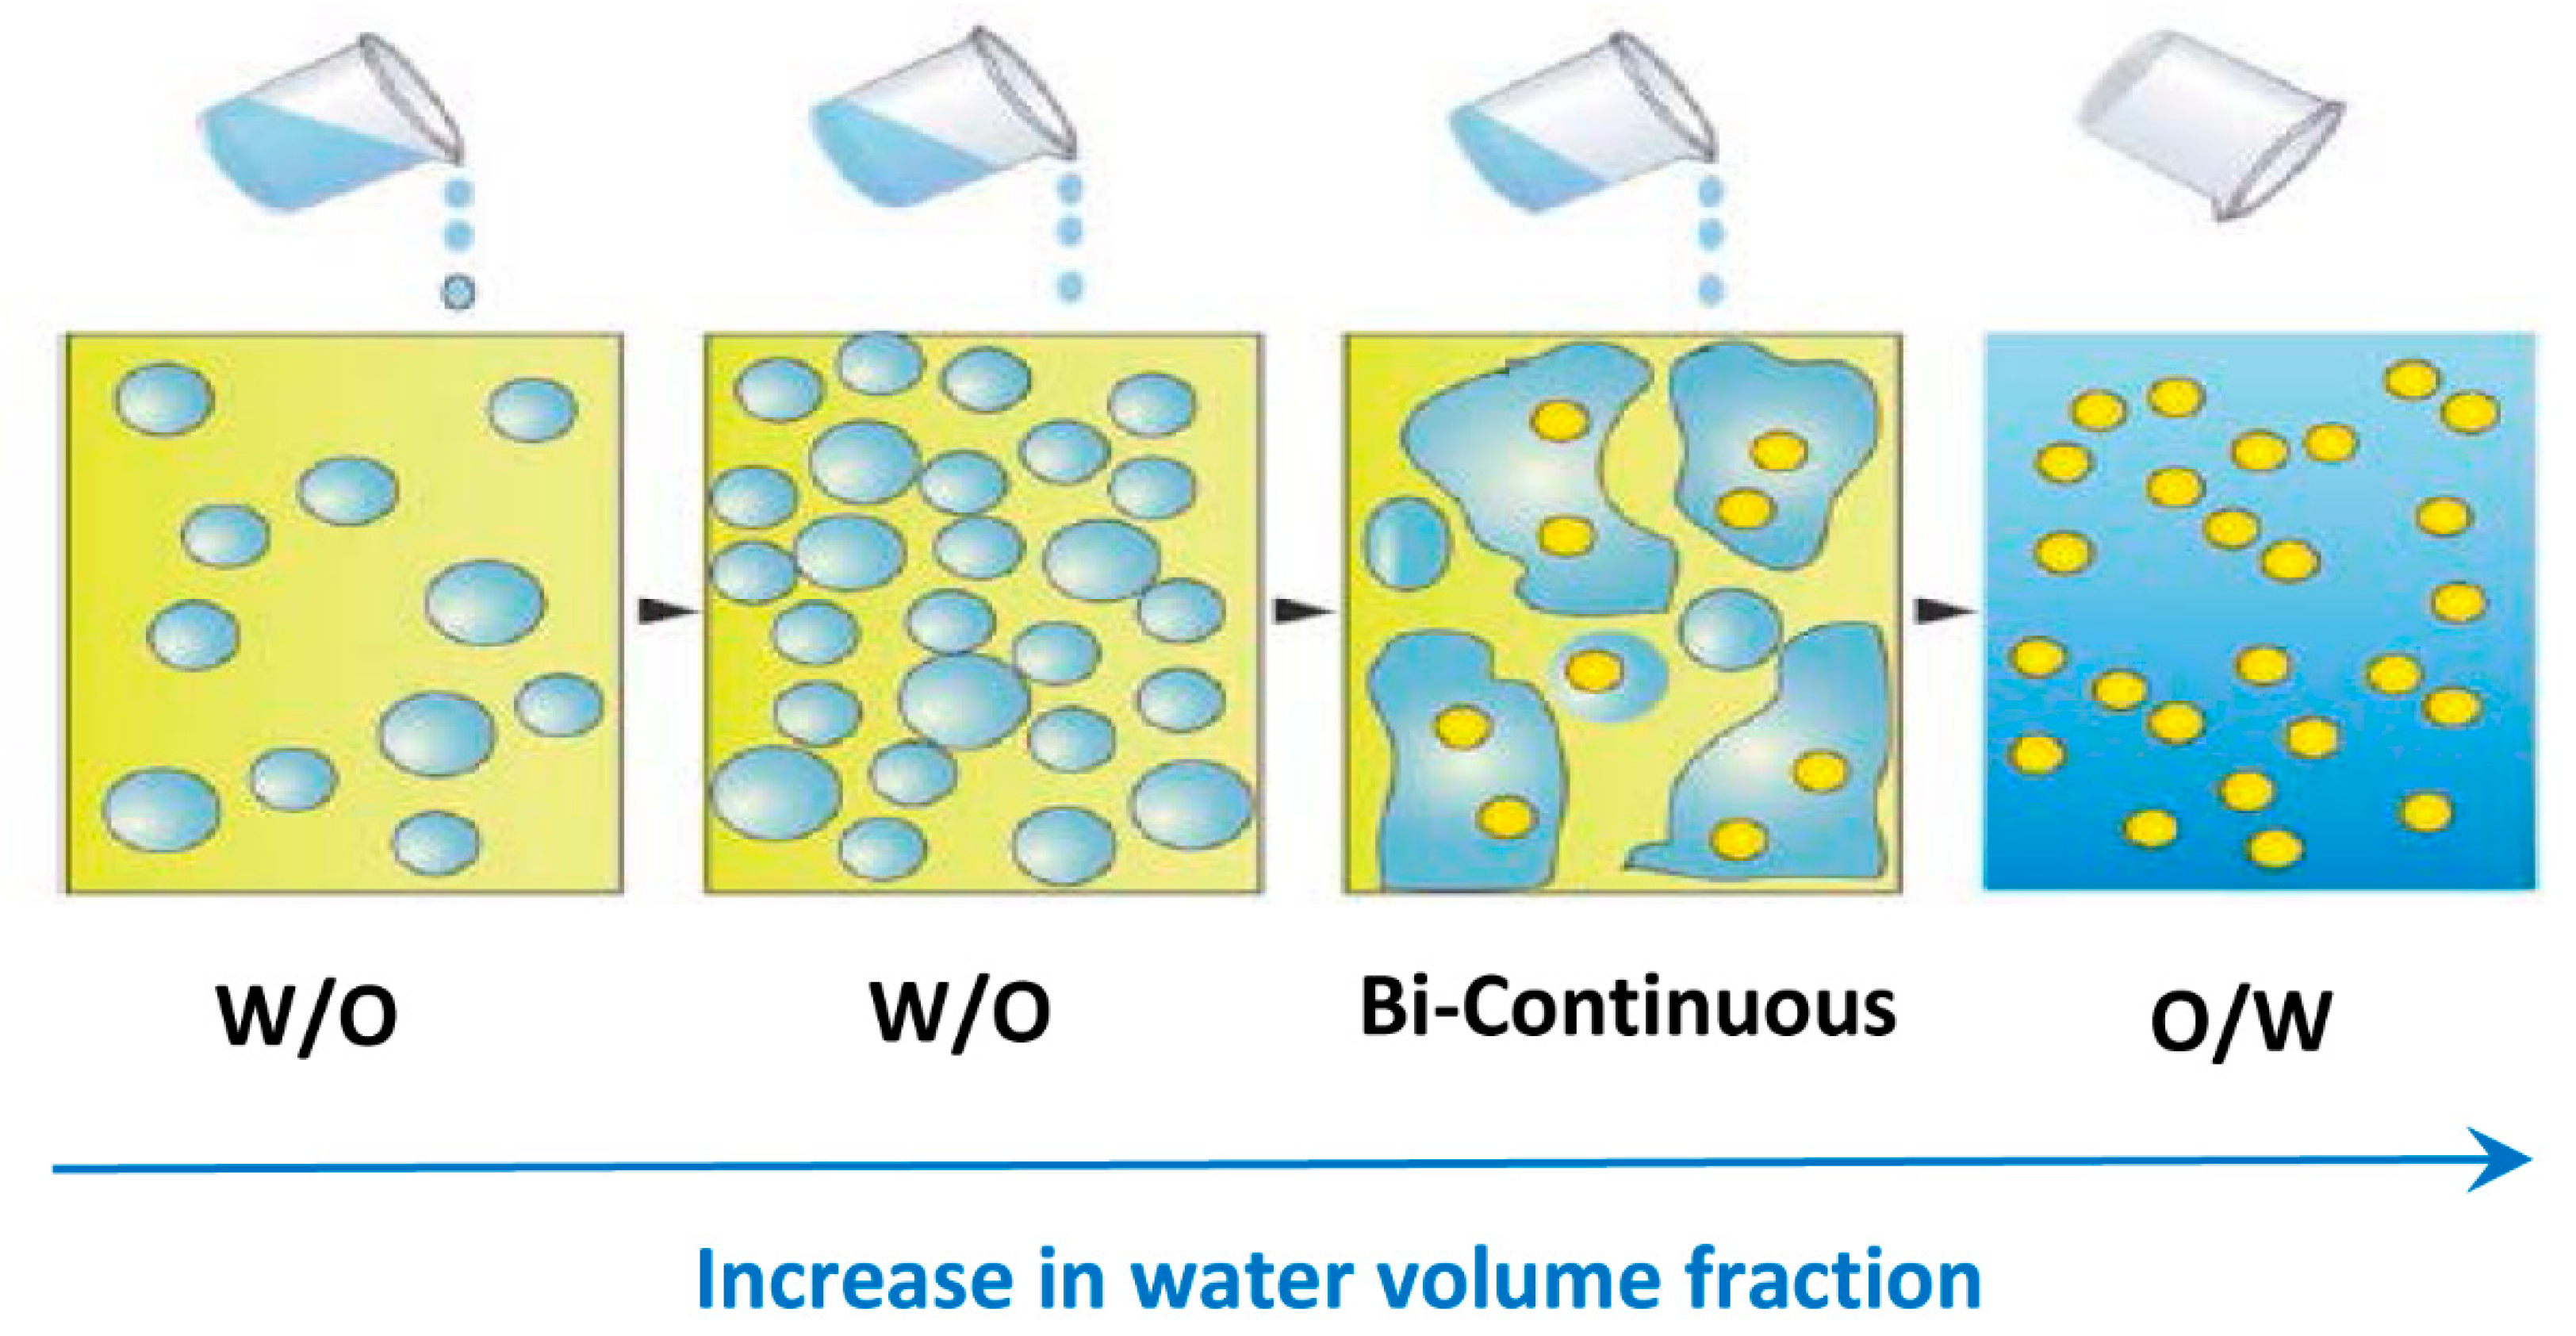
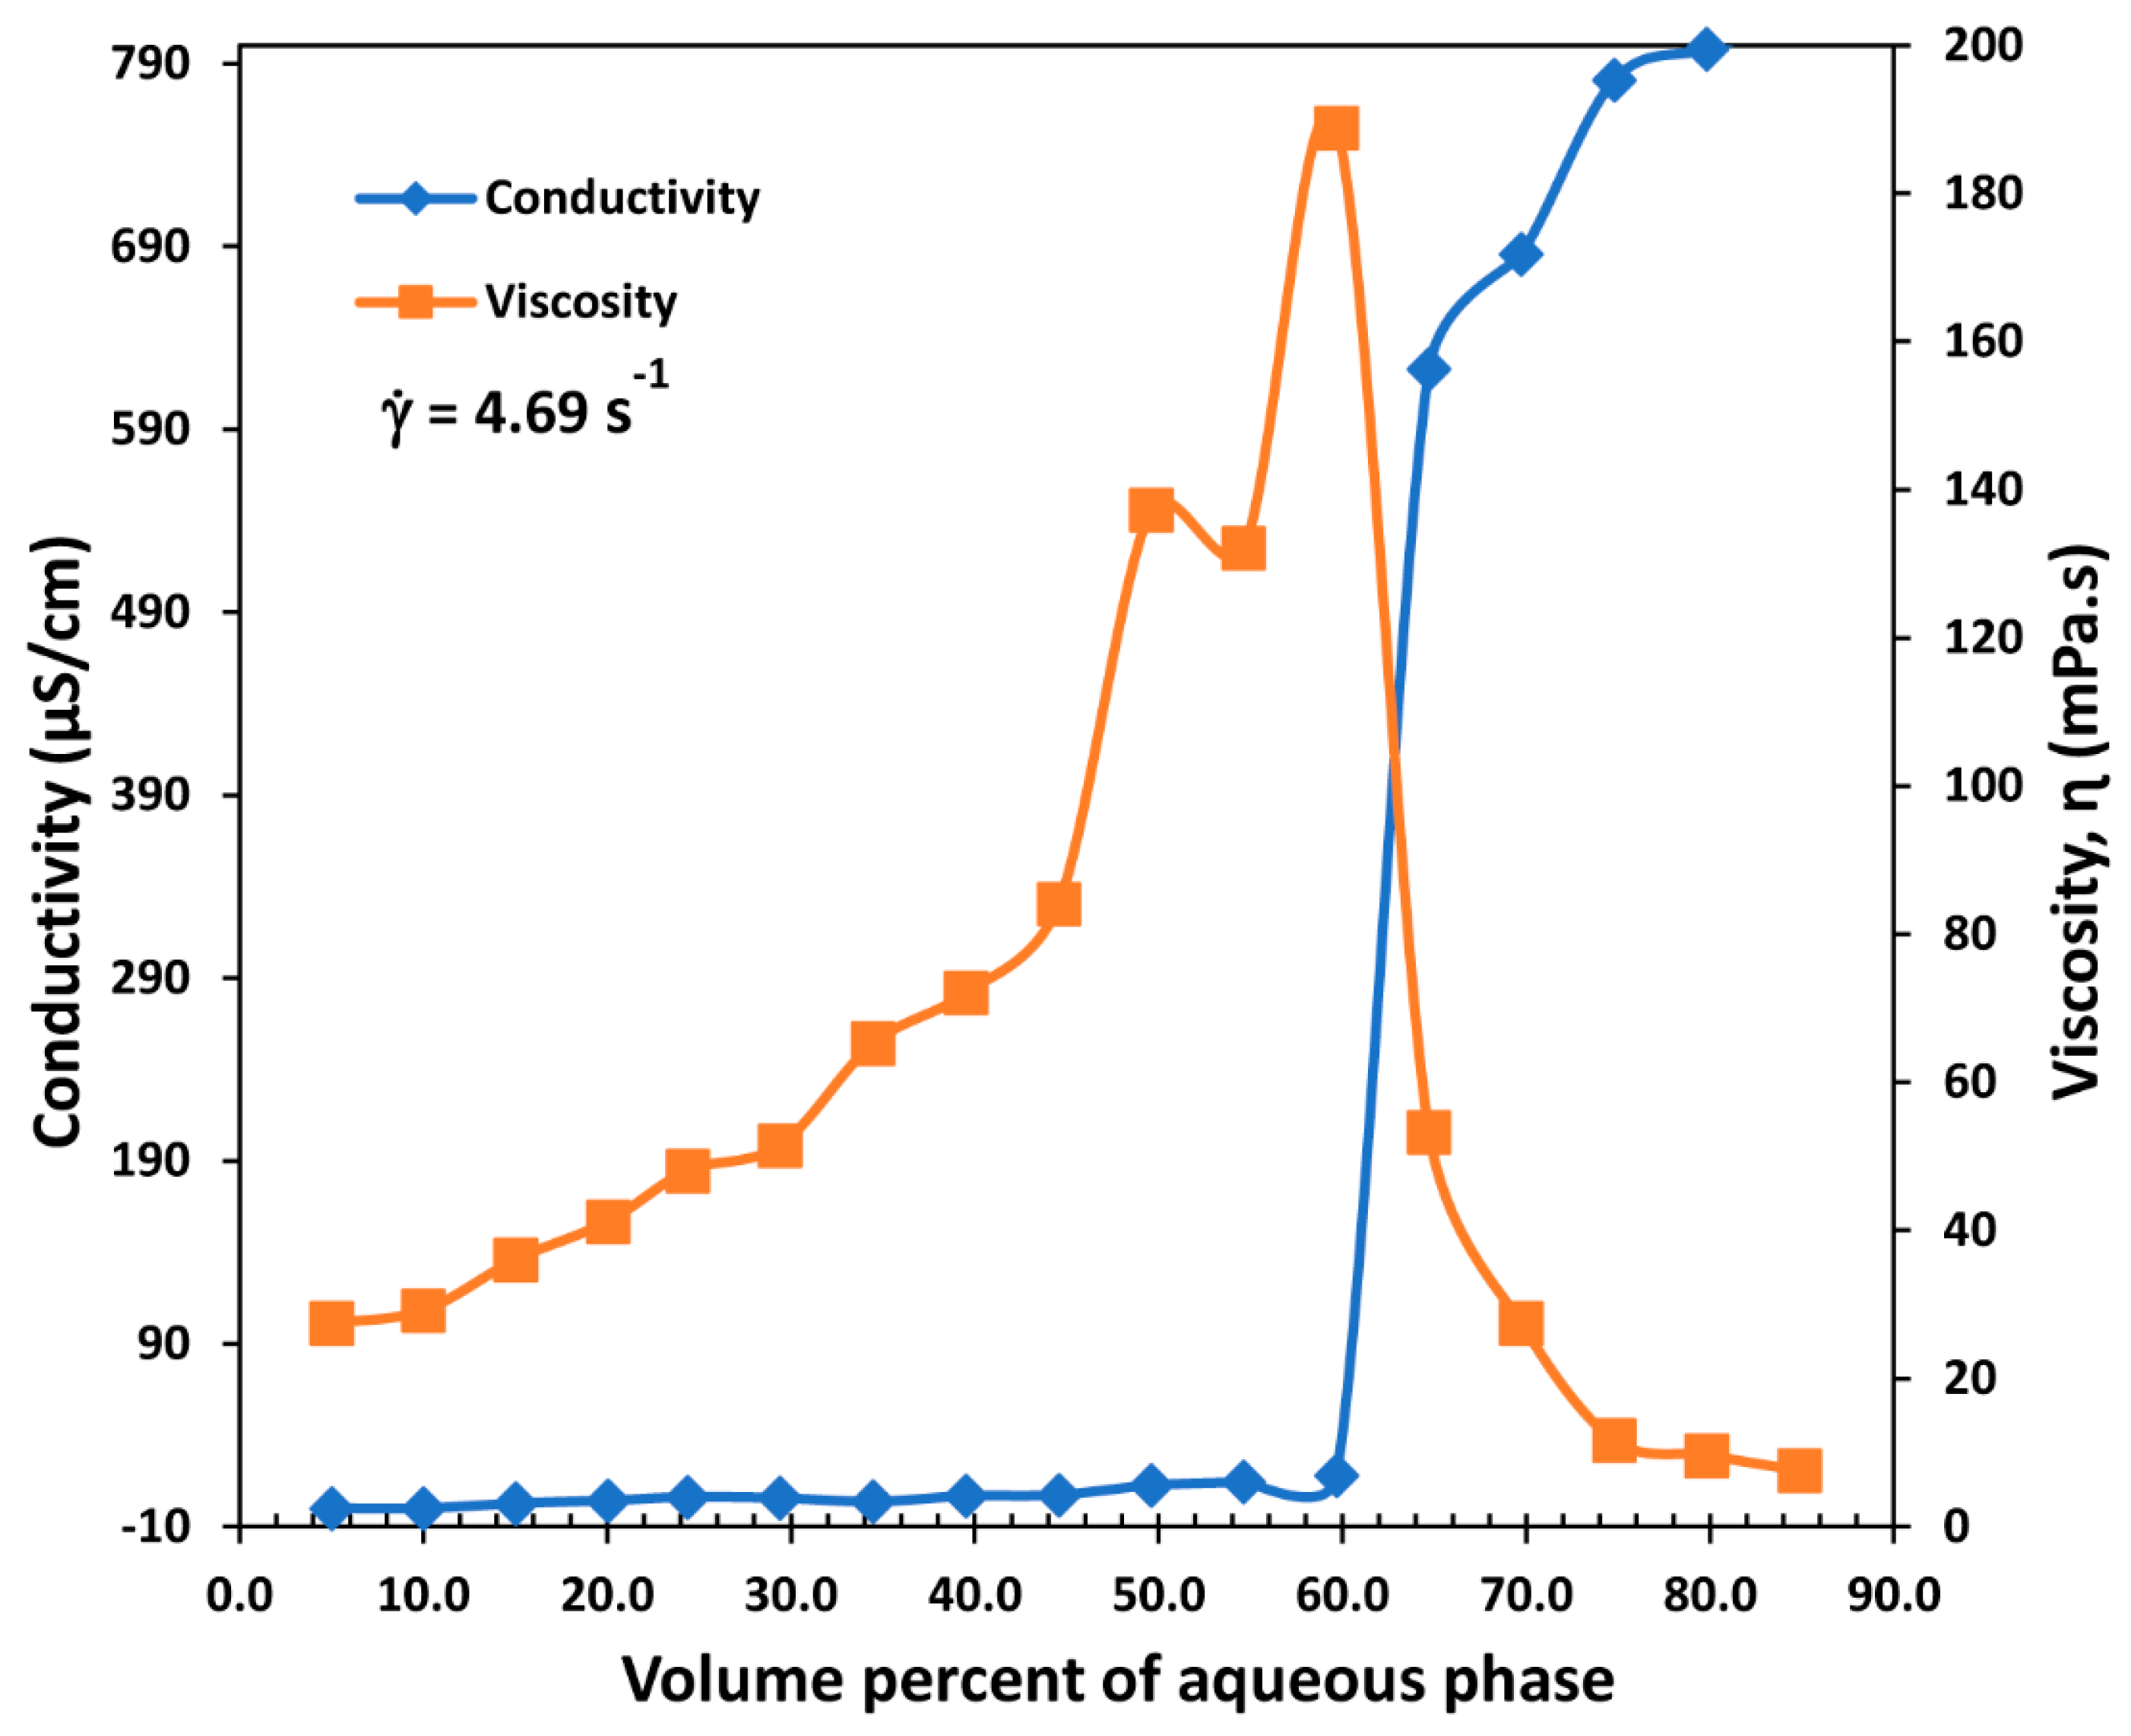
When the volume fraction of the dispersed phase of an emulsion is increased gradually under agitation conditions, a point is reached where the droplets come too close to each other. With further increase in the dispersed phase concentration, the emulsion becomes unstable and undergoes catastrophic phase inversion whereby the original dispersed phase now becomes the continuous phase and the original continuous phase becomes the new dispersed phase. The process of phase inversion of W/O emulsion to O/W type emulsion is illustrated in Figure 9. When water is added to the oil phase, a W/O emulsion is formed initially. Upon gradually increasing the water concentration of the emulsion, a point is reached where the emulsion becomes unstable and forms bi-continuous structure and with further increase in the water concentration, the emulsion becomes O/W type. The phase inversion point can be detected by monitoring the electrical conductivity of the emulsion. A sharp change in the conductivity is expected upon phase inversion.
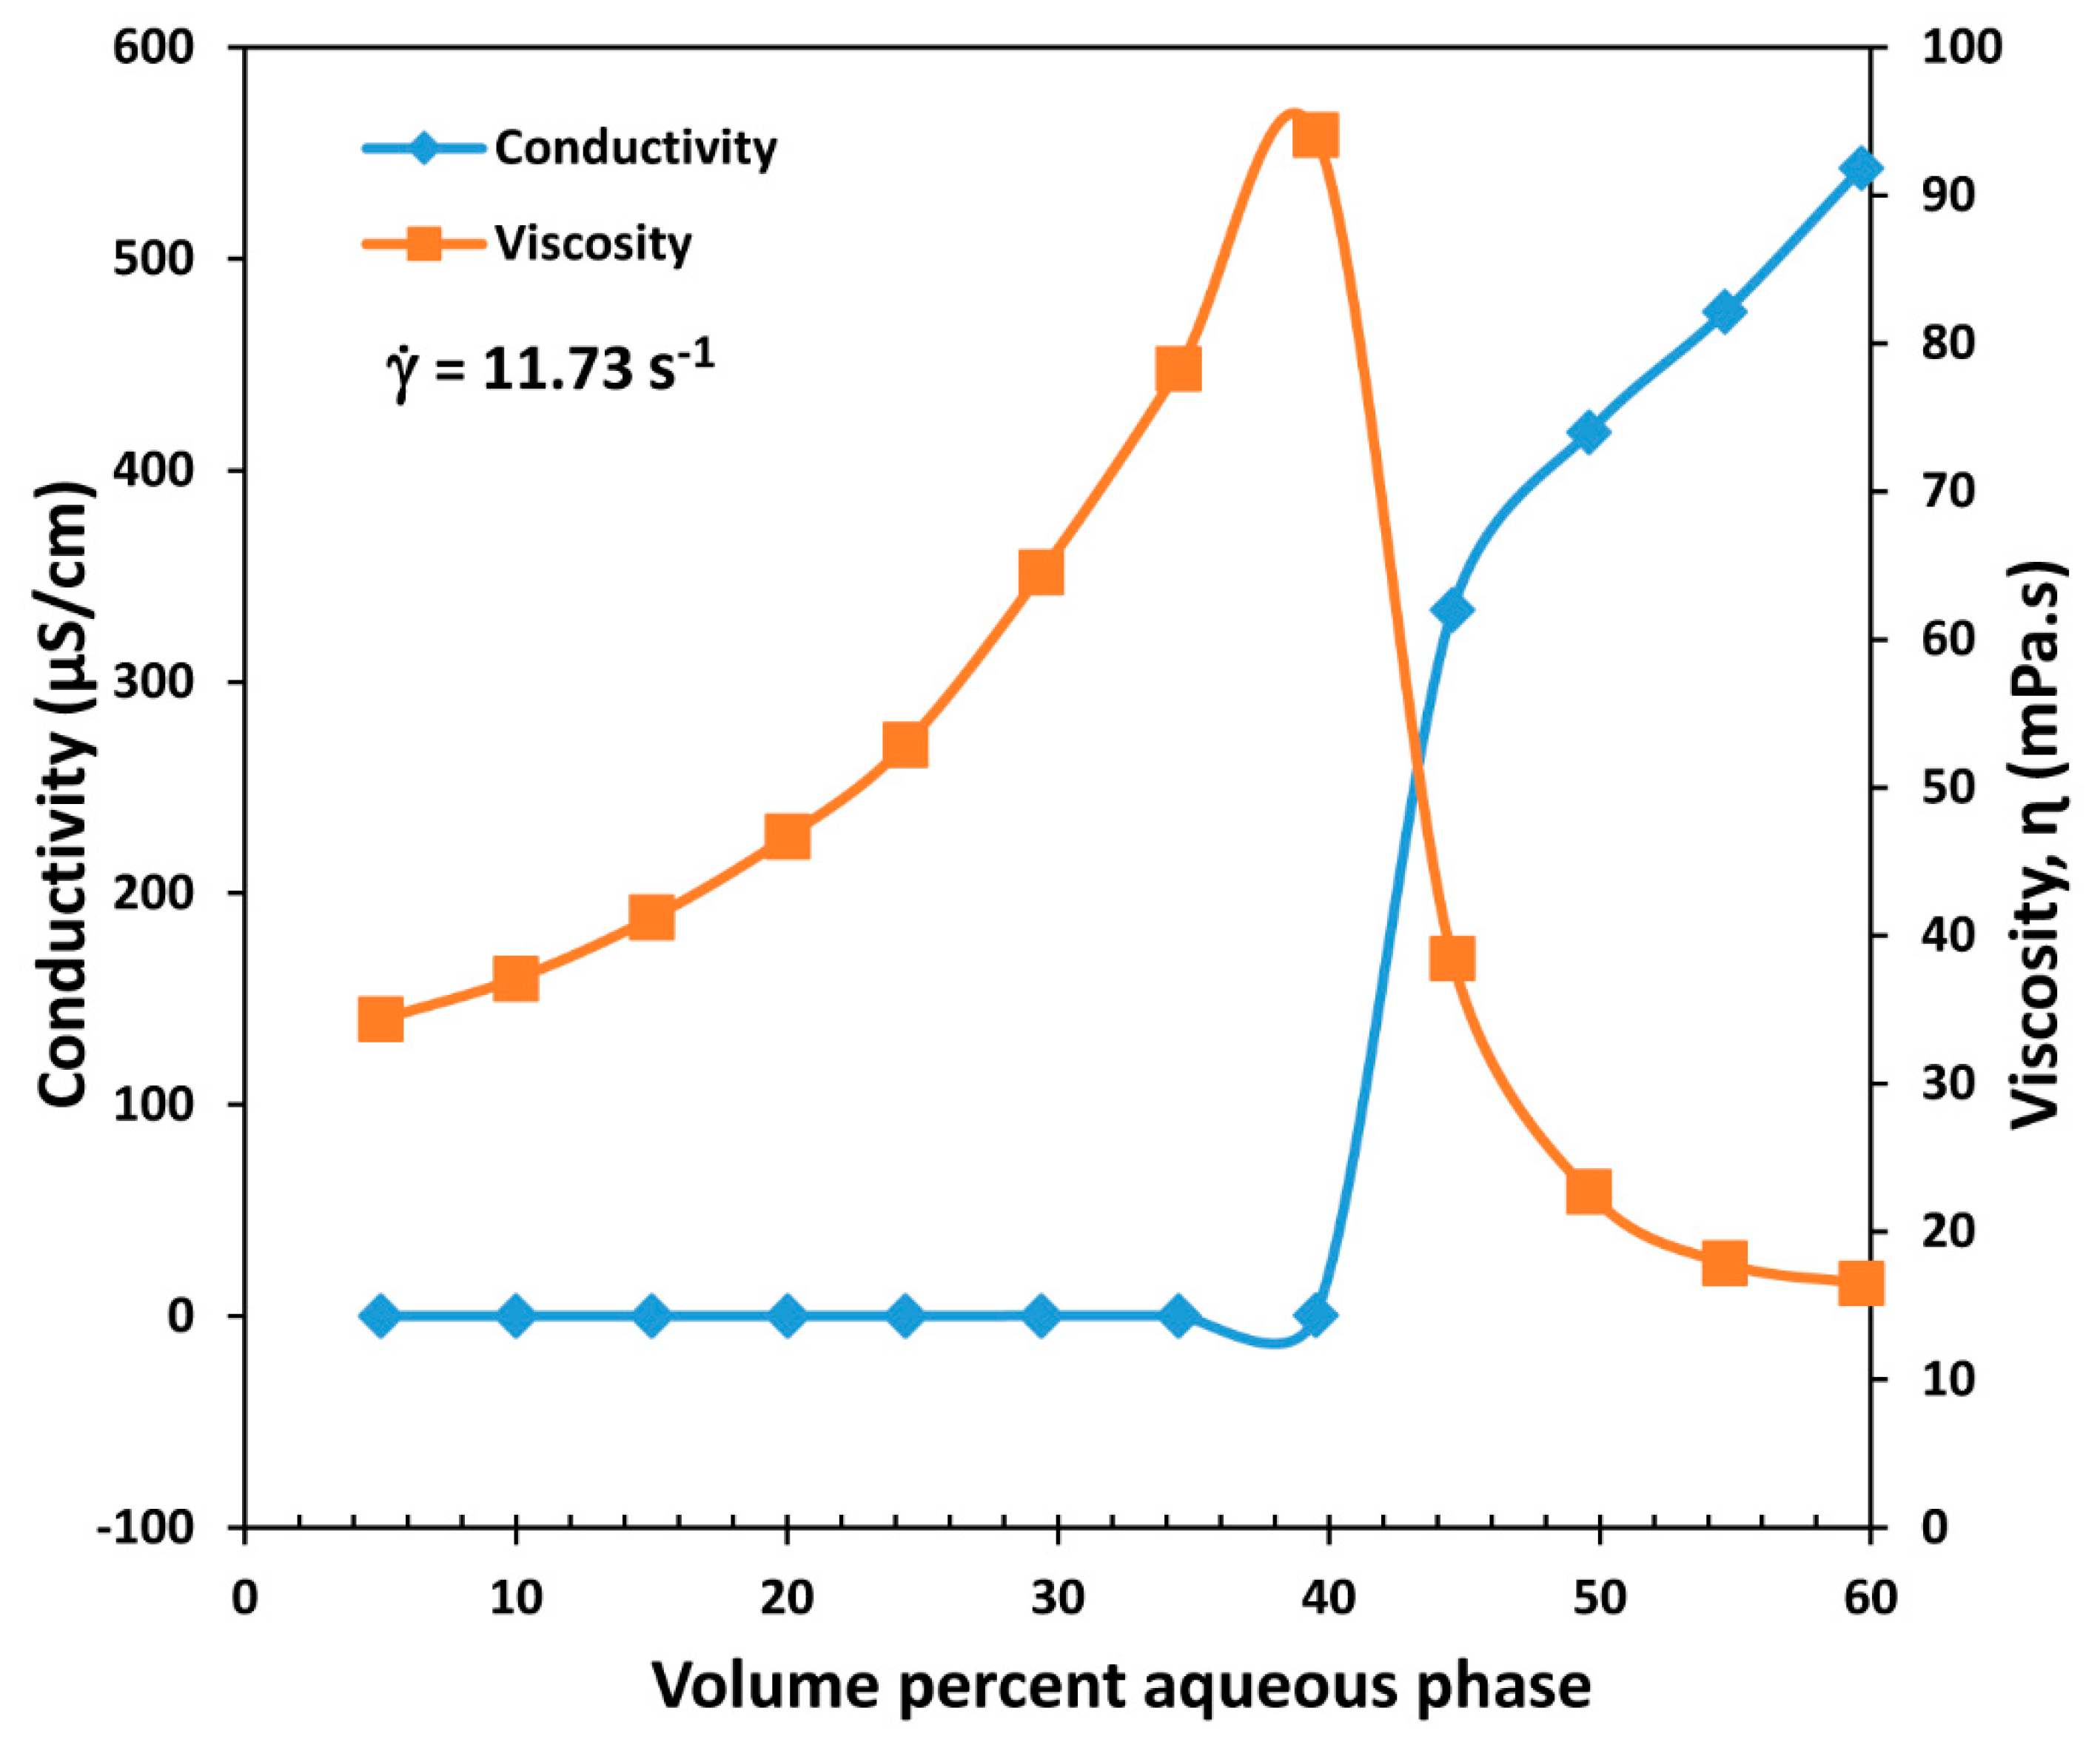
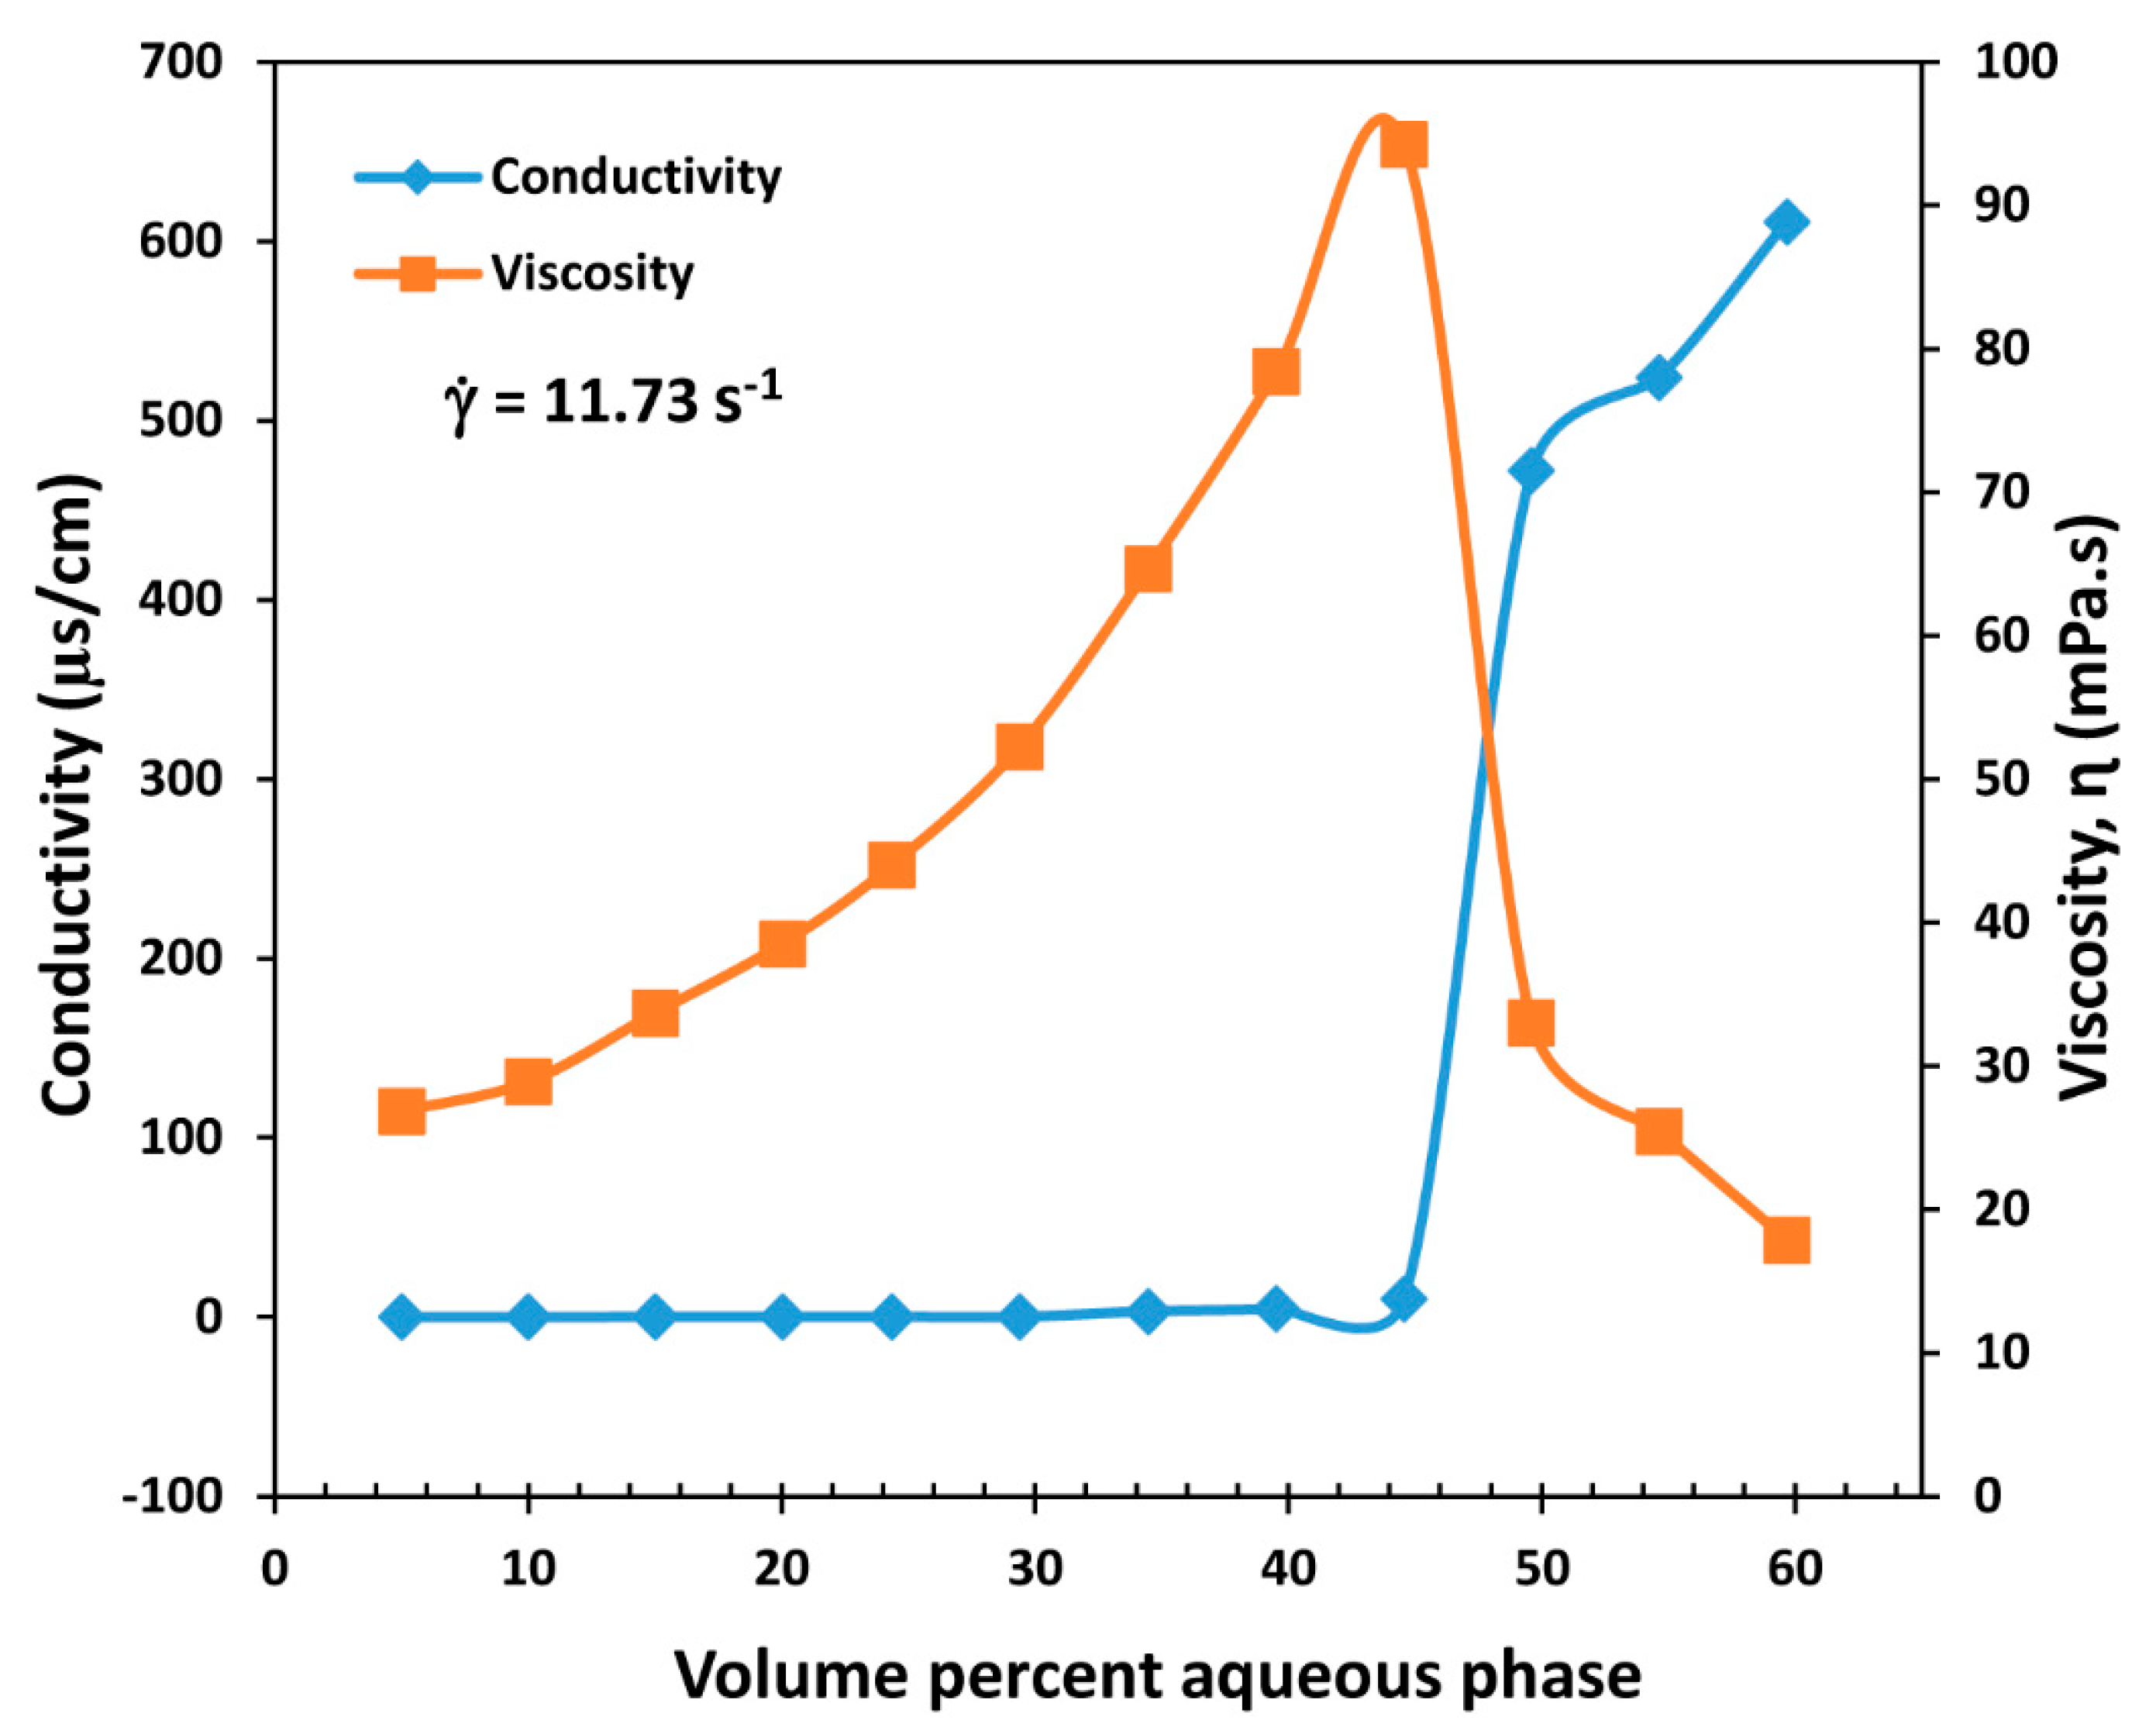
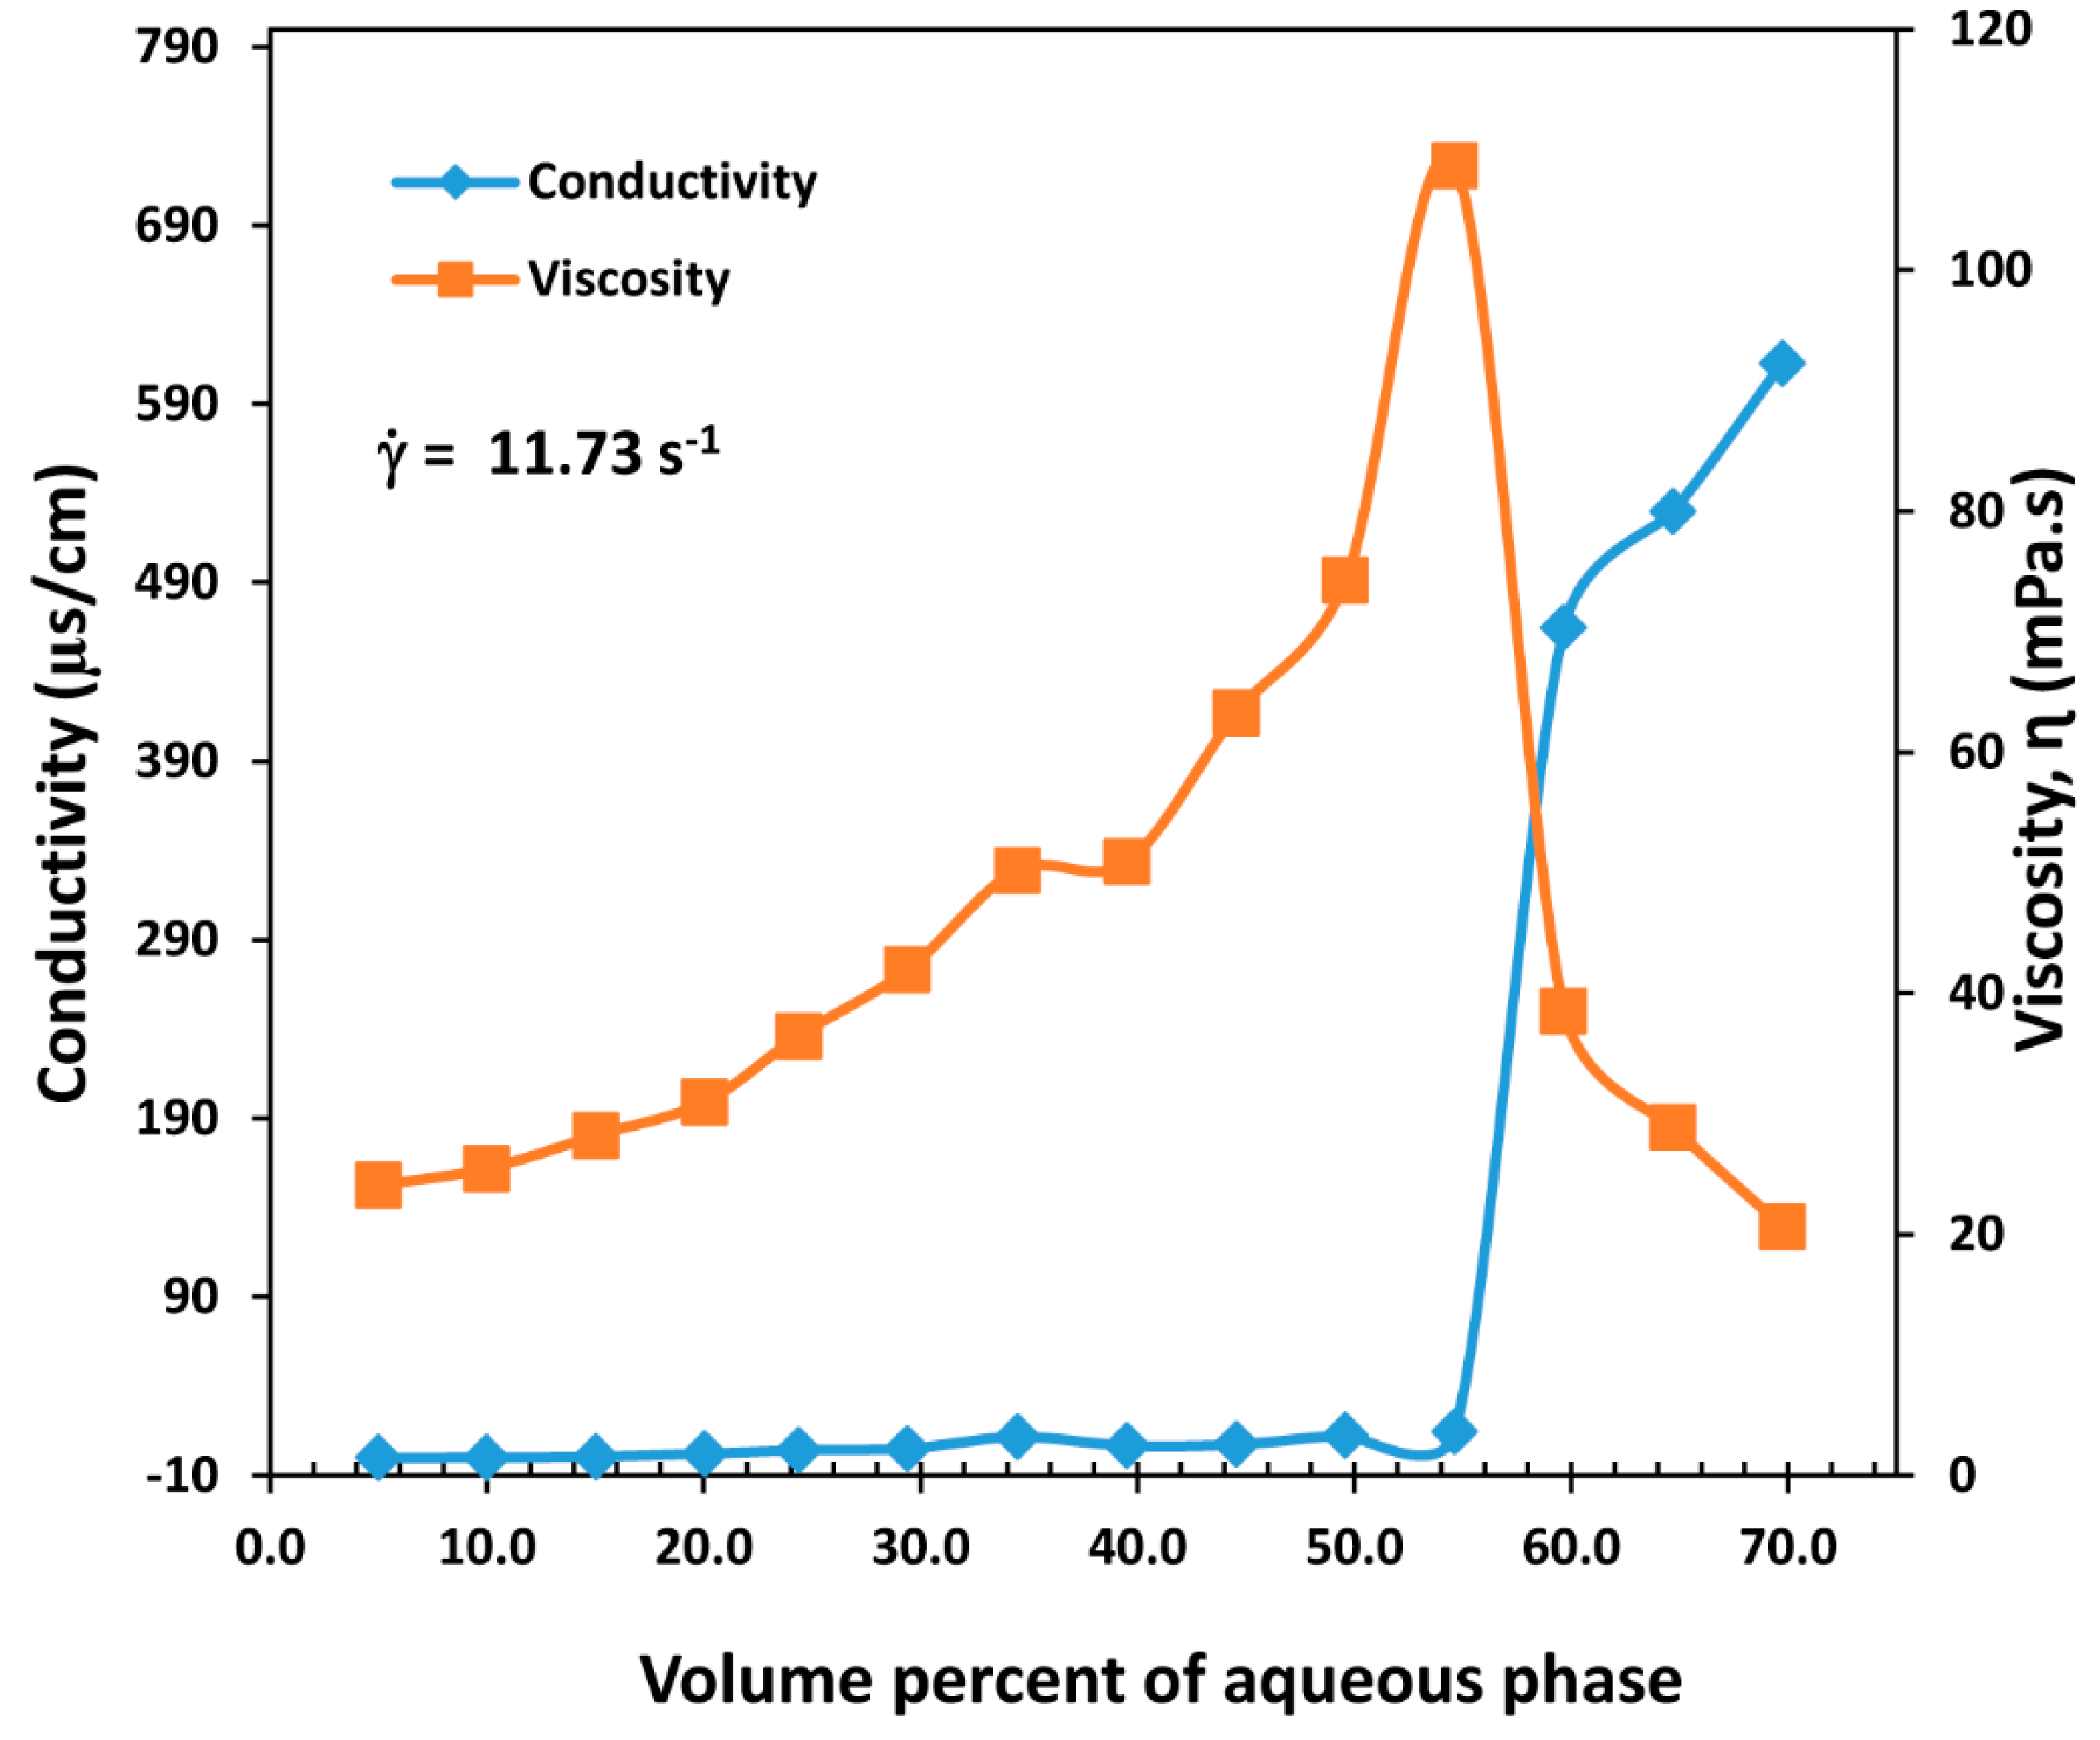
Figure 10, Figure 11, Figure 12 and Figure 13 show the plots of electrical conductivity and viscosity simultaneously for emulsions containing different concentrations of starch nanoparticles in the aqueous phase. In this study, the aqueous phase was added sequentially to the emulsion in increments of 5% by volume. As the aqueous phase content of the emulsion increased, the electrical conductivity remained nearly zero as the emulsion was W/O type with non-conductive oil as the continuous phase. However, the viscosity increased steadily with the increase in the dispersed-phase of the W/O type emulsion. With the continued addition of the aqueous phase, a point was reached where a sharp increase in the conductivity took place indicating inversion of W/O emulsion to O/W emulsion. As the continuous phase of the O/W emulsion was electrically conductive, phase inversion was accompanied by a sharp increase in the conductivity. Interestingly, phase inversion was simultaneously accompanied by a sharp drop in the emulsion viscosity. This is not unexpected as the continuous-phase of the inverted emulsion (O/W type) was much lower in viscosity as compared with the continuous-phase of the W/O emulsion. The oil viscosity was nearly 26 times that of water at room temperature. Also note that after phase inversion, the electrical conductivity of O/W emulsion continued to increase with the increase in water concentration due to an increase in the proportion of electrically conductive matrix phase (water) of the emulsion.
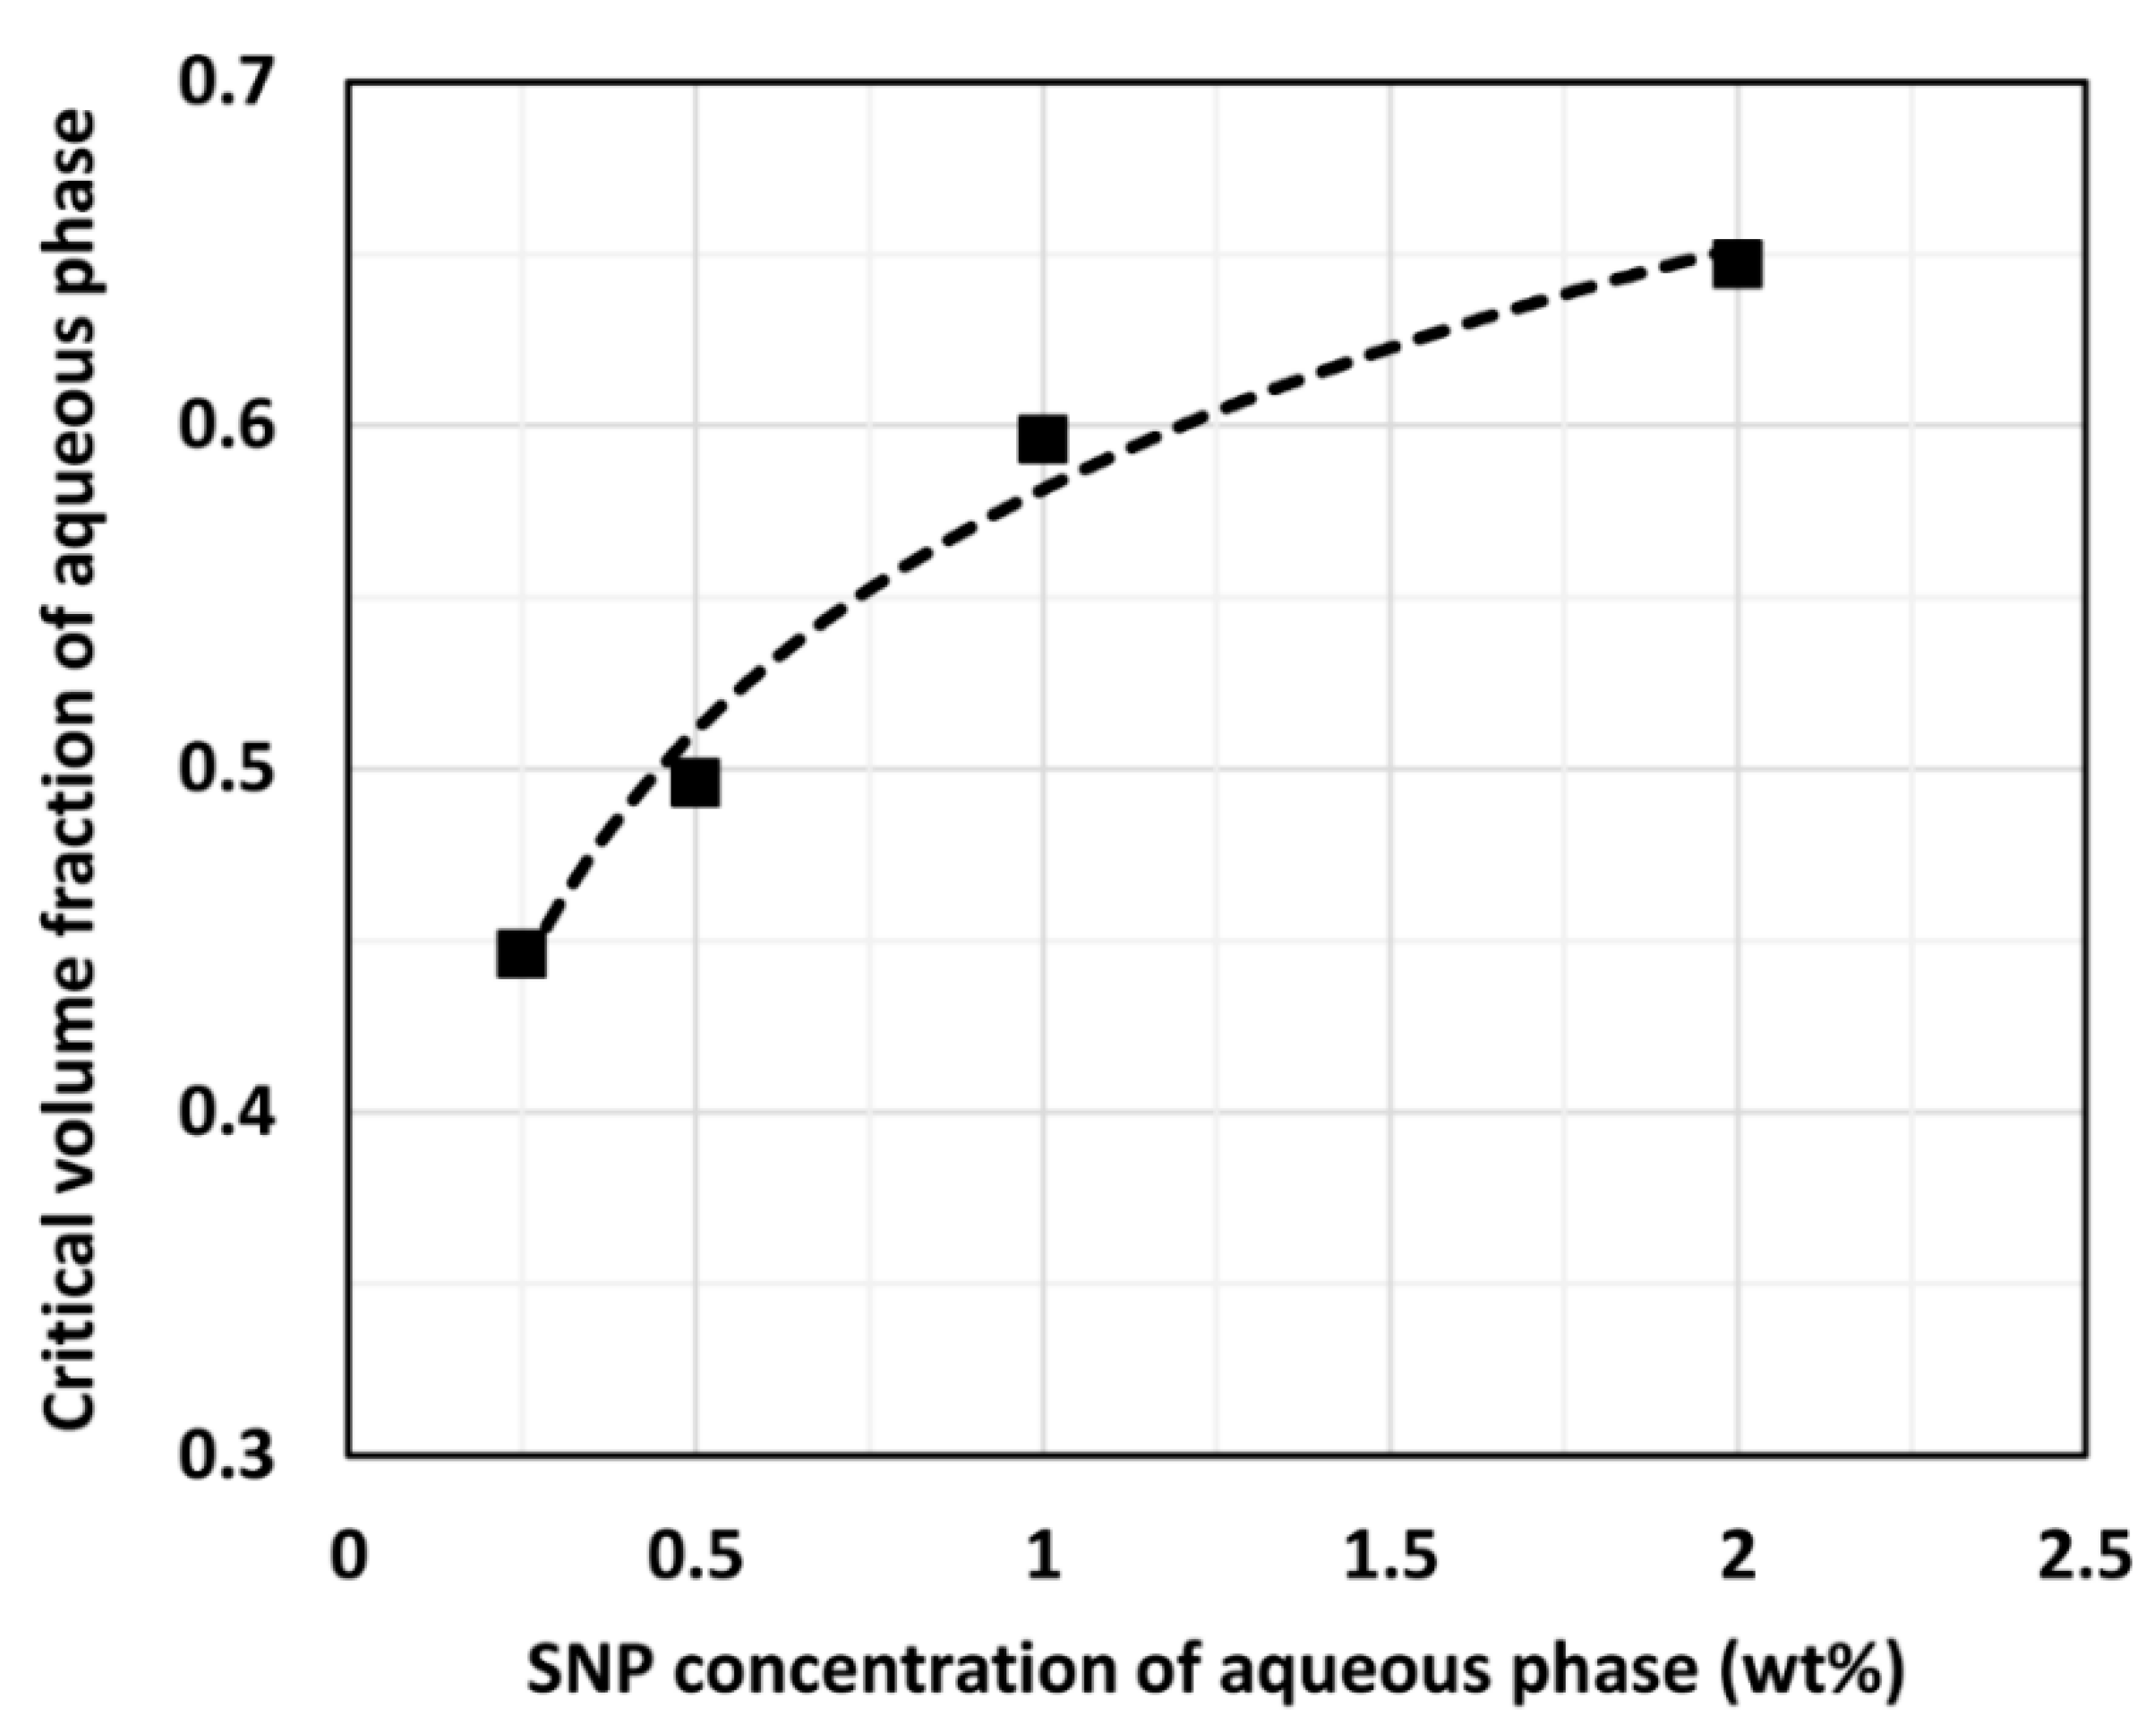
Figure 10, Figure 11, Figure 12 and Figure 13 further reveal that phase inversion of W/O to O/W emulsion was delayed to higher aqueous phase concentrations with the increase in SNP content of the aqueous phase. This can be seen more clearly in Figure 14 where the critical phase inversion concentration of aqueous phase is plotted as a function of the SNP concentration in the aqueous phase.
Thus the increase in SNP concentration of the aqueous phase improved the stability of W/O emulsion with respect to phase inversion. With the increase in the SNP concentration, it was likely that the amount of starch nanoparticles adsorbed at the water/oil interface increased resulting in an increase in the stability of W/O emulsion against coalescence and inversion. This observation is consistent with our earlier study [17] on catastrophic phase inversion of emulsions.
5. Conclusions
The incorporation of starch nanoparticles into the aqueous phase of emulsions assisted in the delay of catastrophic phase inversion of W/O emulsion to O/W emulsion. The starch nanoparticles imparted some stability to W/O emulsions against coalescence and phase inversion. This effect increased with the increase in the concentration of starch nanoparticles. The W/O emulsions prepared from aqueous phase containing starch nanoparticles behaved like Newtonian fluids at low concentrations of aqueous phase. At high concentrations of aqueous phase containing starch nanoparticles, the W/O emulsions exhibited shear-thickening effect. While the exact mechanism of shear-thickening observed in W/O emulsions is not clear, it could be due to shear-induced changes in the morphology of the emulsion. The rigidity of water droplets coated with starch nanoparticles could also be a factor in the observed shear thickening behavior of W/O emulsions. The O/W emulsions obtained upon catastrophic phase inversion of W/O emulsion to O/W emulsion generally exhibited shear-thinning behavior. Upon comparison of the experimental viscosity data for emulsions with the theoretical viscosity model of suspensions and emulsions, it was found that the data fell above the emulsion viscosity curve but below the suspension viscosity curve, that is, the droplets were neither completely fluidic nor completely rigid in nature. Thus, it is likely that the water droplet surfaces of W/O emulsions were only partially covered with the adsorbed starch nanoparticles.
Author Contributions
This project of in-situ measurement of the rheology and phase inversion of emulsions, with and without additives such as surface-active nanoparticles and surfactants, was conceived by R.P. The design and construction of the setup was done by both U.B. and R.P. The experimental work was carried out by U.B. The manuscript was written by R.P. All authors have read and agreed to the published version of the manuscript.
Funding
This research received no external funding.
Conflicts of Interest
The authors declare no conflict of interest.
References
- Pal, R. Rheology of Particulate Dispersions and Composites; CRC Press: Boca Raton, FL, USA, 2007. [Google Scholar]
- Becher, P. Emulsions: Theory and Practice; Krieger Publishing Co.: Malabar, FL, USA, 1977. [Google Scholar]
- Torrey, S. Emulsions and Emulsifier Applications—Recent Developments; Noyes Data Corporation: Park Ridge, NJ, USA, 1984. [Google Scholar]
- Lissant, K.J. Emulsions and Emulsion Technology; Marcel Dekker: New York, NY, USA, 1974. [Google Scholar]
- Friberg, S. Food Emulsions; Marcel Dekker: New York, NY, USA, 1976. [Google Scholar]
- Pal, R. Rheology of simple and multiple emulsions. Curr. Opin. Colloid Interface Sci. 2011, 16, 41–60. [Google Scholar] [CrossRef]
- Pal, R. Effect of droplet size on the rheology of emulsions. AIChE J. 1996, 42, 3181–3190. [Google Scholar] [CrossRef]
- Pal, R. Techniques for measuring the composition (oil and water content) of emulsions-a state of the art review. Colloids Surf. A Physicochem. Eng. Asp. 1994, 84, 141–193. [Google Scholar] [CrossRef]
- Yang, Y.; Fang, Z.; Chen, X.; Zhang, W.; Xie, Y.; Chen, Y.; Liu, Z.; Yuan, W. An overview of Pickering emulsions: Solid-particle materials, classification, morphology, and applications. Front. Pharmacol. 2017, 8, 1–20. [Google Scholar] [CrossRef] [PubMed] [Green Version]
- Berton-Carabin, C.C.; Schroen, K. Pickering emulsions for food applications: Background, trends, and challenges. Annu. Rev. Food Sci. Technol. 2015, 6, 263–297. [Google Scholar] [CrossRef] [PubMed]
- Chevalier, Y.; Bolzinger, M.A. Emulsions stabilized with solid nanoparticles: Pickering emulsions. Colloids Surf. A 2013, 439, 23–34. [Google Scholar] [CrossRef]
- Timgren, A.; Rayner, M.; Dejmek, P.; Marku, D.; Sjoo, M. Emulsion stabilizing capacity of intact starch granules modified by heat treatment or octenyl succinic anhydride. Food Sci. Nutr. 2013, 1, 157–171. [Google Scholar] [CrossRef] [PubMed]
- Zoppe, J.O.; Venditti, R.A.; Rojas, O.J. Pickering emulsions stabilized by cellulose nanocrystals grafted with thermos-responsive polymer brushes. J. Colloid Interface Sci. 2012, 369, 202–209. [Google Scholar] [CrossRef] [PubMed]
- Chen, X.; Song, X.; Huang, J.; Wu, C.; Ma, D.; Tian, M.; Jiang, H.; Huang, P. Phase behavior of Pickering emulsions stabilized by graphene oxide sheets and resins. Energy Fuels 2017, 31, 13439–13447. [Google Scholar] [CrossRef]
- Binks, B.P.; Fletcher, P.D.I.; Holt, B.L.; Beaussoubre, P. Phase inversion of particle-stabilized perfume oil-water emulsions: Experiment and theory. Phys. Chem. Chem. Phys. 2010, 12, 11954–11966. [Google Scholar] [CrossRef] [PubMed]
- Bains, U.; Pal, R. In-Situ Continuous Monitoring of the Viscosity of Surfactant-Stabilized and Nanoparticles-Stabilized Pickering Emulsions. Appl. Sci. 2019, 9, 4044. [Google Scholar] [CrossRef] [Green Version]
- Ogunlaja, S.B.; Pal, R.; Sarikhani, K. Effect of starch nanoparticles on phase inversion of Pickering emulsions. Can. J. Chem. Eng. 2018, 96, 1089–1097. [Google Scholar] [CrossRef]
- Pal, R. A simple model for the viscosity of Pickering emulsions. Fluids 2018, 3, 2. [Google Scholar] [CrossRef] [Green Version]
- Zhu, F. Starch based Pickering emulsion: Fabrication, properties, and applications. Trends Food Sci. Technol. 2019, 85, 129–137. [Google Scholar] [CrossRef]
- Kierulf, A.; Whaley, J.; Liu, W.; Enayati, M.; Tan, C.; Perez-Herrera, M.; You, Z.; Abbaspourrad, A. Protein content of amaranth and quinoa starch plays a key role in their ability as Pickering emulsifiers. Food Chem. 2020, 315, 126246. [Google Scholar] [CrossRef] [PubMed]
- Wolf, B.; Lam, S.; Kirkland, M.; Frith, W.J. Shear-thickening of an emulsion stabilized with hydrophilic silica particles. J. Rheol. 2007, 51, 465–478. [Google Scholar] [CrossRef]
- Pal, R. Novel viscosity equations for emulsions of two immiscible liquids. J. Rheol. 2001, 45, 509–520. [Google Scholar] [CrossRef]
- Perazzo, A.; Preziosi, V.; Guido, S. Phase inversion emulsification: Current understanding and applications. Adv. Colloid Interface Sci. 2015, 222, 581–599. [Google Scholar] [CrossRef] [PubMed]
Figure 1.
A schematic diagram of surfactant-stabilized and nanoparticle-stabilized oil droplets in an oil-in-water (O/W) emulsion (adapted from [16]).
Figure 1.
A schematic diagram of surfactant-stabilized and nanoparticle-stabilized oil droplets in an oil-in-water (O/W) emulsion (adapted from [16]).

Figure 2.
Schematic diagram and photograph of the experimental set-up for the in-situ measurement of the viscosity and conductivity of emulsions (adapted from [16]).
Figure 2.
Schematic diagram and photograph of the experimental set-up for the in-situ measurement of the viscosity and conductivity of emulsions (adapted from [16]).

Figure 3.
Enhanced UL adapter spindle assembly attached to the Brookfield LVT viscometer.

Figure 4.
Flow behavior of emulsions with SNP concentration of 0.25% wt. in the aqueous phase. The dashed lines are shown as a guide to the eye. The percent concentrations indicated on the figure are volume percent of aqueous phase.
Figure 4.
Flow behavior of emulsions with SNP concentration of 0.25% wt. in the aqueous phase. The dashed lines are shown as a guide to the eye. The percent concentrations indicated on the figure are volume percent of aqueous phase.

Figure 5.
Flow behavior of emulsions with SNP concentration of 0.50% wt. in the aqueous phase. The dashed lines are shown as a guide to the eye. The percent concentrations indicated on the figure are volume percent of aqueous phase.
Figure 5.
Flow behavior of emulsions with SNP concentration of 0.50% wt. in the aqueous phase. The dashed lines are shown as a guide to the eye. The percent concentrations indicated on the figure are volume percent of aqueous phase.

Figure 6.
Flow behavior of emulsions with SNP concentration of 1.0% wt. in the aqueous phase. The dashed lines are shown as a guide to the eye. The percent concentrations indicated on the figure are volume percent of aqueous phase.
Figure 6.
Flow behavior of emulsions with SNP concentration of 1.0% wt. in the aqueous phase. The dashed lines are shown as a guide to the eye. The percent concentrations indicated on the figure are volume percent of aqueous phase.

Figure 7.
Flow behavior of emulsions with SNP concentration of 2.0% wt. in the aqueous phase. The dashed lines are shown as a guide to the eye. The percent concentrations indicated on the figure are volume percent of aqueous phase.
Figure 7.
Flow behavior of emulsions with SNP concentration of 2.0% wt. in the aqueous phase. The dashed lines are shown as a guide to the eye. The percent concentrations indicated on the figure are volume percent of aqueous phase.

Figure 8.
Comparison of experimental viscosity versus volume fraction of water droplets data of W/O emulsions with model predictions.
Figure 8.
Comparison of experimental viscosity versus volume fraction of water droplets data of W/O emulsions with model predictions.

Figure 9.
Catastrophic phase inversion of W/O emulsion to O/W emulsion (adapted from [23]).
Figure 9.
Catastrophic phase inversion of W/O emulsion to O/W emulsion (adapted from [23]).

Figure 10.
Variations of electrical conductivity and viscosity of emulsion with the increase in aqueous-phase concentration. SNP concentration of aqueous phase is 0.25% wt.
Figure 10.
Variations of electrical conductivity and viscosity of emulsion with the increase in aqueous-phase concentration. SNP concentration of aqueous phase is 0.25% wt.

Figure 11.
Variations of electrical conductivity and viscosity of emulsion with the increase in aqueous-phase concentration. SNP concentration of aqueous phase is 0.50% wt.
Figure 11.
Variations of electrical conductivity and viscosity of emulsion with the increase in aqueous-phase concentration. SNP concentration of aqueous phase is 0.50% wt.

Figure 12.
Variations of electrical conductivity and viscosity of emulsion with the increase in aqueous-phase concentration. SNP concentration of aqueous phase is 1% wt.
Figure 12.
Variations of electrical conductivity and viscosity of emulsion with the increase in aqueous-phase concentration. SNP concentration of aqueous phase is 1% wt.

Figure 13.
Variations of electrical conductivity and viscosity of emulsion with the increase in aqueous-phase concentration. SNP concentration of aqueous phase is 2% wt.
Figure 13.
Variations of electrical conductivity and viscosity of emulsion with the increase in aqueous-phase concentration. SNP concentration of aqueous phase is 2% wt.

Figure 14.
Effect of SNP concentration of aqueous phase on the critical volume fraction of aqueous phase where phase inversion of W/O to O/W emulsion takes place.
Figure 14.
Effect of SNP concentration of aqueous phase on the critical volume fraction of aqueous phase where phase inversion of W/O to O/W emulsion takes place.

Publisher’s Note: MDPI stays neutral with regard to jurisdictional claims in published maps and institutional affiliations. |
© 2020 by the authors. Licensee MDPI, Basel, Switzerland. This article is an open access article distributed under the terms and conditions of the Creative Commons Attribution (CC BY) license (http://creativecommons.org/licenses/by/4.0/).
Share and Cite
MDPI and ACS Style
Bains, U.; Pal, R. Rheology and Catastrophic Phase Inversion of Emulsions in the Presence of Starch Nanoparticles. ChemEngineering 2020, 4, 57. https://0-doi-org.brum.beds.ac.uk/10.3390/chemengineering4040057
AMA Style
Bains U, Pal R. Rheology and Catastrophic Phase Inversion of Emulsions in the Presence of Starch Nanoparticles. ChemEngineering. 2020; 4(4):57. https://0-doi-org.brum.beds.ac.uk/10.3390/chemengineering4040057
Chicago/Turabian StyleBains, Upinder, and Rajinder Pal. 2020. "Rheology and Catastrophic Phase Inversion of Emulsions in the Presence of Starch Nanoparticles" ChemEngineering 4, no. 4: 57. https://0-doi-org.brum.beds.ac.uk/10.3390/chemengineering4040057