Article

QSAR Modelling of Peptidomimetic Derivatives towards HKU4-CoV 3CLpro Inhibitors against MERS-CoV

1
Laboratory of Physical Chemistry of Materials, Faculty of Sciences Ben M’Sik, Hassan II University of Casablanca, Casablanca P.O. Box 7955, Morocco
2
Laboratory of Physical Chemistry, Faculty of Sciences of Tetouan, University Abdelmalek Essaadi, Tetouan P.O. Box 2117, Morocco
3
Laboratory of Bioorganic Chemistry, Department of Chemistry, Faculty of Sciences, Chouaïb Doukkali University, P.O. Box 24, El Jadida M-24000, Morocco
4
Group of Computational and Medicinal Chemistry, LMCE Laboratory, University of Biskra, Biskra 7000, Algeria
5
Centre de Recherche en Sciences Pharmaceutiques (CRSP), La Nouvelle Ville Ali Mendjeli, Constantine 25000, Algeria
*
Author to whom correspondence should be addressed.
Submission received: 22 December 2020 / Revised: 3 March 2021 / Accepted: 5 March 2021 / Published: 9 March 2021
(This article belongs to the Special Issue QSAR and QSPR: Recent Developments and Applications 2021)

Abstract

:
In this paper, we report the relationship between the anti-MERS-CoV activities of the HKU4 derived peptides for some peptidomimetic compounds and various descriptors using the quantitative structure activity relationships (QSAR) methods. The used descriptors were computed using ChemSketch, Marvin Sketch and ChemOffice software. The principal components analysis (PCA) and the multiple linear regression (MLR) methods were used to propose a model with reliable predictive capacity. The original data set of 41 peptidomimetic derivatives was randomly divided into training and test sets of 34 and 7 compounds, respectively. The predictive ability of the best MLR model was assessed by determination coefficient R2 = 0.691, cross-validation parameter Q2cv = 0.528 and the external validation parameter R2test = 0.794.

1. Introduction

Middle East Respiratory Syndrome (MERS) is a respiratory infection disease that emerged in Saudi Arabia in 2012 [1,2]. In addition to Saudi Arabia, Egypt, Oman and Qatar were affected by this outbreak, with a high percentage of cases (>85%) [3,4,5]. The outbreak continued its spread until 2015 to affect 27 countries in Asia. Among these countries, South Korea was the most affected with 186 confirmed cases including 38 deaths. Approximately 35% of patients with MERS have died, but this may be an overestimate of the true mortality rate [6]. MERS-CoV is a zoonotic virus, which was transmitted from animals to human reservoirs [7,8]. The virus appears to cause more severe disease in older people, people with weakened immune systems, and those with chronic diseases such as renal disease, cancer, chronic lung disease and diabetes. In 2019, 203 new cases of MERS-CoV were reported. So far, neither vaccine nor effective treatment is available for this disease. Several efforts have been made by researchers throughout the world to develop an effective therapy against MERS-CoV infection. Many previous studies have shown that the MERS-CoV possesses a single-stranded positive-sense RNA genome with 2 open reading frames (ORFs) and encodes two polyprotein precursors [9,10,11,12] which are cleaved by 3CLPro and a papain-like cysteine protease (PLPro) to generate 16 nonstructural proteins (NSP1−16) [13,14,15,16]. Thus, it represents a potential target for antiviral drug development. Nowadays, very few data are available on MERS-CoV 3CLpro inhibition by active molecules. Furthermore, HKU4-CoV 3CLpro shares a high sequence identity (81%) with the MERS-CoV enzyme and thus represents a potential surrogate model for anti-MERS drug discovery [17].
A quantitative structure−activity relationship approach attempts to explore the relationship between molecular descriptors that describe the unique physicochemical properties of the studied compounds and their respective biological activity [18]. It encodes the chemical structure through a variety of molecular descriptors, such as constitutional, topological, thermodynamic, electronic, geometrical. The development of new cheminformatics software allows the calculation of a thousand molecular descriptors [19].
This study aims to build QSAR models, which explain the relationship between anti-MERS-CoV activity and the structure of 41 peptidomimetic based on physicochemical descriptors using statistical methods. Multiple linear regression (MLR) was used for numerical characterization of the compounds based on the selected descriptors by PCA. The quality of the developed QSAR model was checked using statistical parameters and several validation methods.

2. Material and Methods

2.1. Data Set

A series of 41 peptidomimetic derivatives was studied for their anti-HKU4 activity [13]. Table 1 presents the structure and the activity values for these compounds (pIC50 = −log (IC50)). The compounds of this series were drawn using the ChemDraw, available in ChemOffice software, as shown in Table 1, and the descriptors were calculated using ChemSketch, ChemOffice and Marvin Sketch software. The studied compounds were randomly divided into a training set used to build QSAR models and a test set used to evaluate the predictive power of models, consisting of 34 and 7 compounds, respectively.
In QSAR studies, it is recommended that the dataset is divided into several training and test sets (5:1 ratio) [20]. In the present study, QSAR models have been built following the OECD principles for acceptable QSAR models. This approach led to the generation of QSAR models possessing excellent statistical performance. Therefore, the whole dataset was randomly split into training and test sets by a good number of MLR models with the same size of training and test sets. Of the chemicals in the dataset, 35 compounds were selected for the training set used to build QSAR models and the remaining (7 compounds) were considered as the test set used to evaluate the predictive power of the models [21,22].
ChemSketch software was used to calculate formula weight (FW), percentage of carbon, hydrogen, nitrogen, oxygen and sulfur atoms (% C, % H, % N, % O and % S), molar volume (MV (cm3)), parachor (Pa (cm3)), refractive index (RI), surface tension (ST (dyne/cm)), density (D (g/cm3)), polarizability (Po (cm3)), ring double bond equivalents (RDBE), and nominal mass (NM (Da)) (Table S1).
MarvinSketch and ChemOffice have been used to build-in structure to calculate the following descriptors: partition coefficient octanol-water (Log P), hydrophilic-lipophilic balance (HLB kcal/mol)), MMFF94 energy (ME (kcal/mol)), polar surface area (PSA), Van Der Waals surface area (VDWSA), Van Der Waals volume (VDWV), refractivity (R), number of H-bond acceptors (NHA), number of H-bond donors (NHD), molar refractivity (MR), partition coefficient (PC), topological diameter (TD), winner index (WI), Balaban index (BI), molecular topological index (MTI), number of rotator band (NRB), and number of oxygen atoms (NO) (Tables S2 and S3).

2.2. Statistical Analysis

In this study, XLSTAT [23] was used to accomplish both principal component analysis (PCA) and multiple linear regression (MLR). The method allows us to reduce the number of descriptors and keeps only those that are closely related to the activity. It also relies on studying the correlation matrix by removing those involving a large correlation. The MLR was initiated, with the aim to establish a mathematical relationship between inhibitory activity and a set of molecular descriptors. In other words, these two statistical methods depend on the assumption that there is a relationship that combines both the dependent variable (activity) and a series of independent variables (descriptors).

2.3. Validation of the QSAR Model

The predictive power of the built QSAR models was checked using internal and external validations.
We have used the leave-one-out (LOO) cross-validation for the internal validation. The cross validation parameter Q2cv was calculated. However, several previous studies have suggested that the only way to estimate the true predictive power of a QSAR model is to compare the predicted and observed activities for an external test set of compounds that were not used in the model’s development [24,25,26,27,28,29]. The quality of the QSAR model is mostly determined by its ability to make predictions for things not included in the training set. The external validation parameter R2test was calculated.
The y-randomization test was used to validate the developed QSAR models, whereby the performance of the original model in data description (R2) was compared to that of the built models. In other words, in this test, the random MLR models were generated by randomly shuffling the dependent variable while keeping the independent variables as they were. The newly established QSAR models were expected to have significantly low R2 and Q2 values for several trials, which confirmed that the developed QSAR models were robust. Another parameter, CRp2 was also calculated which should be more than 0.5 [24].

3. Results and Discussion

3.1. Principal Components Analysis (PCA)

Thirty descriptors were calculated using ChemSketch, MarvinSketch and ChemOffice software (Tables S1–S3). The correlation matrix obtained by the ACP was analyzed to extract important information from a multivariate spreadsheet and to express this information as a set of a few new variables called the main components. Therefore, PCA was a very important stage for reducing descriptors while ensuring a minimum level of information loss.
The descriptors that remained after the PCA for the rest of this study were: % C, % H, % N, % O, % S, RI, ST, D, RDBE, Log P, HLB, PSA, R, NHA, NHD, MR, PC, VDWSA, VDWV, BI, NRB, TD and NO.

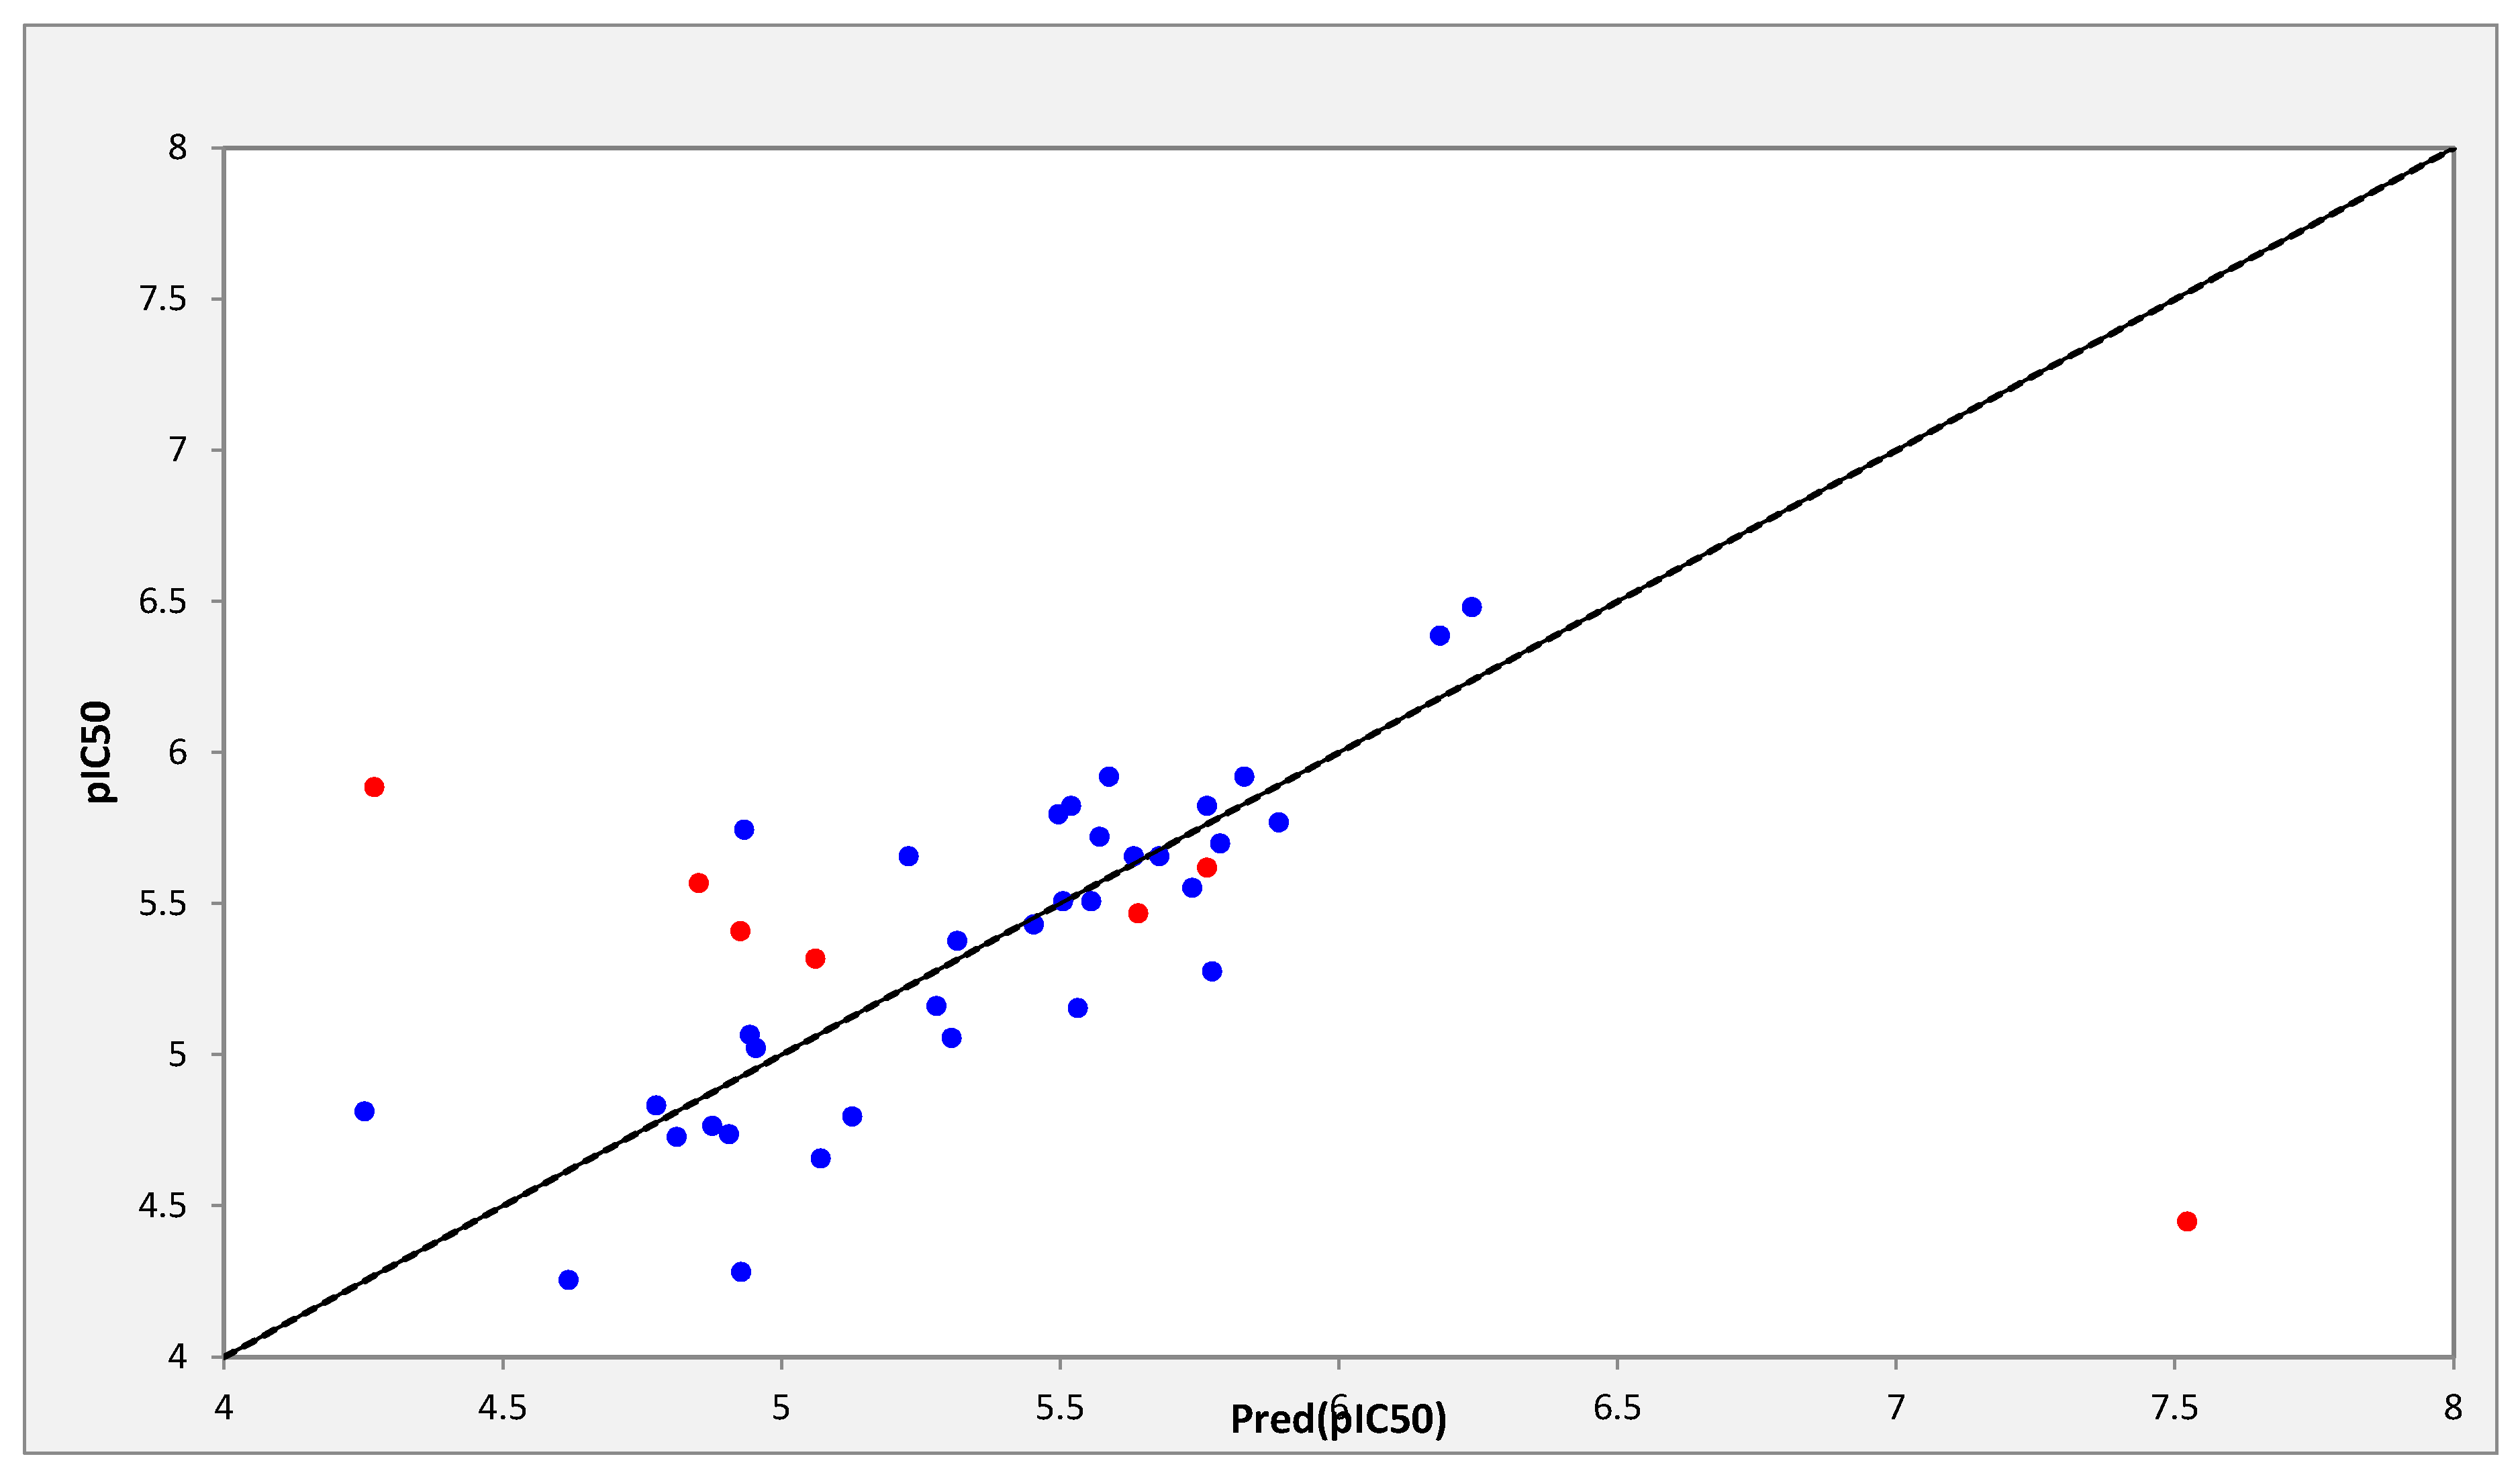
3.2. Multiple Linear Regression (MLR)

Those descriptors remaining after PCA were used as an input for establishing MLR models. The best model obtained using MLR with the best statistical keys is represented by the following equation:
pIC50 = 1.017 + 0.699 O% + 0.364 PC + 0.065 VDWV − 0.037 VDWSA − 2.158 NO
R2 = 0.691; R2test = 0.794; R2adj = 0.636; MSE = 0.108; RMSE = 0.328; F = 12.549; Pr < 0.0001.
where R2 is the coefficient of determination; R2test is the coefficient of determination of the external test; R2adj is the adjusted coefficient of determination; MSE is the means of the square errors of the model; RMSE is root mean square error, F the coefficient of Fischer (Fisher statistics F) and P-value is the significance level.
From the model found we deduce that the activity depends on the following descriptors: PC, VDWV, VDWSA, NO and O%.
The high values obtained for the coefficient of determination, the coefficient of determination of the external test and the adjusted coefficient of determination, which exceeded 0.6, as well as the low value of mean squared errors and root mean square error, confirmed that the established model had reliable predictive power.
On the other hand, the Fisher test associated with the p-value indicates that we would take less than 0.01% of the risk assuming the null hypothesis was false and the regression equation was statistically significant.
The correlations between the predicted and observed activities are represented in Table 2 and illustrated in Figure 1.

3.3. Y-Randomization

The y-randomization test was applied to verify the validity and robustness of the built model. The obtained outcomes (Table 3) confirmed that the model was not obtained by chance.
Based on all these results obtained by MLR, we can conclude that the built model has a good predictive power.

4. Conclusions

In this study, we have used thirty predefined descriptors for 41 peptidomimetic derivatives using ChemSketch, MarvinSketch and ChemOffice software. These descriptors are subjected to a statistical study using PCA analysis. In fact, the PCA was used to analyze and visualize the dataset, as well as to group the data into principal components. A linear model that combined five descriptors was found using the MLR method to predict the pIC50 activity. The proposed QSAR model by the MLR in this study was statistically significant and has sufficient capacity to predict the anti-MERS-CoV activity.

Supplementary Materials

The following are available online at https://0-www-mdpi-com.brum.beds.ac.uk/2624-8549/3/1/29/s1, Table S1: Chemical descriptors calculated by ChemSketch, Table S2: Chemical descriptors calculated by Marvin Sketch, Table S3: Chemical descriptors calculated by ChemOffice.

Author Contributions

Conceptualization, S.M. and I.H.; methodology, S.C.; software, S.C.; validation, S.C., S.B. and M.B.; formal analysis, S.C., S.B. and M.B.; investigation, S.C.; resources, S.C.; data curation, S.C.; writing—original draft preparation, S.M. and I.H.; writing—review and editing, S.C., S.B. and M.B.; visualization, S.C., S.B. and M.B.; supervision, S.C., S.B. and M.B.; project administration, S.C.; funding acquisition, S.C. All authors have read and agreed to the published version of the manuscript.

Funding

The authors are thankful to the “Agence Universitaire de la Francophone (AUF)” for financial support under the project AUF- 463/2020.

Institutional Review Board Statement

Not applicable.

Informed Consent Statement

Not applicable.

Data Availability Statement

The data presented in this study are available in Supplementary Materials.

Conflicts of Interest

The authors declare that there is no conflict of interest.

References

  1. Memish, Z.A.; Zumla, A.I.; Al-Hakeem, R.F.; AlRabeeah, A.A.; Stephens, G.M. Family cluster of Middle East respiratory syndrome coronavirus infections. N. Engl. J. Med. 2013, 368, 2487–2494. [Google Scholar] [CrossRef]
  2. Zaki, A.M.; Boheemen, S.V.; Bestebroer, T.M.; Osterhaus, A.D.; Fouchier, R.A. Isolation of a novel coronavirus from a man with pneumonia in Saudi Arabia. N. Engl. J. Med. 2012, 367, 1814–1820. [Google Scholar] [CrossRef] [PubMed]
  3. Bermingham, A.; Chand, M.A.; Brown, C.S.; Aarons, E.; Tong, C.; Langrish, C.; Hoschler, K.; Brown, K.; Galiano, M.; Myers, R.; et al. Severe respiratory illness caused by a novel coronavirus, in a patient transferred to the United Kingdom from the Middle East, September 2012. Euro. Surveill 2012, 17, 20290. [Google Scholar] [PubMed]
  4. Sridhar, S.; Brouqui, P.; Parola, P.; Gautret, P. Imported cases of Middle East respiratory syndrome: An update. Travel Med. Infect Dis. 2015, 13, 106–109. [Google Scholar] [CrossRef] [PubMed]
  5. Bialek, R.; Allen, D.; Alvarado-Ramy, F.; Arthur, R.; Balajee, A.; Bell, D.; Best, S.; Blackmore, C.; Breakwell, L.; Cannons, A.; et al. First confirmed cases of Middle East respiratory syndrome coronavirus (MERS-CoV) infection in the United States, updated information on the epidemiology of MERS-CoV infection, and guidance for the public, clinicians, and public health authorities—May 2014. MMWR. Morb. Mortal. Wkly. Rep. 2014, 63, 431–436. [Google Scholar]
  6. World Health Organization WHO. Middle East Respiratory Syndrome Coronavirus (MERS-CoV). 2019. Available online: https://www.who.int/health-topics/middle-east-respiratory-syndrome-coronavirus-merscom (accessed on 9 March 2021).
  7. Haagmans, B.L.; Al Dhahiry, S.H.S.; Reusken, C.B.E.M.; Raj, V.S.; Galiano, M.; Myers, R.; Godeke, G.J.; Jonges, M.; Farag, E.; Diab, A.; et al. Middle East respiratory syndrome coronavirus in dromedary camels: An outbreak investigation. Lancet Infect. Dis. 2014, 14, 140–145. [Google Scholar] [CrossRef] [Green Version]
  8. Sabir, J.S.M.; Lam, T.T.-Y.; Ahmed, M.M.M.; Li, L.; Shen, Y.; Abo-Aba, S.E.M.; Qureshi, M.I.; Abu-Zeid, M.; Zhang, Y.; Khiyami, M.A.; et al. Co-circulation of three camel coronavirus species and recombination of MERS-CoVs in Saudi Arabia. Science 2016, 351, 81–84. [Google Scholar] [CrossRef] [Green Version]
  9. Van den Brand, J.M.; Smits, S.L.; Haagmans, B.L. Pathogenesis of Middle East Respiratory Syndrome Coronavirus. J. Pathol. 2015, 235, 175–184. [Google Scholar] [CrossRef] [PubMed] [Green Version]
  10. Lee, H.-J.; Shieh, C.-K.; Gorbalenya, A.E.; Koonin, E.V.; La Monica, N.; Tuler, J.; Bagdzhadzhyan, A.; Lai, M.M.C. The Complete Sequence (22 kilobases) of Murine Coronavirus Gene 1 Encoding the Putative Proteases and RNA Polymerase. Virology 1991, 180, 567–582. [Google Scholar] [CrossRef]
  11. Marra, M.A.; Jones, S.J.M.; Astell, C.R.; Holt, R.A.; Angela, B.W.; Butterfield, Y.S.N.; Jaswinder, K.; Asano, J.K.; Barber, S.A.; Chan, S.Y. The Genome Sequence of the SARS-Associated Coronavirus. Science 2003, 300, 1399–1404. [Google Scholar] [CrossRef] [Green Version]
  12. Woo, P.C.Y.; Huang, Y.; Lau, S.K.P.; Yuen, K.-Y. Coronavirus Genomics and Bioinformatics Analysis. Viruses 2010, 2, 1804–1820. [Google Scholar] [CrossRef] [PubMed] [Green Version]
  13. St John, S.E.; Tomar, S.; Stauffer, S.R.; Mesecar, A.D. Targeting Zoonotic Viruses: Structure-Based Inhibition of the 3C-Like Protease from Bat Coronavirus HKU4-The Likely Reservoir Host to the Human Coronavirus that Causes Middle East Respiratory Syndrome (MERS). Bioorg. Med. Chem. 2015, 23, 6036–6048. [Google Scholar] [CrossRef]
  14. Ratia, K.; Saikatendu, K.S.; Santarsiero, B.D.; Barretto, N.; Baker, S.C.; Stevens, R.C.; Mesecar, A.D. Severe Acute Respiratory Syndrome Coronavirus Papain-Like Protease: Structure of a Viral Deubiquitinating Enzyme. Proc. Natl. Acad. Sci. USA 2006, 103, 5717–5722. [Google Scholar] [CrossRef] [Green Version]
  15. Chen, S.; Chen, L.; Tan, J.; Chen, J.; Du, L.; Sun, T.; Shen, J.; Chen, K.; Jiang, H.; Shen, X. Severe Acute Respiratory Syndrome Coronavirus 3C-Like Proteinase N Terminus is Indispensable for Proteolytic Activity but not for Enzyme Dimerization. Biochemical and Thermodynamic Investigation in Conjunction with Molecular Dynamics Simulations. J. Biol. Chem. 2005, 280, 164–173. [Google Scholar] [CrossRef] [PubMed] [Green Version]
  16. Wojdyla, J.A.; Manolaridis, I.; van Kasteren, P.B.; Kikkert, M.; Snijder, E.J.; Gorbalenya, A.E.; Tucker, P.A. Papain-Like Protease 1 from Transmissible Gastroenteritis Virus: Crystal Structure and Enzymatic Activity toward Viral and Cellular Substrates. J. Virol. 2010, 84, 10063–10073. [Google Scholar] [CrossRef] [Green Version]
  17. Abuhammad, A.; Al-Aqtash, R.A.; Anson, B.J.; Mesecar, A.D.; Taha, M.O. Computational modeling of the bat HKU4 coronavirus 3CLpro inhibitors as a tool for the development of antivirals against the emerging Middle East respiratory syndrome (MERS) coronavirus. J. Mol. Recognit. 2017, 30, e2644. [Google Scholar] [CrossRef] [Green Version]
  18. Nantasenamat, C.; Isarankura-Na-Ayudhya, C.; Naenna, T.; Prachayasittikul, V. A practical overview of quantitative structure-activity relationship. J. Excli. 2009, 8, 74–88. [Google Scholar]
  19. Khan, A.U. Descriptors and their selection methods in QSAR analysis: Paradigm for drug design. Drug Discov. Today 2016, 21, 1291–1302. [Google Scholar]
  20. Toropova, A.P.; Toropov, A.A.; Benfenatia, E.; Leszczynska, D.; Leszczynski, J. QSAR model as a random event: A case of rat toxicity. Bioorg. Med. Chem. 2015, 23, 1223–1230. [Google Scholar] [CrossRef]
  21. Chtita, S.; Belhassan, A.; Bakhouch, M.; Taourat, A.I.; Aouidate, A.; Belaidi, S.; Moutaabbid, M.; Belaaouad, S.; Bouachrine, M.; Lakhlifi, T. QSAR study of unsymmetrical aromatic disulfides as potent avian SARS-CoV main protease inhibitors using quantum chemical descriptors and statistical methods. Chemo. Intel. Lab. Syst. 2021, 210, 104266. [Google Scholar] [CrossRef]
  22. Chtita, S.; Aouidate, A.; Belhassan, A.; Ousaa, A.; Taourati, A.I.; Elidrissi, B.; Ghamali, M.; Bouachrine, M.; Lakhlifi, T. QSAR study of N -substituted Oseltamivir derivatives as potent avian influenza virus H5N1 inhibitors using quantum chemical descriptors and statistical methods. New J. Chem. 2020, 44, 1747–1760. [Google Scholar] [CrossRef]
  23. XLSTAT Software. 2020. Available online: http://www.xlstat.com (accessed on 9 March 2021).
  24. Veerasamy, R.; Rajak, H.; Jain, A.; Sivadasan, S.; Varghese, C.; Agrawal, R. Validation of QSAR Models—Strategies and Importance. Int. J. Drug Disc. 2011, 2, 511–519. [Google Scholar]
  25. Muhammad, U.; Uzairu, A.; Arthur, D.E. Review on: Quantitative structure activity relationship (QSAR) modeling. J. Anal Pharm. Res. 2018, 7, 240–242. [Google Scholar] [CrossRef] [Green Version]
  26. Roy, K.; Mitra, I.; Kar, S.; Ojha, P.K.; Das, R.N.; Kabir, H. Comparative Studies on some metrics for external validation of QSAR model. J. Chem. Inf. Mdel. 2012, 52, 396–408. [Google Scholar] [CrossRef]
  27. Rücker, C.; Rücker, G.; Meringer, M. Y-Randomization and Its Variants in QSPR/QSAR. J. Chem. Inf. Model. 2007, 47, 2345–2357. [Google Scholar] [CrossRef] [PubMed]
  28. Pravin Ambure of Drug Theoretics & Cheminformatics (DTC) Laboratory; Jadavpur University: Kolkata, India, 2013.
  29. Chtita, S.; Belhassan, A.; Aouidate, A.; Belaidi, S.; Bouachrine, M.; Lakhlifi, T. Discovery of Potent SARS-CoV-2 Inhibitors from Approved Antiviral Drugs via Docking Screening. Comb. Chem. High Throughput Screen. 2020, 23, 441–454. [Google Scholar]
Figure 1. Representation of observed and predicted activities values (pIC50).
Chemistry 03 00029 g001
Table 1. Chemical structures and activity experiment of 41 peptidomimetic compounds.
Chemistry 03 00029 i001
R1R2R3R4pIC50
1 Chemistry 03 00029 i002 Chemistry 03 00029 i003H Chemistry 03 00029 i0046.48
2 Chemistry 03 00029 i005 Chemistry 03 00029 i006H Chemistry 03 00029 i0076.39
3 Chemistry 03 00029 i008 Chemistry 03 00029 i009H Chemistry 03 00029 i0105.92
4 Chemistry 03 00029 i011 Chemistry 03 00029 i012H Chemistry 03 00029 i0135.92
5 Chemistry 03 00029 i014 Chemistry 03 00029 i015H Chemistry 03 00029 i0165.82
6 Chemistry 03 00029 i017 Chemistry 03 00029 i018H Chemistry 03 00029 i0195.80
7 Chemistry 03 00029 i020 Chemistry 03 00029 i021H Chemistry 03 00029 i0225.77
8 Chemistry 03 00029 i023 Chemistry 03 00029 i024H Chemistry 03 00029 i0255.77
9 Chemistry 03 00029 i026 Chemistry 03 00029 i027H Chemistry 03 00029 i0285.70
10 Chemistry 03 00029 i029 Chemistry 03 00029 i030H Chemistry 03 00029 i0315.66
11 Chemistry 03 00029 i032 Chemistry 03 00029 i033H Chemistry 03 00029 i0345.62
12 Chemistry 03 00029 i035 Chemistry 03 00029 i036H Chemistry 03 00029 i0375.55
13 Chemistry 03 00029 i038 Chemistry 03 00029 i039H Chemistry 03 00029 i0405.51
14 Chemistry 03 00029 i041 Chemistry 03 00029 i042H Chemistry 03 00029 i0435.51
15 Chemistry 03 00029 i044 Chemistry 03 00029 i045H Chemistry 03 00029 i0465.43
16-NH-CH3 Chemistry 03 00029 i047H Chemistry 03 00029 i0485.32
17 Chemistry 03 00029 i049 Chemistry 03 00029 i050H Chemistry 03 00029 i0515.28
18 Chemistry 03 00029 i052 Chemistry 03 00029 i053H Chemistry 03 00029 i0545.06
19 Chemistry 03 00029 i055 Chemistry 03 00029 i056H Chemistry 03 00029 i0574.80
20 Chemistry 03 00029 i058 Chemistry 03 00029 i059 Chemistry 03 00029 i060 Chemistry 03 00029 i0615.89
21 Chemistry 03 00029 i062 Chemistry 03 00029 i063 Chemistry 03 00029 i064 Chemistry 03 00029 i0655.82
22 Chemistry 03 00029 i066 Chemistry 03 00029 i067 Chemistry 03 00029 i068 Chemistry 03 00029 i0695.74
23 Chemistry 03 00029 i070 Chemistry 03 00029 i071 Chemistry 03 00029 i072 Chemistry 03 00029 i0735.66
24 Chemistry 03 00029 i074 Chemistry 03 00029 i075 Chemistry 03 00029 i076 Chemistry 03 00029 i0775.66
25 Chemistry 03 00029 i078 Chemistry 03 00029 i079 Chemistry 03 00029 i080 Chemistry 03 00029 i0815.57
26 Chemistry 03 00029 i082 Chemistry 03 00029 i083 Chemistry 03 00029 i084 Chemistry 03 00029 i0855.47
27-OCH2F Chemistry 03 00029 i086 Chemistry 03 00029 i087 Chemistry 03 00029 i0885.41
28 Chemistry 03 00029 i089 Chemistry 03 00029 i090 Chemistry 03 00029 i091 Chemistry 03 00029 i0925.38
29-CH(CH3)2 Chemistry 03 00029 i093 Chemistry 03 00029 i094 Chemistry 03 00029 i0955.16
30 Chemistry 03 00029 i096 Chemistry 03 00029 i097 Chemistry 03 00029 i098 Chemistry 03 00029 i0995.15
31 Chemistry 03 00029 i100 Chemistry 03 00029 i101 Chemistry 03 00029 i102 Chemistry 03 00029 i1035.07
32-I Chemistry 03 00029 i104 Chemistry 03 00029 i105 Chemistry 03 00029 i1065.02
33 Chemistry 03 00029 i107 Chemistry 03 00029 i108 Chemistry 03 00029 i109 Chemistry 03 00029 i1104.83
34 Chemistry 03 00029 i111 Chemistry 03 00029 i112 Chemistry 03 00029 i113 Chemistry 03 00029 i1144.81
35 Chemistry 03 00029 i115 Chemistry 03 00029 i116 Chemistry 03 00029 i117 Chemistry 03 00029 i1184.76
36 Chemistry 03 00029 i119 Chemistry 03 00029 i120 Chemistry 03 00029 i121 Chemistry 03 00029 i1224.74
37 Chemistry 03 00029 i123 Chemistry 03 00029 i124 Chemistry 03 00029 i125 Chemistry 03 00029 i1264.73
38-NH2 Chemistry 03 00029 i127 Chemistry 03 00029 i128 Chemistry 03 00029 i1294.66
39 Chemistry 03 00029 i130 Chemistry 03 00029 i131 Chemistry 03 00029 i132 Chemistry 03 00029 i1334.45
40 Chemistry 03 00029 i134 Chemistry 03 00029 i135 Chemistry 03 00029 i136 Chemistry 03 00029 i1374.28
41 Chemistry 03 00029 i138 Chemistry 03 00029 i139 Chemistry 03 00029 i140 Chemistry 03 00029 i1414.25
Table 2. Experimental and predicted activities (pIC50) and residual values, according to MLR model.
pIC50 Exp.MLR
pIC50 Pred.Res.
Training set16.4816.2380.243
26.3876.1810.206
35.9215.5870.334
45.9215.8300.091
55.8245.7630.061
65.7965.4960.299
75.7705.892−0.123
85.7215.5700.151
95.6995.787−0.088
105.6585.677−0.020
125.5535.736−0.183
135.5095.555−0.047
145.5095.5050.004
155.4325.452−0.021
175.2765.772−0.496
185.0565.305−0.249
194.7965.127−0.331
215.8245.5190.305
225.7454.9330.812
235.6585.6320.026
245.6585.2280.430
285.3775.3150.062
295.1615.278−0.117
305.1555.531−0.376
315.0664.9430.123
325.0224.9540.069
334.8334.7750.058
344.8124.2520.561
354.7644.875−0.111
364.7384.906−0.168
374.7284.811−0.083
384.6585.070−0.412
404.2814.927−0.646
414.2554.618−0.363
Test set115.6205.763−0.144
165.3195.0600.259
205.8864.2691.617
255.5694.8510.717
265.4695.640−0.171
275.4094.9260.483
394.4497.521−3.073
Table 3. Various values obtained after testing of y-randomization.
Random ModelsModel Original
R0.380R0.831
R20.157R20.691
Q20.278Q20.528
CRP20.614
Where CRP2 is the coefficient of y-randomization.
Publisher’s Note: MDPI stays neutral with regard to jurisdictional claims in published maps and institutional affiliations.

