Article

Study on Adsorption Performance of Benzoic Acid in Cyclocarya paliurus Extract by Ethyl Cellulose Microspheres

1
School of Chemical Engineering, Northwest Minzu University, Lanzhou 730030, China
2
Key Laboratory for Utility of Environment-Friendly Composite Materials and Biomass in Universities of Gansu Province, Lanzhou 730030, China
3
Key Laboratory of Environment-Friendly Composite Materials of the State Ethnic Affairs Commission, Lanzhou 730030, China
*
Author to whom correspondence should be addressed.
Submission received: 29 August 2021 / Revised: 25 September 2021 / Accepted: 28 September 2021 / Published: 1 October 2021
(This article belongs to the Special Issue Discovery of Bioactive Ingredients from Natural Products)

Abstract

:
Polymer microspheres with inter-connecting pores are widely used as microsphere materials. In the study, the ethyl cellulose microspheres (ECM) were prepared by using the solvent-evaporation method. Based on that, a method for the separation and purification of benzoic acid from crude extract of Cyclocarya paliurus was established by the ECM and high performance liquid chromatography (HPLC). The ECM after the sorption equilibrium was desorbed by using 40% methanol as the analytical solvent. The content of benzoic acid in eluent is up to 0.0216 mg/mL, and the benzoic acid can be obtained with a high purity of 82.22%. Furthermore, the adsorption-desorption behavior of benzoic acid onto ECM was investigated. The results of adsorption kinetics of benzoic acid showed that the adsorption followed the pseudo-first-order kinetic model. The ECM was characterized by using Fourier transform infrared spectroscopy (FTIR), thermogravimetric analysis (TGA), scanning electron microscope (SEM), and X-ray diffraction (XRD). The results showed that the ECM has a high adsorption property due to its more porous structure, phenolic hydroxyl group, and other oxygen-containing functional groups. This method and the ECM can be used stably, continuously, and efficiently to purify the benzoic acid from the methanol extract of C. paliurus on a large scale.

1. Introduction

The increasingly prominent environmental problems have promoted the utilization efficiency of natural resources [1]. As the abundant and inexpensive renewable resource in nature, cellulose is the second largest source of energy in the world after water. Cellulose have strong adsorption because of a large amount of hydroxyl groups and oxygen-containing groups on its surface [2]. Ethyl cellulose (EC), as a kind of important derivative from cellulose, is nontoxic, stable, solvent-soluble, and has good plasticity and high mechanical intensity [3,4,5]. At present, EC has been widely used in many fields as a macromolecular material with excellent biocompatibility [6]. In addition, EC shows good film-forming performance and the prepared films have been widely used in many fields, such as biological separation, microcapsule materials, and crystal orientation [7,8,9,10]. Due to its biodegradable, antimicrobial effect, higher bioactivity, and so on, EC as an ideal carrier material can be used to control the release drug delivery system [11,12].
The surface area of microspheres consists of two parts: the external surface area and the surface area of internal pore wall [13]. At present, porous polymer microspheres are widely used in fields of pharmaceutical carriers, ionic adsorption, catalyst, drug controlled release, and so on [14,15,16]. Based on the above analysis, the natural polymer microspheres should be used in chromatographic separation science due to its excellent biocompatibility and strong adsorption.
Cyclocarya Paliurus (Batal.) Iljinskaja, as a kind of perennial herb plant from Juglandaceae family, is an endemic tree growing on cloudy and foggy highlands in the Xiushui area of Southern China [17]. The leaves of C. Paliurus, commonly known as “sweet tea”, have been used as Chinese herbal medicine for thousands of years, and have beneficial effects on health, remedying ailments, enhancing mental efficiency, and in recovering from mental fatigue [18,19]. Modern pharmacology research confirmed that C. Paliurus has multiple biological activities, such as antihypertensive activity, hypolipidaemic, hypoglycemic activity, enhancement of mental efficiency, and antioxidant activity [20,21,22,23,24,25]. The constituents isolated from its leaves consist of protein, polysaccharides, triterpenoids, flavonoids, steroids, saponins, phenolic acids, etc. [26,27,28,29]. Among these compounds, the unique characteristics of its phenolic acids have drawn much attention.
Many studies have shown that phenolic acids can protect insulin-producing cells, improve insulin secretion, and promote the utilization of blood glucose as energy under pressure [30]. In the meanwhile, phenolic acids have been demonstrated to be effective for weight loss through suppression of fat absorption [31].
Up to now, many techniques have been applied to separate and ensure the purity of active ingredients in natural plant extracts, such as high-speed counter-current chromatography, preparative column chromatography, electromigration, and supercritical fluid extraction [32,33,34]. However, these methods are not suitable for large-scale industrial production due to the low capacity and high production cost. Many researchers have focused on the purification of the active ingredient by resin adsorption, natural materials, modified porous absorbents, and combination technologies. Nevertheless, to the best of our knowledge, there have been few reports yet regarding the absorbent-filling process for the separation and purification of the active ingredient, which as a method of such integrated process is still required. Therefore, it is of very important significance that there is separation and purification of active components in natural products by using the adsorption property of porous adsorbent materials.
The purpose of this work was to use the ethyl cellulose microspheres (ECM) for separating and purifying benzoic acid from C. paliurus extract. By utilizing the adsorption property of the ethyl cellulose microspheres (ECM), the purpose of crude extraction of benzoic acid from the extract of C. paliurus was finally achieved.

2. Materials and Methods

2.1. Main Experimental Materials and Instruments

Ethyl cellulose (EC) (6 mPa s to 9 mPa s) was obtained from Aladdin Chemistry Co. Ltd. (Shanghai, China), polyvinyl alcohol (PVA) and trichloromethane were purchased from Chengdu Kelong Chemical Reagent Factory, Chengdu, China. Dichloromethane and hexane were purchased from Tianjin Fengchuan Chemical Reagent Technology Co. Ltd. (Tianjin, China) HCOOH is analytically pure. CH3OH and acetonitrile are chromatographically pure. Benzoic acid standard with a purity of 98% was purchased from Shanghai Shifeng Biotechnology Co., Ltd. (Shanghai, China) Distilled water was made by our school.
C. paliurus was identified by Xiao-jun Yang (College of Chemical Engineering, Northwest Minzu University, Lanzhou, China) and deposited in the college of chemical engineering of Northwest Minzu University.
Agilent-1200 High Performance Liquid Chromatograph (Agilent Technologies, California, CA, USA); Nicolet 380 Fourier Transform Infrared Spectrometer (American Thermoelectric Corporation, Waltham, MA, USA); TGA1 Thermogravimetric Analyzer (METTLER, Switzerland); EVO18 scanning electron microscope (Zeiss, Jena, Germany); SHA-BA type water bath constant temperature oscillator (Fip Experimental Instrument Factory, Changzhou, China); TDL-4 desktop centrifuge (Precision Instrument Co., Ltd., Shanghai, China); AS3120 ultrasonic cleaning instrument (Outsells Instrument Co., Ltd., Tianjin, China); PW135 high-speed pulverizer (Taisite Instrument Co., Ltd., Tianjin, China; Advanced-I-24L ultra-pure water machine (Aike Water Treatment Equipment Co., Ltd., Chengdu, China); 0.45 μm microporous membrane (Xingya Purification Materials Factory, Shanghai, China); and 5 mL syringe (Huada Medical Devices Co., Ltd., Jiangsu, China).

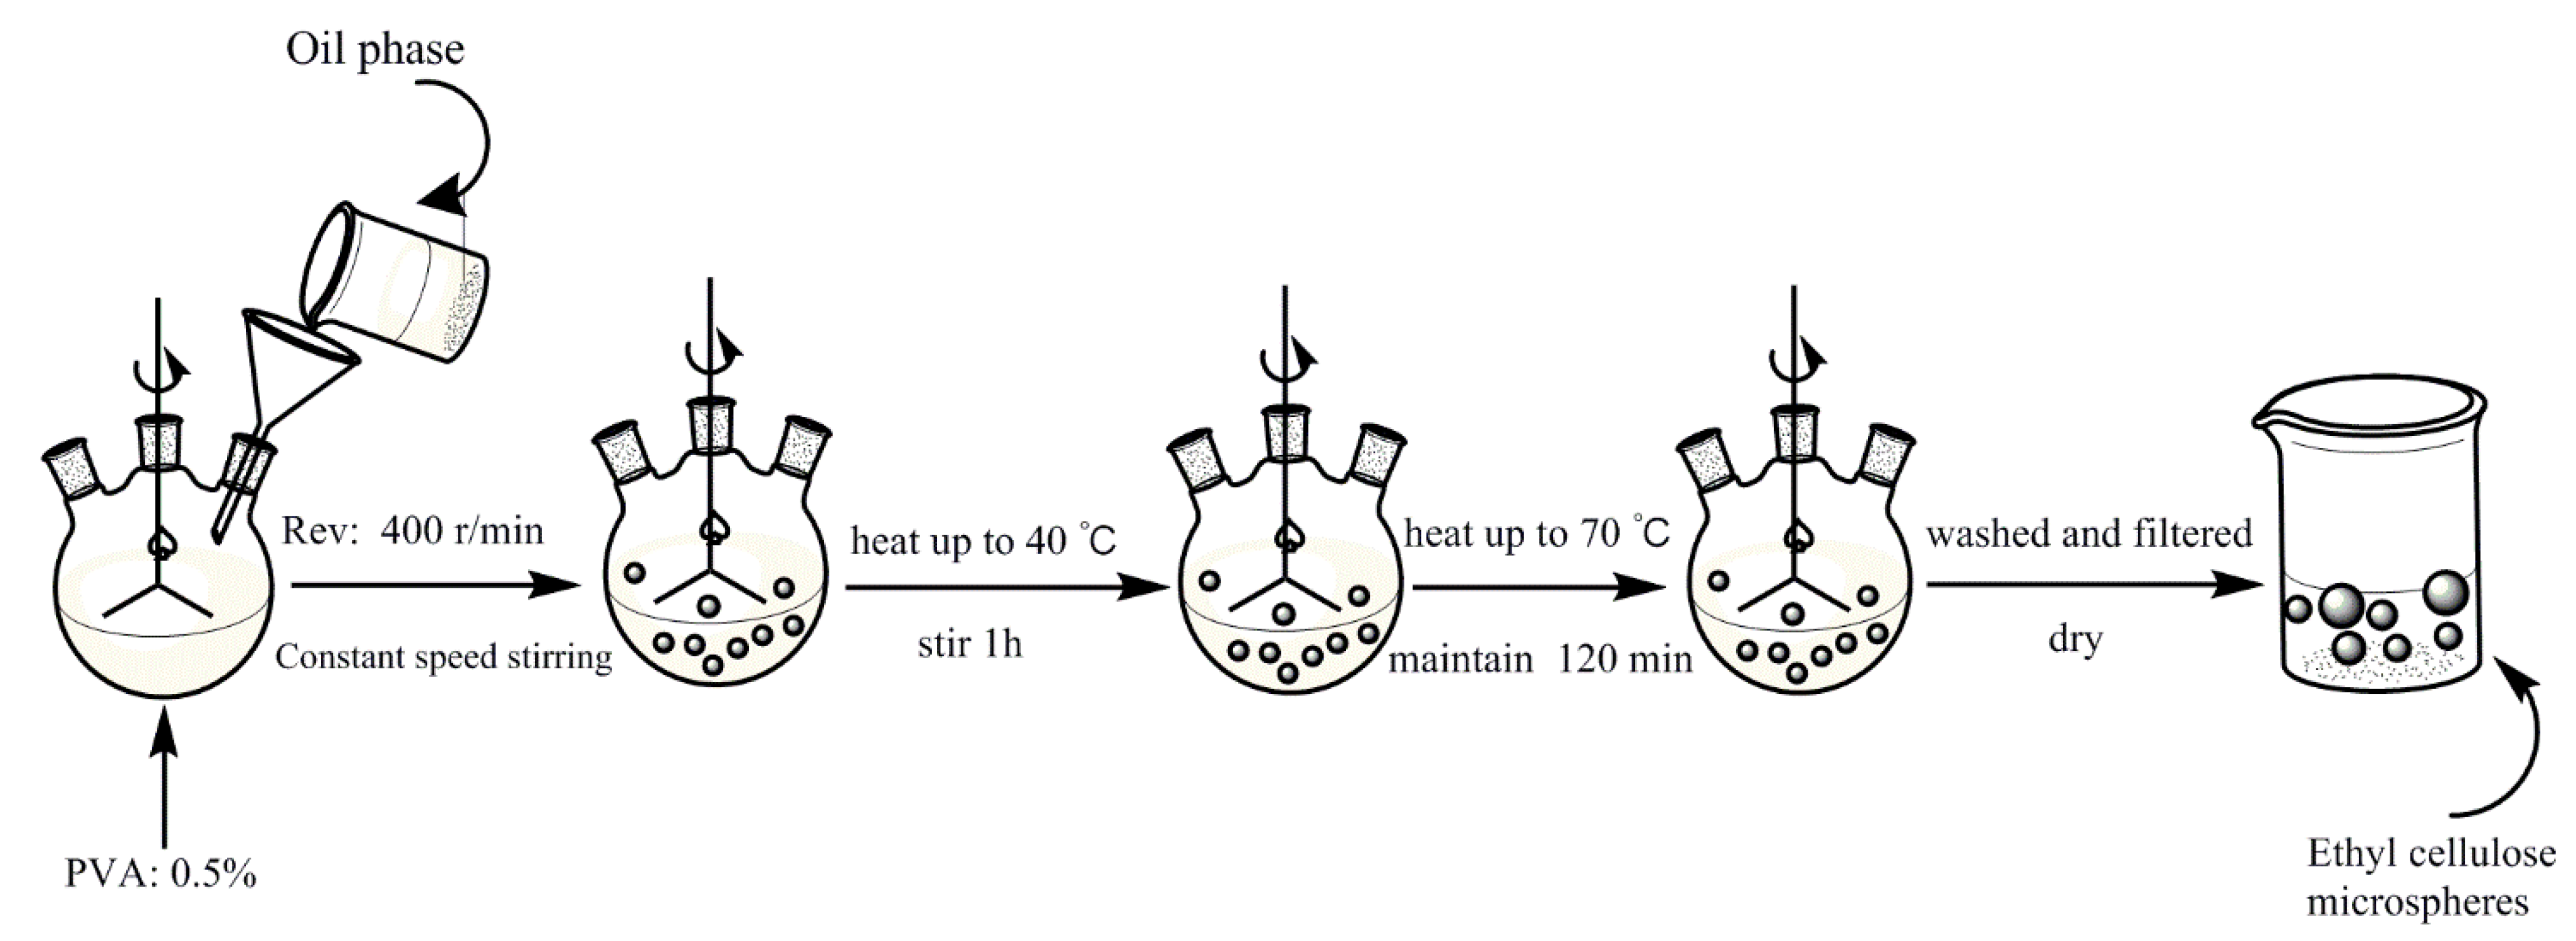
2.2. Pretreatment of ECM

In this experiment, ECM was prepared by the method of solvent evaporation [35]. In addition, the production process of ECM is shown in Figure 1.
Two-hundred-and-eighty grams of polyvinyl alcohol (PVA) solution with the mass fraction of 0.5% was weighed precisely and placed in a three-necked flask. The system of oil phase solution, which is transparent and homogeneous, was prepared with EC, dichloromethane, trichloromethane, and hexane, according to the mass ratio of a certain amount. Then, the oil phase solution was pulled in PVA solution, and the system of mixture was agitated at the speed of 400 r/min and the temperature of 40 °C to insist 60 min. Subsequently, the temperature of the system was heated up to 70 °C to insist 120 min. Finally, the ECM was obtained though washing with distilled water and being dried.

2.3. Structural Characterization of the ECM

2.3.1. Fourier Transform Infrared Spectroscopy (FTIR) Analysis

The Fourier transform infrared spectroscopy (FTIR) spectra of ECM in comparison with EC were performed in the range 400–4000 cm−1 at 64 scans with 4 cm−1 resolution using Nicolet 380 FTIR Spectrometer-American Thermoelectric Corporation. This analysis was employed to demonstrate the function groups of the EC and ECM.

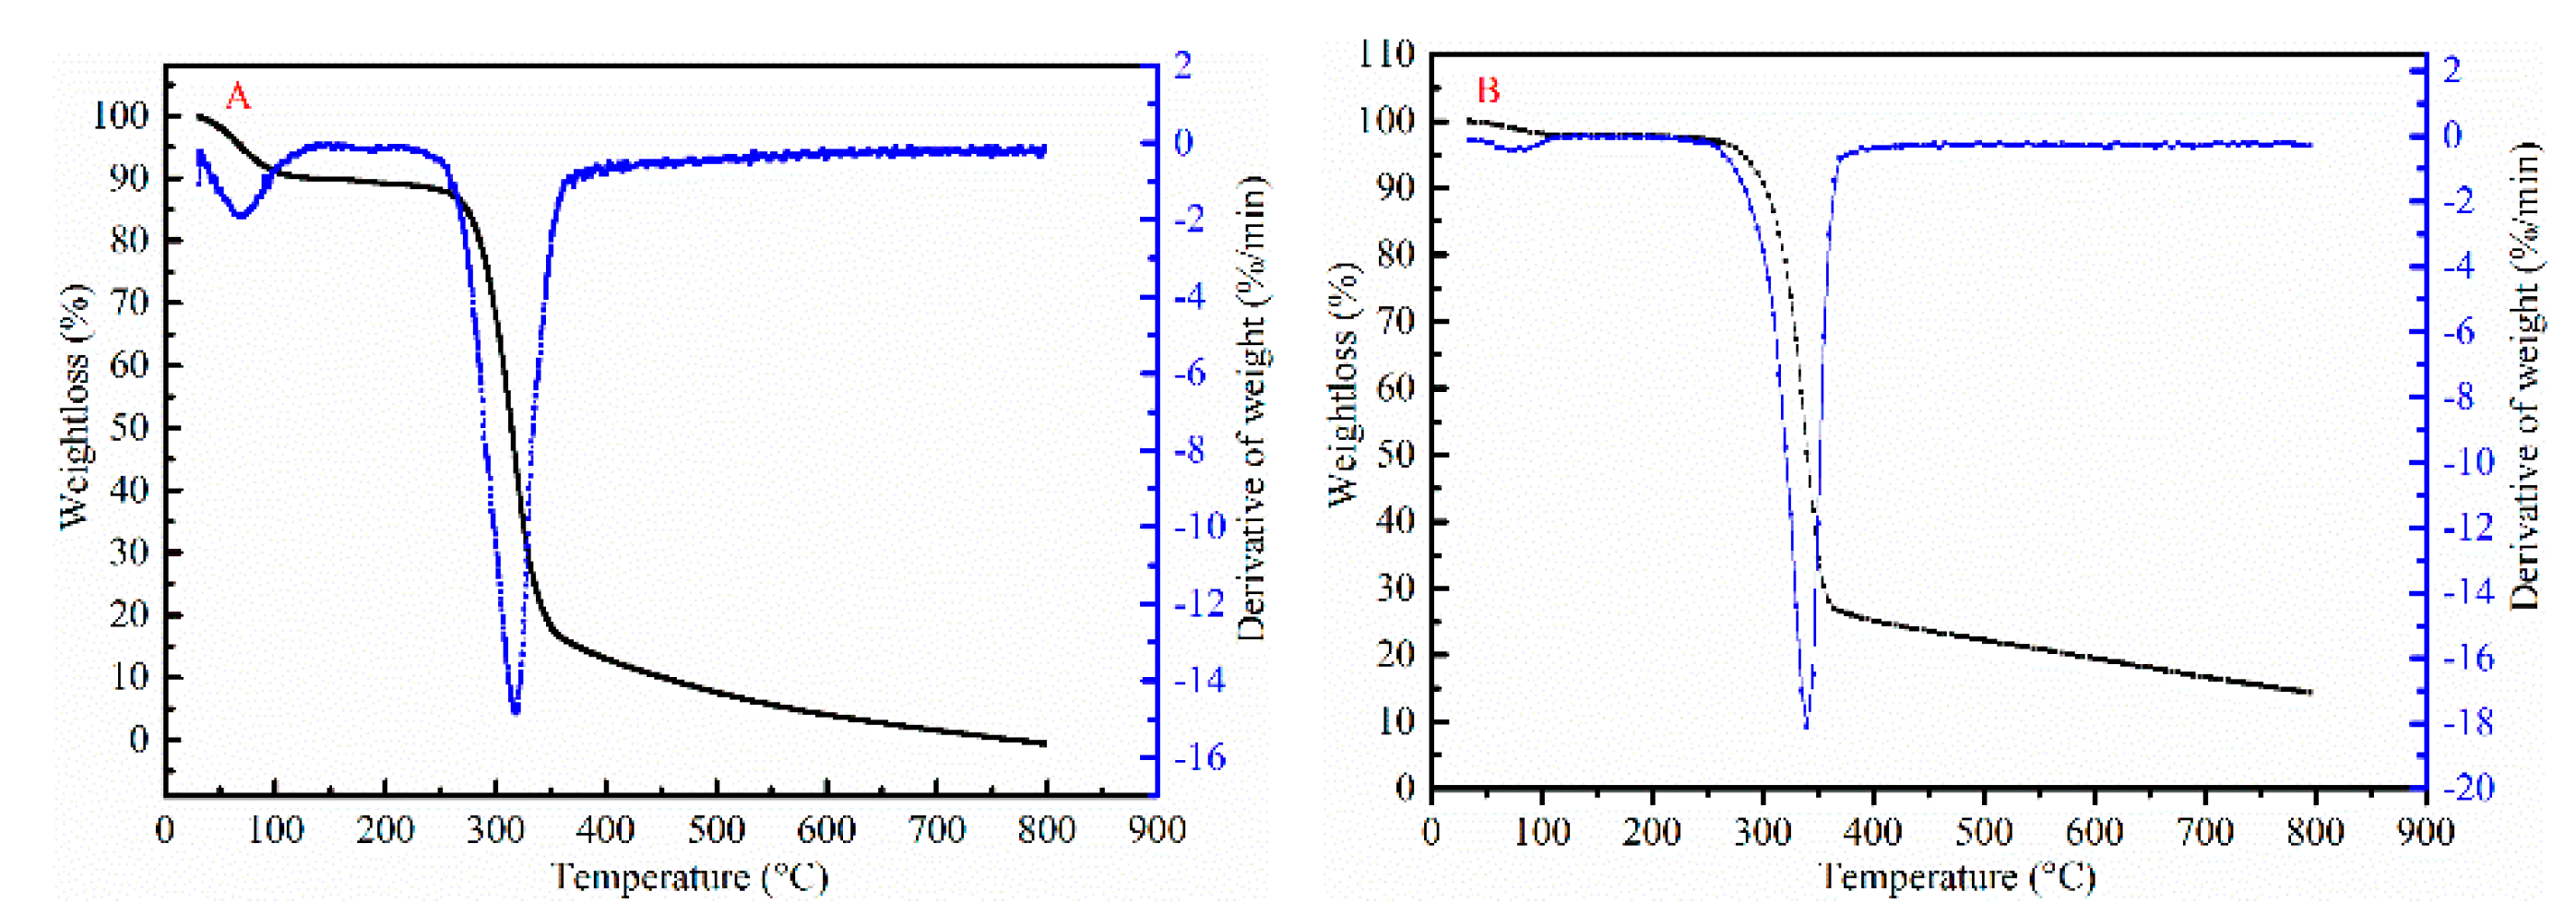
2.3.2. Thermo Gravimetric Analyzer (TGA) Analysis

TGA was used to study the thermodynamic properties of the material. The temperature ranged from 25 °C to 800 °C with the heating rate of 10 °C/min, using 20 mL/min high purity nitrogen as the carrier gas.

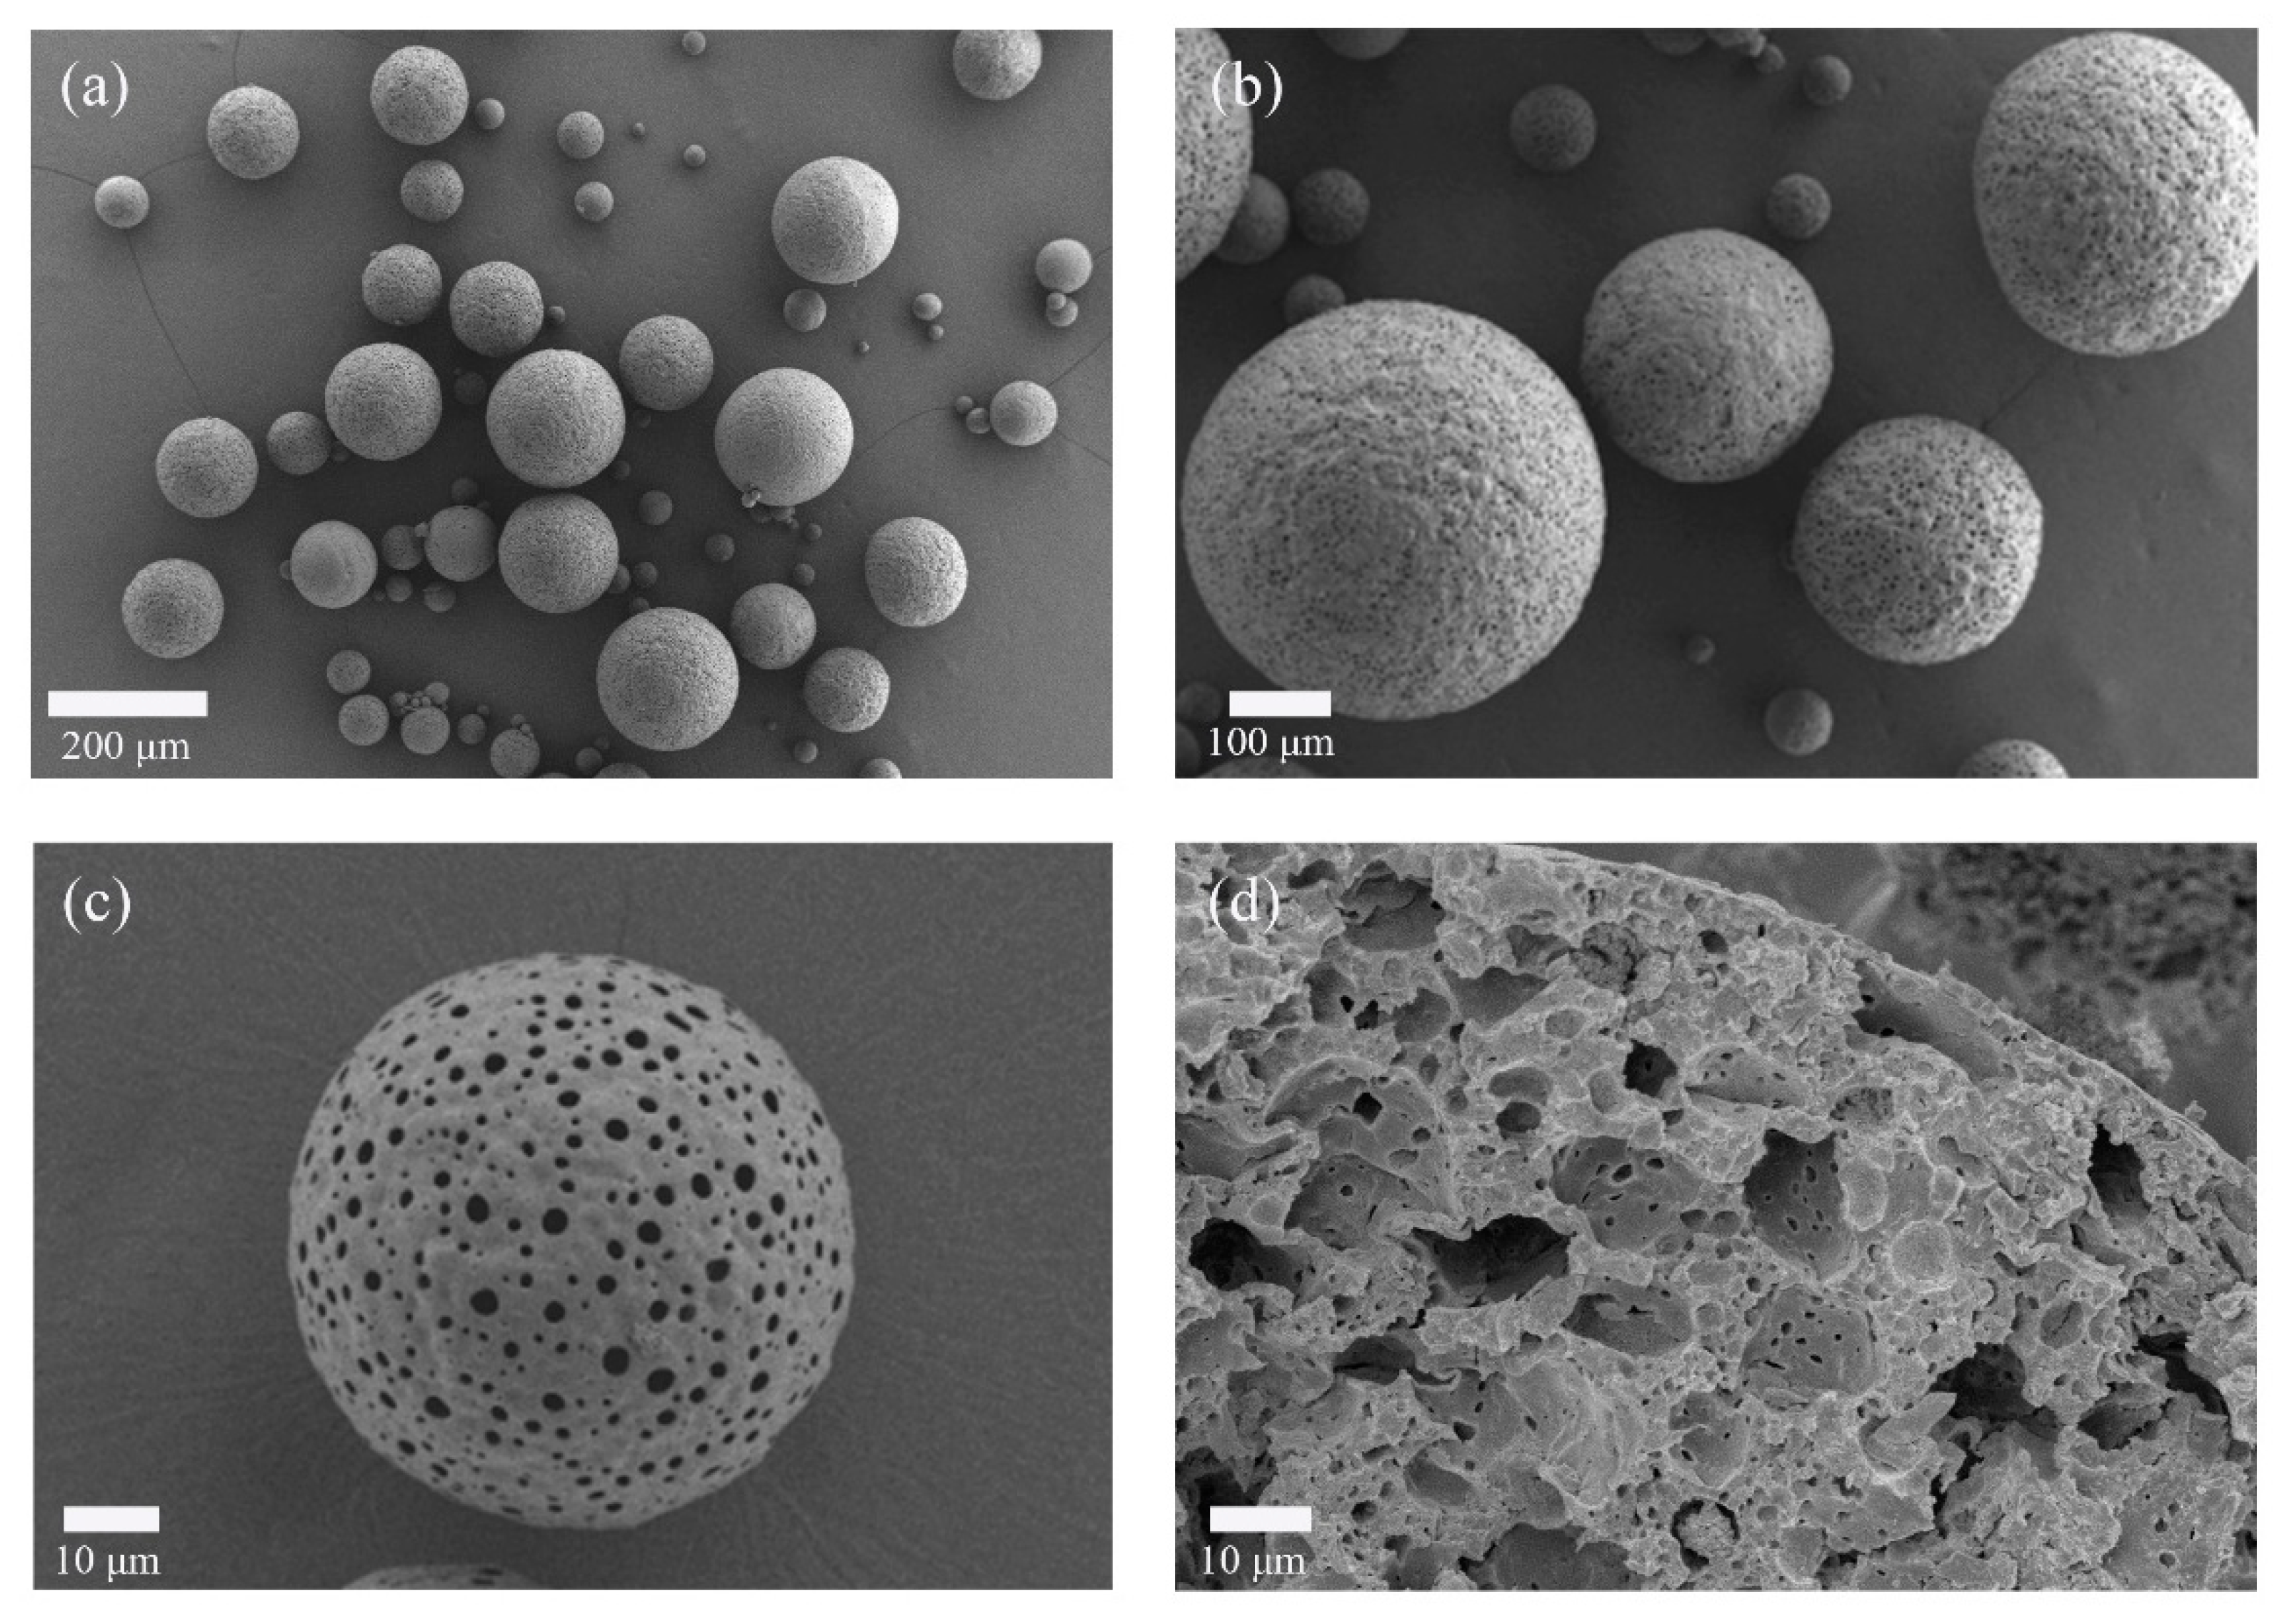
2.3.3. Scanning Electron Microscope (SEM) Analysis

SEM was used to observe the shape; size distribution; and surface topography of the material, high vacuum mode, and beam spot 5.0.

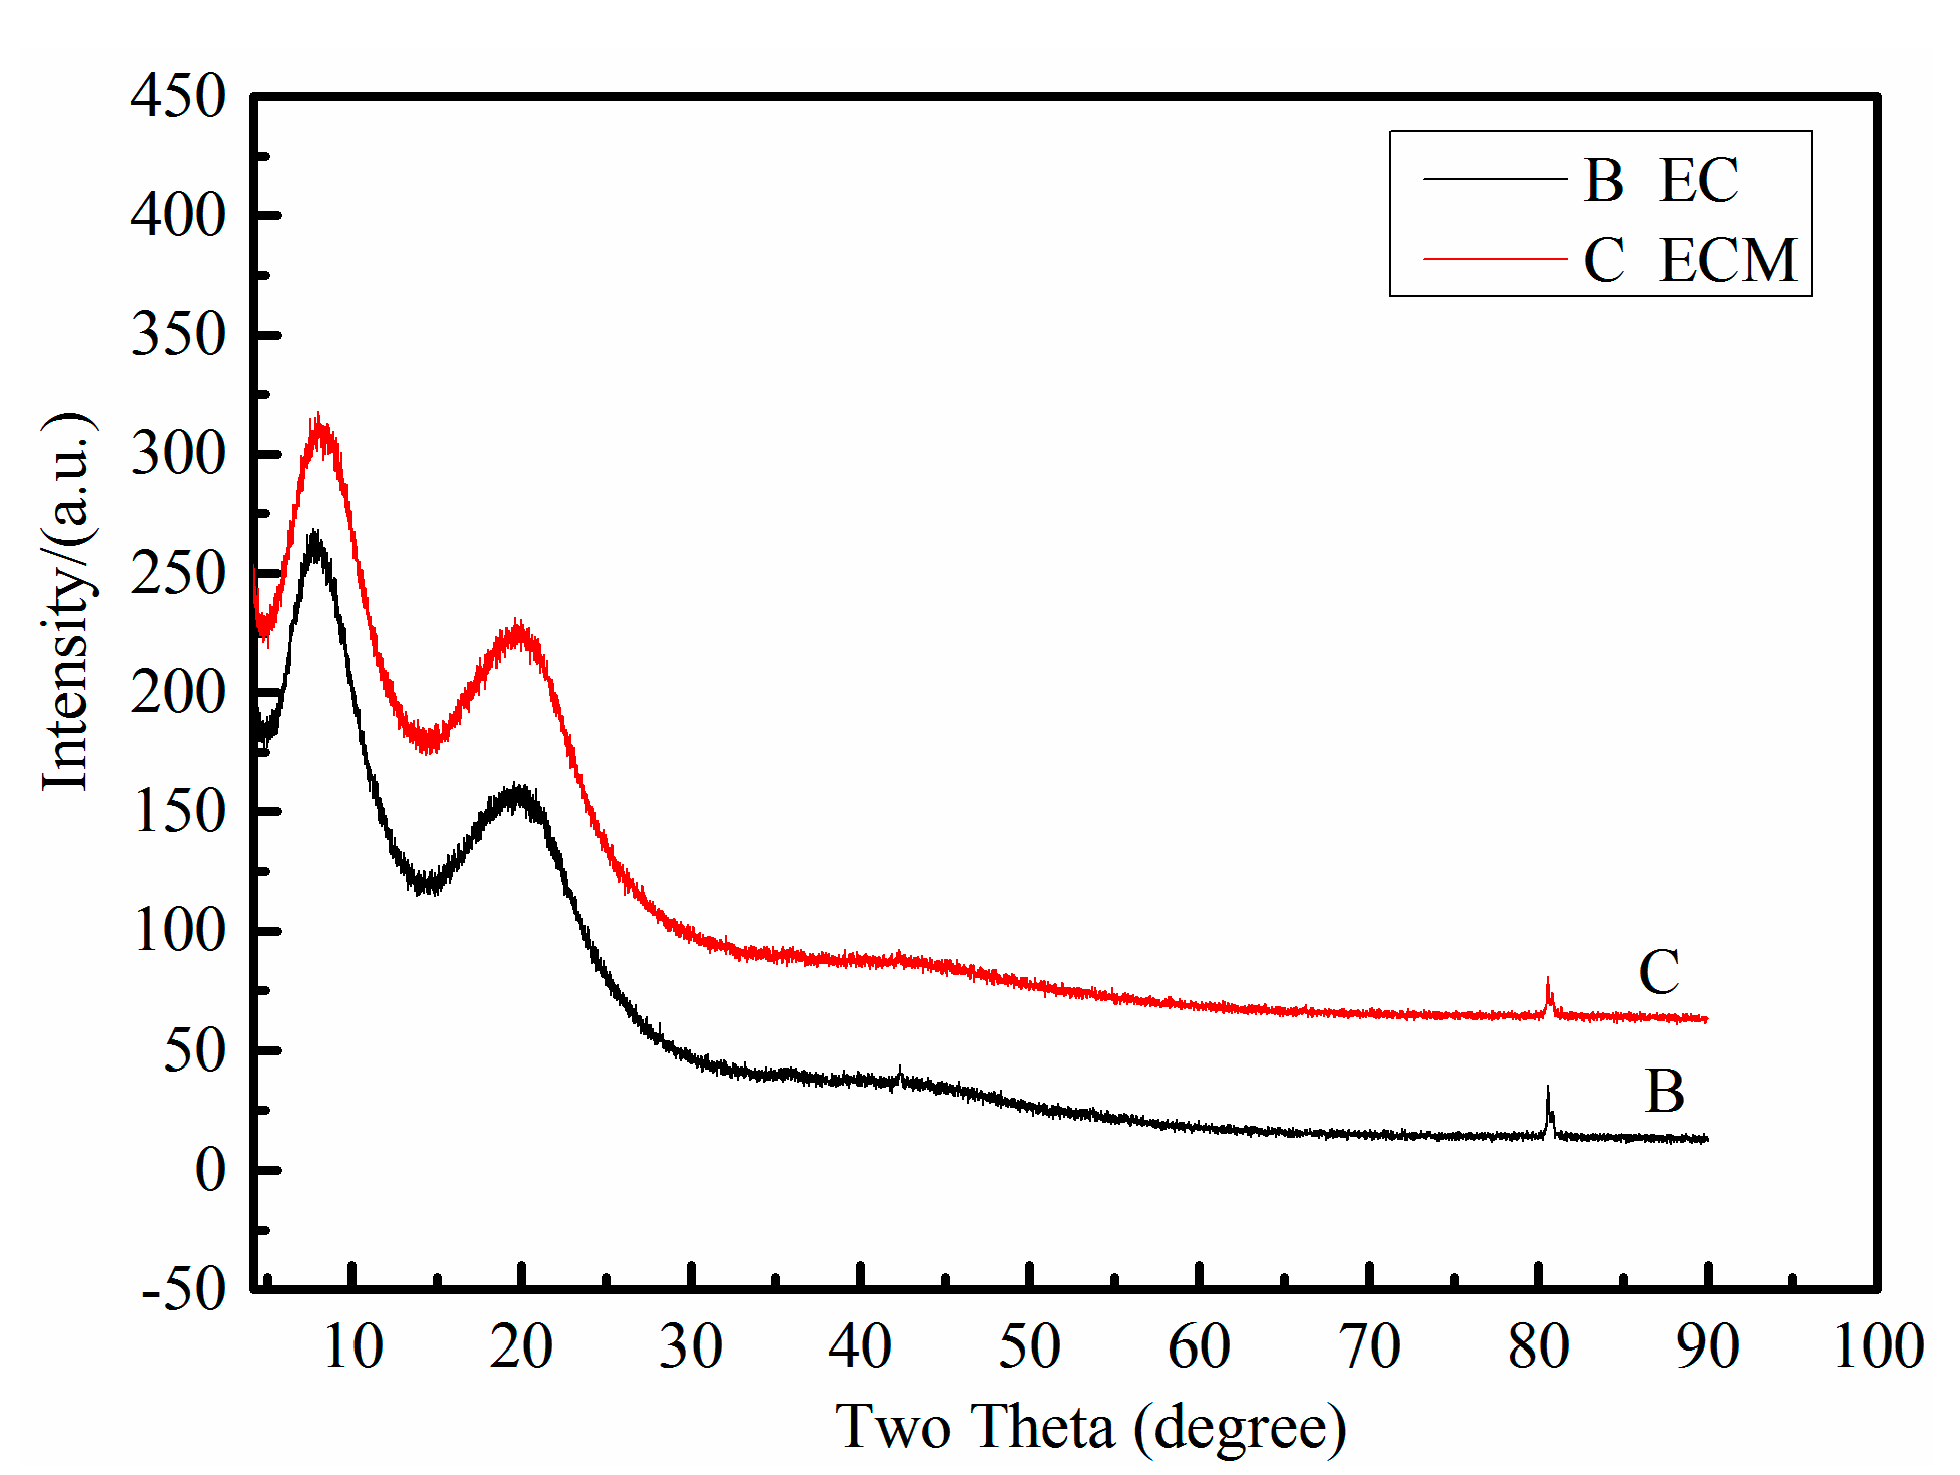
2.3.4. X-ray Diffraction (XRD) Analysis

Analysis of EC and ECM crystal structures was cured out by execution of X-ray diffraction (XRD) using Thermo scientific diffractometer with a Cu Kα radiation source (λ = 0.154 nm).

2.4. Determination of the Benzoic Acid

In order to ensure that the measurement method was fast, stable, reproducible, and accurate, the quantitative detection of C. paliurus extract before and after adsorption with ECM was mainly carried out by HPLC. The chromatographic conditions were established as the following shows:
Stationary phase: Agilent TC-C18 column (4.6 mm × 150 mm, 5 μm); mobile phase: mobile phase B is acetonitrile solution; mobile phase C is 0.1% formic acid solution; column temperature: room temperature; flow rate: 1.0 mL/min; detection wavelength: 261 nm; injection volume: 10 μL. Under the above chromatographic conditions, with the time-concentration change shown in Table 1 as the gradient elution condition, it was found that the effective active components in C. paliurus could be separated well and the extract of C. paliurus before and after adsorption was qualitatively detected and analyzed.

2.5. Preparation of Test Solution

2.5.1. Preparation of Standard Reference Solution

An amount of 3.2 mg of benzoic acid was poured into a 10 mL brown volumetric flask. Then chromatographically pure methanol solution was added to the mark to obtained a reference stock solution with a concentration of 0.32 mg·mL−1.

2.5.2. Preparation of Test Solution

The dried roots of C. paliurus were pulverized and passed through a Pharmacopoeia sieve with a pore size of 0.15 mm for experiments.
The response surface design of the extraction of benzoic acid from C. paliurus gave the optimal condition, which is with 60% methanol solution as extraction solvent and the ratio of liquid to material was 25:1 (mL/g) at 60 °C for 60 min [36]. According to the above extraction condition, 3 g of roots powder was transferred to a 100 mL conical flask, which contained 75 mL of methanol solution. Then the mixture was sonicated for 60 min. After cooled to room temperature, it was suction filtered and the filtrate was made up to a 100 mL volumetric flask and stored in a dark place.

2.5.3. Determination of Sample Determination Time

Taking the benzoic acid standard solution as the test solution and performing HPLC analysis under the chromatographic conditions of “2.4”, a single-needle injection of the benzoic acid standard solution was determined for its peak time (Supplementary Material).

2.5.4. Investigation of Linear Relationship

The benzoic acid standard solution was accurately extracted by 0.5 μL, 1.0 μL, 1.5 μL, 2.0 μL, 5.0 μL, and 10.0 μL. The peak area was measured by injection under the above chromatographic conditions. Taking the mass of the standard control as the independent variable and the peak area as the dependent variable, the regression equation was obtained as follows: y = 5394.9x − 24.69, R2 = 0.9996. The linear range is 0.016~0.320 mg/mL.

2.6. Adsorption Experiment of ECM on Benzoic Acid in C. paliurus Extract

2.6.1. Static Adsorption Experiments

Static adsorption tests on EC and ECM absorbents were performed as follows: 25 mL extracting solution of C. paliurus was added to mix with pre-weighed 2.0 g dry absorbents in the flasks. The flasks were sealed tightly and shaken on an incubation shaker (120 rpm) at 25 °C for 24 h to reach adsorption equilibrium. The solution after adsorption was gained by filtration and subjected to further HPLC analysis.

2.6.2. Adsorption Kinetic

The experiment was timed from the moment that the ECM adsorbents (2.0 g) in flask was added to the C. paliurus solution (25 mL) of benzoic acid. The concentration of benzoic acid standard solution was 0.010 mg/mL. Subsequently, the flask was continually shaken in an incubator shaker (120 rpm) at 25 °C. The benzoic acid concentration in the adsorption process was determined with HPLC at regular intervals until the equilibrium was reached.

2.7. Desorption Performance Test after Adsorption Equilibrium of ECM

2.7.1. The Influence of Methanol Concentration on the Desorption Performance of Benzoic Acid

Due to the influence of methanol concentration on benzoic acid desorption, performance is greater than ultrasonic time and temperature, etc. At the same time, the loss of ECM increases with increasing of methanol concentration. Therefore, the influence of 30%, 40%, 50%, 60%, and 70% methanol on desorption results is mainly discussed. The experimental conditions were as follows: Different concentrations of methanol were used as the desorption solvent for the same amount of ECM after reaching the adsorption equilibrium. The ultrasonic desorption was carried out at 45 °C for 60 min, and the samples were taken for quantitative and qualitative detection and analyzed in HPLC.

2.7.2. Desorption Curves Test

First of all, the ECM after the adsorption equilibrium was rinsed with 40% methanol solution in order to exclude the interference of other active ingredients in the extraction solution of C. paliurus. Then, after the adsorption equilibrium, the ECM were taken out and placed in a conical flask with 20 mL of 40% methanol solution as the analytical solvent. The mixture was sonicated for 60 min at 45 °C. The resolution repeated the above experiment. Meanwhile, the concentrations of benzoic acid in the analytical solution were monitored by HPLC analysis.

3. Results and Discussion

3.1. Characterization of ECM

The prepared ECM was characterized by FTIR, TGA, SEM, and XRD.

3.1.1. FTIR Analysis

Figure 2 is an infrared spectrum of EC and ECM. From the figure, it can be seen that EC and ECM have a wide band in the region of 3400~3500 cm−1, which is due to the OH stretching vibration. The peaks observed at 2980 cm−1 are due to the C-H stretching vibration in EC and ECM [37]. The peak centered at 1380 cm−1 resulted from the intermolecular hydrogen bonding at the C6 group. In addition, the absorption peak at around 1400~1300 cm−1 is ascribed to the bending vibration of the H-C-H and O-C-H bonds of aromatic ring in polysaccharides [38]. In addition, the absorption peak at 1112 cm−1 is attributed to the C-C glycosidic ether bond. The characteristic absorption peak appearing at about 1060 cm−1 is C-O-C stretching of pyranose ring and appears around 880 cm−1, which is C-OH out of plane bending mode. Through the analysis of the infrared spectral curves of EC and ECM, it can be clearly seen that the ECM contains hydroxyl, carboxyl, epoxy, and other oxygen-containing functional groups. Due to the existence of these functional groups, it provides a large number of adsorption sites, which enhances the adsorption performance of ECM [39].

3.1.2. TGA Analysis

Figure 3 shows the TGA and DTG curves of EC (A) and ECM (B). In terms of EC, it is easy to discover that the first step of weight loss from 36 °C to 200 °C is about 10.03%, which can be attributed to the release of moisture in the samples. The majority of the weight loss appears between 200–400 °C; the decomposition of cellulose is mainly responsible for the observed weight loss 76.17%. The third weight loss of 13.67% occurs at a range of 400–800 °C, which is assigned to indicate gradual consolidation of nanoporous carbon structures. As far as the ECM is concerned, the first step of weight loss from 36 °C to 200 °C is about 2.15%. The second weight loss of 72.57% occurs at a range of 200–400 °C and the third weight loss of 10.94% occurs at a range of 400–800 °C
The difference is that the moisture in the samples of EC is lower than ECM. In addition, the thermal decomposing temperature of EC is 240 °C and the decomposing temperature of ECM is 280 °C. In addition, the residue of EC is 0.66% and the residue of ECM is 14.23%. It can be clearly seen that the ECM have better thermal stability.
Based on thermogravimetric analysis, it was proved that the ECM has good thermal stability in a certain range and could be used as absorbent material [40,41].

3.1.3. SEM Analysis

The morphology of ECM was studied by scanning electron microscope (SEM). As shown in Figure 4, the SEM images of ECM clearly show that the shapes of ECM are spherical, almost all of which were distributed in a broad range and had diameters between 30–180 nm. As shown in Figure 4c,d, many porous and network structures can be seen, which are caused by the volatilization of organic solvents. Finally, the polymer microspheres were obtained by the porogen, which was vaporized with the reaction temperature and raised further.
The existence of this special structure provides a large number of adsorption sites and specific surface area for the adsorption of benzoic acid and improvement of the adsorption capacity of ECM [42,43,44].

3.1.4. XRD Analysis

The XRD patterns for two materials (EC and ECM), which were collected in the 2θ range of 5–90°, are shown in Figure 5. X ray diffraction analysis showed that the EC and ECM are both amorphous structures. In Figure 5, 2θ = 8.4° and = 21° corresponding to the diffraction of ethyl cellulose. The diffraction peaks at 2θ = 8.4° and 21° are slightly enhanced for the ECM compared to EC, which indicate an increase in the crystallinity of the ECM prepared using EC. In addition, there were no new characteristic peaks that were generated in the XRD patterns of both EC and ECM, indicating that no new chemicals were generated. The results show that the preparation of ECM by solvent-evaporation phase-separation method is a physical process.

3.2. Adsorption Behaviour

3.2.1. Static Adsorption Experiments

The sample solutions after adsorption by EC and ECM for 24 h were quantitatively analyzed by HPLC. The contents of benzoic acid in the test solution before and after adsorption were compared. The results are shown in Figure 6. Changes in the contents of benzoic acid before and after adsorption in C. paliurus extract are clearly visible. It can be clearly seen from Figure 6 that ECM have strong adsorption for benzoic acid in the extract of C. paliurus. The results are attribute to the large number of micropores in ECM.

3.2.2. Adsorption Kinetics

Kinetic models were developed to elucidate the mechanism and rate of adsorption. The mechanism of adsorption depends on the physical and/or chemical characteristics of the adsorbent. To determine the adsorption mechanism of benzoic acid onto ECM absorbents, pseudo-first-order [45], pseudo-second-order [46], and intraparticle diffusion kinetic models were evaluated. These models are provided in the following equations:
Pseudo-first-order:
q t = q e ( 1 e K 1 t )
Pseudo-second-order:
q t = K 2 q e 2 t 1 + K 2 q e t
In these equations, qe and qt are the adsorption capacity at equilibrium and at any time t (mg/g of dry resin), respectively. The parameters K1 (min−1) and K2 (g/(mg min)) are the rate constants of the pseudo-first-order and pseudo-second-order for the adsorption process, respectively.
The adsorptive capacity was changed with adsorption time as shown in Table 2. First-order and second-order models of benzoic acid are shown in Figure 7. Model parameters obtained from nonlinear regression analysis are also shown in Table 2.
Kinetic curves in Figure 7 are the adsorption of benzoic acid on ECM absorbents at 25 °C. It is easy to discover from Table 3 and Figure 7 that the K values of the first-order are bigger than the second-order models. Moreover, the equilibrium adsorption capacity calculated by the pseudo-first-order kinetic model is closer to the actual equilibrium adsorption capacity of ECM. Thus, the adsorption behavior of ECM on benzoic acid conformed more with the first-order kinetic model. It shows that ECM adsorbs benzoic acid mainly through physical adsorption.

3.3. Desorption Performance Test

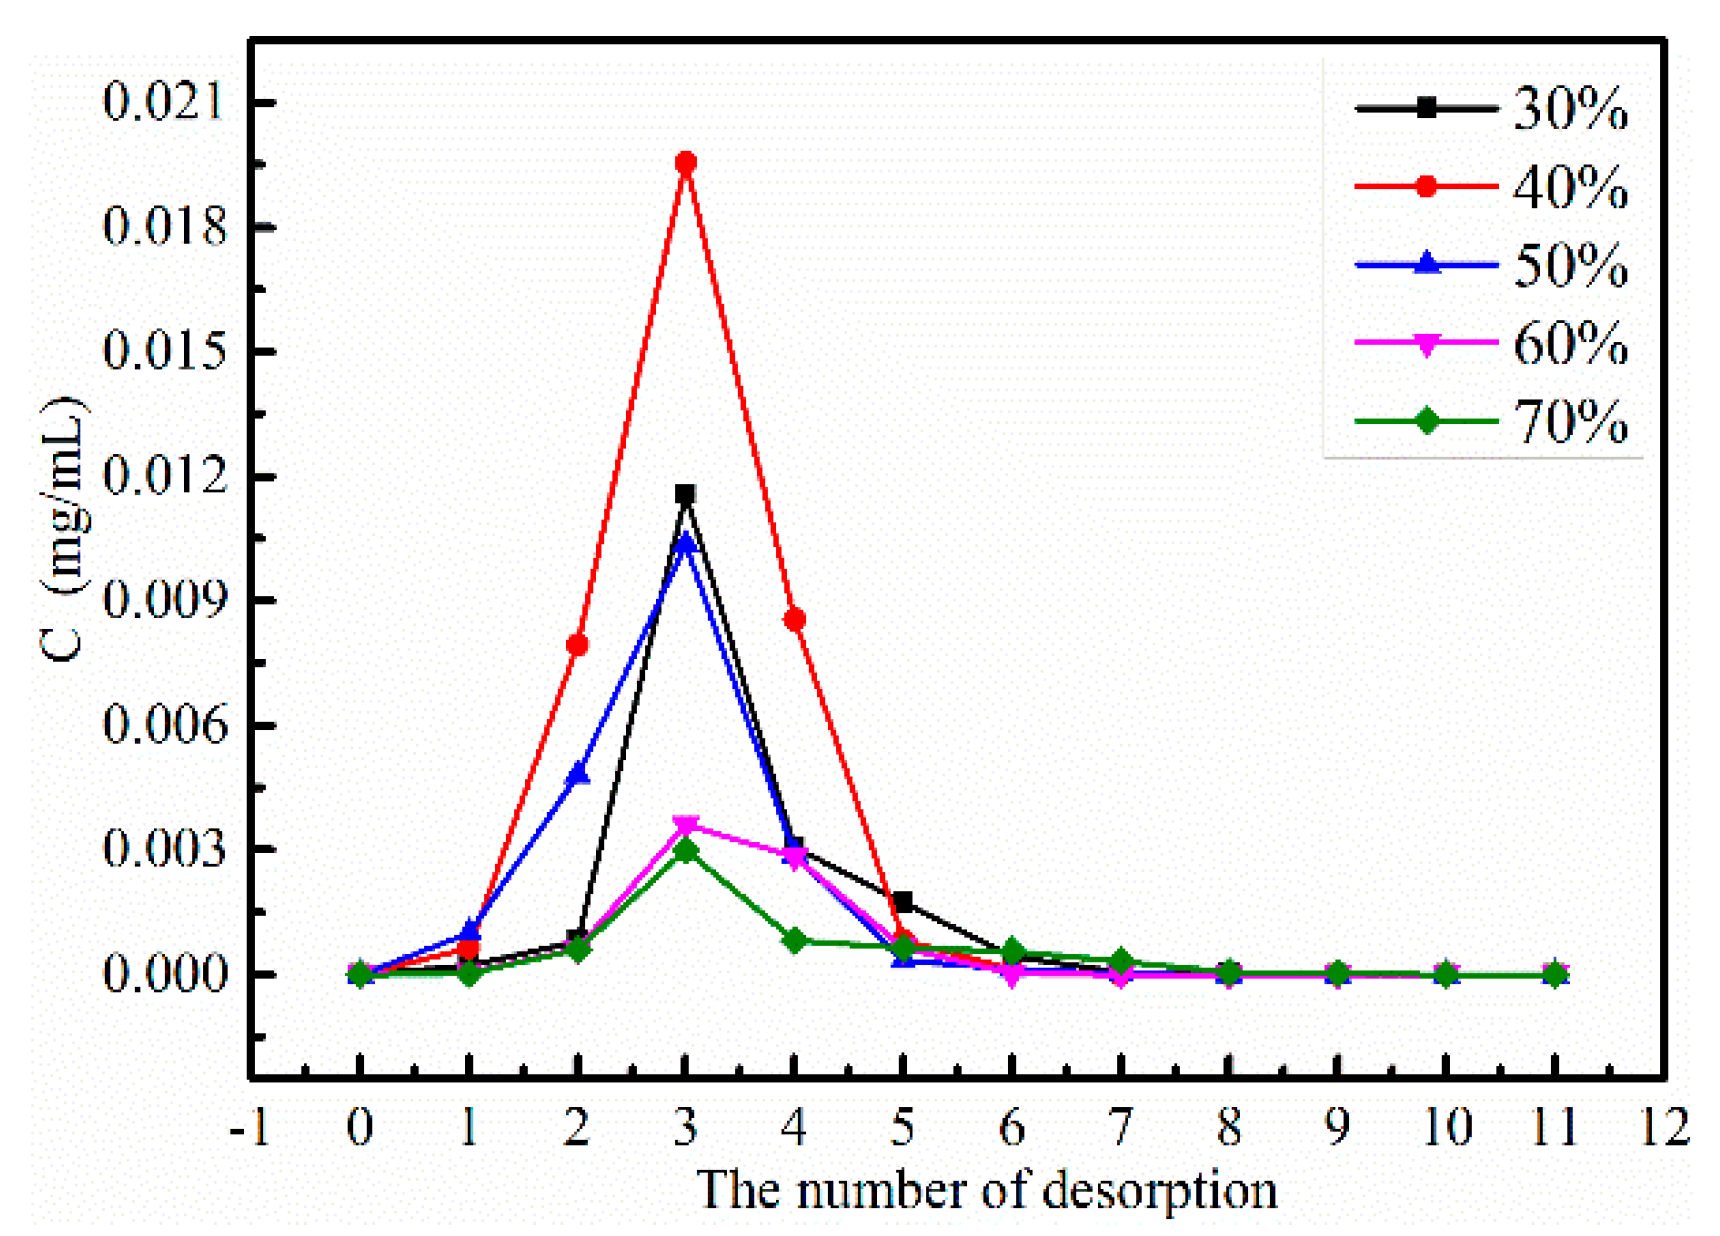
3.3.1. The Influence of Methanol Concentration on the Desorption Performance of Benzoic Acid

It can be clearly seen from Figure 8 that the concentration of methanol has a significant influence on the desorption experiment, and the optimal concentration of methanol desorption solvent is 40%, which is also caused by the hydrophilicity of benzoic acid.

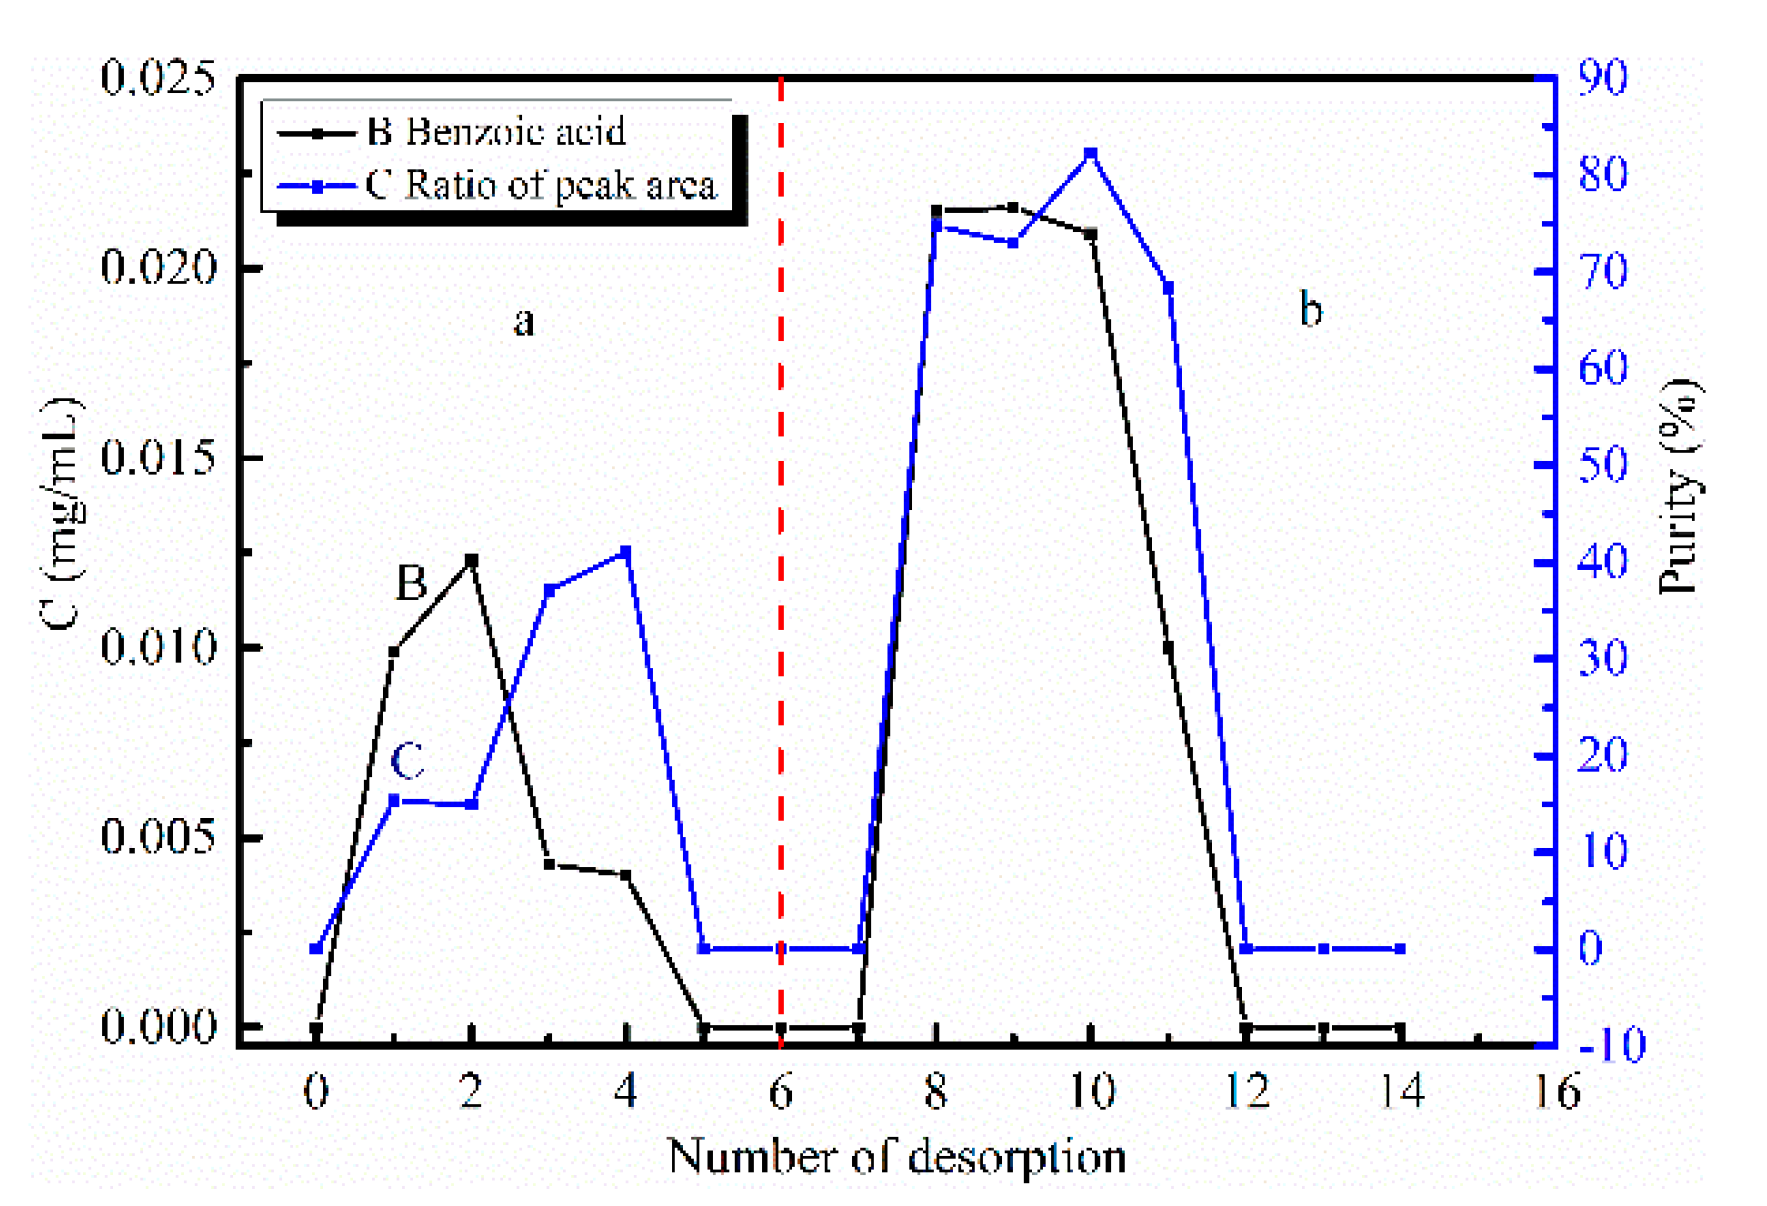
3.3.2. Desorption Curves of ECM

The test results of the desorption performance are shown in Table 4 and Figure 9. It can be clearly seen from Table 4 and Figure 10 that the ECM after the adsorption equilibrium was desorbed with 40% methanol solution [47]. The benzoic acid was obtained by desorption with a purity of up to 77.22%. At the same time, the desorption curves were obtained. The chromatograms of the initial sample and products of benzoic acid are shown in Figure 10. The product of benzoic acid comes from eluting components on ECM adsorbents with 40% methanol solution. Comparing with the initial sample, the benzoic acid was successfully and completely separated by using this methodology. ECM adsorbents exhibit a large adsorption capacity of about 5.066 mg/g towards benzoic acid.

4. Conclusions

In this study, ECM was prepared with EC by using the solvent-evaporation method. FTIR analysis confirmed that the hydroxyl, carboxyl, epoxy, and other oxygen-containing functional groups of ECM were increased compared with EC. SEM analysis showed many porous and reticular structures in ECM, which is due to the method of solvent-evaporation. TGA analysis confirmed that the thermal stability of ECM significantly enhances compared with EC. In addition, ECM have good thermal stability within a certain range.
The prepared ECM adsorbents were used as studied materials, in which adsorption behavior of benzoic acid was investigated. The adsorption of benzoic acid followed the pseudo-first-order kinetic model, which confirmed that the ECM adsorb benzoic acid in the extract of the C. paliurus is physically ideal. So the later elution of benzoic acid mainly depended on hydrophilia. After the adsorption equilibrium, the ECM was desorbed with 40% methanol solution and benzoic acid with a high purity of 82.22% was obtained. This method for the separation and purification of benzoic acid from C. paliurus extract was successfully established by ECM. The recovery of benzoic acid was more than 80%. The proposed method was lower cost, nontoxic, high efficiency, and is procedurally simple. It is believed that the advantages of the proposed method will facilitate its application in simultaneous separation and purification of active components that have similar polarity, different sizes of molecules, and are derived from the same natural products.

Supplementary Materials

The following material is available online at https://0-www-mdpi-com.brum.beds.ac.uk/article/10.3390/chemistry3040081/s1. Scheme S1: Chromatogram of benzoic acid standard.

Author Contributions

Conceptualization, Y.Z.; Investigation, X.Z. and M.L.; Resources, L.A. and L.C.; Software, L.S.; Supervision, Q.L. and P.Z.; Visualization, L.X.; Writing—original draft, L.Z. All authors have read and agreed to the published version of the manuscript.

Funding

This research received no external funding or This research was funded by [ the Fundamental Research Funds for the Central Universities of northwest Minzu university] grant number [31920180003, Yxm2019136, Yxm2020119, 31920190017, and 31920190018] And The APC was funded by [Ya-Min Zhao].

Institutional Review Board Statement

Not applicable.

Informed Consent Statement

Not applicable.

Data Availability Statement

Not applicable.

Acknowledgments

This work was supported by the Fundamental Research Funds for the Central Universities of northwest Minzu university (31920180003, Yxm2019136, Yxm2020119, 31920190017, and 31920190018).

Conflicts of Interest

The authors declare no conflict of interest.

References

  1. Espinosa, E.; Rol, F.; Bras, J.; Rodríguez, A. Production of lignocellulose nanofibers from wheat straw by different fibrillation methods. Comparison of its viability in cardboard recycling process. J. Clean. Prod. 2019, 239, 118083. [Google Scholar] [CrossRef]
  2. Tang, J.; Deng, J.Y. Preparation and Absorption Properties of Cellulose Modified by Graphene Oxide. J. Luzhou Univ. 2015, 17, 57–61. [Google Scholar]
  3. Michael, M.C.; Britta, S.; Anke, F.; Sakae, O.; Mark, T.; Shawn, K.; James, W.M. Physicochemical properties and mechanism of drug release from ethyl cellulose matrix tablets prepared by direct compression and hot-melt extrusion. Int. J. Pharm. 2004, 269, 509–522. [Google Scholar]
  4. Cai, W.; Yang, H.; Han, D.; Guo, X. A physical route to porous ethyl cellulose microspheres loaded with TiO2 nanoparticles. J. Appl. Polym. Sci. 2014, 131, 40822. [Google Scholar] [CrossRef]
  5. Basta, A.H.; Lotfy, V.F.; Micky, J.A.; Salem, A.M. Liquid crystal behavior of cellulose nanoparticle-ethyl cellulose composites: Preparation, characterization, and rheology. J. Appl. Polym. Sci. 2021, 138, 50067. [Google Scholar] [CrossRef]
  6. Iffat, W.; Shoaib, M.H.; Yousuf, R.I.; Qazi, F.; Mahmood, Z.A.; Muhammad, I.N.; Ahmed, K.; Ahmed, F.R.; Imtiaz, M.S. Use of Eudragit RS PO, HPMC K100M, Ethyl Cellulose, and Their Combination for Controlling Nicorandil Release from the Bilayer Tablets with Atorvastatin as an Immediate-Release Layer. J. Pharm. Innov. 2020. [Google Scholar] [CrossRef]
  7. Rowe, R.C. Molecular weight dependence of the properties of ethyl cellulose and hydroxypropyl methylcellulose films. Int. J. Pharm. 1992, 88, 405–408. [Google Scholar] [CrossRef]
  8. Akbuǧa, J. Furosemide-loaded ethyl cellulose microspheres prepared by spherical crystallization technique: Morphology and release characteristics. Int. J. Pharm. 1991, 76, 193–198. [Google Scholar] [CrossRef]
  9. Jalsenjak, I.; Nicolaidou, C.F.; Nixon, J.R. Dissolution from tablets prepared using ethyl cellulose microcapsules. J. Pharm. Pharmacol. 1977, 29, 169–172. [Google Scholar] [CrossRef]
  10. Shaikh, N.A.; Abidi, S.E.; Block, L.H. Evaluation of Ethylcellulose as A Matrix for Prolonged Release Formulations. I. Water Soluble Drugs: Acetaminophen and Theophylline. Drug Dev. Ind. Pharm. 2008, 13, 1345–1369. [Google Scholar] [CrossRef]
  11. Eszter, H.H.; Emese, B.; Mirella, M.; Andrea, F.K.; Tivadar, F. Preparation and in vitro characterization of valsartan-loaded ethyl cellulose and poly (methyl methacrylate) nanoparticles. RSC Adv. 2020, 10, 43915–43926. [Google Scholar]
  12. Feuser, P.E.; Bubniak, L.S.; Bodack, C.N.; Valério, A.; Silva, M.C.S.; Ricci-Júnior, E.; Sayer, C.; de Araújo, P.H.H. In Vitro Cytotoxicity of Poly (Methyl Methacrylate) Nanoparticles and Nanocapsules Obtained by Miniemulsion Polymerization for Drug Delivery Application. J. Nanosci. Nano. 2016, 16, 7669–7676. [Google Scholar] [CrossRef]
  13. Liu, Q.Q.; Xia, B.J.; Huang, J.; Liao, B.; Liu, H.; Ou, B.L.; Chen, L.; Zhou, Z.H. Hypercrosslinked polystyrene microspheres with ultrahigh surface area and their application in gas storage. Mater. Chem. Phys. 2017, 199, 616–622. [Google Scholar] [CrossRef]
  14. El-Say, K.M.; El-Helw, A.M.; Ahmed, O.A.A.; Hosny, K.M.; Ahmed, T.A.; Kharshoum, R.M.; Fahmy, U.A.; Alsawahli, M. Statistical optimization of controlled release microspheres containing cetirizine hydrochloride as a model for water soluble drugs. Pharm. Dev. Technol. 2015, 20, 738–746. [Google Scholar] [CrossRef]
  15. Lu, J.; Toy, P.H. Organic polymer supports for synthesis and for reagent and catalyst immobilization. Chem. Rev. 2009, 109, 815–838. [Google Scholar] [CrossRef]
  16. Cheu, S.J.; Chen, R.R.L.; Chen, P.F.; Lin, W.J. In vitro modified release of acyclovir from ethyl cellulose microspheres. J. Microencapsul. 2001, 18, 559–565. [Google Scholar] [PubMed]
  17. Kurihara, H.; Asami, S.; Shibata, H.; Fukami, H.; Tanaka, T. Hypolipemic effect of Cyclocarya paliurus (Batal) Iljinskaja in lipid-loaded mice. Biol. Pharm. Bull. 2003, 26, 383–385. [Google Scholar] [CrossRef] [Green Version]
  18. Shu, R.G.; Xu, C.R.; Li, L.N. Study on the sweetness components of Cyclobalanopsis sinensis. Acta Pharm. Sin. 1995, 10, 757–761. [Google Scholar]
  19. Xie, M.Y.; Li, L. Overview of the research on chemical constituents and biological activities of Cyclocarya chinensis. Chin. Herb. Med. 2001, 4, 79–80. [Google Scholar]
  20. Zheng, X.R.; Zhang, M.J.; Shang, X.L.; Fang, S.Z.; Chen, F.M. Stem Canker on Cyclocarya paliurus Is Caused by Botryosphaeria dothidea. Plant Disease 2020, 104, 1032–1040. [Google Scholar] [CrossRef] [PubMed]
  21. Sundberg-Kövamees, M.; Grunewald, J.; Wahlström, J. Immune cell activation and cytokine release after stimulation of whole blood with pneumococcal C-polysaccharide and capsular polysaccharides. Int. J. Infect. Dis. 2016, 52, 1–8. [Google Scholar] [CrossRef] [Green Version]
  22. Chen, J.J.; Ding, J.X.; Xu, W.G.; Sun, T.M.; Xiao, H.H.; Zhuang, X.L.; Chen, X.S. Receptor and microenvironment dual-recognizable nanogel for targeted chemotherapy of highly metastatic malignancy. Nano Lett. 2017, 17, 4526–4533. [Google Scholar] [CrossRef] [PubMed]
  23. Zhang, Y.; Lv, T.; Min, L.; Xue, T.; Hui, L.; Zhang, W.; Ding, X.; Zhuang, Z. Anti-aging effect of polysaccharide from Bletilla striata on nematode Caenorhabditis elegans. Pharmacogn. Mag. 2015, 11, 449–454. [Google Scholar] [PubMed]
  24. Li, Y.G.; Ji, D.F.; Zhong, S.; Lv, Z.Q.; Lin, T.B. Cooperative anti-diabetic effects of deoxynojirimycin-polysaccharide by inhibiting glucose absorption and modulating glucose metabolism in streptozotocin-induced diabetic mice. PLoS ONE 2013, 8, e65892. [Google Scholar] [CrossRef] [PubMed] [Green Version]
  25. Qin, D.; Yang, X.; Gao, S.; Yao, J.; Mcclements, D.J. Influence of hydrocolloids (dietary fibers) on lipid digestion of protein-stabilized emulsions: Comparison of neutral, anionic, and cationic polysaccharides. J. Food Sci. 2016, 81, C1636–C1645. [Google Scholar] [CrossRef] [PubMed]
  26. Xie, J.H.; Xin, L.; Shen, M.Y.; Nie, S.P.; Hui, Z.; Li, C.; Gong, D.M.; Xie, M.Y. Purification, physicochemical characterisation and anticancer activity of a polysaccharide from Cyclocarya paliurus leaves. Food Chem. 2013, 136, 1453–1460. [Google Scholar] [CrossRef] [PubMed]
  27. Wang, Y.R.; Cui, B.S.; Han, S.W.; Li, S. New dammarane triterpenoid saponins from the leaves of Cyclocarya paliurus. J. Asian Nat. Prod. Res. 2018, 20, 1019–1027. [Google Scholar] [CrossRef] [PubMed]
  28. Xie, J.H.; Xie, M.Y.; Nie, S.P.; Shen, M.Y.; Wang, Y.X.; Li, C. Isolation, chemical composition and antioxidant activities of a water-soluble polysaccharide from Cyclocarya paliurus (Batal.) Iljinskaja. Food Chem. 2010, 119, 1626–1632. [Google Scholar] [CrossRef]
  29. Xie, M.Y.; Xie, J.H. Review about the research on Cyclocarya paliurus (Batal.) Iljinskaja. Food Sci. Biotechnol. 2008, 27, 113–121. [Google Scholar]
  30. Li, Q.; Hu, J.; Xie, J.; Nie, S.; Xie, M.Y. Isolation, structure, and bioactivities of polysaccharides from Cyclocarya paliurus (Batal.) Iljinskaja. Ann. N. Y. Acad. Sci. 2017, 1398, 20–29. [Google Scholar] [CrossRef]
  31. Shang, X.; Tan, J.-N.; Du, Y.; Liu, X.; Zhang, Z. Environmentally-Friendly Extraction of Flavonoids from Cyclocarya paliurus (Batal.) Iljinskaja Leaves with Deep Eutectic Solvents and Evaluation of Their Antioxidant Activities. Molecules 2018, 23, 2110. [Google Scholar] [CrossRef] [Green Version]
  32. Liu, F.; Wang, Y.; Burkhart, T.A. Anti-inflammatory mechanism research of tanshinone II A by module-based network analysis. J. Bio-Med Mater. Eng. 2014, 24, 3815–3824. [Google Scholar]
  33. Thibault, L.; Emilie, D.; Caroline, W.; Eric, L. Supercritical Fluid Chromatography development of a predictive analytical tool to selectively extract bioactive compounds by supercritical fluid extraction and pressurised liquid extraction. J. Chromatogr. A 2020, 1632, 461582. [Google Scholar]
  34. Huang, K.J.; Wu, J.J.; Chiu, Y.H.; Lai, C.Y.; Chang, C.M.J. Designed polar cosolvent-modifified supercritical CO2 removing caffeine from and retaining catechins in green tea powder using response surface methodology. J. Agric. Food Chem. 2007, 55, 9014–9020. [Google Scholar] [CrossRef] [PubMed]
  35. Hao, J.Z.; Zhu, L.H.; Wang, H.; Si, T.; He, Y.P.; Sun, Y.L. Preparation of polymer microspheres with controllable structures and investigation of their inter-connecting properties. Chem. Ind. Eng. Prog. 2020, 39, 658–666. [Google Scholar]
  36. Peng, W.W.; Zhang, Z.Y.; Ji, C.J.; Li, B.; Wan, C.P.; Shangguan, X.C. Chemical constituents from the aerial part of Cyclocarya paliurus (Batal.) Iljinsk (Juglandaceae). Biochem. Syst. Ecol. 2018, 78, 110–112. [Google Scholar] [CrossRef]
  37. Li, Q.; Xie, B.; Wang, Y.; Peng, L.; Li, Y.; Li, B.; Liu, S. Cellulose nanofibrils from Miscanthus floridulus straw as green particle emulsifier for O/W Pickering emulsion. Food Hydrocolloids 2019, 97, 105214. [Google Scholar] [CrossRef]
  38. Jmel, M.A.; Anders, N.; Messaoud, G.B.; Messaoud, G.B.; Marzouki, M.N.; Smaali, I. The stranded macroalga Ulva lactuca as a new alternative source of cellulose: Extraction, physicochemical and rheological characterization. J. Clean. Prod. 2019, 234, 1421–1427. [Google Scholar] [CrossRef]
  39. Falkeborg, M.; Guo, Z. Dodecenyl succinylated alginate (DSA) as a novel dual-function emulsifier for improved fish oil-in-water emulsions. Food Hydrocoll. 2015, 46, 10–18. [Google Scholar] [CrossRef]
  40. Rodríguez, F.; Castillo-Ortega, M.M.; Encinas, J.C.; Grijalva, H.; Brown, F.; Sánchez-Corrales, V.M.; Castaño, V.M. Preparation, characterization, and adsorption properties of cellulose acetate-polyaniline membranes. J. Appl. Polym. Sci. 2009, 111, 1216–1224. [Google Scholar] [CrossRef]
  41. Castillo-Ortega, M.M.; Romero-García, J.; Rodriguez, F.; Nájera-Luna, A.; Herrera-Franco, P.J. Fibrous membranes of cellulose acetate and poly (vinyl pyrrolidone) by electrospinning method: Preparation and characterization. J. Appl. Polym. Sci. 2010, 116, 1873–1878. [Google Scholar] [CrossRef]
  42. Wu, J.H.; Wang, X.J.; Li, S.J.; Ying, X.Y.; Hu, J.B.; Xu, X.L.; Kang, X.Q.; You, J.; Du, Y.Z. Preparation of Ethyl Cellulose Microspheres for Sustained Release of Sodium Bicarbonate. Iran. J. Pharm. Res. 2019, 18, 556–568. [Google Scholar]
  43. Pérez-Martínez, J.I.; Morillo, E.; Maqueda, C.; Ginés, J.M. Ethyl cellulose polymer microspheres for controlled release of norfluazon. Pest Manag. Sci. 2001, 57, 688–694. [Google Scholar] [CrossRef] [PubMed]
  44. Lin, W.J.; Wu, T.L. Modification of the initial release of a highly water-soluble drug from ethyl cellulose microspheres. J. Microencapsul. 1999, 16, 639–646. [Google Scholar] [PubMed]
  45. Ho, Y.S. Citation review of lagergren kinetic rate equation on adsorption reactions. Scientometrics 2004, 59, 171–177. [Google Scholar]
  46. Ho, Y.S.; Mckay, G. Pseudo-second order model for sorption processes. Process Biochem. 1999, 34, 451–465. [Google Scholar] [CrossRef]
  47. Zhang, X.F.; Xu, Y.; Zhang, Q.; Cao, K.; Mu, X.N. Simultaneous separation and purification of (-)-epigallocatechin gallate and caffeine from tea extract by size exclusion effect on modified porous adsorption material. J. Chromatogr. B 2016, 1031, 29–36. [Google Scholar] [CrossRef]
Figure 1. Flow chart of preparation of ECM.
Chemistry 03 00081 g001
Figure 2. FTIR spectra of the EC and ECM.
Chemistry 03 00081 g002
Figure 3. TGA and DTG curves of EC (A) and ECM (B).
Chemistry 03 00081 g003
Figure 4. SEM of ECM under different magnifications. (a) Spectrum under 200 μm; (b) Spectrum under 100 μm; (c) Spectrum under 10 μm; (d) Surface channel diagram under 10 μm.
Chemistry 03 00081 g004
Figure 5. XRD patterns for EC and ECM.
Chemistry 03 00081 g005
Figure 6. Effect diagram of ECM (c) and EC (b) on 24 h adsorption of benzoic acid content (annotation: (a) is the sample before adsorption; (b) is the sample adsorption by EC; (c) is the sample adsorption by ECM).
Chemistry 03 00081 g006
Figure 7. Adsorption kinetic curves of benzoic acids onto adsorbents at 25 °C. (A) first-order kinetic curve; (B) second-order kinetic curve.
Chemistry 03 00081 g007
Figure 8. Effect of methanol concentration on desorption of benzoic acid.
Chemistry 03 00081 g008
Figure 9. Elution desorption curve on ECM absorbents.
Chemistry 03 00081 g009
Figure 10. HPLC profile of the samples after isolation through ECM adsorbents. (a) HPLC of C. paliurus extract before adsorption; (b) after the desorption by ECM after adsorption.
Chemistry 03 00081 g010
Table 1. Gradient elution conditions.
Time (min)Mobile Phase B (%)Mobile Phase C (%)
0.015.085.0
5.020.080.0
10.024.076.0
19.029.071.0
20.030.070.0
22.531.069.0
23.031.568.5
25.032.068.0
28.032.567.5
31.033.566.5
Table 2. Changes in adsorption time and adsorption amount.
Adsorption Time (min)Peak AreaAdsorptive Capacity (mg/g)
075.80
1570.20.81
30661.51
45582.74
6055.73.1
12038.85.71
18027.67.44
24022.37.90
30019.67.90
42019.27.89
54019.27.89
66019.27.89
72019.27.89
Table 3. Kinetic parameters of benzoic acids adsorption onto adsorbents at 25 °C.
Pseudofirst-Order-ModelPseudosecond-Order-Model
Adsorbentsqe (exp)
(mg/g)
K1
(min−1)
qe
(mg/g)
R2K2
(g/mg min)
Qe (cal)
(mg/g)
R2
7.8900.0098.1430.98480.00119.65940.9556
Table 4. The influence of the number of desorption on the content of benzoic acid in desorption solution.
StageNumber of TimesPeak AreaRatio of Peak AreaC (mg/mL)
a0000
178.215.3580.0099
290.814.9320.0123
347.737.1440.0043
446.441.0710.0040
5000
6000
b1140.874.7870.0215
214172.9870.0216
3137.482.2270.0209
478.868.3800.0100
5000
(annotation: a is stage of rinse; b is stage of desorption).
Publisher’s Note: MDPI stays neutral with regard to jurisdictional claims in published maps and institutional affiliations.

