1. Introduction
Herbs are plants with sedative and stimulating effects in their odor that are used for flavoring food, preservatives, medicines, perfumes, insect repellents, and so forth. Plants that can be used as internal or external medicines, particularly those that are useful for odor control, antiseptic, insect control, etc., and those that are aromatic and have sedative or stimulant effects in their scent have been widely enjoyed by people throughout history [
1]. Furthermore, as it was assumed that miasma (bad air) was the cause of illness until modern times; the scent of herbs has been effectively used in medicine in the form of sachets, pomanders, and potpourri [
2], to prevent illnesses with strong scents [
3].
Odor evaluation of foods containing herbs and fragrances in the environment is conducted by experts using sensory tests. Thus, there are many training courses and qualifications to distinguish and evaluate herbs. However, the human ability to smell scents is limited; for example, the type and number of olfactory receptors present varies from person to person. Since olfactory signals are integrated spatially and temporally in the brain, people hardly remember odors and have difficulties to objectively identify fragrances [
4]. The electronic nose, on the other hand, can analyze the characteristics of fragrances in an integrated manner based on the patterns of reactions with fragrance components using a variety of sensors [
5]. In fact, it has been demonstrated that essential oils from medicinal herb plants can be examined for differences using this method [
6].
Previously, we clarified the characteristics of the differences in coffee aroma based on the method of studying the aroma of a wine by using an electronic nose which is provided with sharp sensors [
7]. This method has also been used to identify yeast growth [
8], differences in mushroom aroma [
9], and differences in individual flowers [
10]. These studies have demonstrated that by detecting scents with sensors and storing the absolute value of their reactivity in a computer, the electronic nose is excellent at comparing the detected scents beyond the spatial and temporal constraints that are the weak side of humans.
In this paper, the scents of 15 herbs used as teaching materials for medical herbal aroma testing were recorded using an electronic nose to determine: (1) the extent of similarity between each scent and the scents used to judge wine aroma, (2) when the aroma of each herb is used as a standard, whether the aroma characteristics of other herbs can be described by their similarity to these 15 herbs, and (3) how the results of this method are different from those obtained by the gas chromatography–mass spectrometry (GC-MS) method [
11], which is commonly used to identify quantities and molecules of high boiling point aroma compounds, mainly carbon components.
2. Materials and Methods
A scent sensor device FF-2A (Shimadzu Corporation, Kyoto, Japan), equipped with 10 different oxide semiconductor sensors with different characteristics [
12,
13] was used to identify the aroma of the herb in a pattern. According to manufacturer’s protocol, these sensors were calibrated with nine reference gases (hydrogen sulfide, Methylmercaptan, Ammonia, Trimethylamine, propionic acid, Butylaldehyde, Buthylacetate, Toluene, and Heptane) before measurement. Smell groups and possible descriptors of respective gas and method are described previously [
10]. The ten sensors on the machine were given names from CH1 to CH10, respectively, and the reaction of the sensor with fragrance was recorded by measuring the resistance (-log10 (peak/base)) of each sensor. The electrical resistance values of three indicated concentrations of standard gases (hydrogen sulfide and Ammonia; 1, 3, and10 ppm) and one indicated concentration of each standard gas (Methylmercaptan, Trimethylamine, Butylaldehyde and Butylacetate; 1 ppm, propionic acid; 2 ppm, heptane and toluene; 3ppm) were recorded for three sampling times (6 s, 18 s, and 60 s) in three measurements each and used for drawing standard concentration-resistance curves. The sampling rate was 165 mL/min.
For medicinal herbs, we used 15 kinds from a set of standard samples utilized and distributed by the Japan Medical Herb Association [
14], a non-profit corporation, as teaching materials for medical herb examination. The following herbs were used: 1. Mallow (
Malva sylvestris), 2. German Chamomile (
Matricaria chamomilla), 3. Hibiscus (
Hibiscus sabdariffa), 4. Peppermint (
Mentha piperita), 5. Linden (
Tilia europaea), 6. Echinacea (
Echinacea purpurea), 7. Elder (
Sambucus nigra), 8. St.John’s Wort (
Hypericum perforatum), 9. Dandelion (
Taraxacum officinale), 10. Nettle (
Urtica dioica), 11. Passionflower (
Passiflora incarnata), 12. Mate (
llex paraguayensis), 13. Mulberry (
Morus alba), 14. Raspberry Leaf
(Rubus idaeus), and 15. Rose Hip (
Rosa canina).
Measurements were performed immediately after opening the distributed bags of medicinal herbs and 0.3 g of the herbs were placed in a 2 L polyethylene terephthalate (PET) bag (Shimadzu Corporation), which was then immediately filled with odorless nitrogen. The PET bags were allowed to stand for 15 min, keeping it airtight, and then the gas containing the fragrance was measured with the FF-2A.
It is possible to obtain data in two ways with FF-2A in a single measurement protocol: a direct method (direct mode), in which the sensors directly measure the fragrance components, and an adsorption method (capture mode), in which the fragrance components are concentrated in a collection tube and then introduced into the sensors by heating [
15]. The adsorption method can be used to obtain data containing high boiling point volatiles that are difficult to be measured in their present state. The measurements were carried out four times, and the first sensor value, which was easily affected by the preceding measurement, was excluded from the measurement data to control the variation of the sensor values during analysis. Statistical analysis was performed using SPSS17 (IBM). The standardized data obtained in this study were analyzed as non-parametric data. Hierarchical clustering classification is a method of grouping samples by numerical similarity and is one of the techniques used when there is little information about the groups to be classified or the number of groups. In this study, we used the Ward method, which has high classification sensitivity in cluster analysis, to classify and display a dendrogram.
For the wine aromas, we used the 52 aromas from the aroma kit Le Nez du Vin. These were as follows: 1. Abricot (Apricot), 2. Acacia, 3. Amande amère (Almond), 4. Ananas (Pine apple), 5. Anis, 6. Aubépine (Hawthorn), 7. Banane (Banana), 8. Beurre (Butter), 9. Cacao, 10. Cannelle (Cinnamon), 11. Café (Coffee), 12. Caramel, 13. Cassis (Black currant), 14. Cerise (Cherry), 15. Champignon (Mushroom), 16. Chêne (Oak), 17. Citron (Lemon), 18. Civette (Chive), 19. Coing (Quince), 20. Eglantine (Wild rose), 21. Foine coupé (Hay), 22. Fougère (Fern), 23. Fraise (Strawberry), 24. Framboise (Raspberry), 25. Fumé, 26. Géranium, 27. Girofle (Clove), 28. Goudron (Tar), 29. Iode (Iodine), 30. Muscat, 31. Menthe (Mint), 32. Mercaptan, 33. Miel (Honey), 34. Musc (Musk), 35. Noisette (Hazelnut), 36. Noix (Walnut), 37. Orange, 38. Pivoine (Peony), 39. Pin (Pine), 40. Poire (Pear), 41. Poivre (Pepper), 42. Poivron-vert (Green pepper), 43. Pomme (Apple), 44. Prune, 45. Rose, 46. Soufre (Sulfur), 47. Thyme, 48. Tilleul (Lime), 49. Truffe (Truffle), 50. Vanille, 51. Viollete (Violet), and 52. Vinaigre (Vinegar). We did not use aromas of Bouchon and Réglisse.
For the calculation of the similarity between the aroma vectors of the medicinal herbs and wine, we used clustering analysis (average linkage method between groups) by SPSS17 (IBM) and the user mode (Medium) analysis by Asmell2 (Shimadzu Corporation), which is a similarity analysis software that calculates the similarity from the vector angle information of the measured values. For more information, refer to the description of the previous study [
7].
To create an aroma axis for 15 medicinal herbs, the concentration time in the collecting tube was varied (6, 18, and 60 s), and by three measurements each, a new reference axis for each herb was hypothetically created [
8,
9,
16], then the similarity between this axis and the herbs in tea bags marketed as tea was calculated.
The herbal tea samples to be measured were La Pomme (apple), Melange (citrus fruits and vanilla), and Morning (Ceylon and Assam) (FAUCHON, Paris, France; distributed by S&B Foods Inc. Tokyo, Japan). In addition to using the electronic nose, these samples were also measured by putting 0.3 g of tea leaves directly into a 2 L PET bag and immediately filling the same with odorless nitrogen, and then conducting analysis using a GC-MS (Agilent 7890A GC system) to examine the molecules of the components detected as peaks.
3. Results
We investigated the degree to which the fragrance of each medicinal herb responded to the ten sensors of the electronic nose.
Figure 1A shows the results of three measurements in direct mode and
Figure 1B shows those obtained in capture mode. These two measurements can be performed at the same time with FF-2A. All the herbs were generally responsive to channels (CH) 2, 3, 7, 8, and 10 of the total 10 sensors, and less responsive to channels 1, 4, and 9. In direct mode, Mate was less responsive in many channels, whereas in a number of channels St. John’s Wort tended to be generally more responsive, but Peppermint was much more responsive than the other herbs in CH5. The reactivity of Peppermint was significantly different from that of other herbs and was higher compared to other herbs especially in channels 2, 6, 7, 8, and 10 in capture mode. Unlike other herbs, Peppermint was found to be more reactive in capture mode than in direct mode, even in CH1 and CH4, which do not react readily with the fragrance of other herbs. However, in CH9, no increase in reactivity was observed in the capture mode compared to the direct mode.
Thus, it was found that among the herbs selected as teaching materials for medicinal herbs, there were not only those that showed different reactivity to the sensors, such as Peppermint and Mate, but also those that showed similar reactivity, such as Linden and Raspberry Leaf, or Hibiscus and Elder. Therefore, we performed a cluster analysis to understand what level of proximity hierarchy these 15 herbs actually display when compared to each other in terms of fragrance as measured by the electronic nose.
A dendrogram was created as illustrated in
Figure 2A using the values measured by direct method. The figure indicates that there are fragrances that form a cluster of similar scents such as the group consisting of Hibiscus, Rose Hip, and Elder group; Linden, Raspberry Leaf, and Mulberry; and Nettle, Passionflower, and Echinacea. The scent of the group consisting of Hibiscus, Rose Hip, and Elder and the scent of German Chamomile were found to be similar and the scent of the group consisting of Linden, Raspberry Leaf, and Mulberry group and that of the group consisting of Nettle, Passionflower, and Echinacea were also proved to be similar. Furthermore, Peppermint and Mate were very different from the other fragrances. Two of the herbs in this set, Rose Hip and Raspberry Leaf, belong to the Rosaceae family, but the rest are plants of different taxonomic origin. It can be seen that herbs from the same family do not necessarily have fragrances that are close to each other when measured by this method. The dendrogram created from the results of capture method was shown in
Figure 2B. This dendrogram was different from the one by direct mode, as it demonstrated that scent of the peppermint was different from the scent of other herbs, and group of mate and rose hip also had the different scent from other groups. The cluster of groups was as well different from those produced by direct method. The direct mode is suitable for measurement of low molecular weight substances under conditions where nitrogen is not purged to the collecting tube. On the other hand, capture mode is suitable for the analysis of high boiling point components, where the components are collected in a collecting tube, nitrogen is purged to remove water and concentrate, and the collected components are heated and released. More specifically, after capturing sample’s components on a carbon graphite trap tube in the FF-2A for 30 s at 40 °C, heat-induced separation was performed by increasing the temperature to 220 °C, and then the resistance values were measured. These procedures were default setting for optimal measurement condition for sensors in FF-2A. Since the results of these two modes differ prominently, the following analysis of the experimental results was performed including both modes.
FF-2A allows creating new virtual reference axis from the gas values measured at different concentrations of the standard fragrance samples, and by projecting the values of other fragrances onto that axis, the similarity to those samples can be calculated. Using this method and based on the application of the wine aroma kit Le Nez du Vin, we have previously shown that the aroma of drip coffee is different from that of canned coffee, and similar to that of pine and honey [
7]. As the aroma kit contains many fragrance samples and can be used as a standard indicator to distinguish slight differences in wine by the human nose, we assumed that it is appropriate to describe herbal fragrances as well, and therefore examined which fragrances of each medicinal herb were similar to those in the aroma kit.
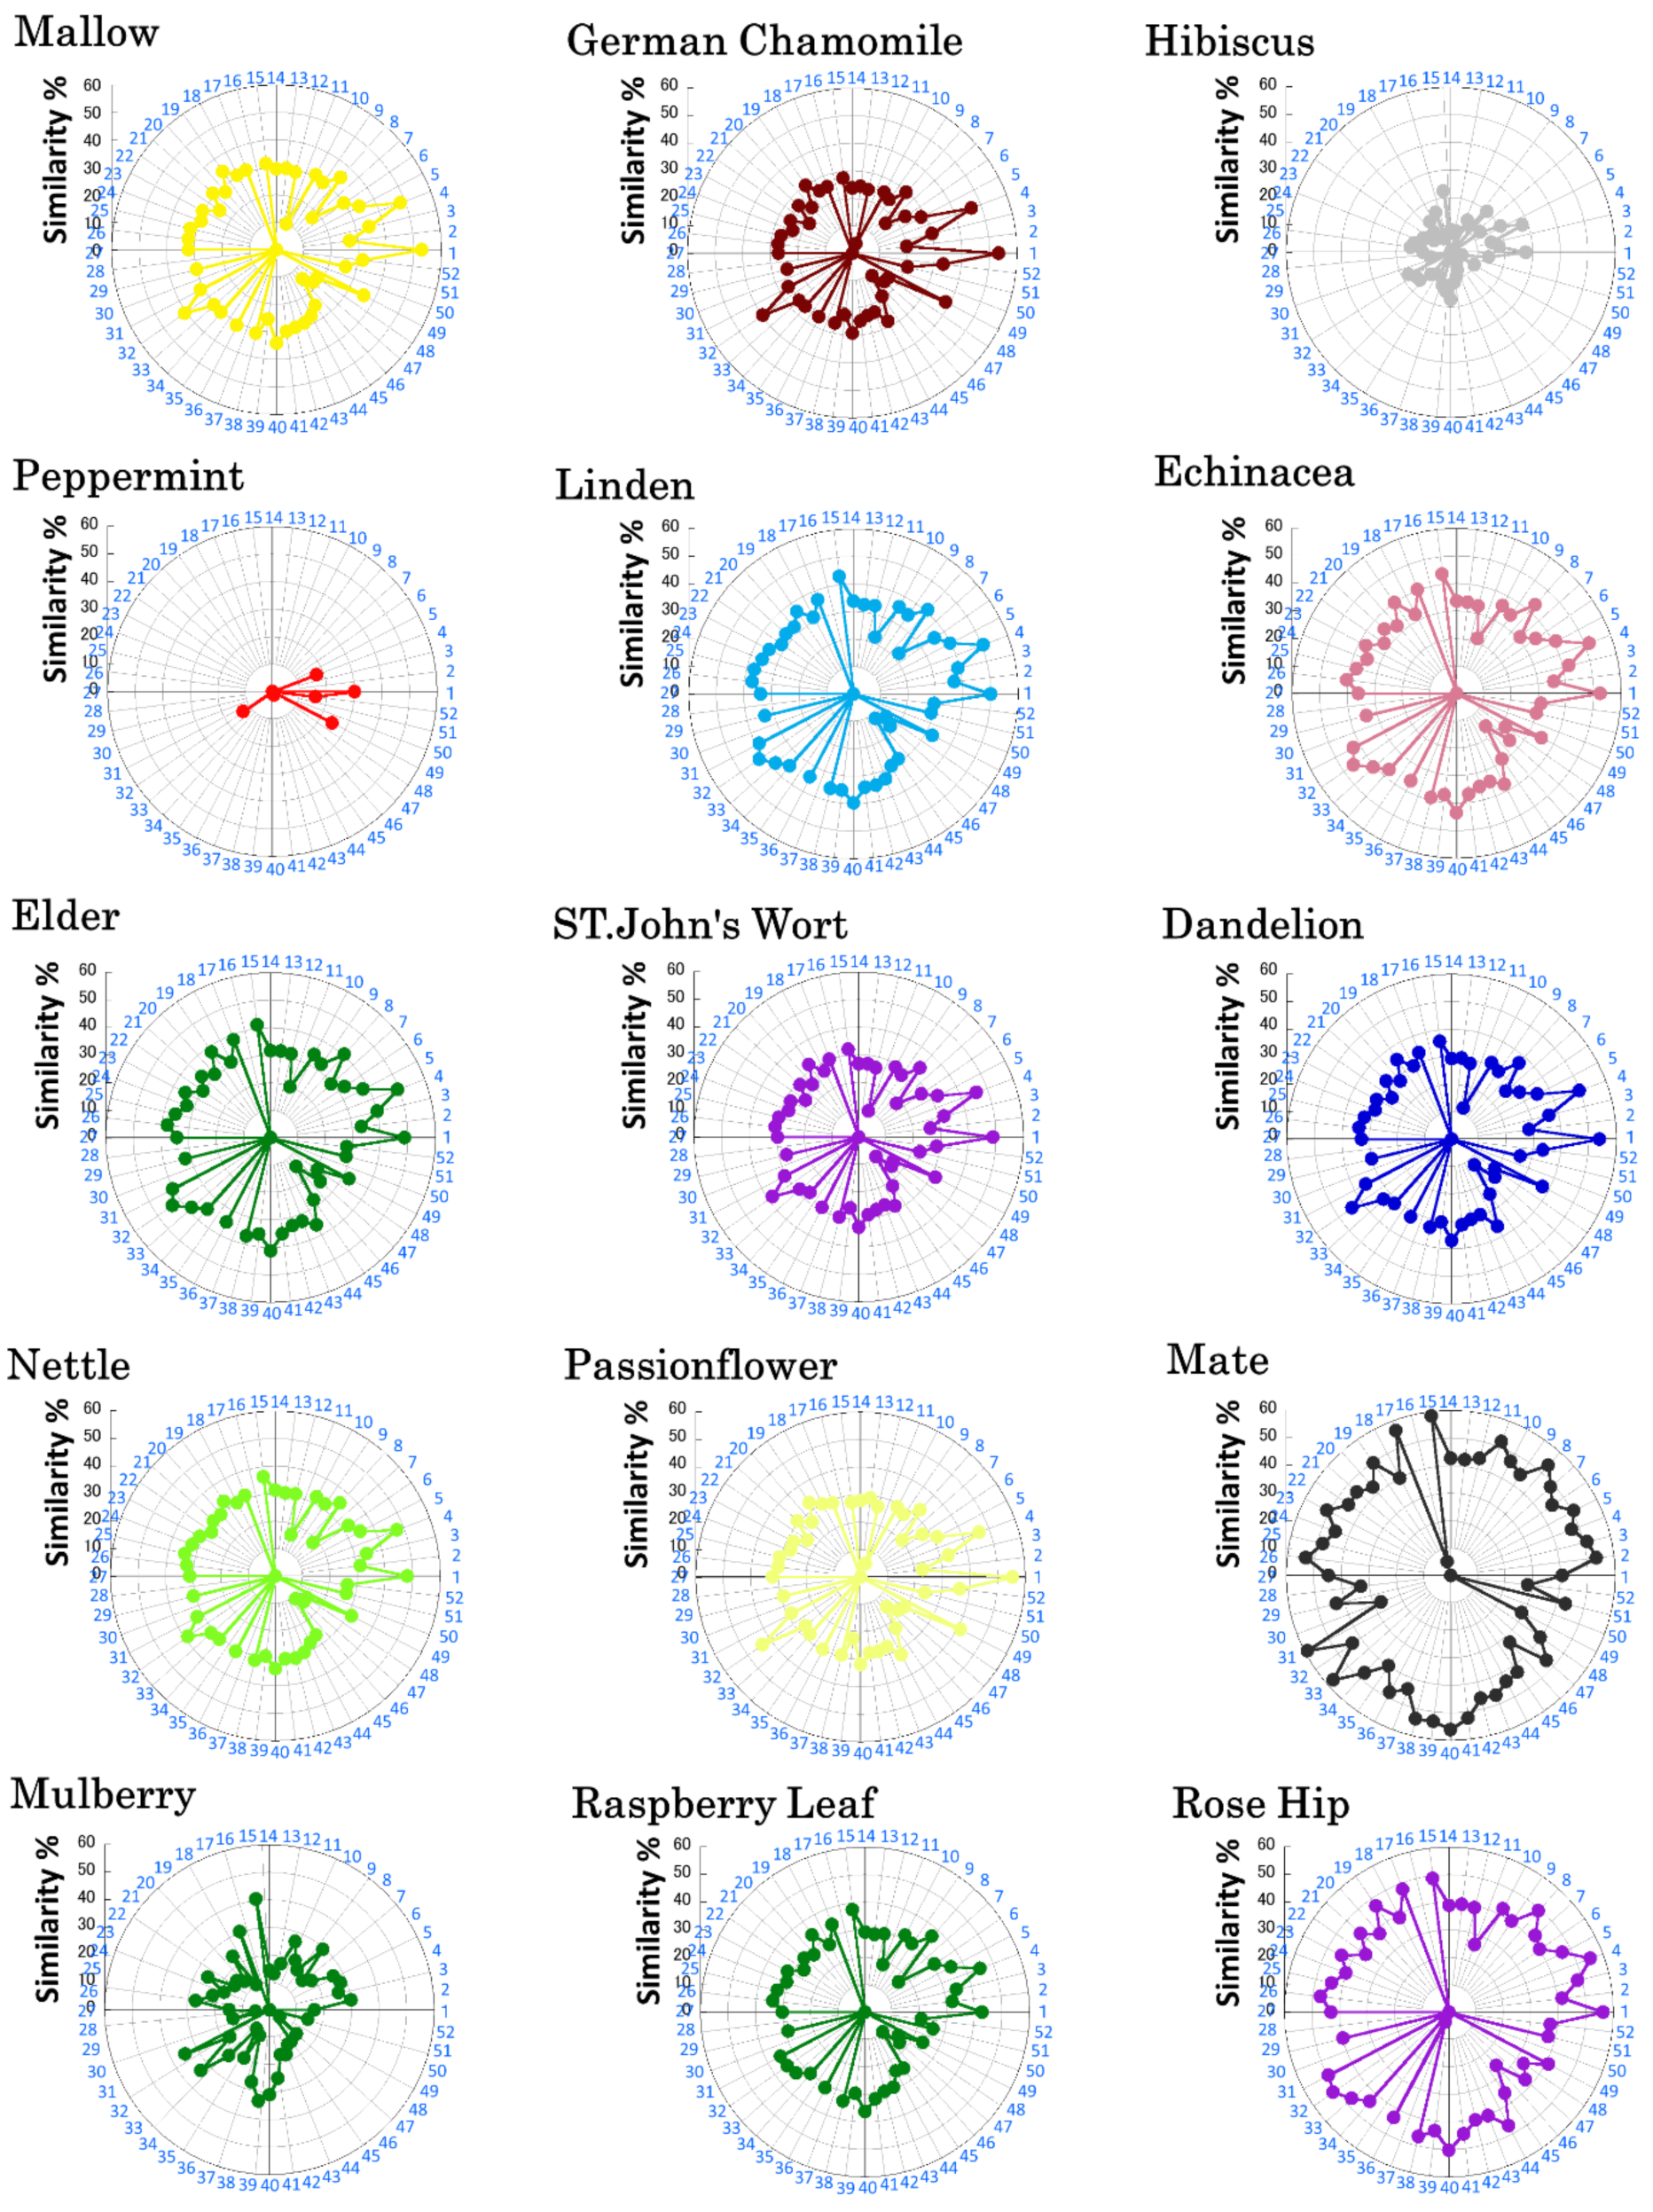
Figure 3 shows the similarity of each herb to the 52 fragrances in the aroma kit. The similarity was calculated by measuring the fragrance three times in repetition, and this graph uses the third measurement in both direct mode and capture mode, when the sensor values seemed to have stabilized during the analysis. This method is recommended by the Shimadzu Corporation. Each of the 52 aromas is shown as a separate point on the circle of the graph in blue letters, and the similarity (%) to the herb is shown as the distance from the center of the pie chart. The similarity axis is shown in black text between 0% and 60%, as none of the herbs showed a similarity exceeding 60% to the scents in the aroma kit. The numbers 1–52 number the fragrances in the aroma kit, and each number indicates which aroma is represented in the description of the given diagram. Of the aroma kits, Vanilla showed the lowest degree of similarity to the herbal fragrances. No herb showed any correlation with this axis (0%). The next least similar aroma was Chêne and Muscat, which showed no similarity to any of the herbs except Mate. Goudron, Noisette, and Orange were also dissimilar to herbal fragrances, with Goudron and Noisette having similarity only to Mate and Mulberry, and Orange having similarity only to Mate, Mulberry, and Rose Hip. These results demonstrate that Chêne, Muscat, Goudron, Noisette, and Orange aromas of wine are not similar to the aromas of herbs. The other aromas exhibited similarity to the herbal scents to varying degrees.
Considering the similarity of the herb aromas, Mate and Rose Hip were found to have high similarity with a number of wine aromas. Mate showed similarity to the aromas of Chêne, Muscat, Goudron, Noisette, and Orange, which have low similarity to many herbs, and exhibited a similarity of 30% or more to the aromas of Café and Soufre, which have less than 30% similarity to other herbs. Compared to these herbs, Hibiscus and Peppermint showed less similarity to many aromas, and Peppermint in particular showed 0% similarity to aromas other than Abricot, Ananas, Mercaptan, Prune, Truffe, and Vinaigre, suggesting that it is an herb with a unique aroma.
Next, we measured the aroma of three herbal teas available on the market by creating independent hypothetical axes of the 15 herbal aromas by reacting them for different times so that we could examine the similarity of these 15 herbal aromas to other different herbs. The results are shown in
Figure 4.
As shown in the previous figure, the degree of similarity with the herb aroma is indicated by blue letters on the circle of the graph. In this figure the similarity axis is displayed between 0% and 100% in the graph because the similarity between the aromas of the herbal tea and herbs was higher than between the aromas of herbs and wine. The results show that La Pomme has more than 45% similarity with any herb, especially to Dandelion, with more than 85% similarity. Conversely, Melange was less similar to Dandelion and was most similar to Echinacea, with a similarity exceeding 85%. The package of Melange was labeled citrus fruits & vanilla, which was very different in aroma from La Pomme tea leaves, which was labeled as apple on the packaging. Morning was labeled as Ceylon and Assam, indicating that it was a fermented tea, and showed a similarity pattern that was different from either La Pomme or Melange. Original data of
Figure 1,
Figure 3 and
Figure 4 are available from
Supplementary Materials.
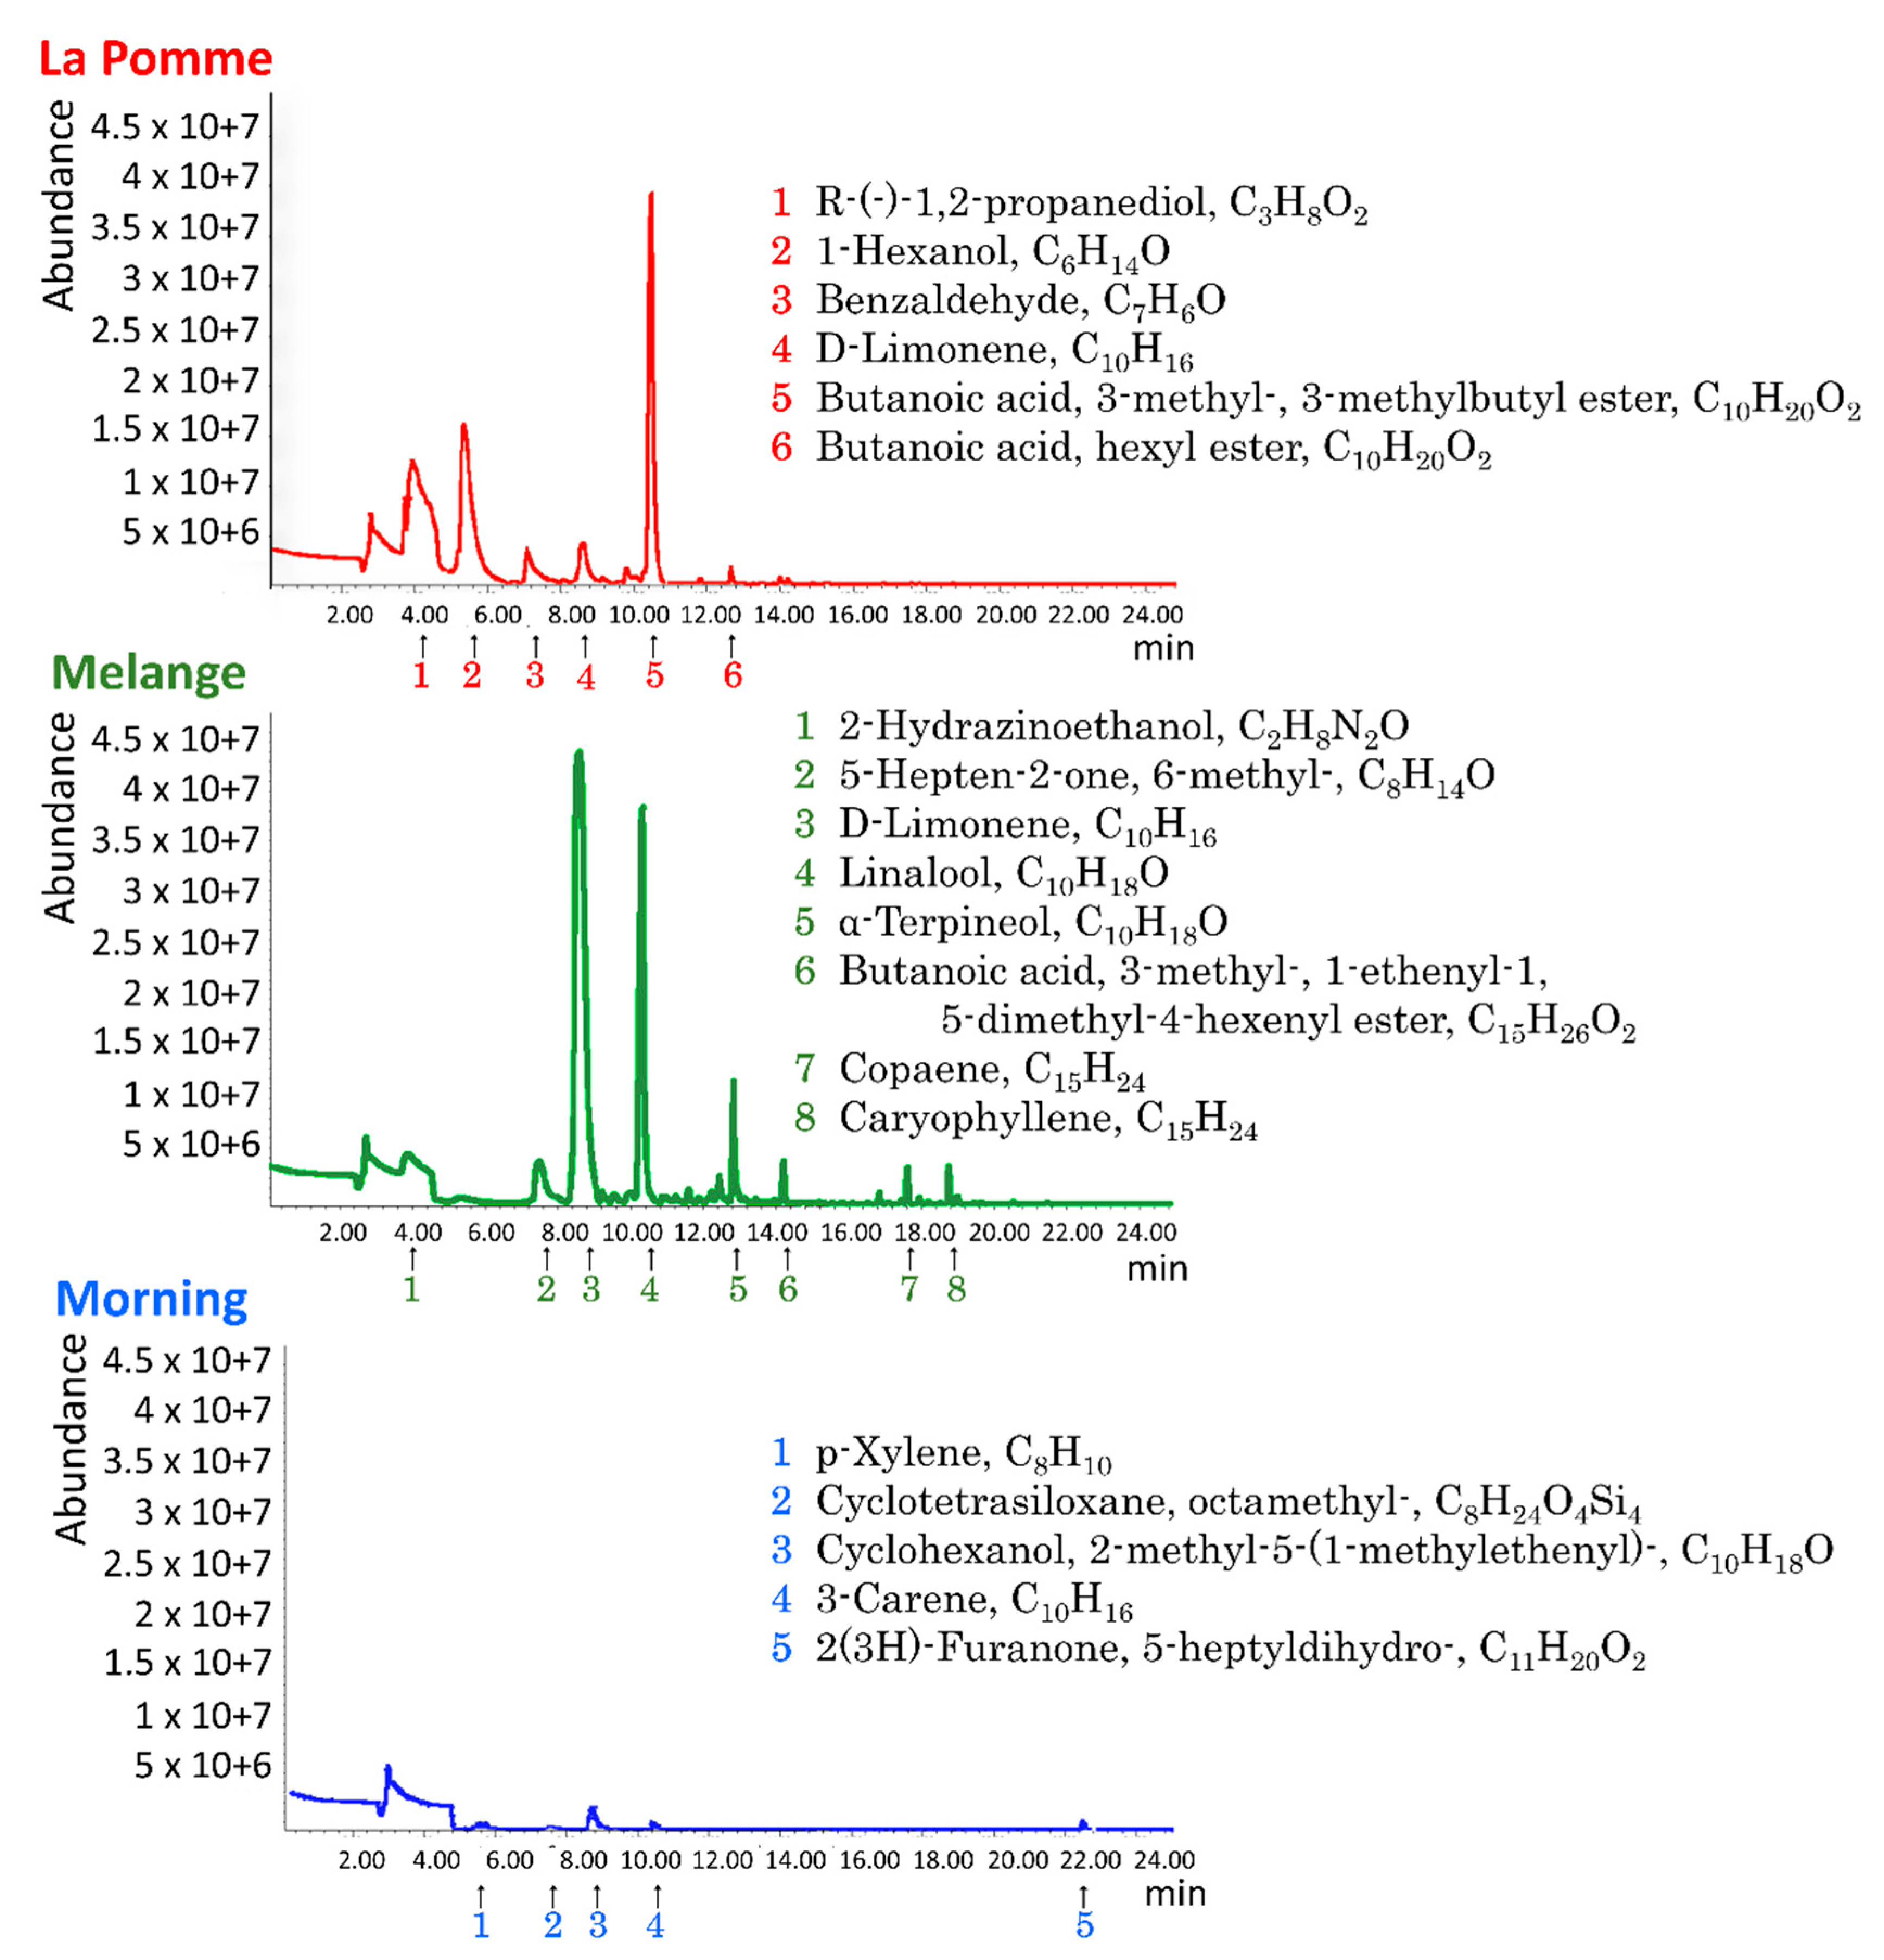
GC-MS analysis was performed to determine the abundance of the components volatilized from the herbs of these three teas, and several peaks were observed, as shown in
Figure 5. The type of molecules volatilized were different among the three herbal teas, with butanoic acid and 3-methyl-, 3-methylbutyl ester being the most abundant in La Pomme (apple), followed by a high peak of 1-hexanol. Cumulatively, Butanoic acid and 3-methyl-, 3-methylbutyl ester is commonly known as apple oil or apple essence. In Melange (citrus fruits and vanilla), the highest peak was D-limonene, and the peak of linalool was also high. In Morning (Ceylon and Assam), there were no peaks as high as those of La Pomme and Melange, but we found some molecules that were different from those in other herbal teas, such as cyclohexanol, 2-methyl-5-(1-methylethenyl)-, and 2(3H)-furanone, 5-heptyldihydro-. A large number of peaks are observed in Melange, which may be due to the fact that the tea leaves are a mixture as the name suggests. The abundance of fragrance molecules measured by GC-MS was higher in La Pomme and Melange, but the lowest in Morning.
4. Discussion
Similar to humans, an electronic nose uses sensors to detect fragrances and records the reaction to the sensor as a pattern, which makes the evaluation of fragrances closer to the sensory evaluation traditionally undertaken by humans.
FF-2A includes an algorithm that can numerically register and pattern the aroma of a sample by comparison with predetermined reference gases. This method is suitable for the quantitative estimation of efficiently classifying the recorded fragrance because it can standardize the recorded scent as an absolute value. The similarity expression method is a quantification method for fragrances developed by Shimadzu Corporation. In the standard mode of the ASmell2 software, it uses the vector angle between the sensor values for the reference gases and the sample to numerically express to which reference gases the scent of the sample is similar. The default reference gases are of hydrogen sulfide, sulfur-based substances, ammonia, amines, organic acids, aldehydes, esters, aromatics, and hydrocarbons [
8]. As this method can measure and objectively record the quality (similarity to reference gases) and the intensity (odor index equivalent) of odors in the environment, the device has been adopted as an ISO-17299 deodorant test method and has a proven track record for the determination of complex odors.
The results of this study revealed that when measuring 15 medicinal herbs with a 10-channel sensor, there are channels that are less responsive to all herbs, such as channel 4 and 9. Although the details of the on-board sensors for each channel of the FF-2A have not been published [
16], the channels that were less reactive to all herbs were considered to be less reactive to the molecules released by majority of the herbs, and from a global perspective, the channels that responded to the medicinal herbs showed similar reactivity, suggesting that the herbs themselves emit a similar pattern of fragrances.
In the standard mode of FF-2A, odors that are unpleasant to humans are also measured. Therefore, to compare pleasant fragrances such as herbs, it is necessary to test the measurement using standard gases without unpleasant odors. As more than 50 pleasant scents are used in wine aroma kits to regulate the senses of sommeliers, the aroma axes can be used to determine which scents are similar to the herbs. We were able to find out the similarity of each herb to the scent of any aroma kit using this method. The advantage of calculating the similarity to represent the characteristics of the fragrance of herbs is that it is very helpful to compare data such as in
Figure 1, where it is difficult for humans to intuitively perceive the difference in values and understand the difference in fragrance based on our senses. Furthermore, in this study, we measured the aroma of 15 medicinal herbs by varying the concentration time in the collecting tube, and by creating an axis of these herbs, we showed the similarity of the aroma of commercial herbal tea to the aroma of each herb. The capability to achieve this task is a major advantage of the FF-2A.
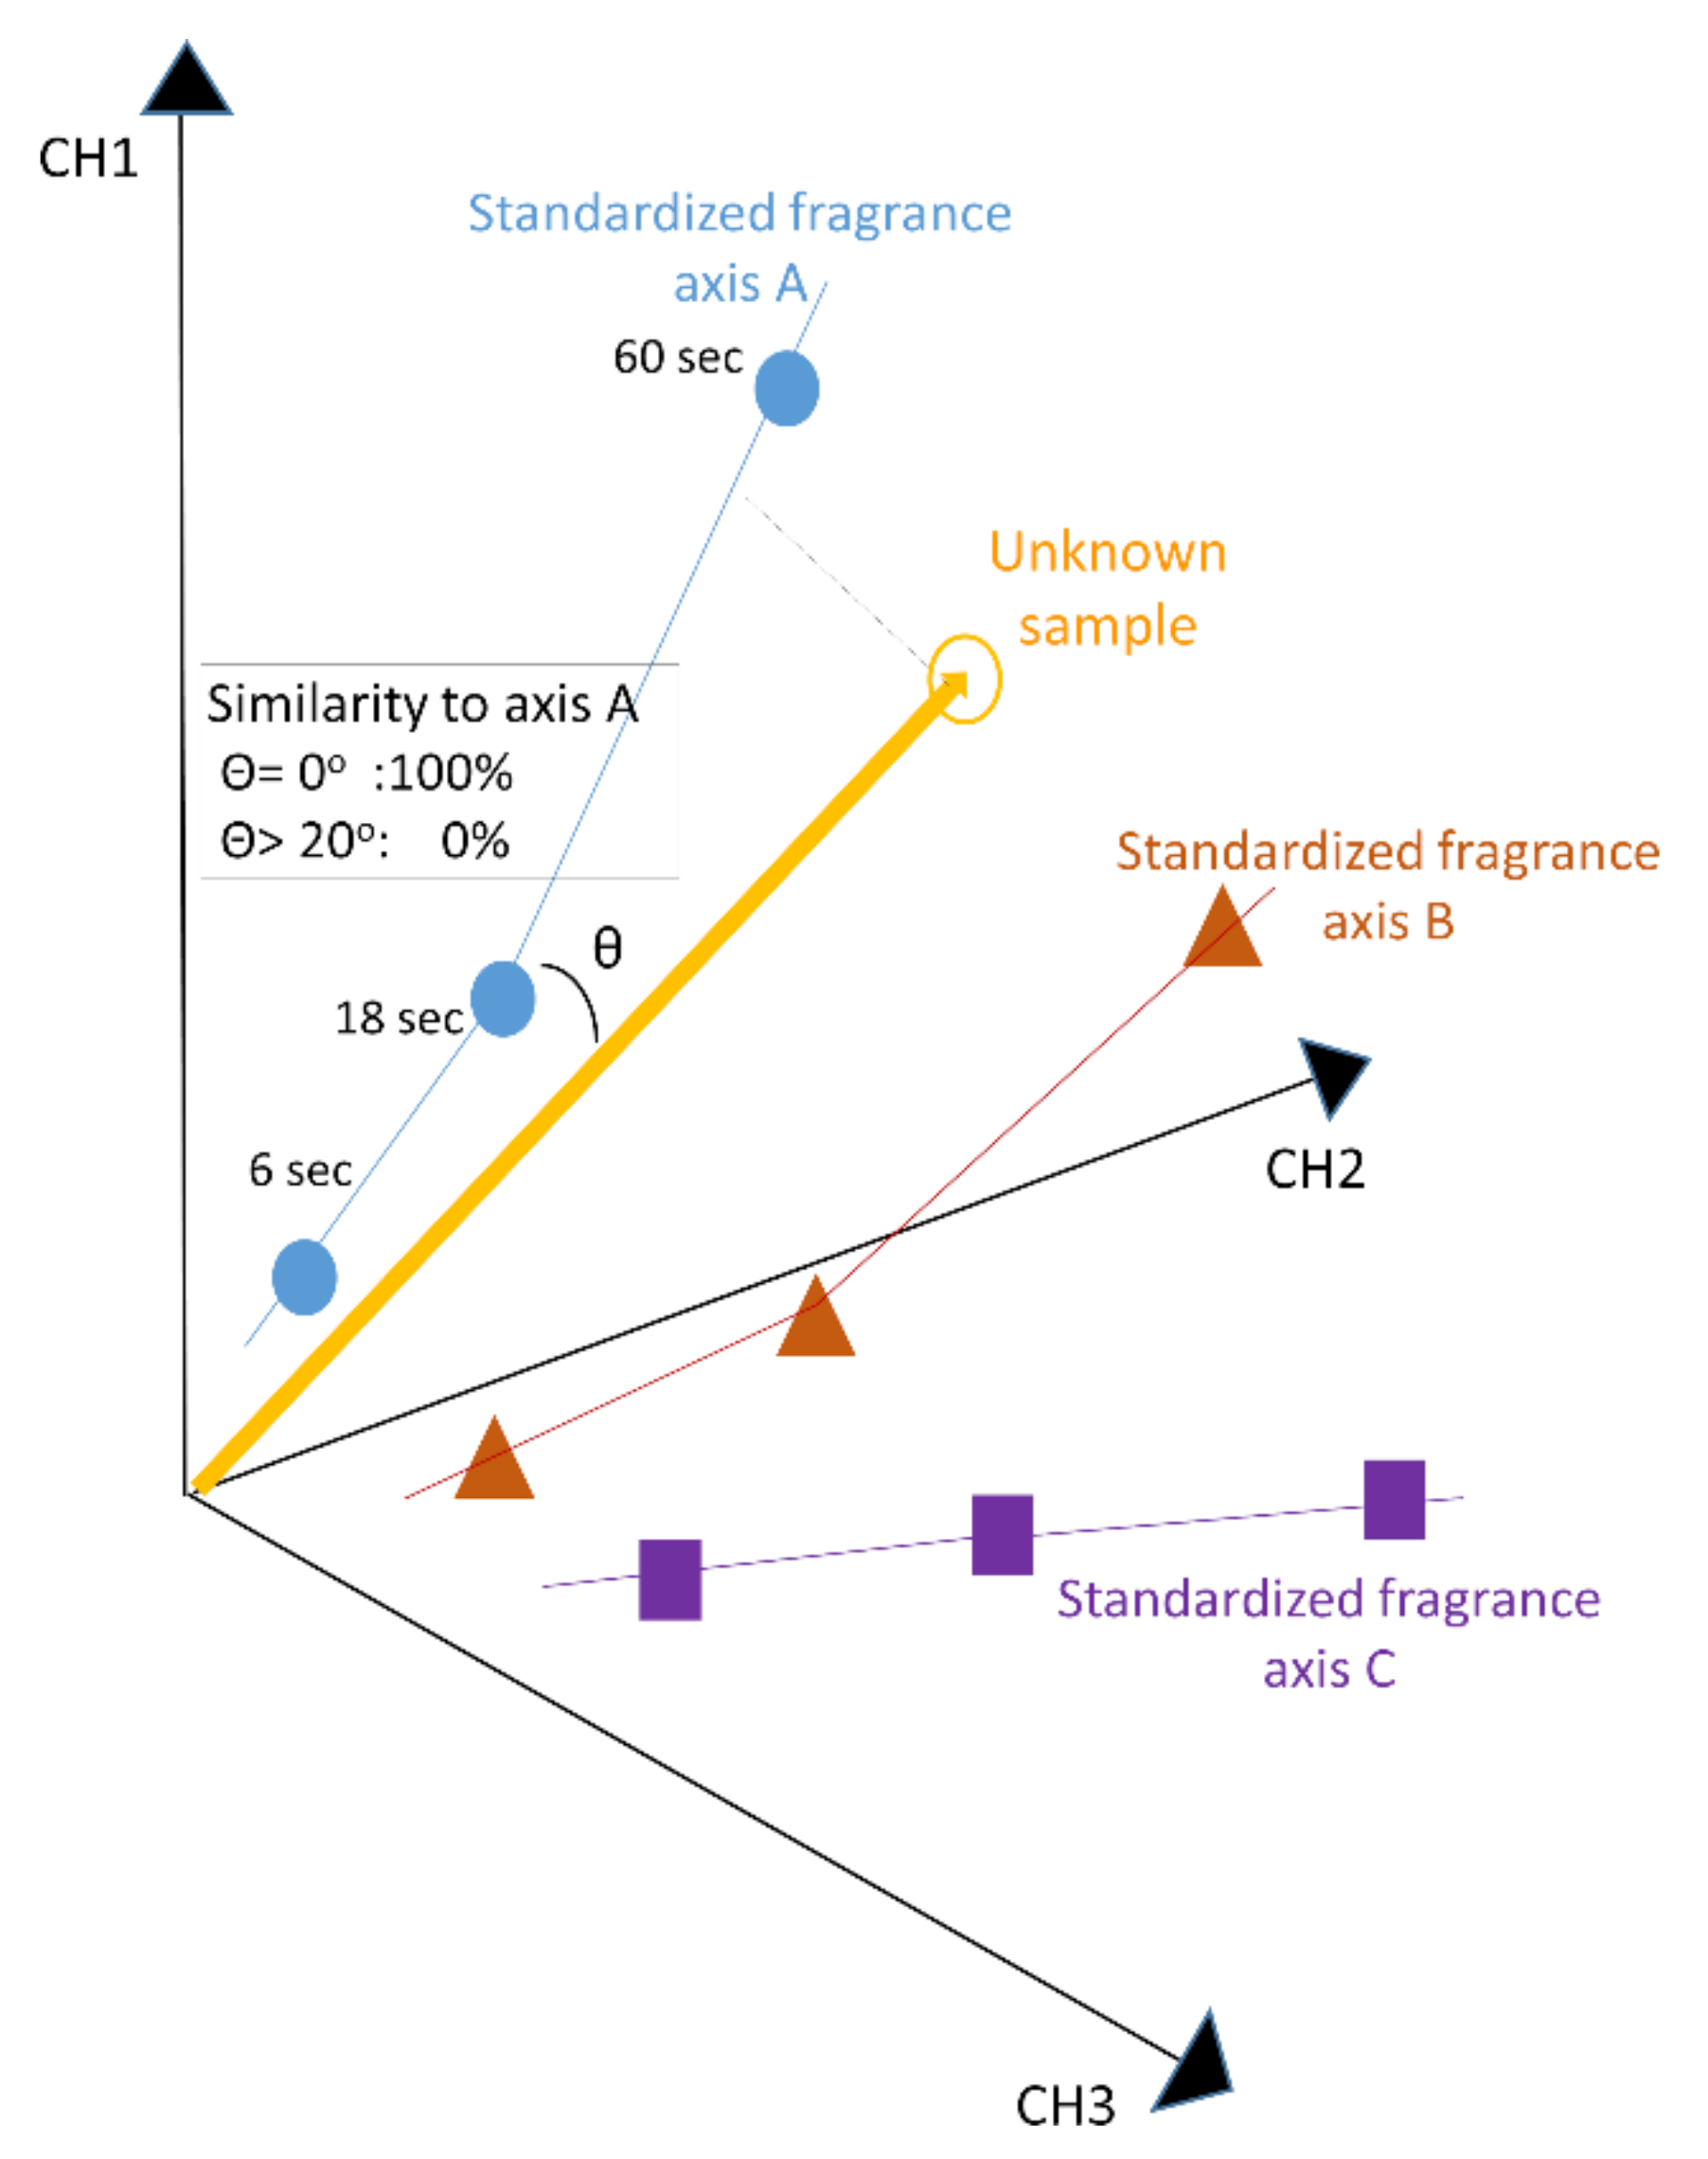
The FF-2A is equipped with 10 types of sensors, each with different characteristics, and is capable of producing 10-dimensional data in a single measurement. For simplicity, a schematic diagram with three types of sensors is shown in
Figure 6. The figure is a modification of Figure 8.1.1.1 in Chapter 8 of the FF-2A Instruction Manual (Shimadzu Corporation). This algorithm creates standard curve axes (Standardized fragrance axes A, B, and C in the figure) of the concentration of the reference axis at 10 dimensions from the fragrances of the reference samples measured in advance at different concentrations, in this case at 6, 18, and 60 s after collection. Then, it calculates the distance between the coordinates of the measured data (Unknown sample in the figure) and the reference concentration curve of the fragrance of each reference sample in that space, and the concentration at the point where the measured data coordinates are projected onto the concentration curve (indicated by the black dotted line in the figure) to obtain the similarity from the angle (θ) between the fragrances of these measured samples and each reference sample. The projecting and dilution indexes were calculated with Asmell2 software. In the case where θ is zero, it indicates 100% of similarity, and if θ is less than 20 degrees, the similarity is calculated as 0%. This method permits the creation of independent fragrance axes, even if the reference axis is close, and the similarity to a new sample can be checked.
This suggests that if the reference axis is set at a typical type of herb, such as the one used in the teaching material for medical herb tests, the quality of the aroma can be described relative to the reference aroma for a sample that resembles a new herb that has complex aroma. Furthermore, we have previously reported a method for extracting apple aroma characteristics from comparisons of multiple fruit patterns and objectively discriminating apple-like aroma by combining the receiver operating characteristic (ROC) curve and a method for setting a cut-off value [
15]; this processing could similarly be used to extract the aroma characteristics of some specific herbs and determine whether a sample contains a particular herb by determining the characteristic of the measured herb. There have also been attempts to objectively distinguish herb fragrances by combining them with artificial intelligence techniques [
17].
The mechanism of reaction with fragrance molecules is radically different between humans and sensors. The human olfactory receptor is a seven-transmembrane G-protein coupled receptor in which, upon binding a fragrance molecule to the receptor, the G-protein activates adenylate cyclase to convert ATP into cyclic AMP (cAMP); cAMP opens ion channels to let sodium ions enter the cell thus depolarizing the cell and sending an action potential to the brain [
18]. This means that there is a threshold for the transmission of stimuli from the olfactory receptors, and the electrical signals are transmitted to the brain as “all or none”. Conversely, although the information obtained using an electronic nose varies from device to device [
19], most sensors detect fragrance molecules in a quantity-dependent manner. On the other hand, humans have more than 350 types of olfactory receptor cells, and the information obtained from the reaction of ligands and receptors to fragrance substances according to their properties and concentrations is transmitted to the brain for pattern analysis in the olfactory center to identify fragrances; by their patterns of reactivity to multiple sensors, humans and electronic noses are similar, and the use of sensor devices is beneficial for recording the characteristics of fragrances in a simple manner [
20].
The characteristic feature of FF-2A is that it records the absolute value of the aroma of a complex odor and expresses the results in terms of intensity and similarity to reference gases in a 10-dimensional space. This is in contrast to the measurement by GC-MS, which uses time separation to determine the kind of molecule. Moreover, since the sensor of FF-2A is extremely sensitive (the one used in this research can detect amount as low as 0.05 ppb), it was possible to distinguish the characteristics of fragrances even in samples that did not show much emission of fragrance molecules by GC-MS. However, regardless of how many molecules are released into the gas, these molecules must react with the sensor of the electronic nose to be detected, which is a point that must be taken into consideration when comparing the data acquired from electronic nose and GC-MS.
Since the electronic nose differs from the human sense of smell in some aspects, it may not replace human sensory testing for herbal fragrances. However, since FF-2A records values in terms of absolute values, it facilitates the comparison of samples over time, such as comparing herbs harvested at different locations or from different lots or looking at the difference in aroma between herbs harvested previously and this year even from the same field. Since such comparisons are difficult for the human olfactory system, FF-2A can be used in conjunction with a device that identifies components, such as GC-MS, to evaluate the fragrances of herbs. The advantage of the method is that once the new axes of standard fragrances are correctly set, the original data can be repetitively used for further analysis regardless of the passage of time without introducing additional source of the noise. On the other hand, the weakness of this approach is that it tries to evaluate samples only by their fragrances. For samples that have liquid components in addition to the aromas such as wine, it is known that the combination of an electric nose that detects the aroma and an electric tongue that detects the difference in the liquid is useful [
21]. In this study, we focused only on aroma, but for samples with liquid components such as herbal tea, such a combination is expected to enable more promising comparisons of samples especially in combination with artificial intelligence.


 ,
, 


