
Application of Aminopolycarboxylic Complexes of V(IV) in Catalytic Adsorptive Stripping Voltammetry of Germanium


Abstract
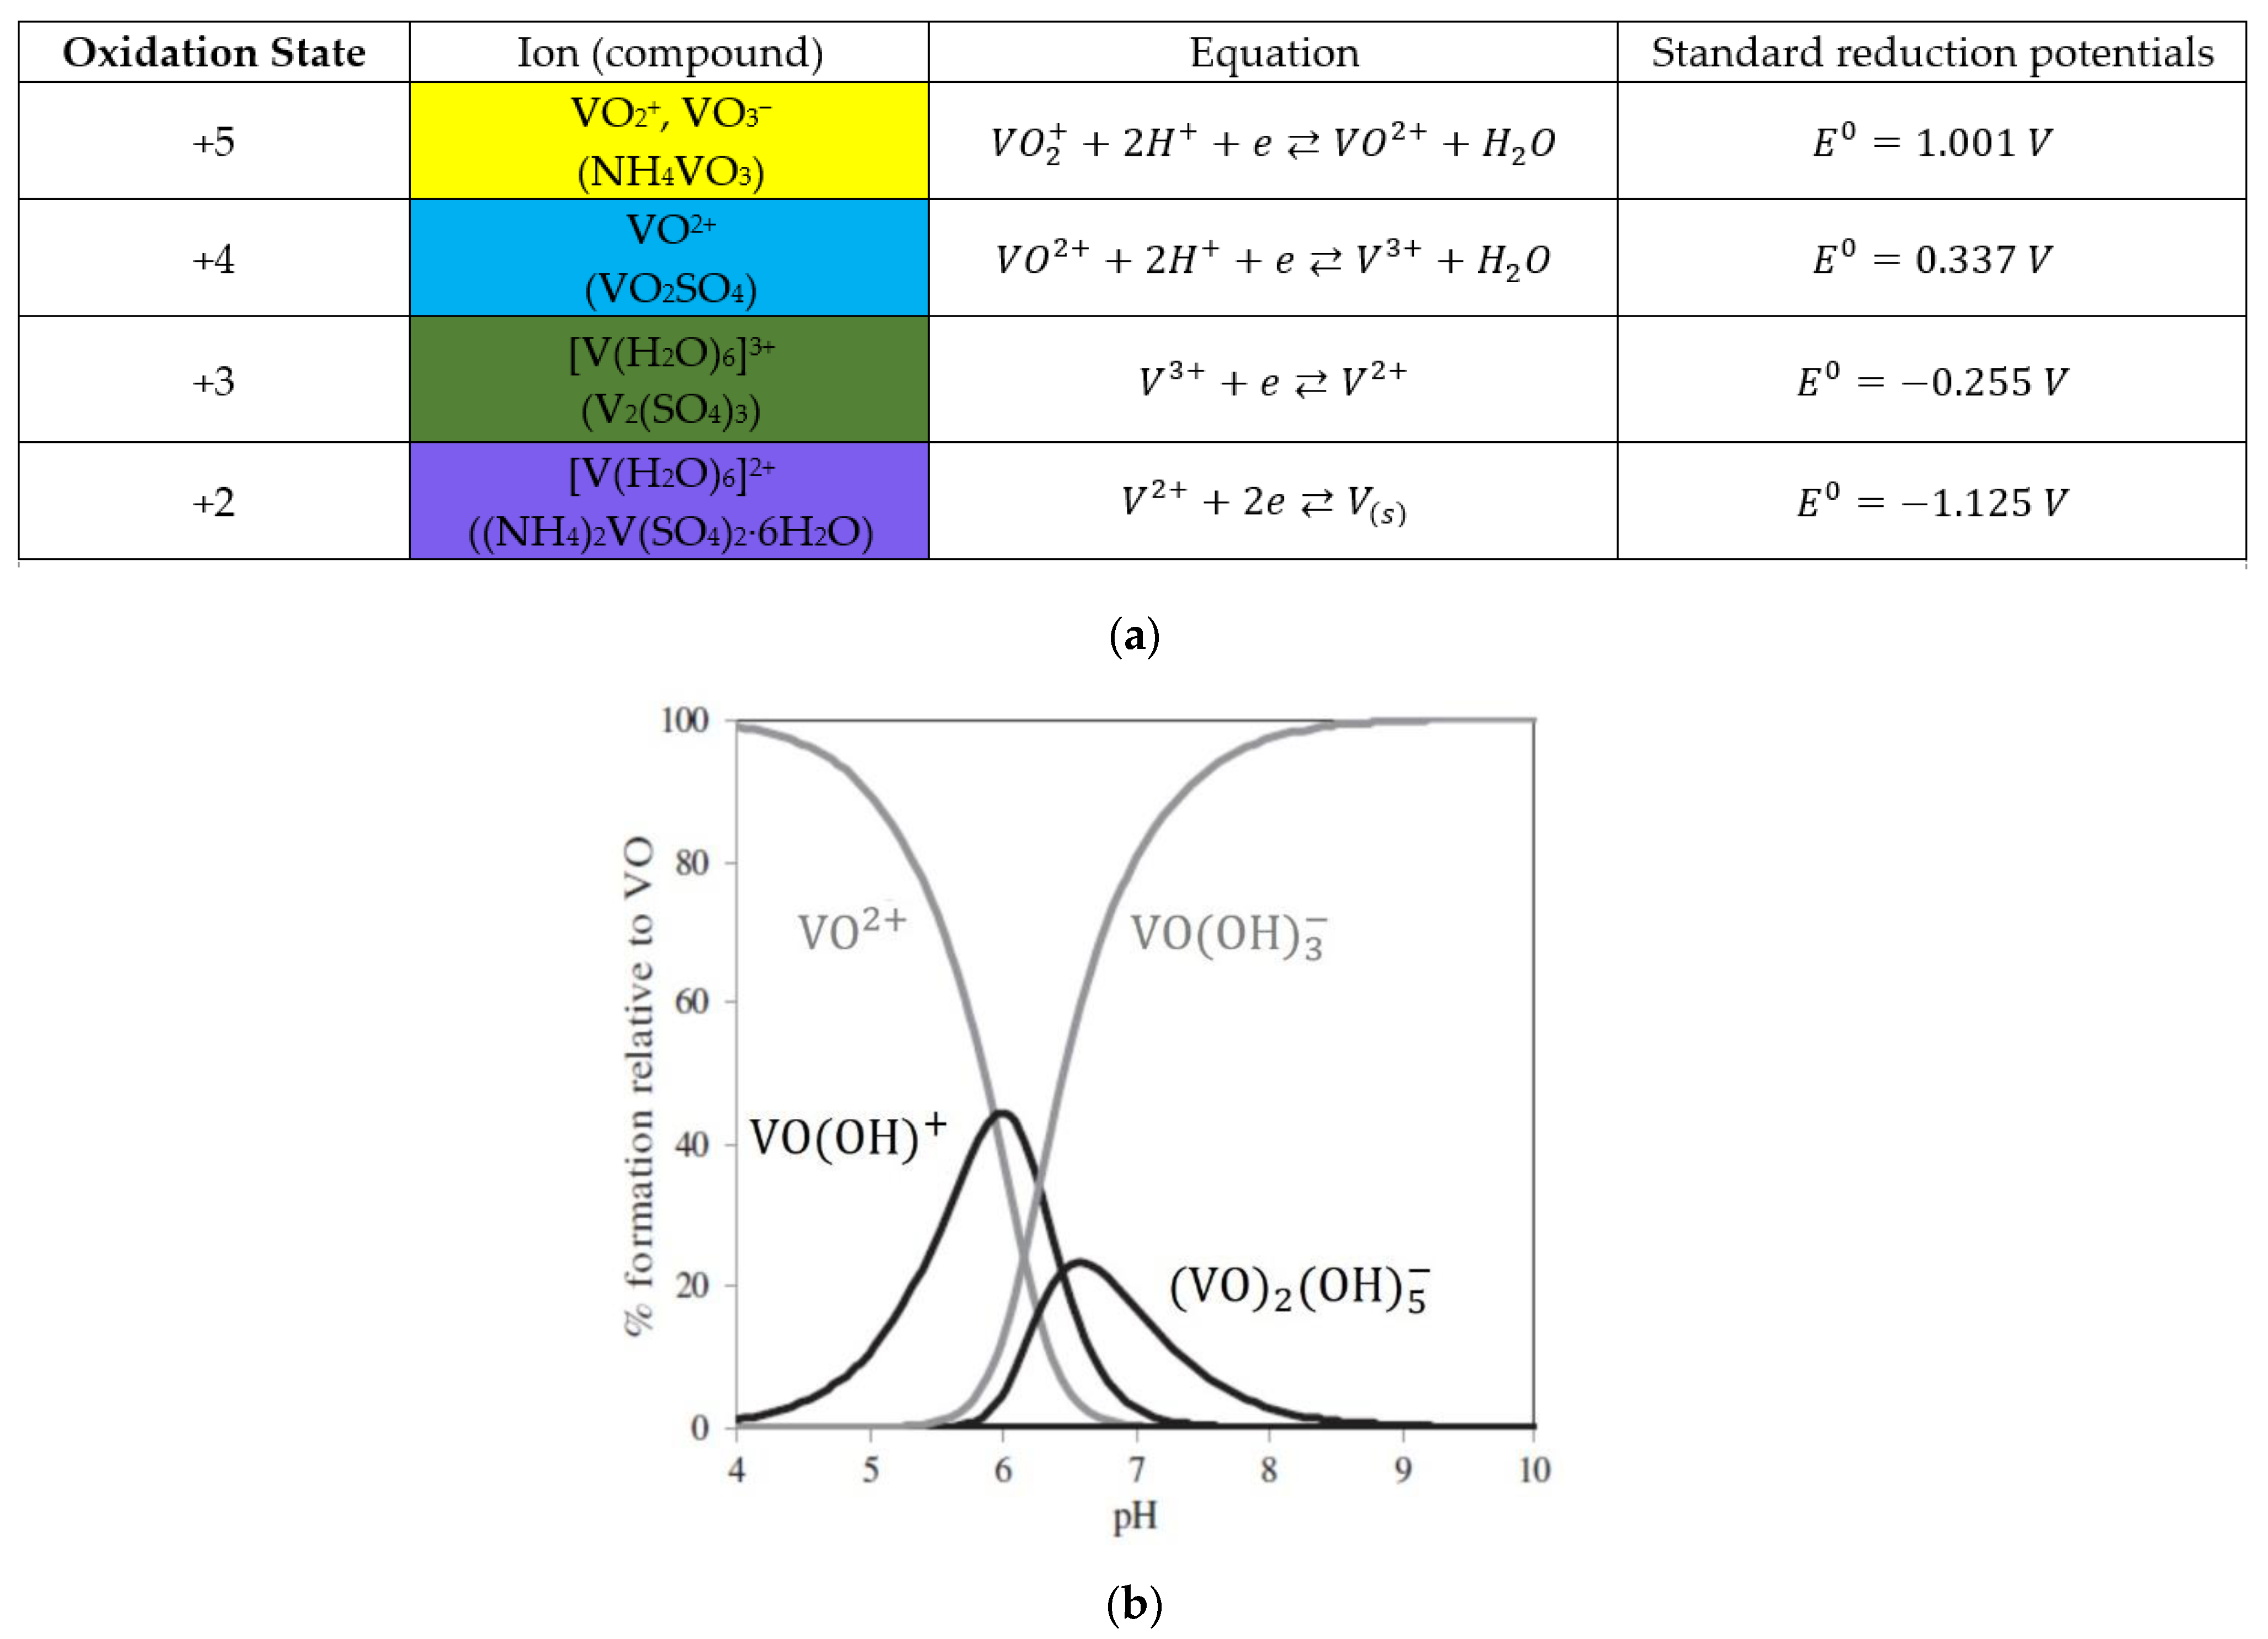
:1. Chemistry and Electrochemistry of Vanadium Compounds
2. Adsorptive and Catalytic Adsorptive Stripping Voltammetric Determination of Germanium
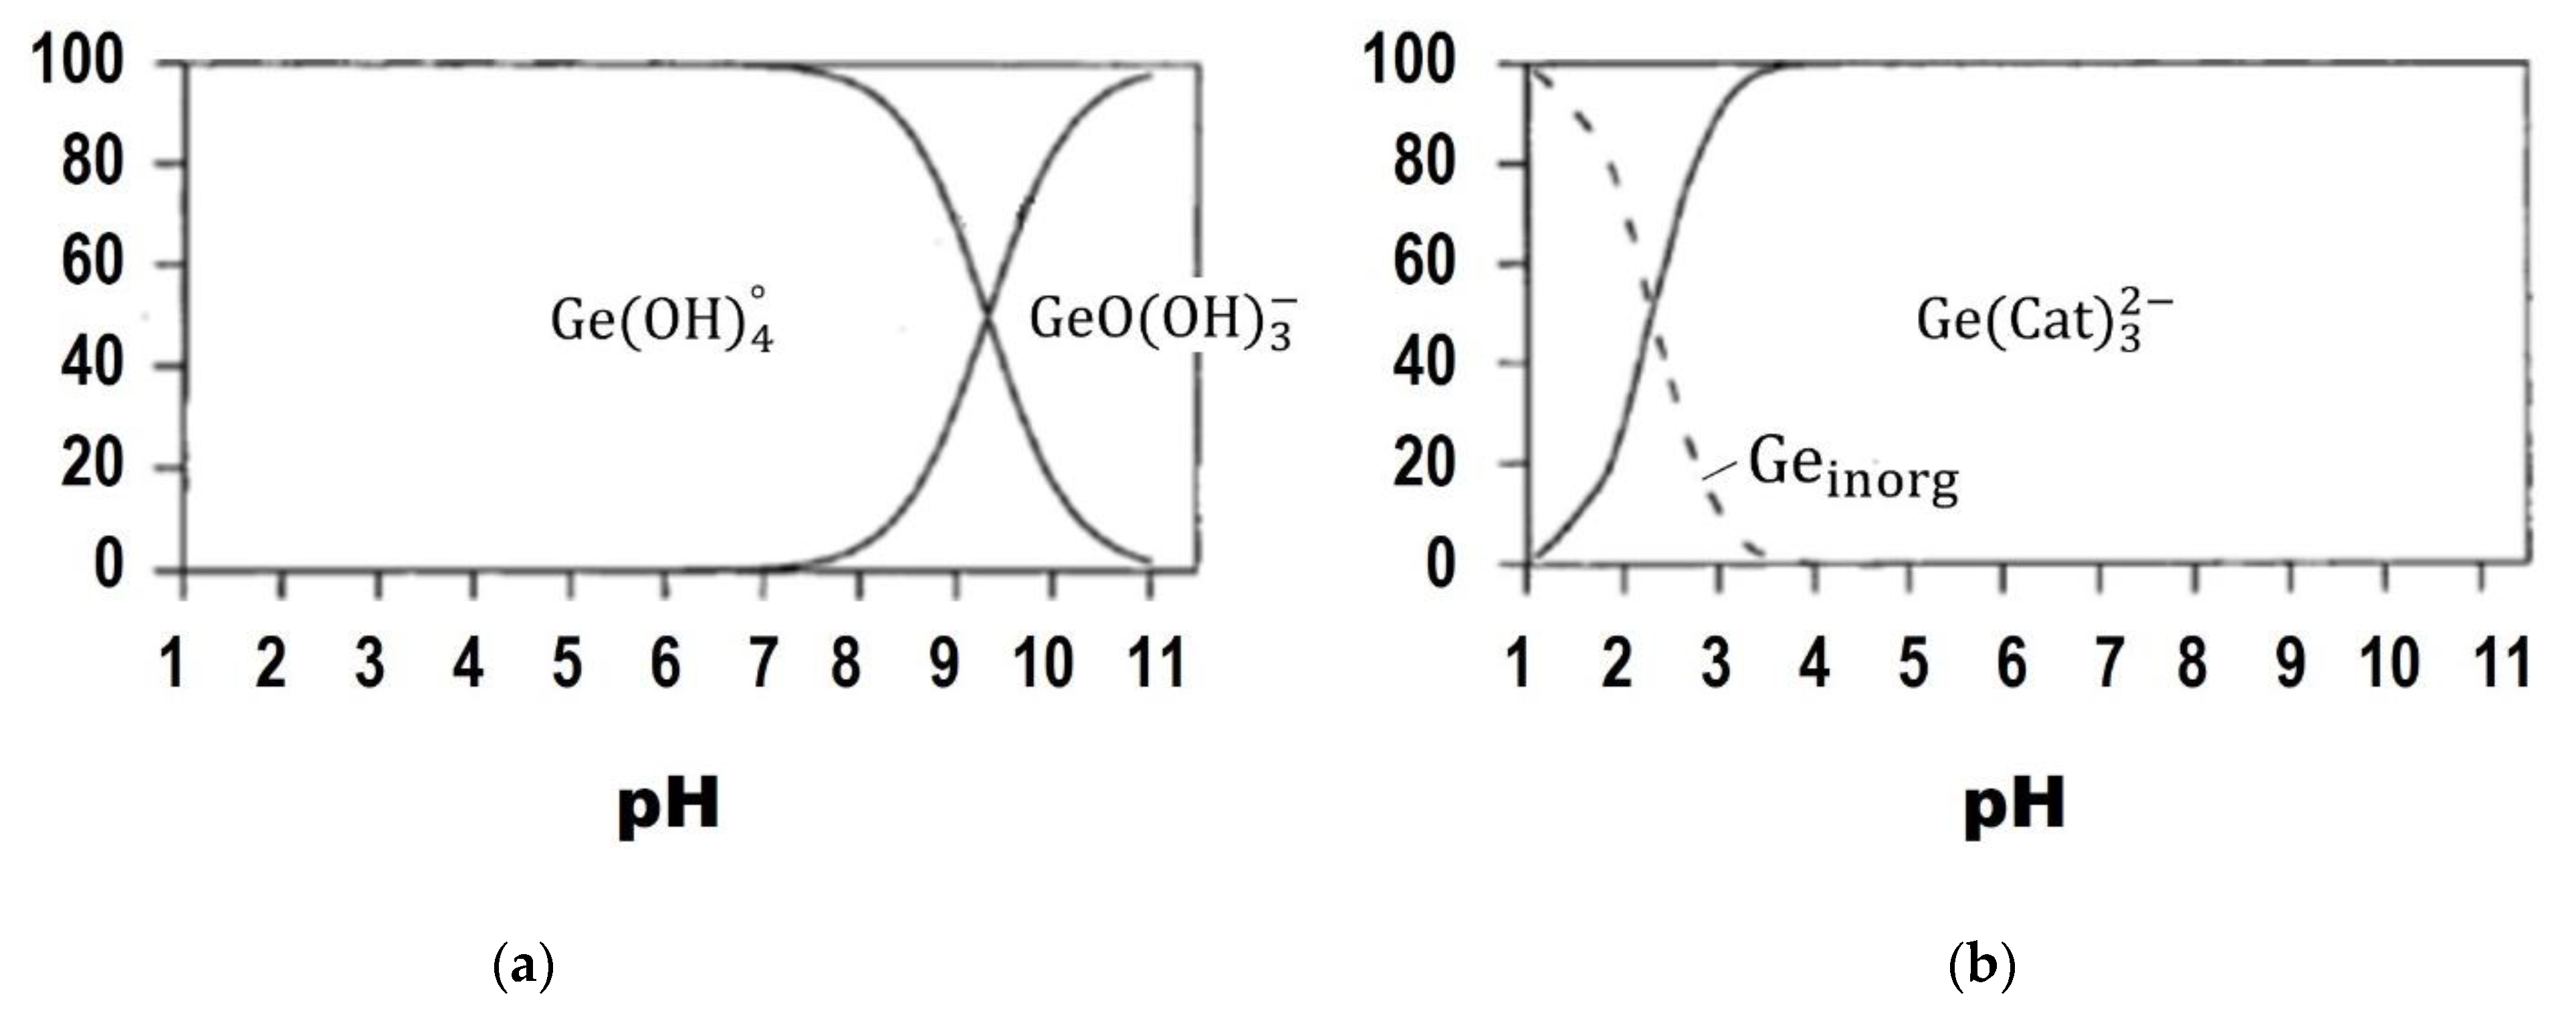
2.1. Adsorptive Stripping Voltammetric Determination of Germanium
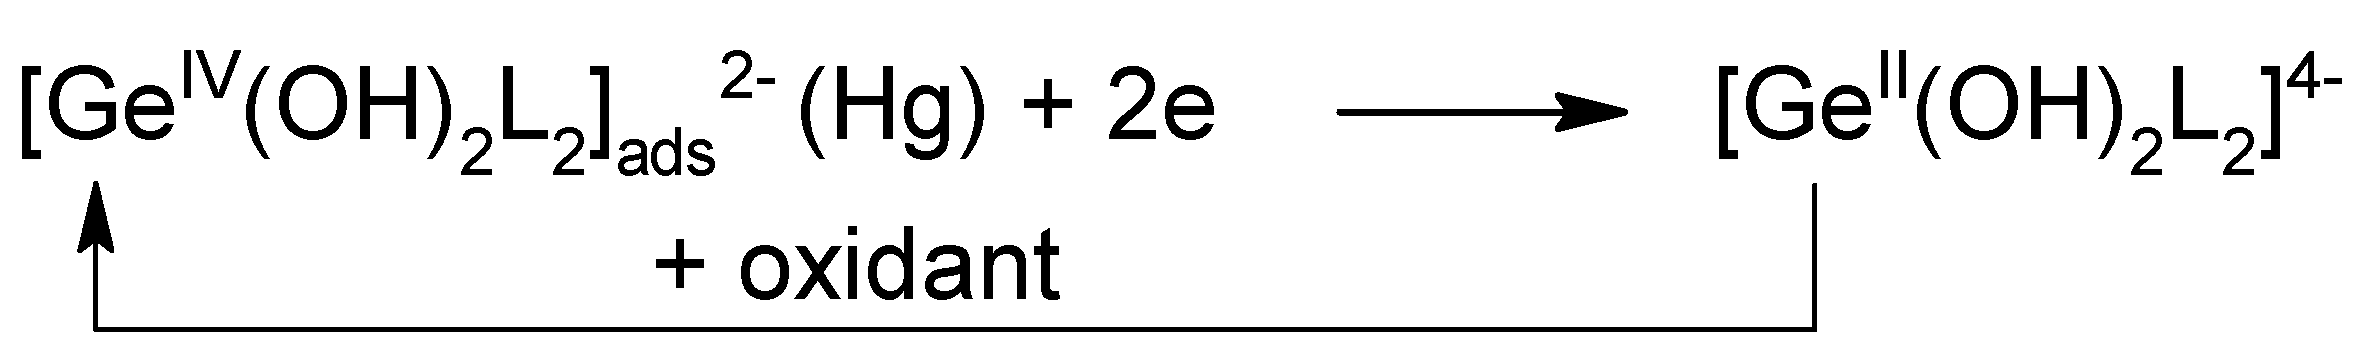
2.2. Catalytic Amplification of Germanium Voltammetric Signals in the Presence of Oxoacid Anions
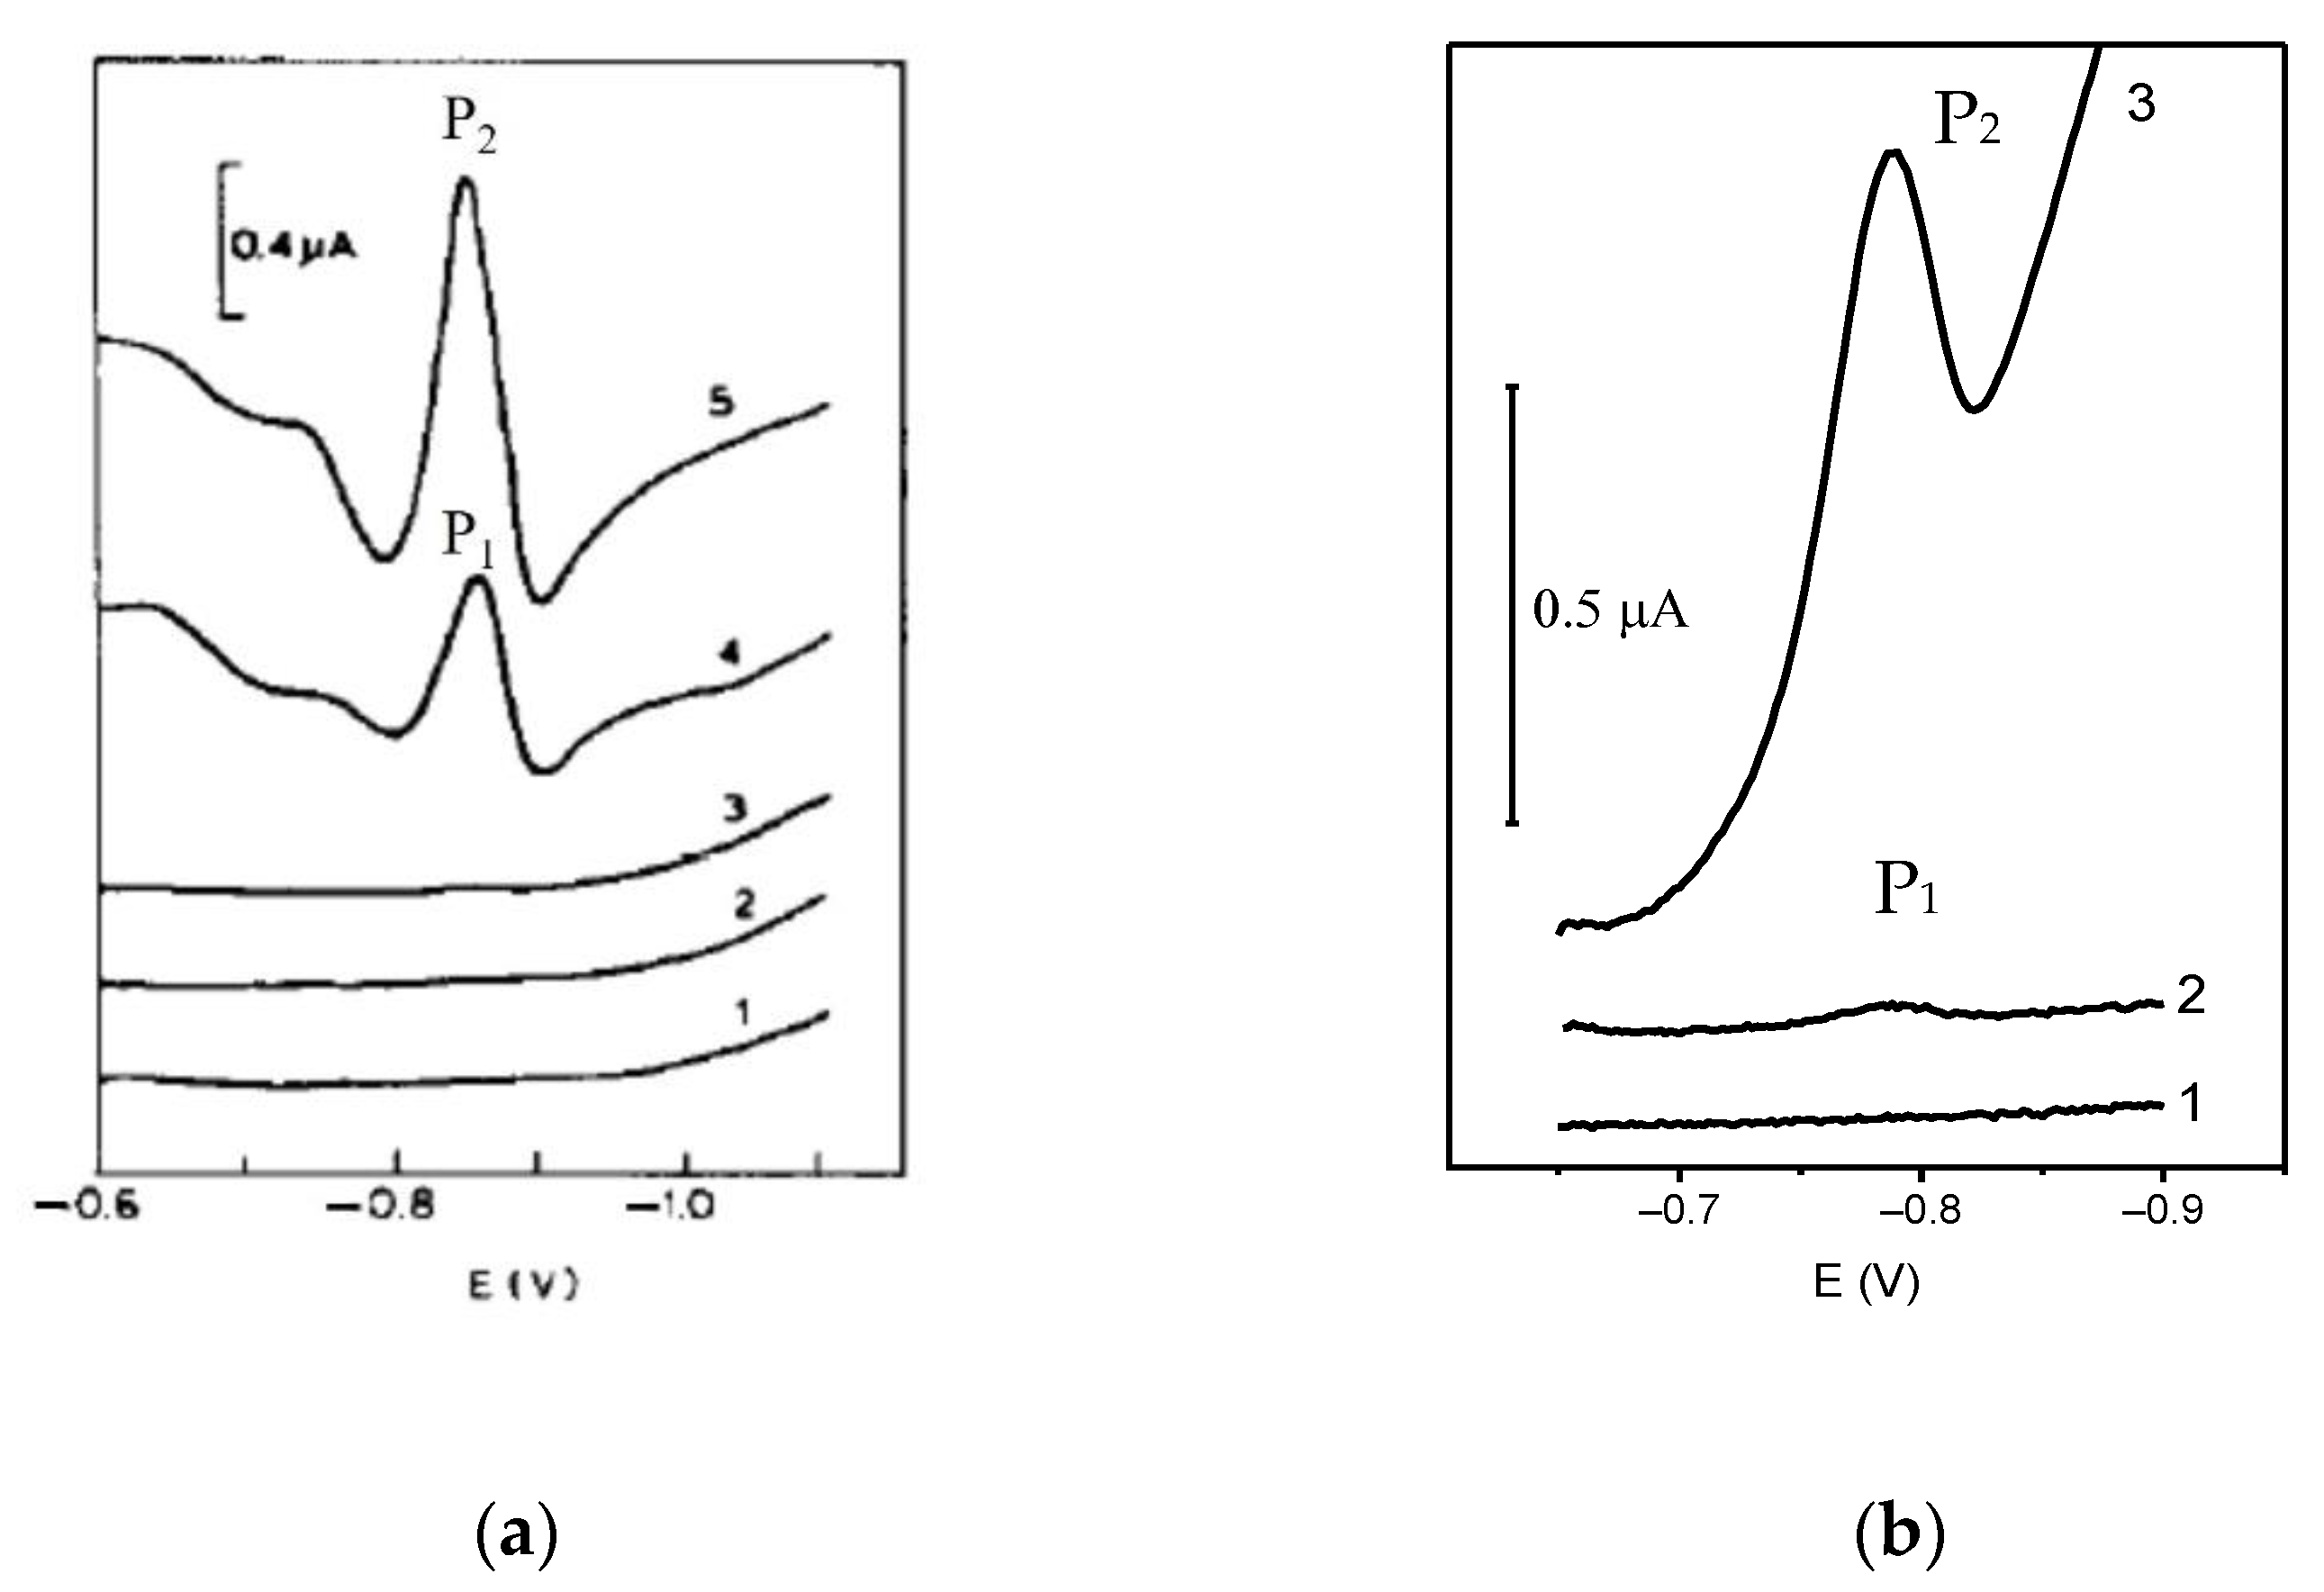
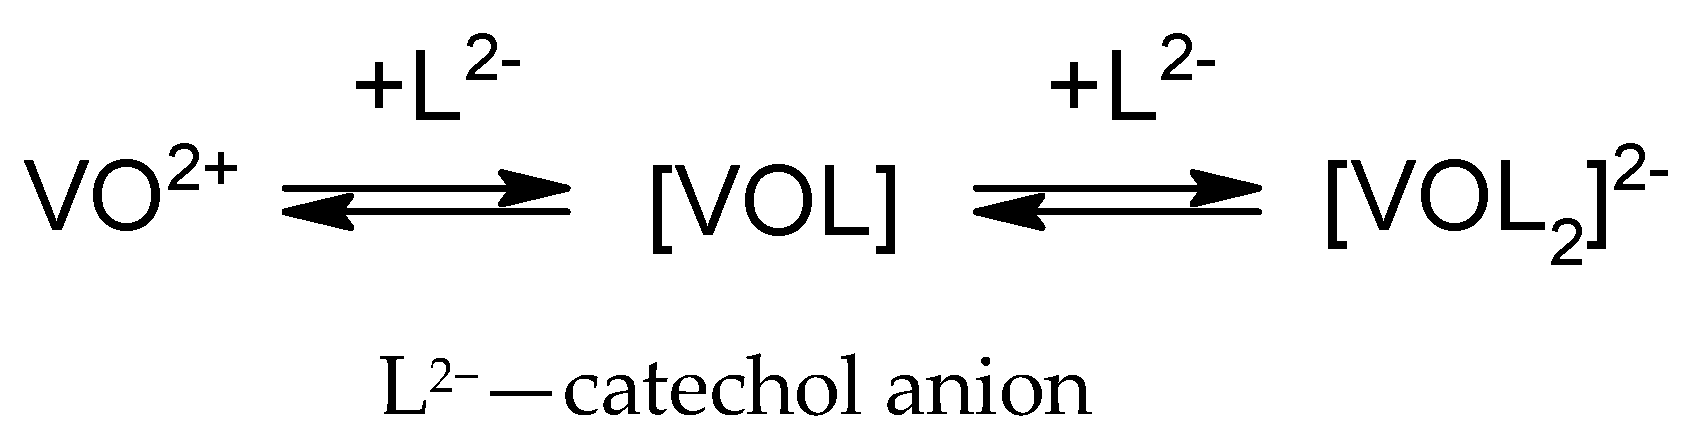
2.3. Catalytic Amplification of Germanium Voltammetric Signals in the Presence of Free Oxovanadium(IV) Ions
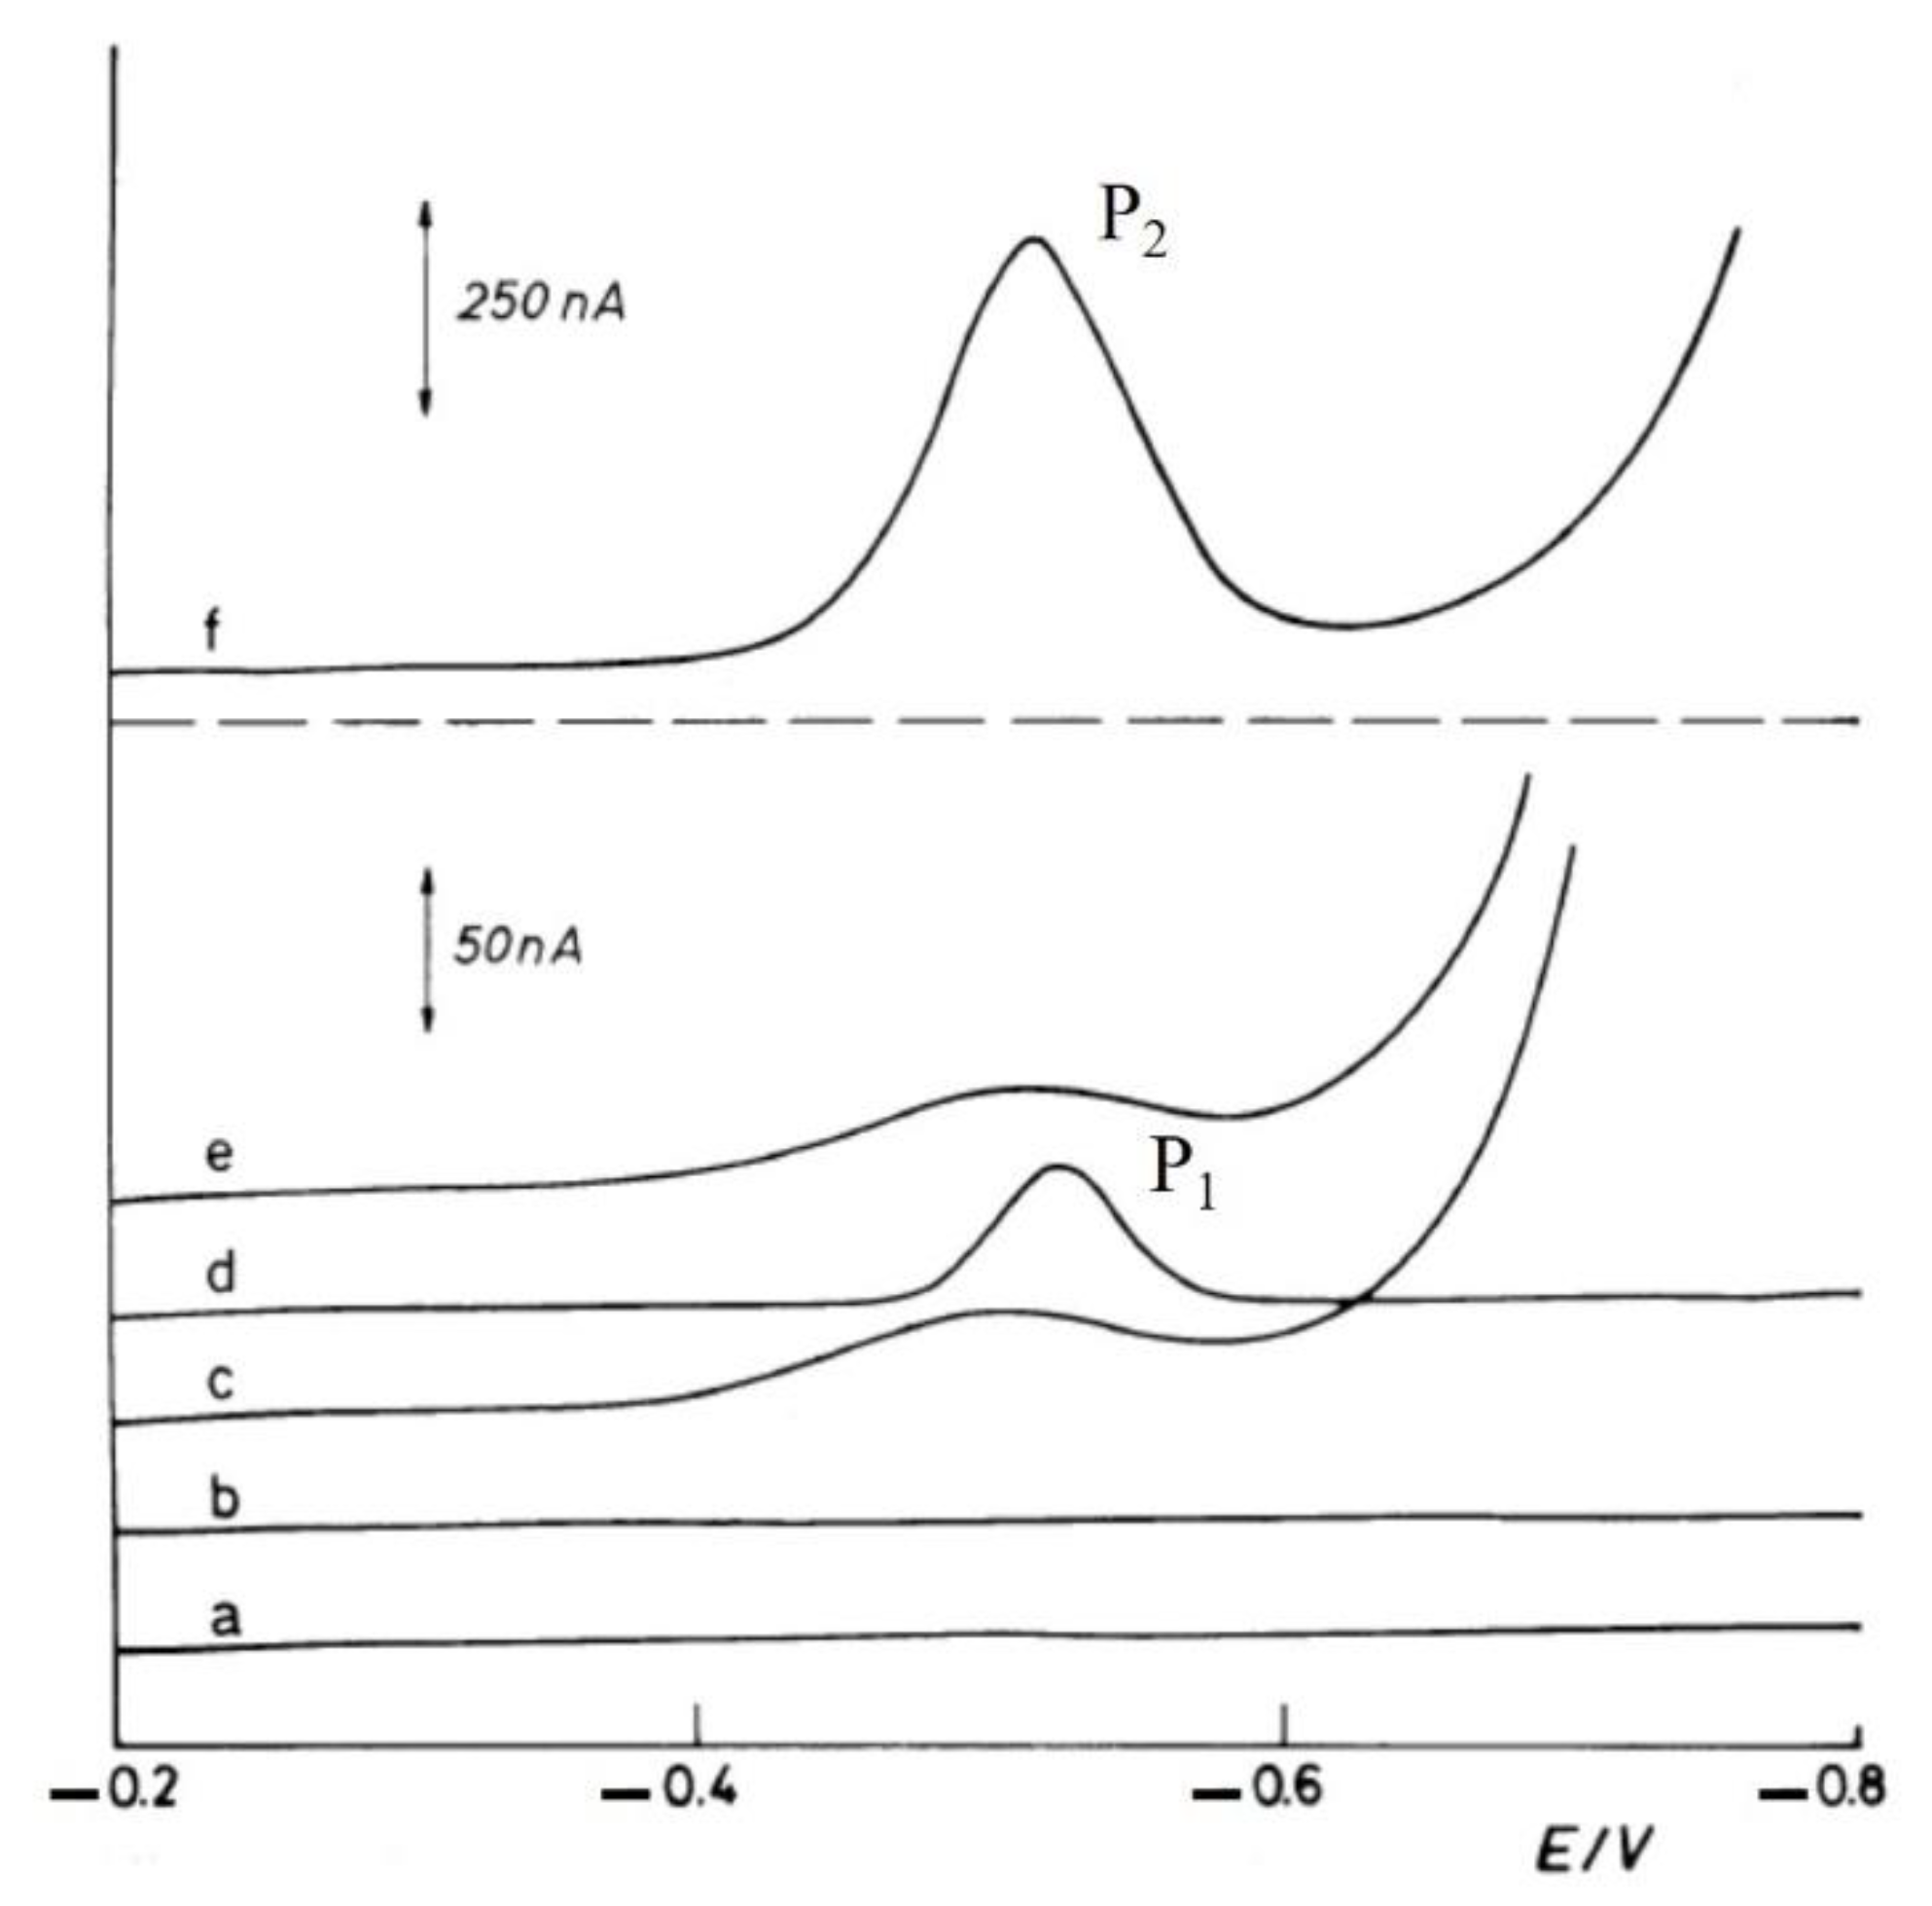
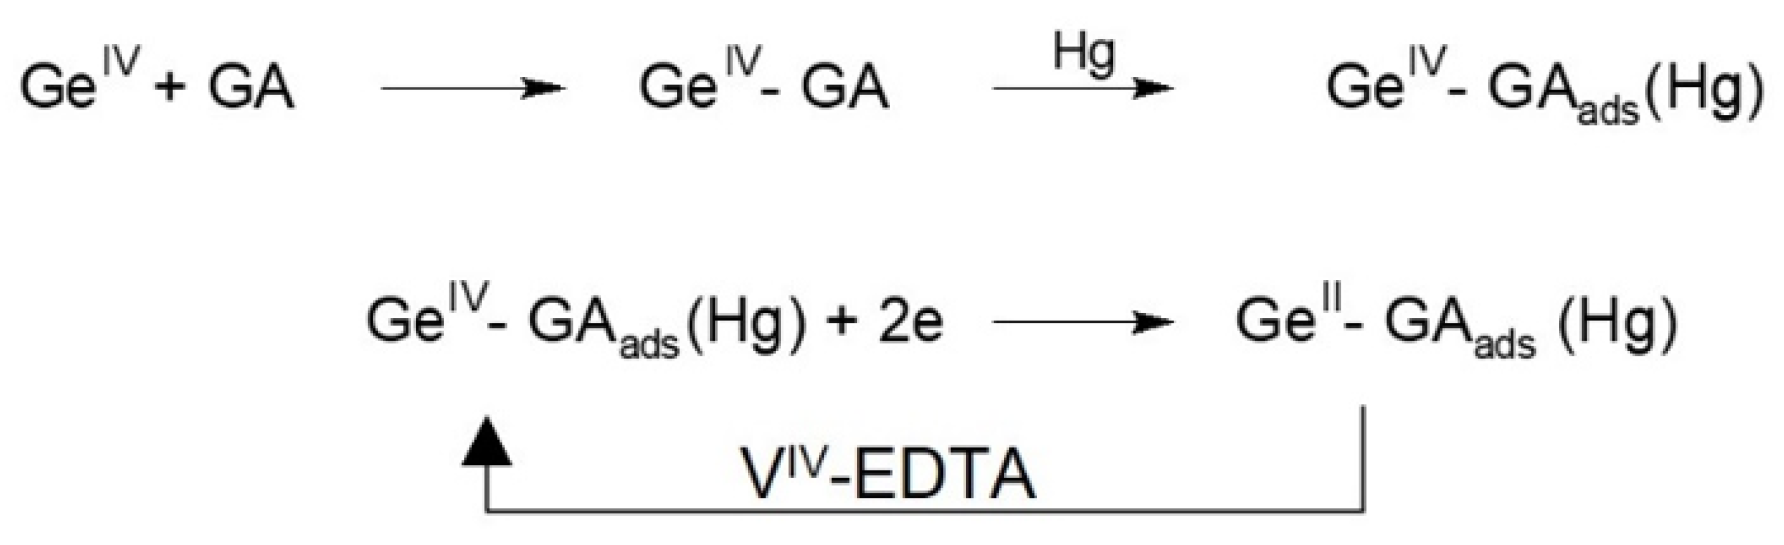
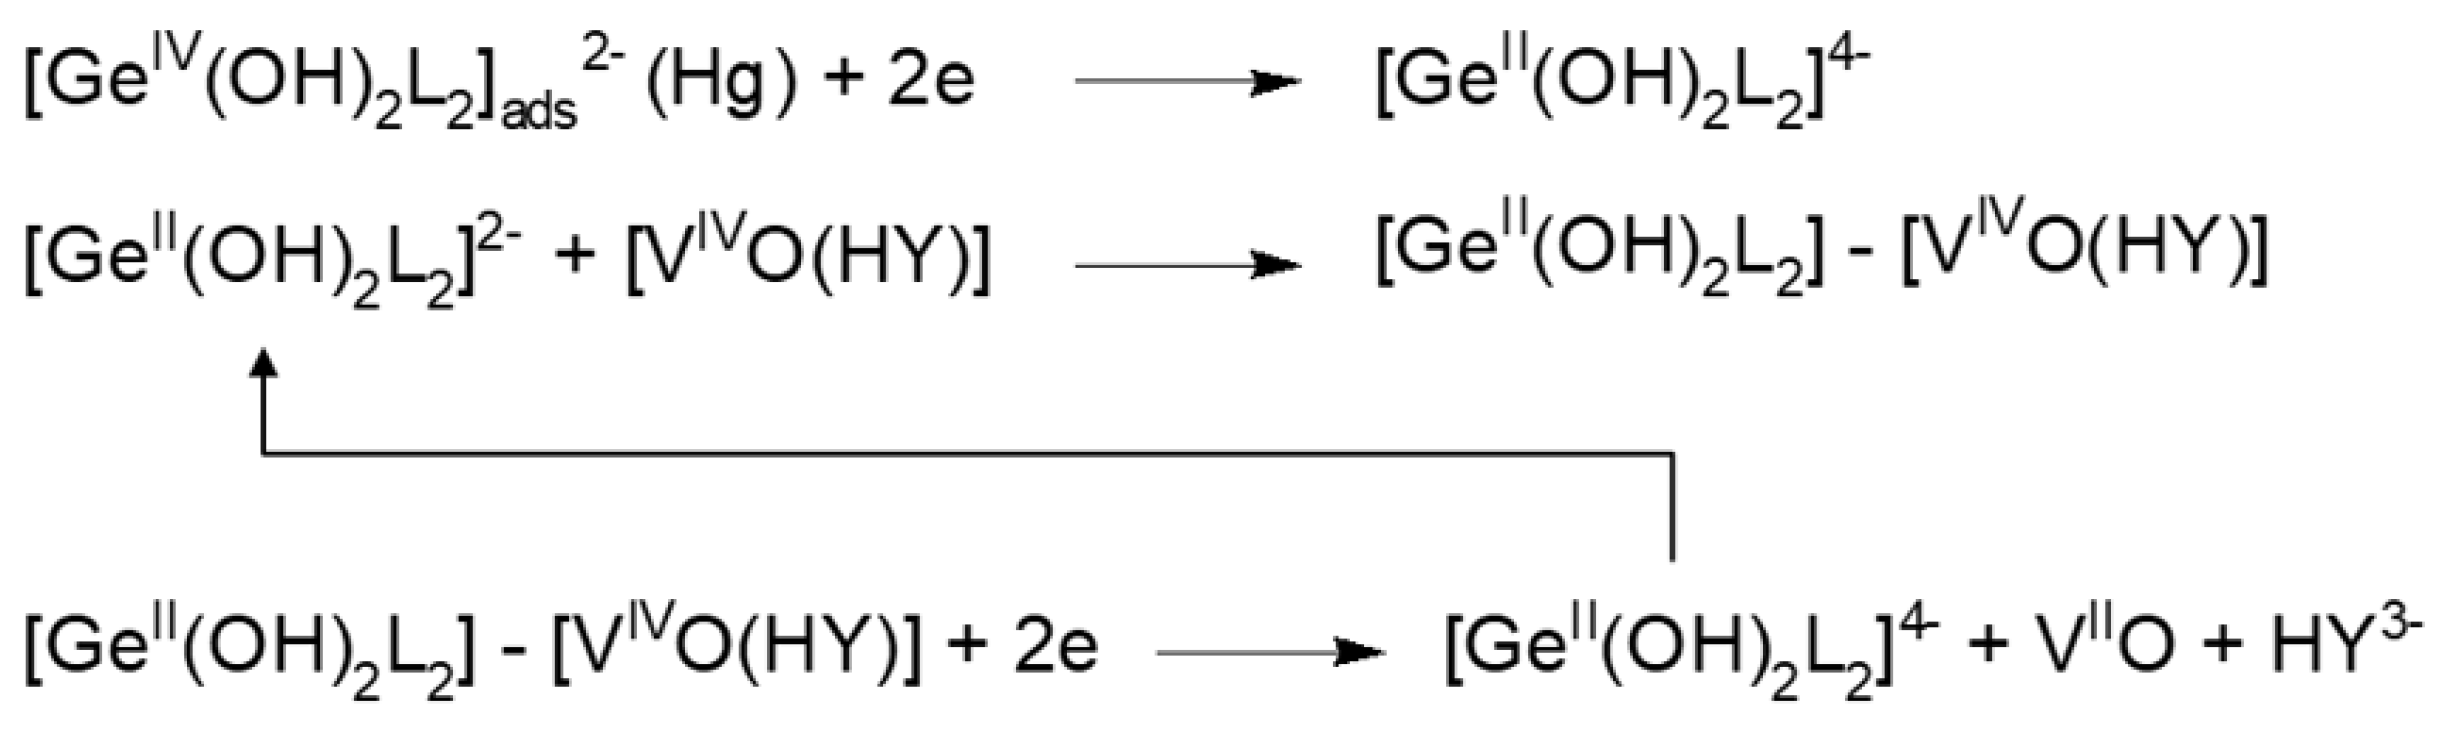
2.4. Catalytic Amplification of Germanium Voltammetric Signals in the Presence of V(IV)-EDTA
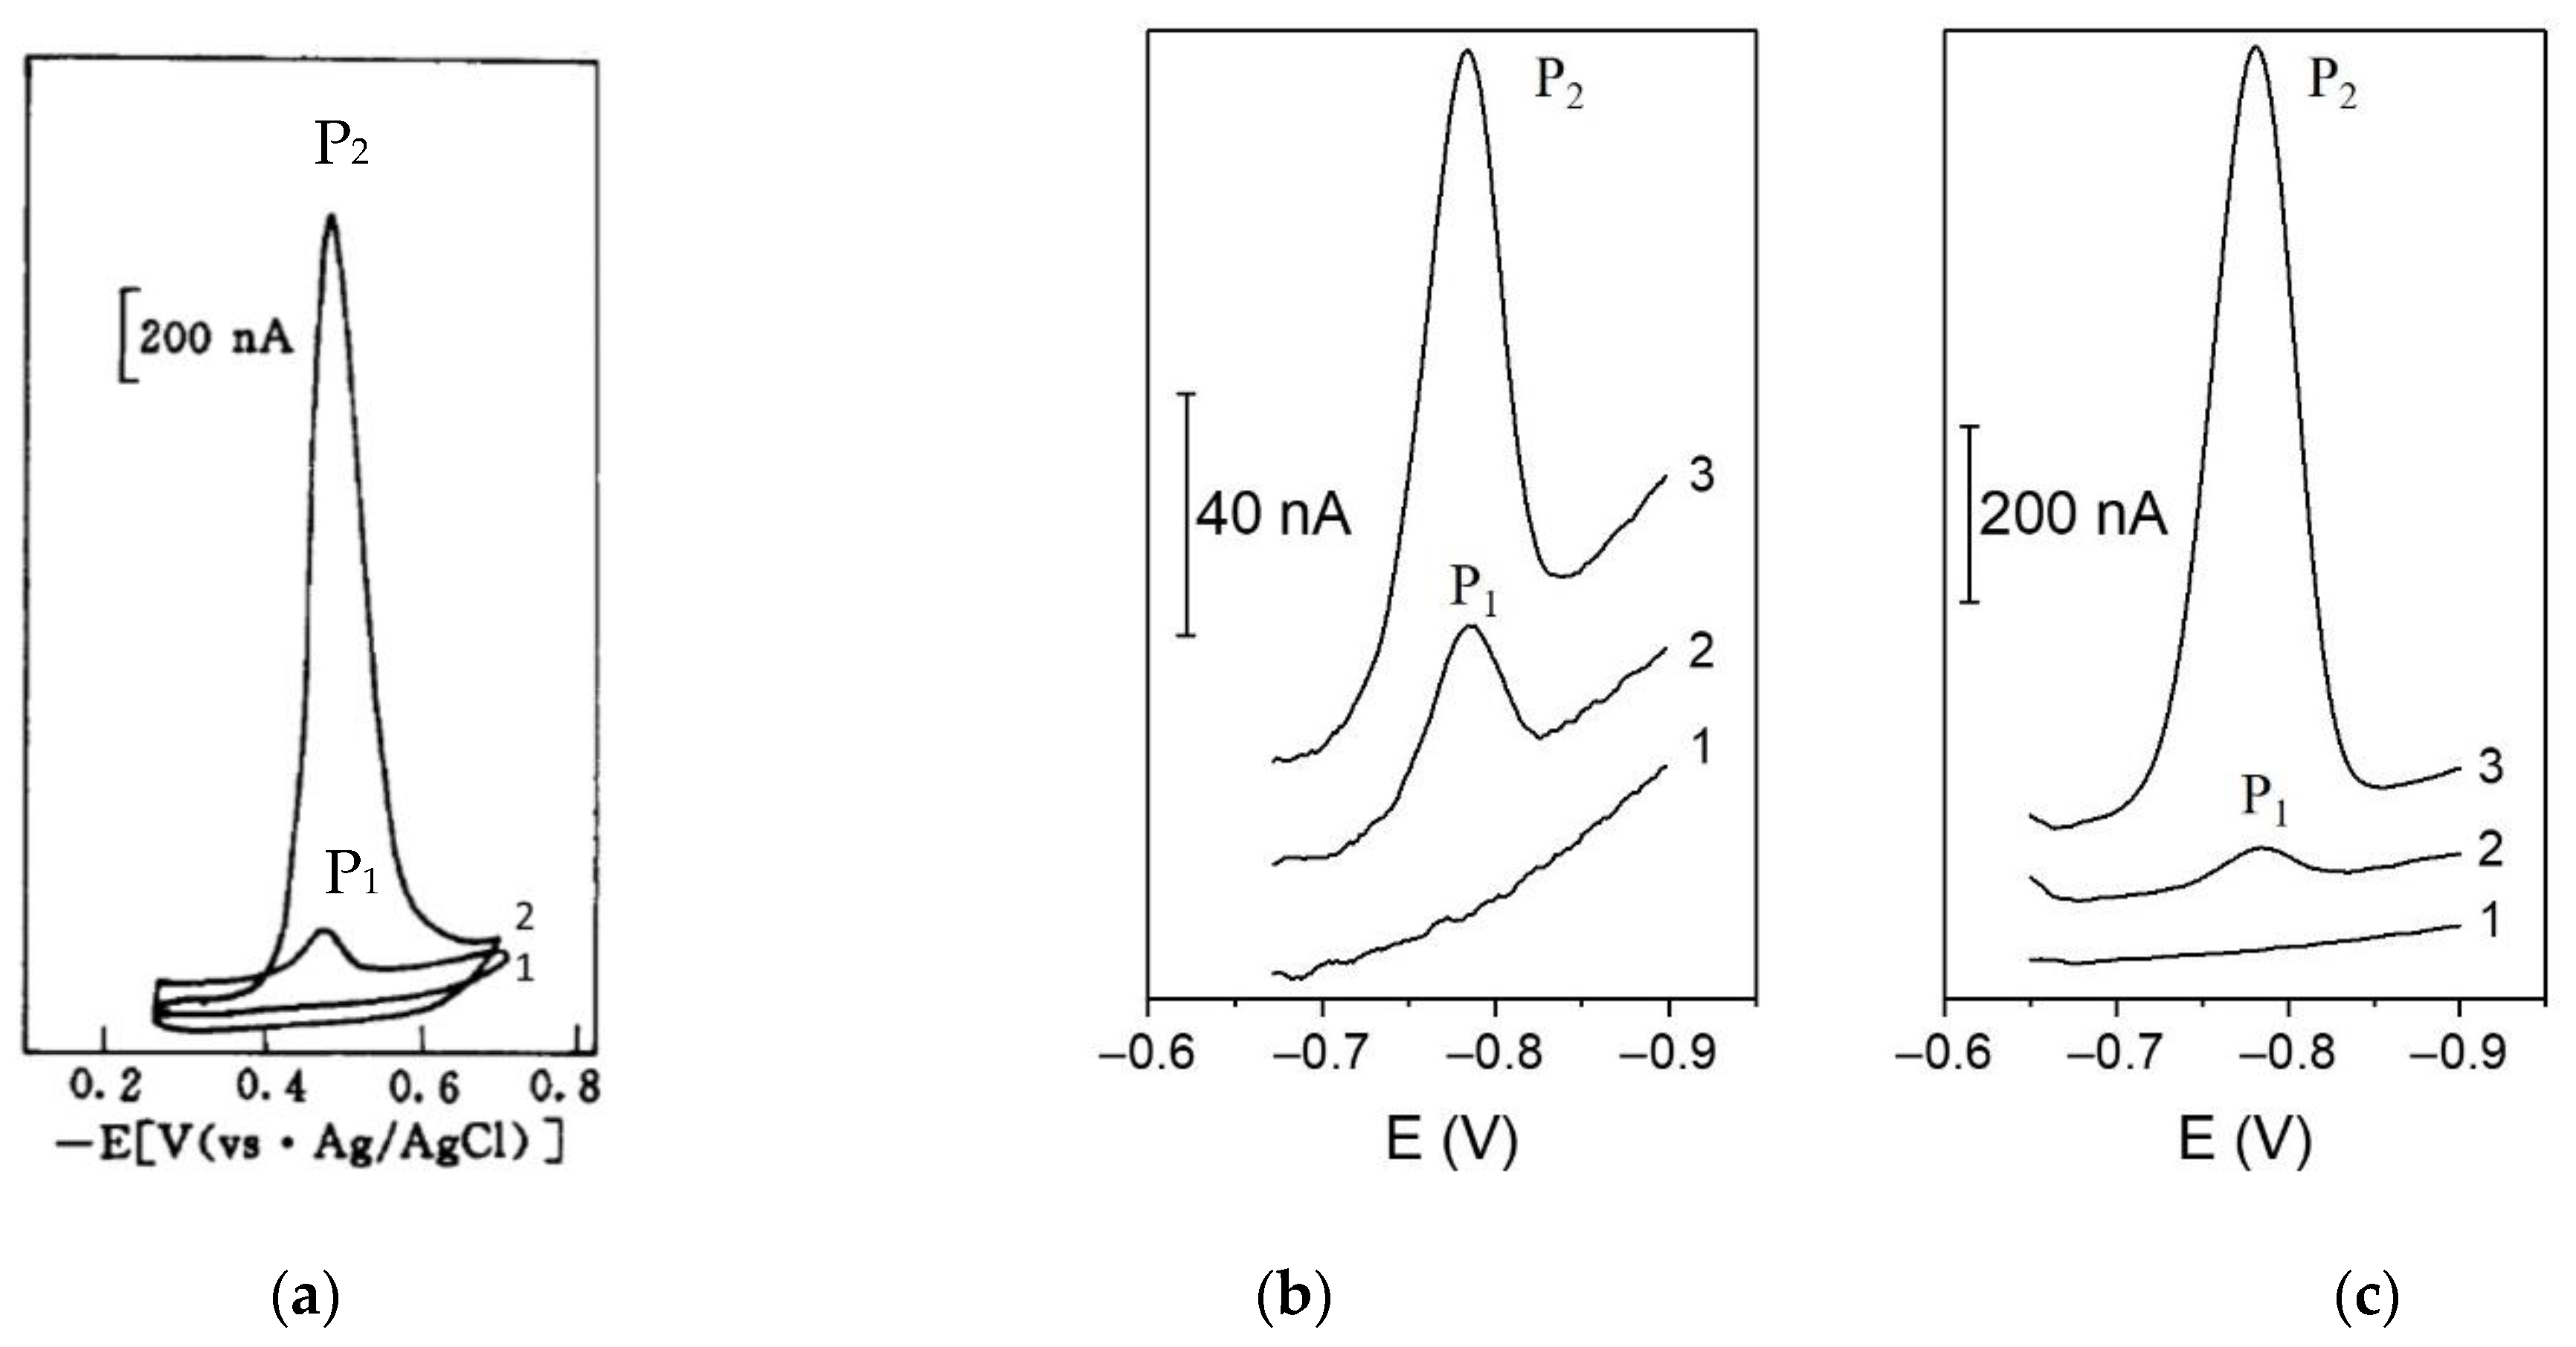
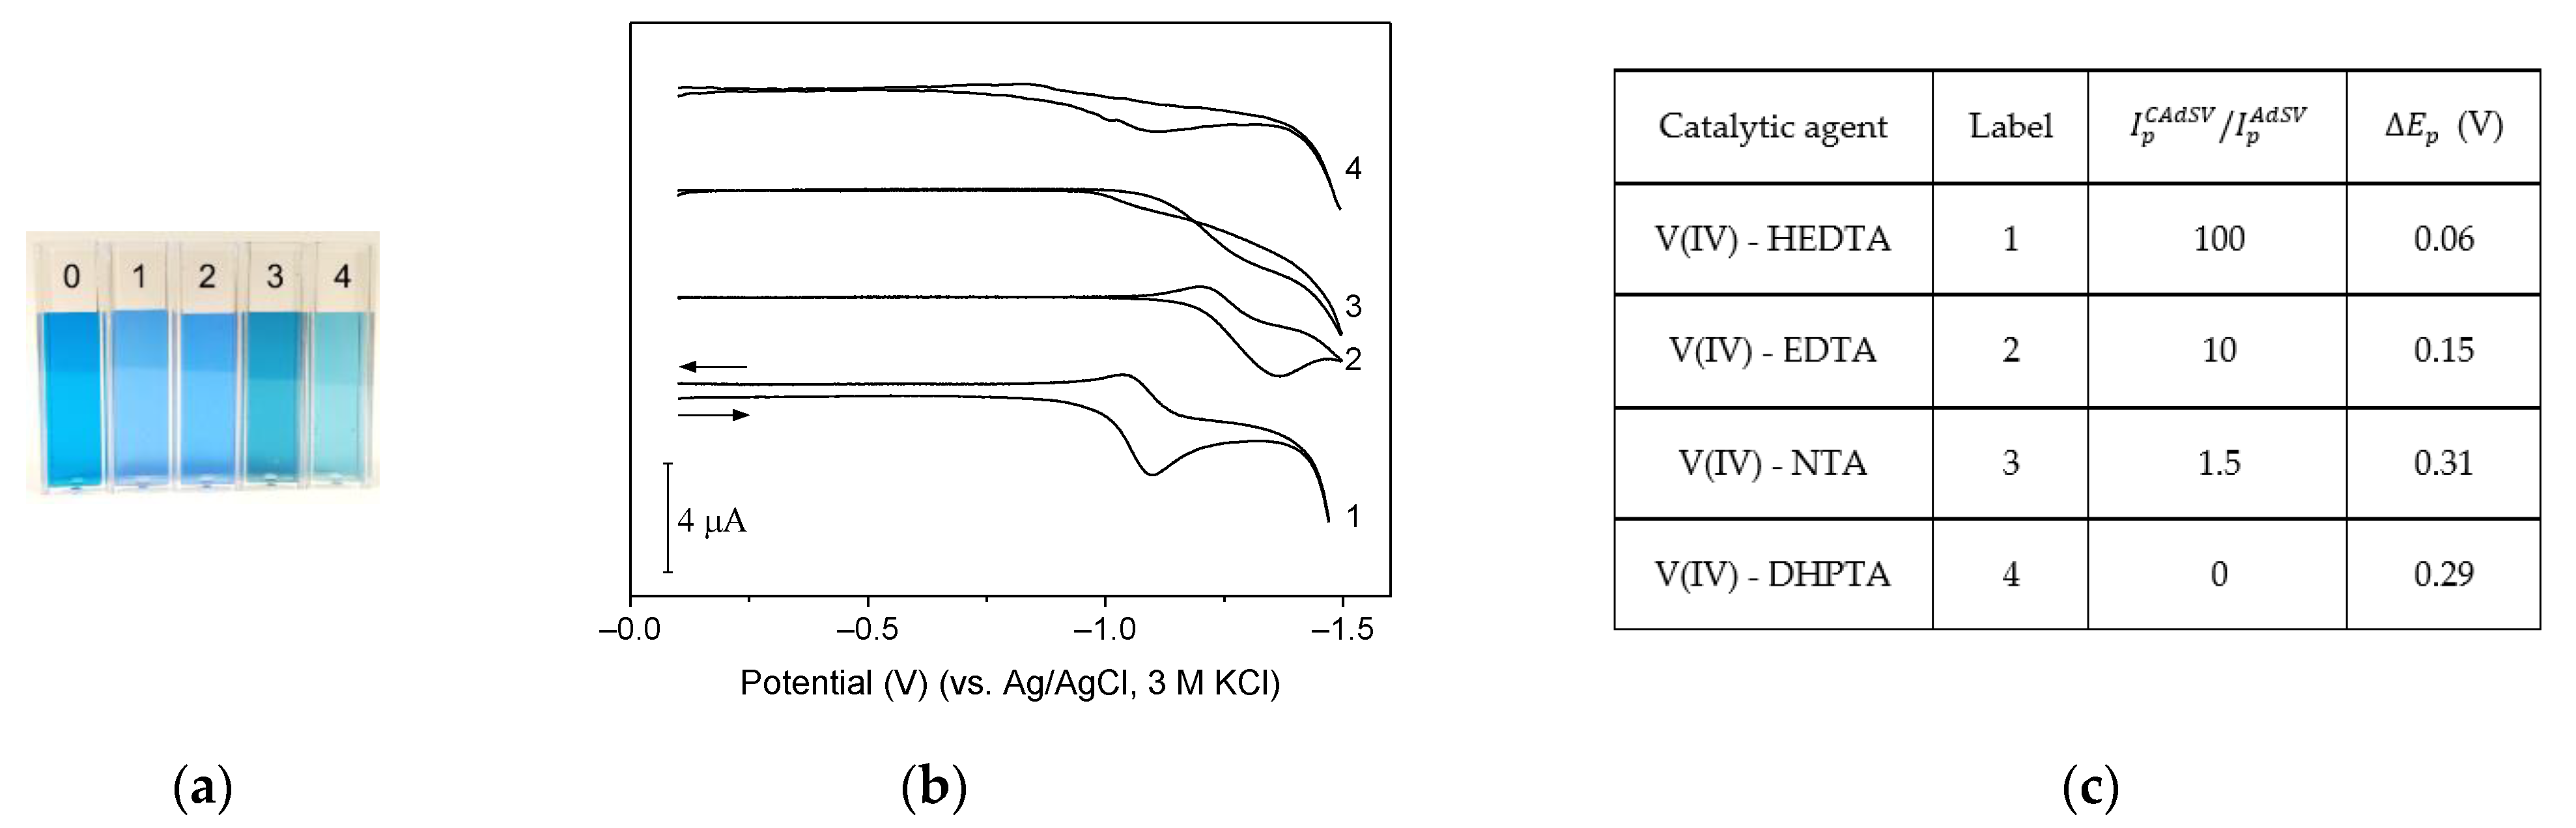
2.5. Catalytic Amplification of Germanium Voltammetric Signals in the Presence of V(IV)—HEDTA
2.5.1. Determination of Germanium Using Hanging Mercury DROP Electrode
2.5.2. Determination of Germanium Using the Silver Amalgam Film Electrode
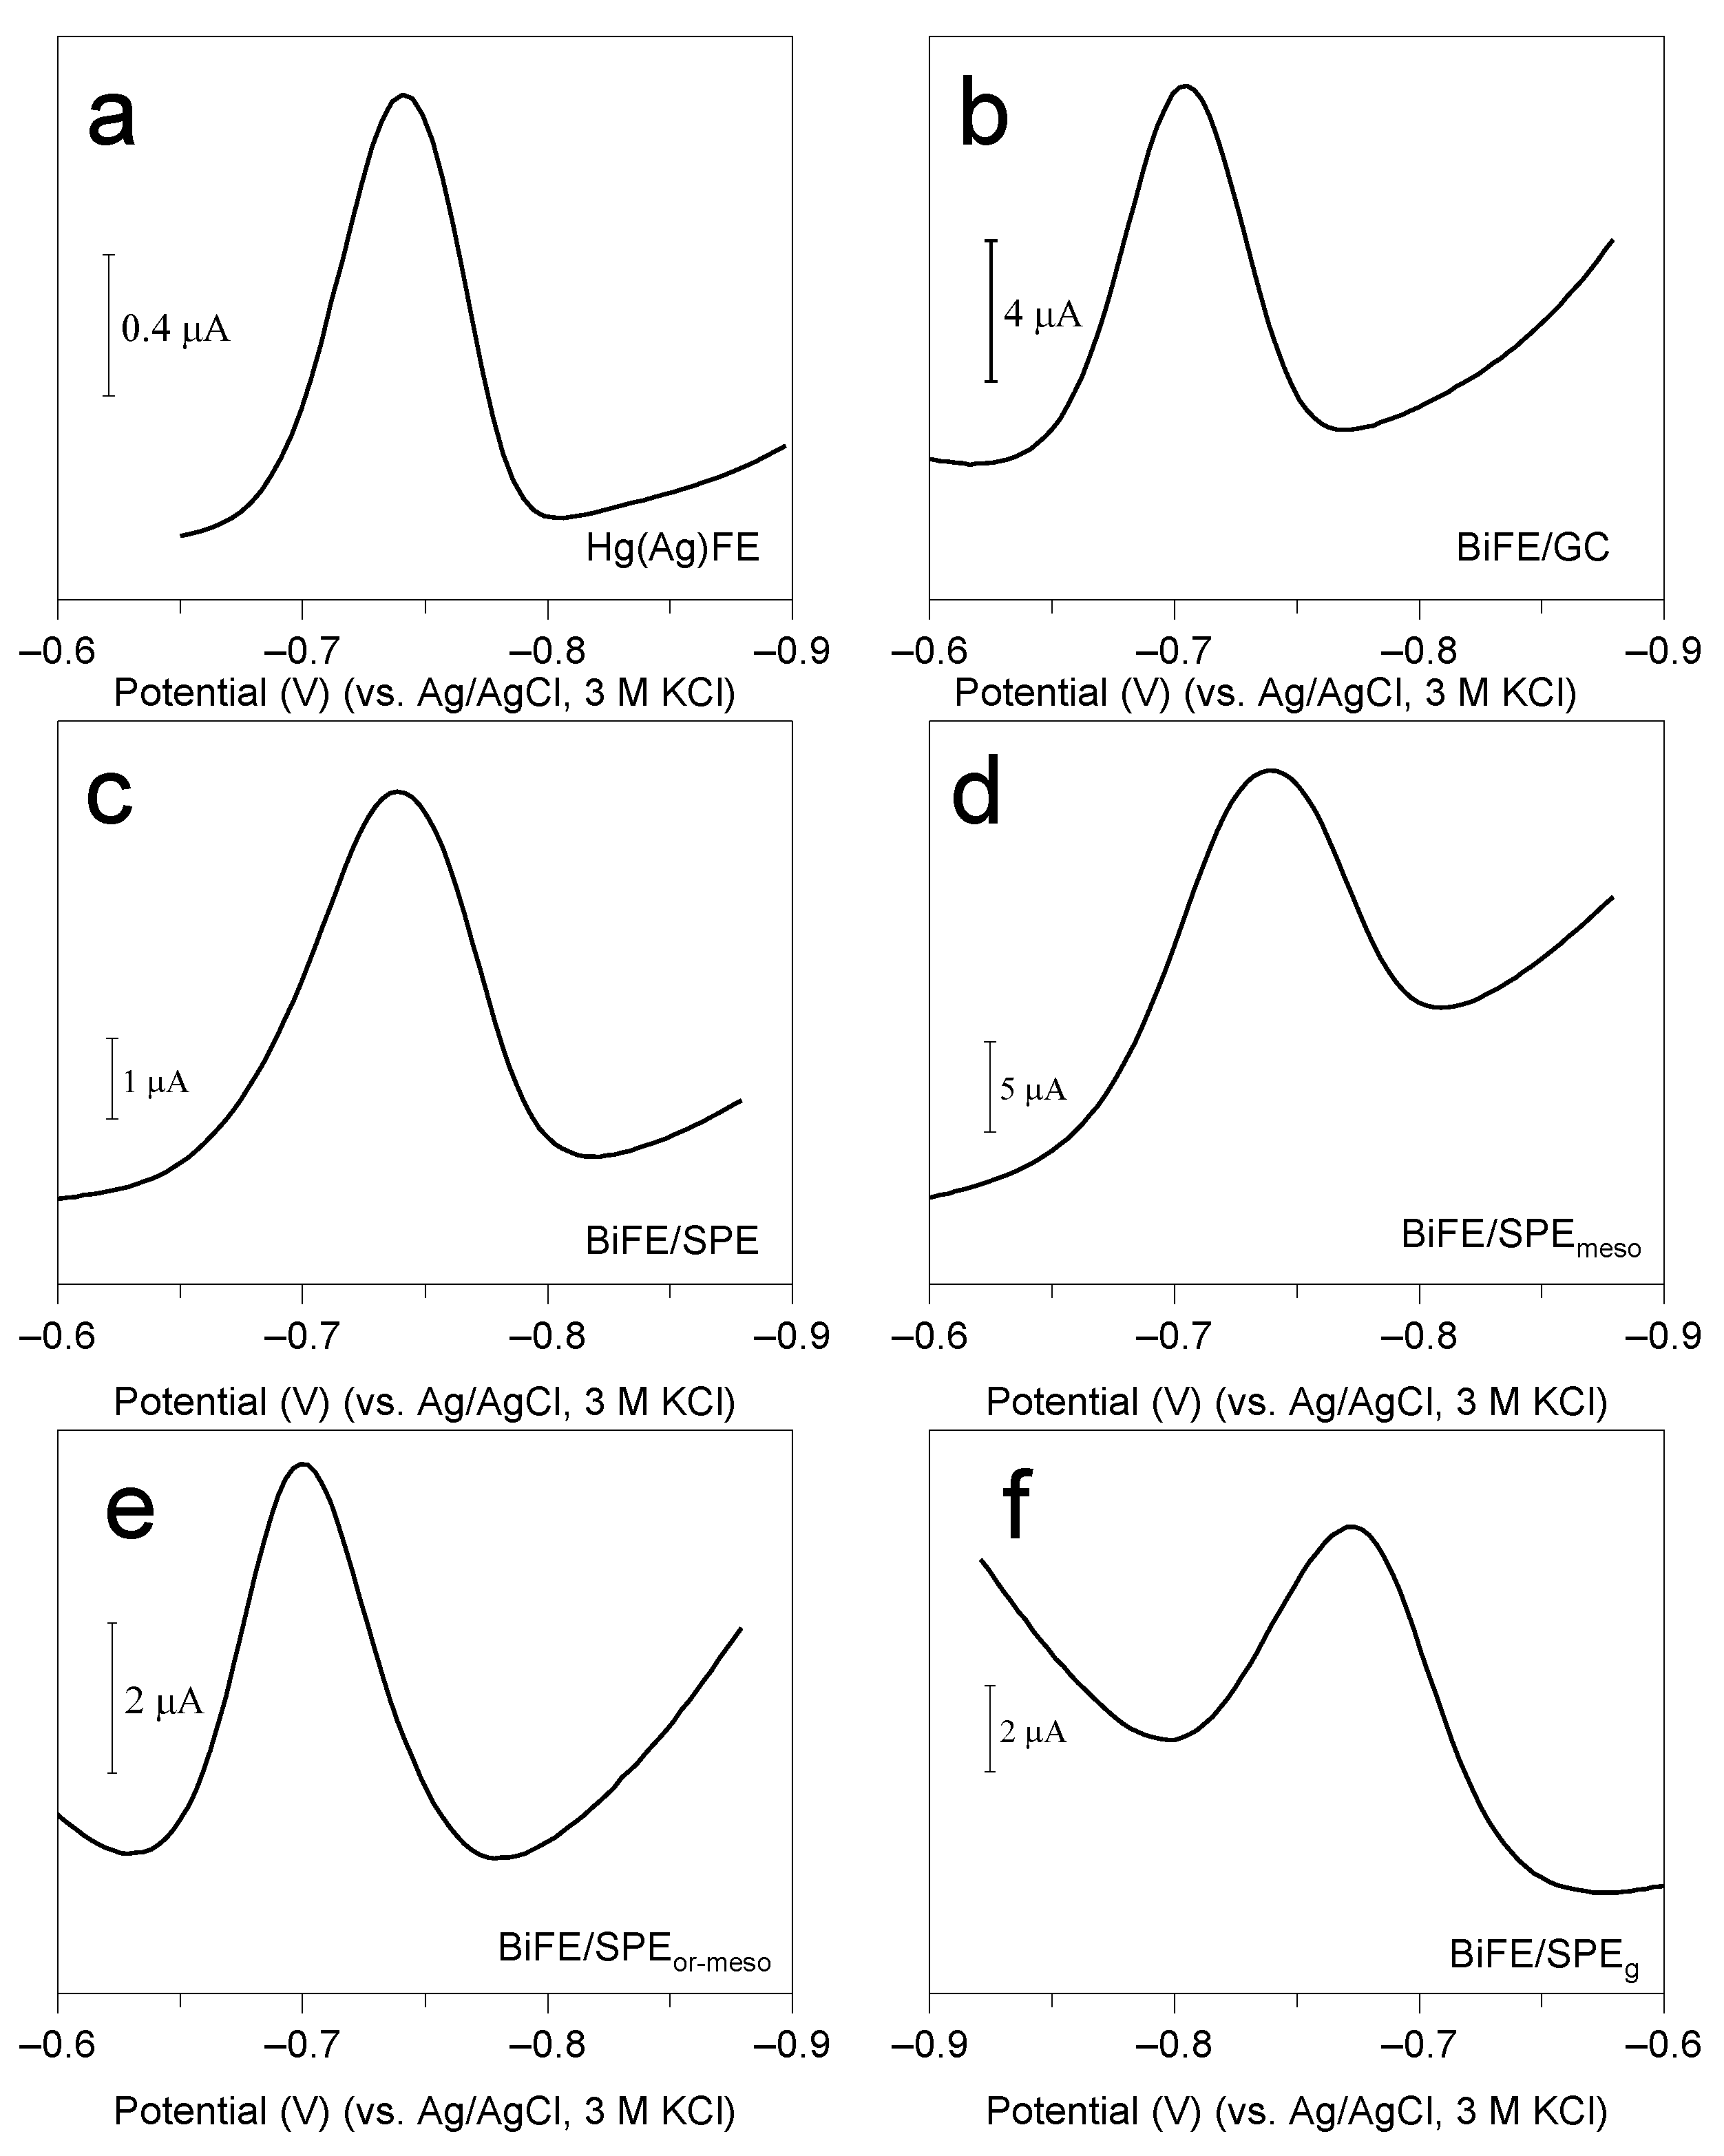
2.5.3. Determination of Germanium Using Bismuth Film Electrodes
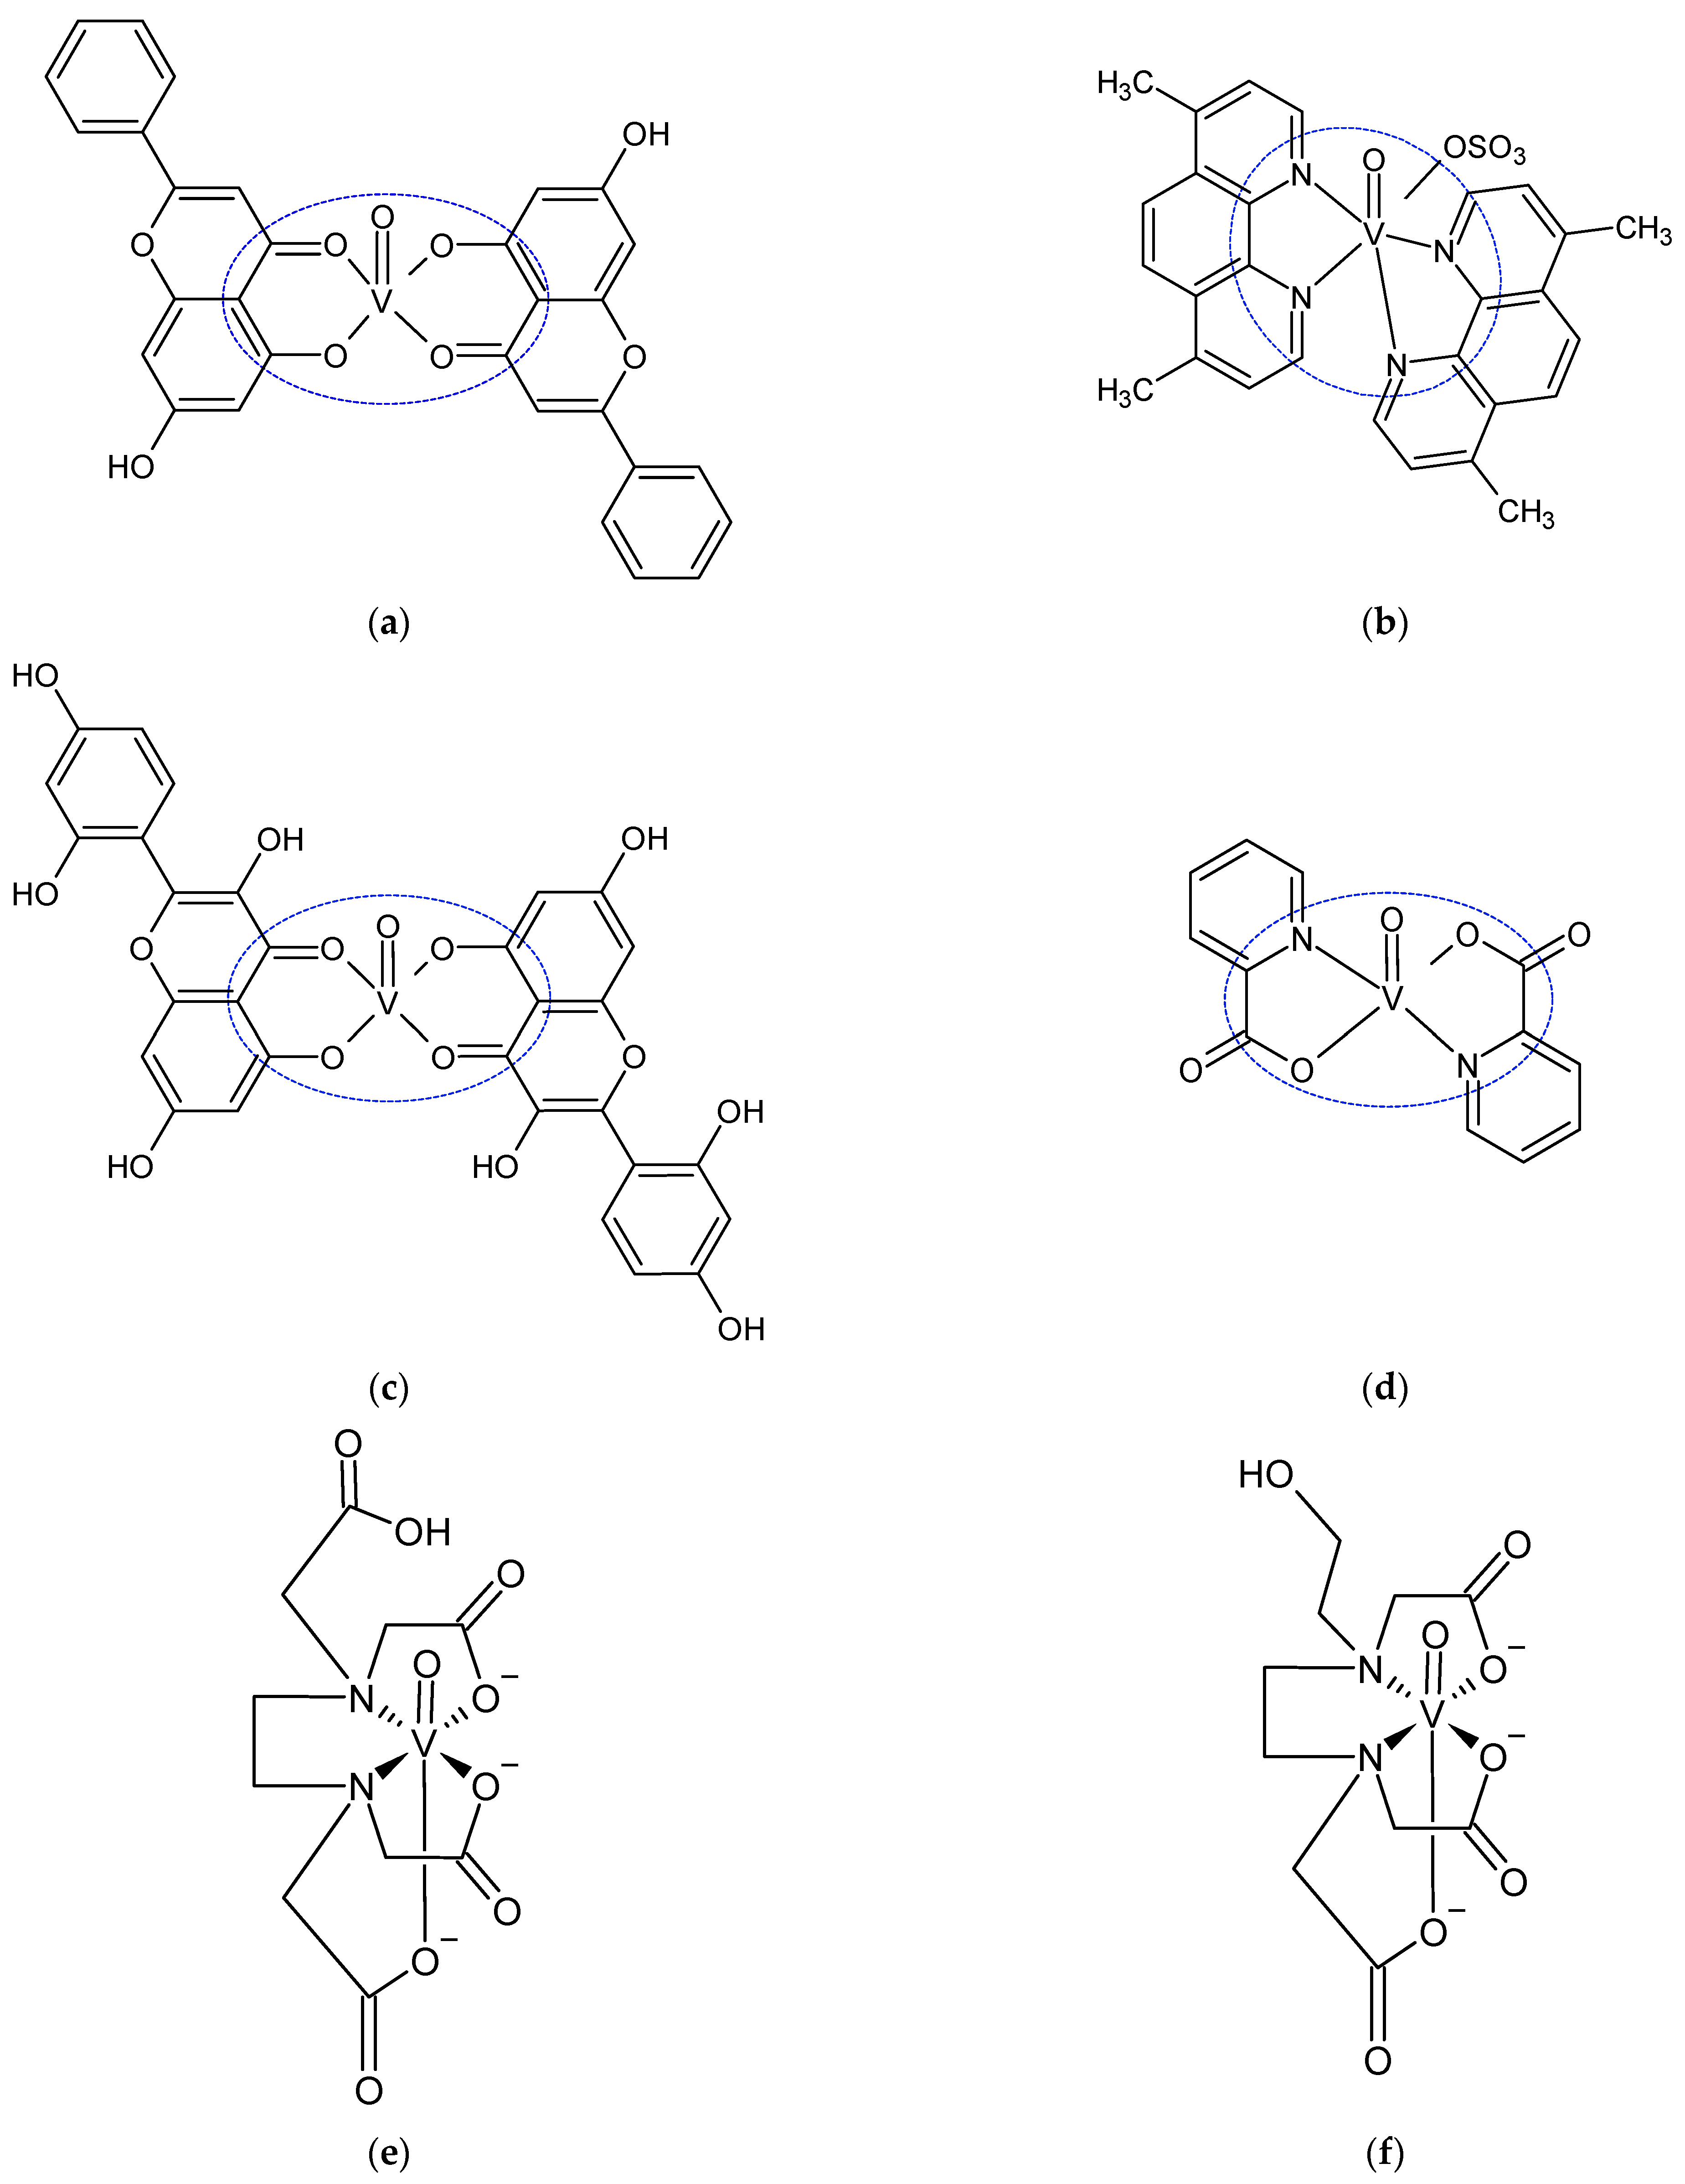
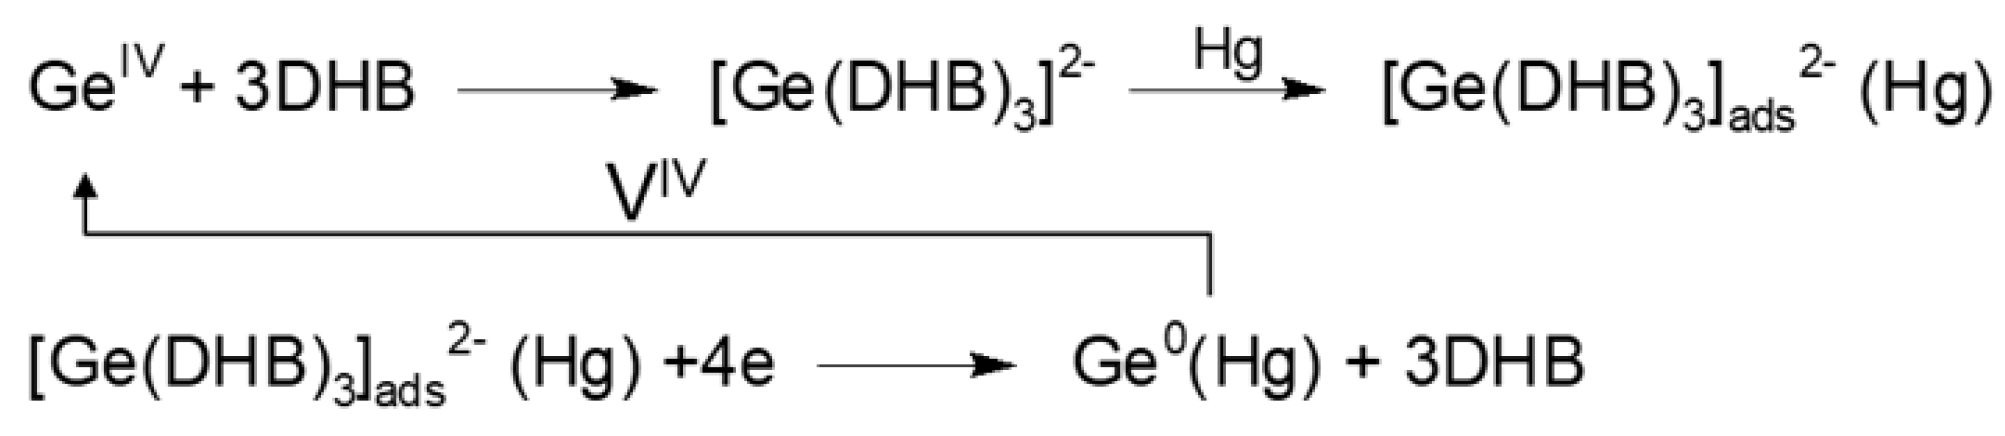
2.6. Catalytic Amplification of Germanium Voltammetric Signals by Other Aminopolycarboxylic Acid Complexes with V(IV)
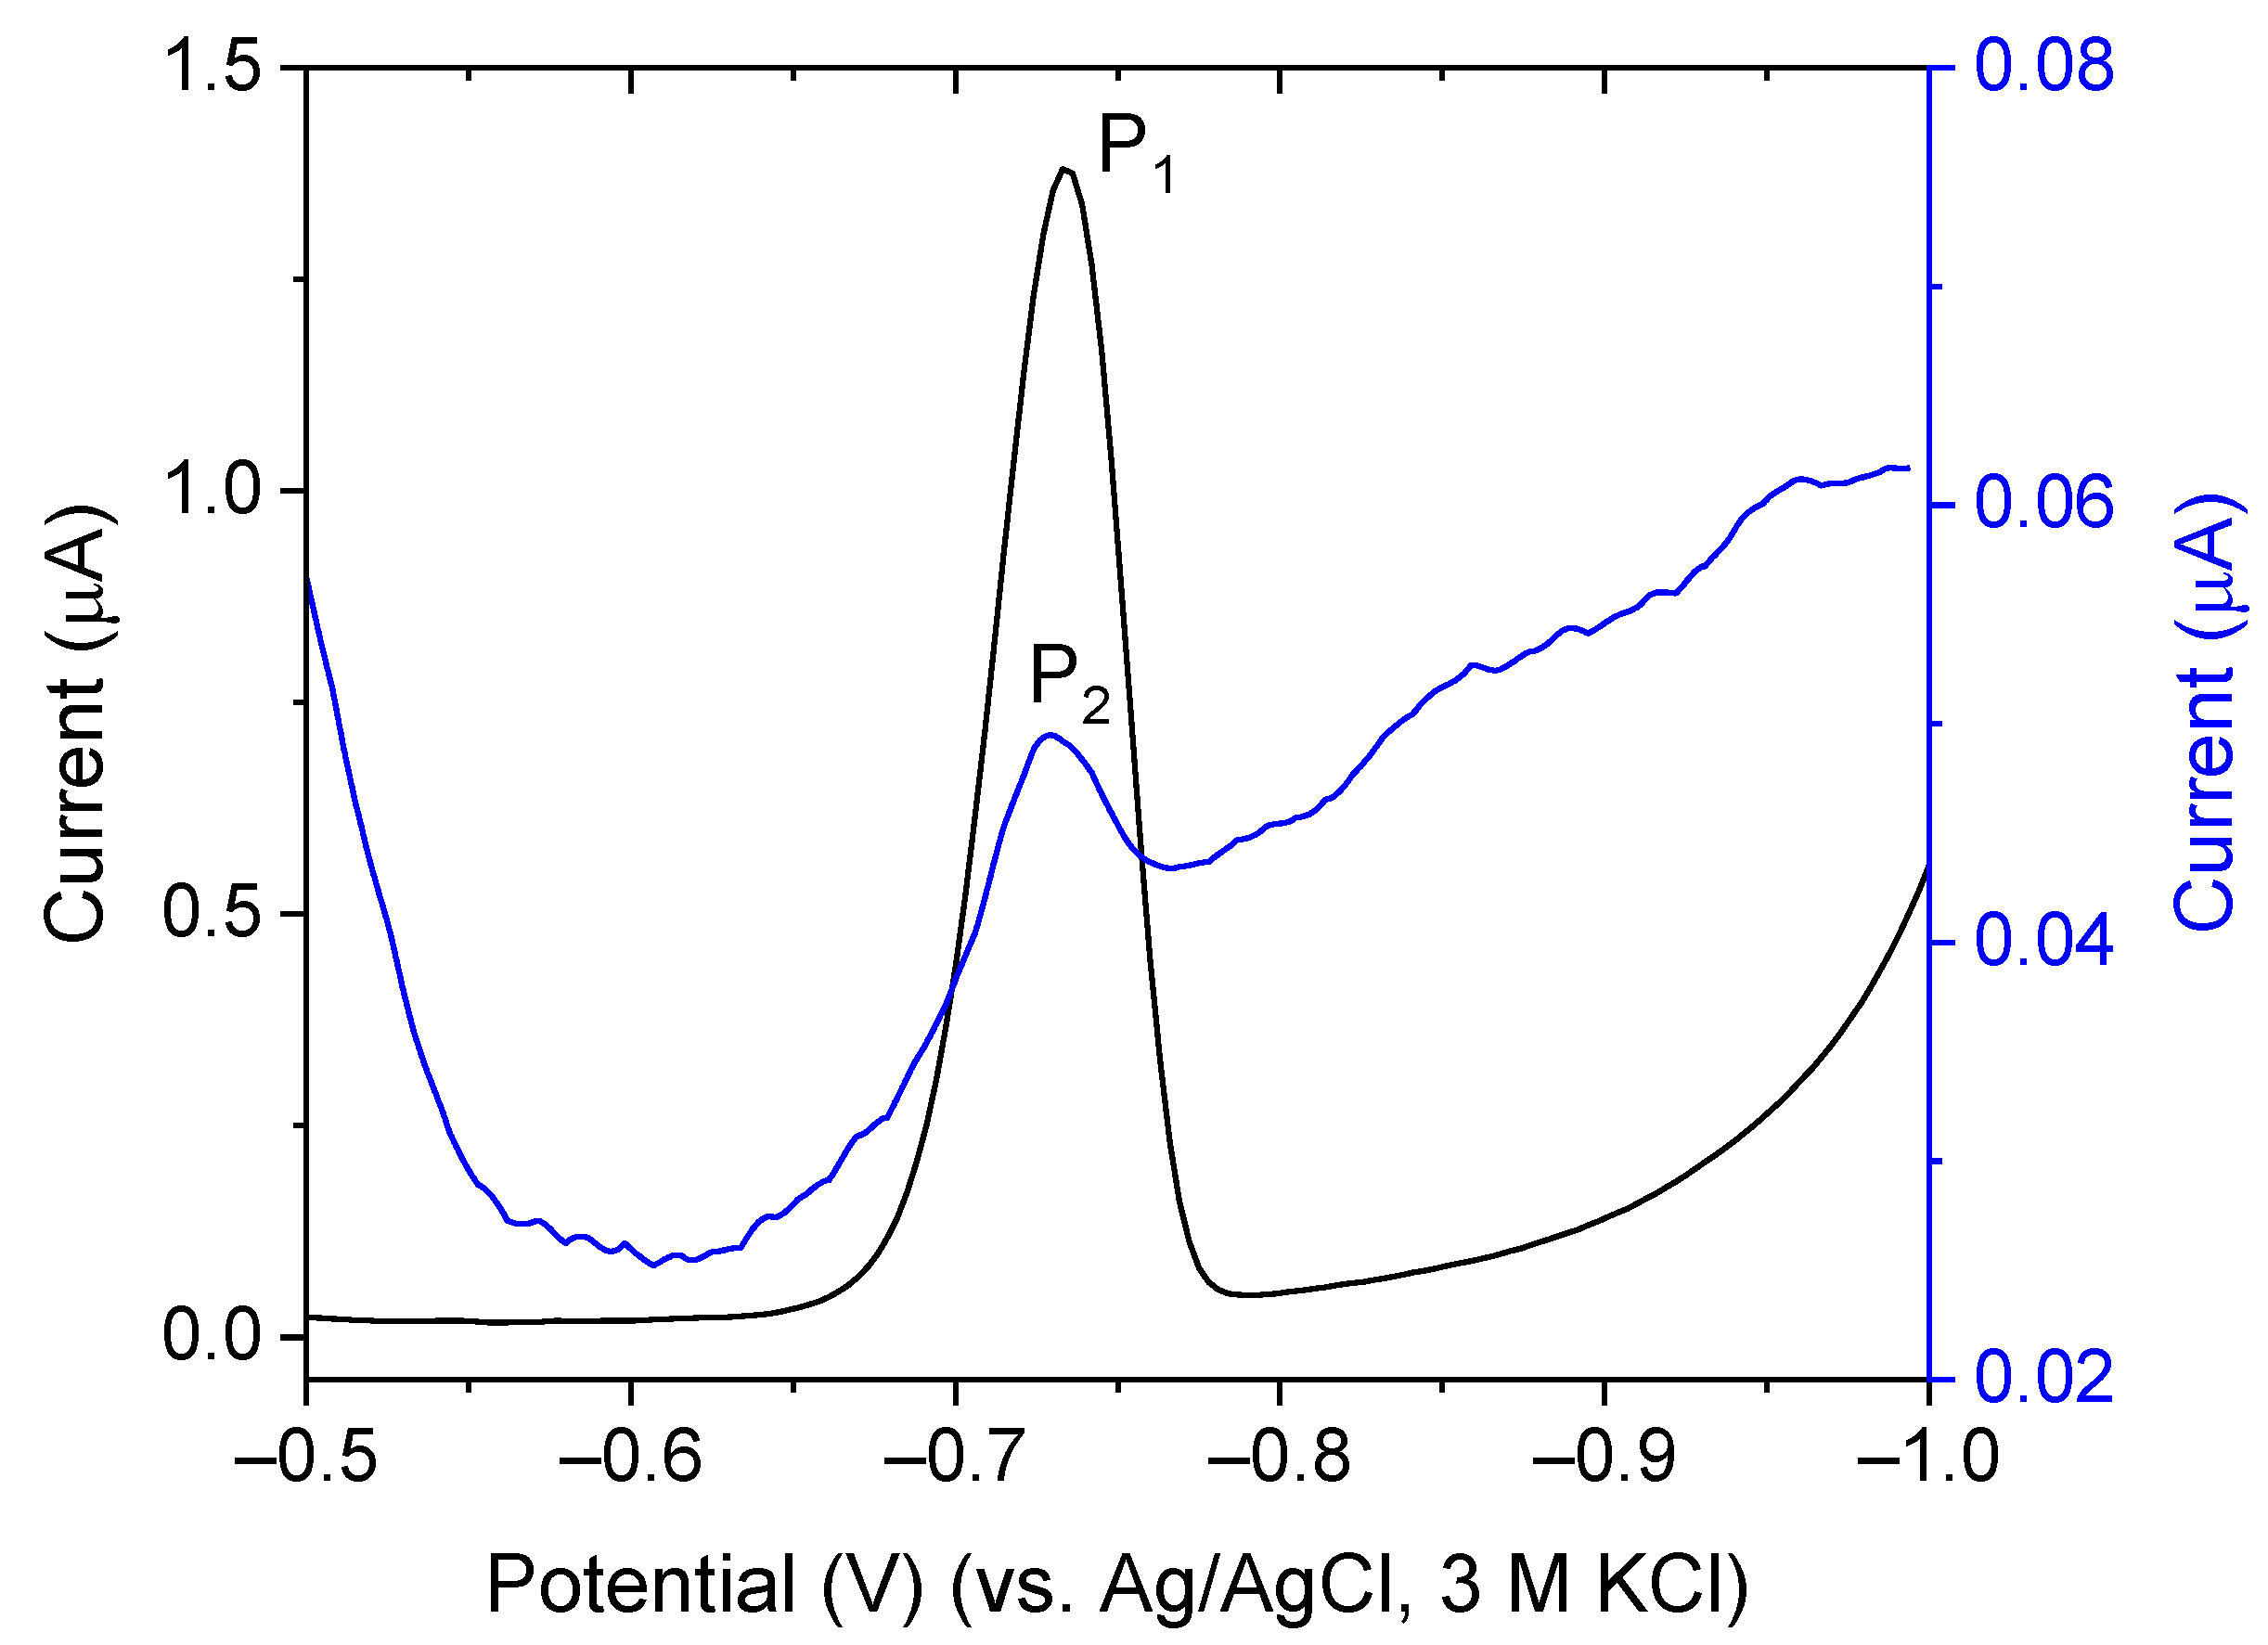
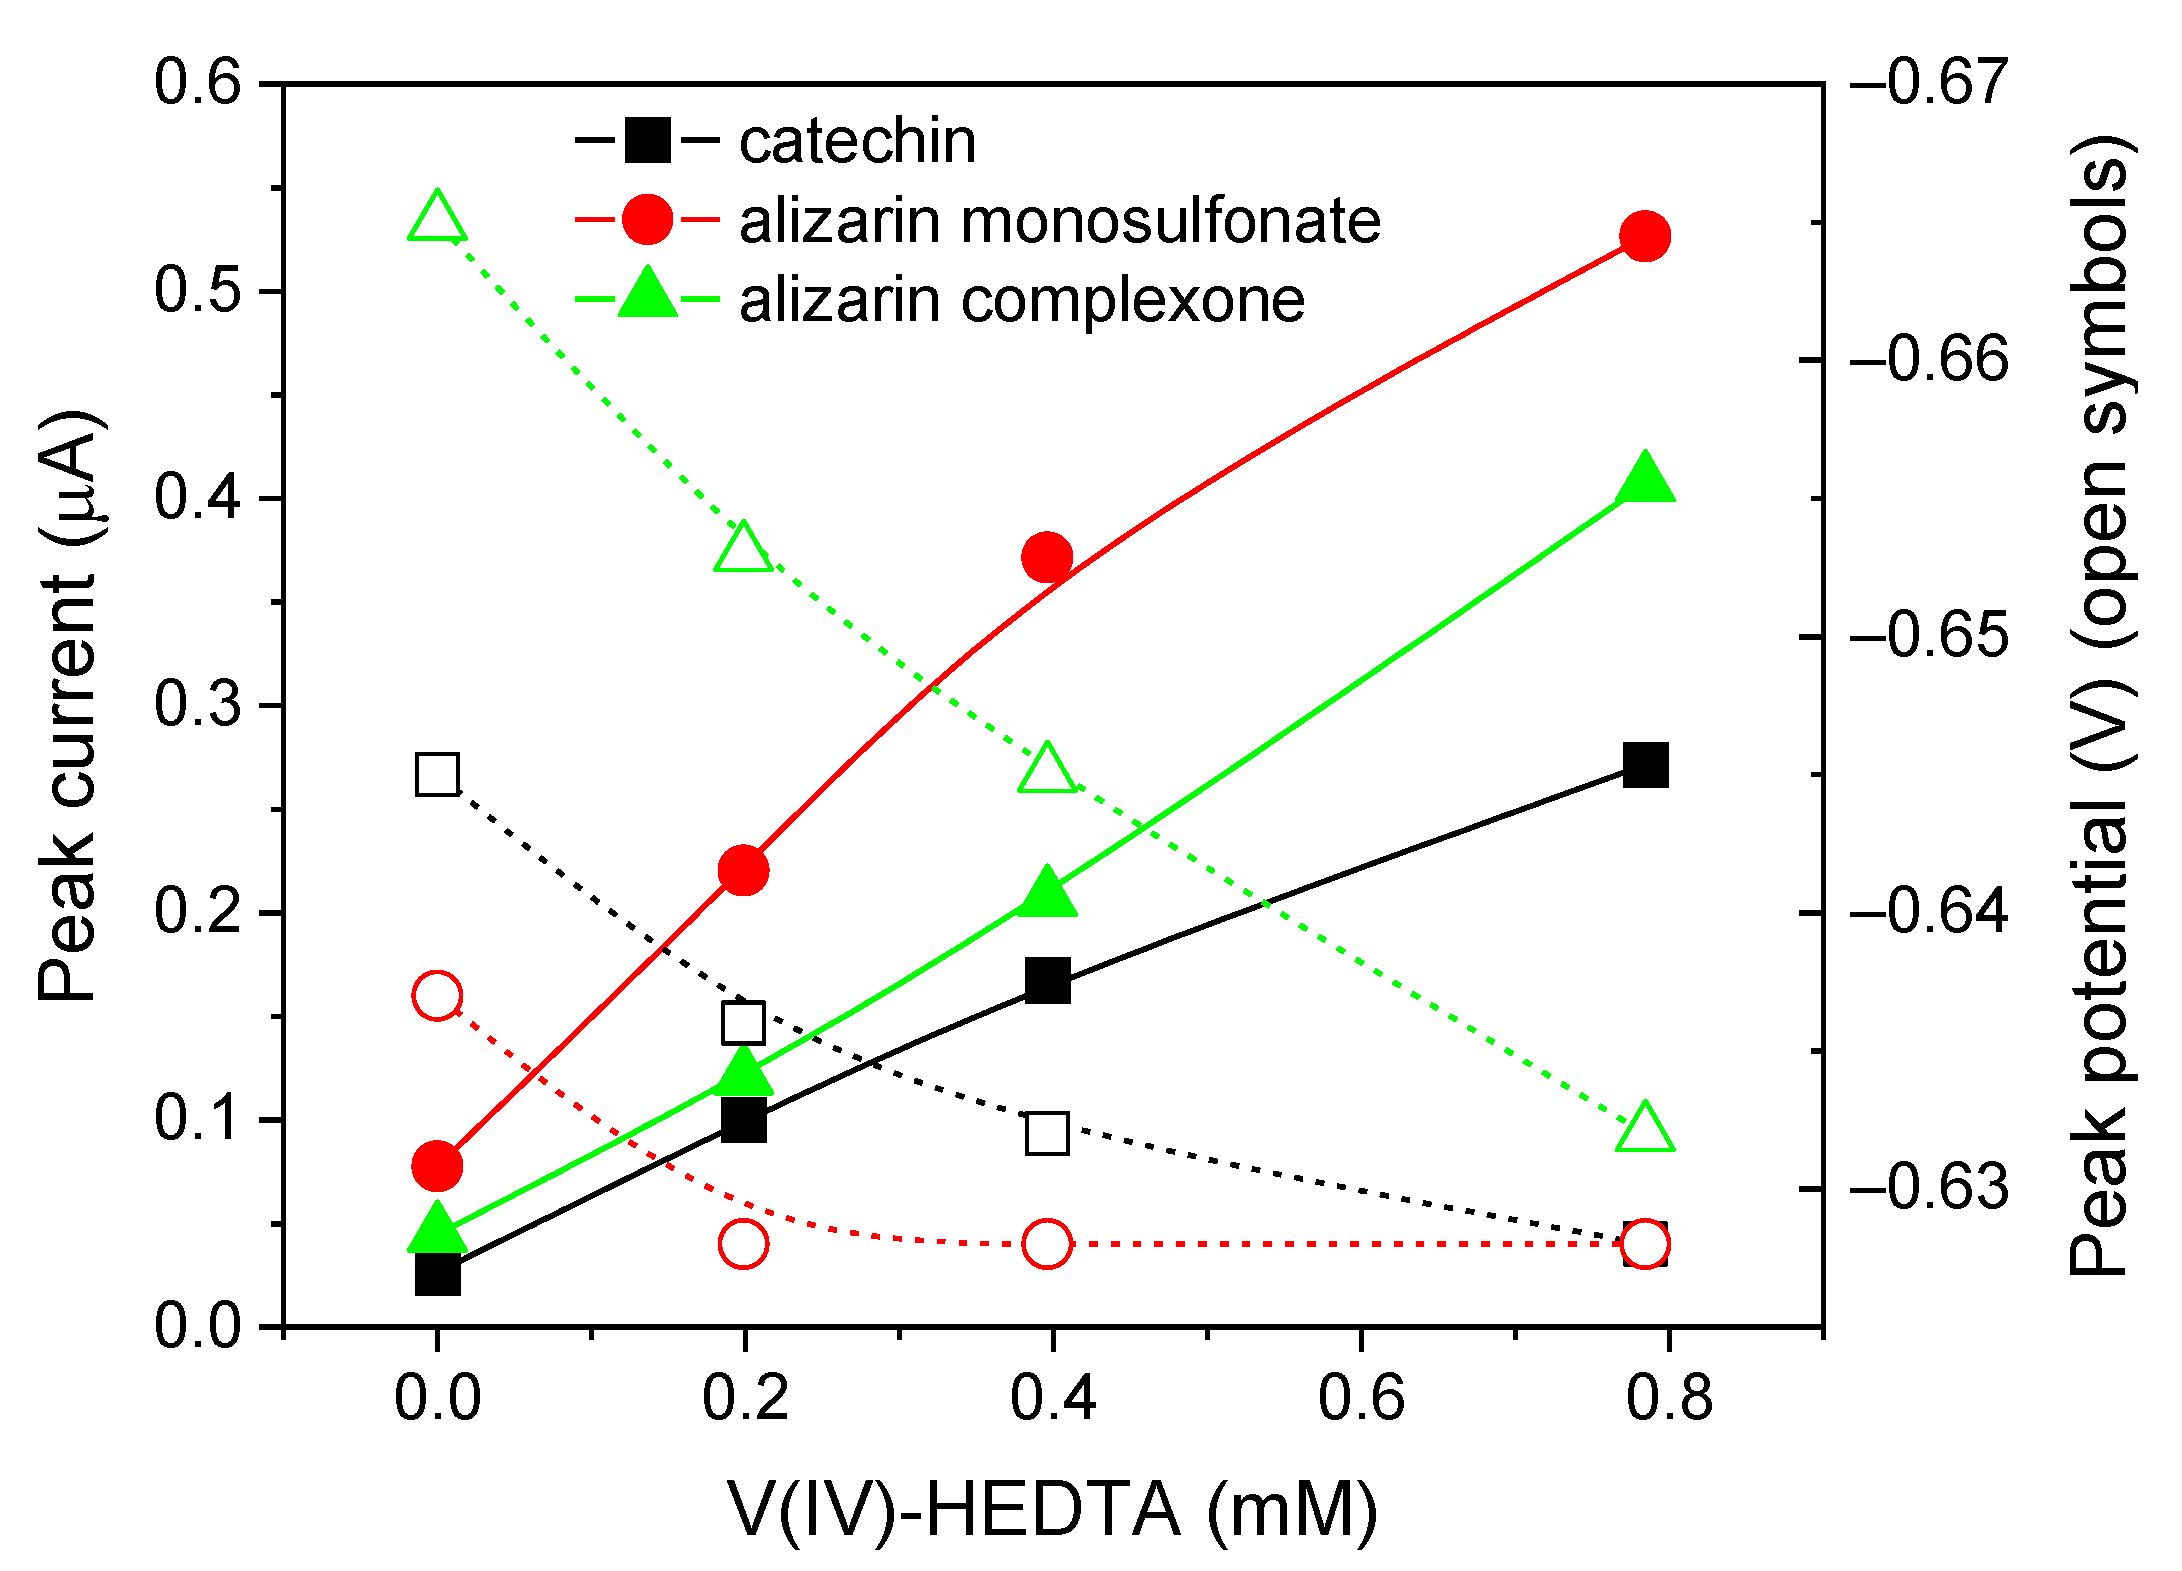
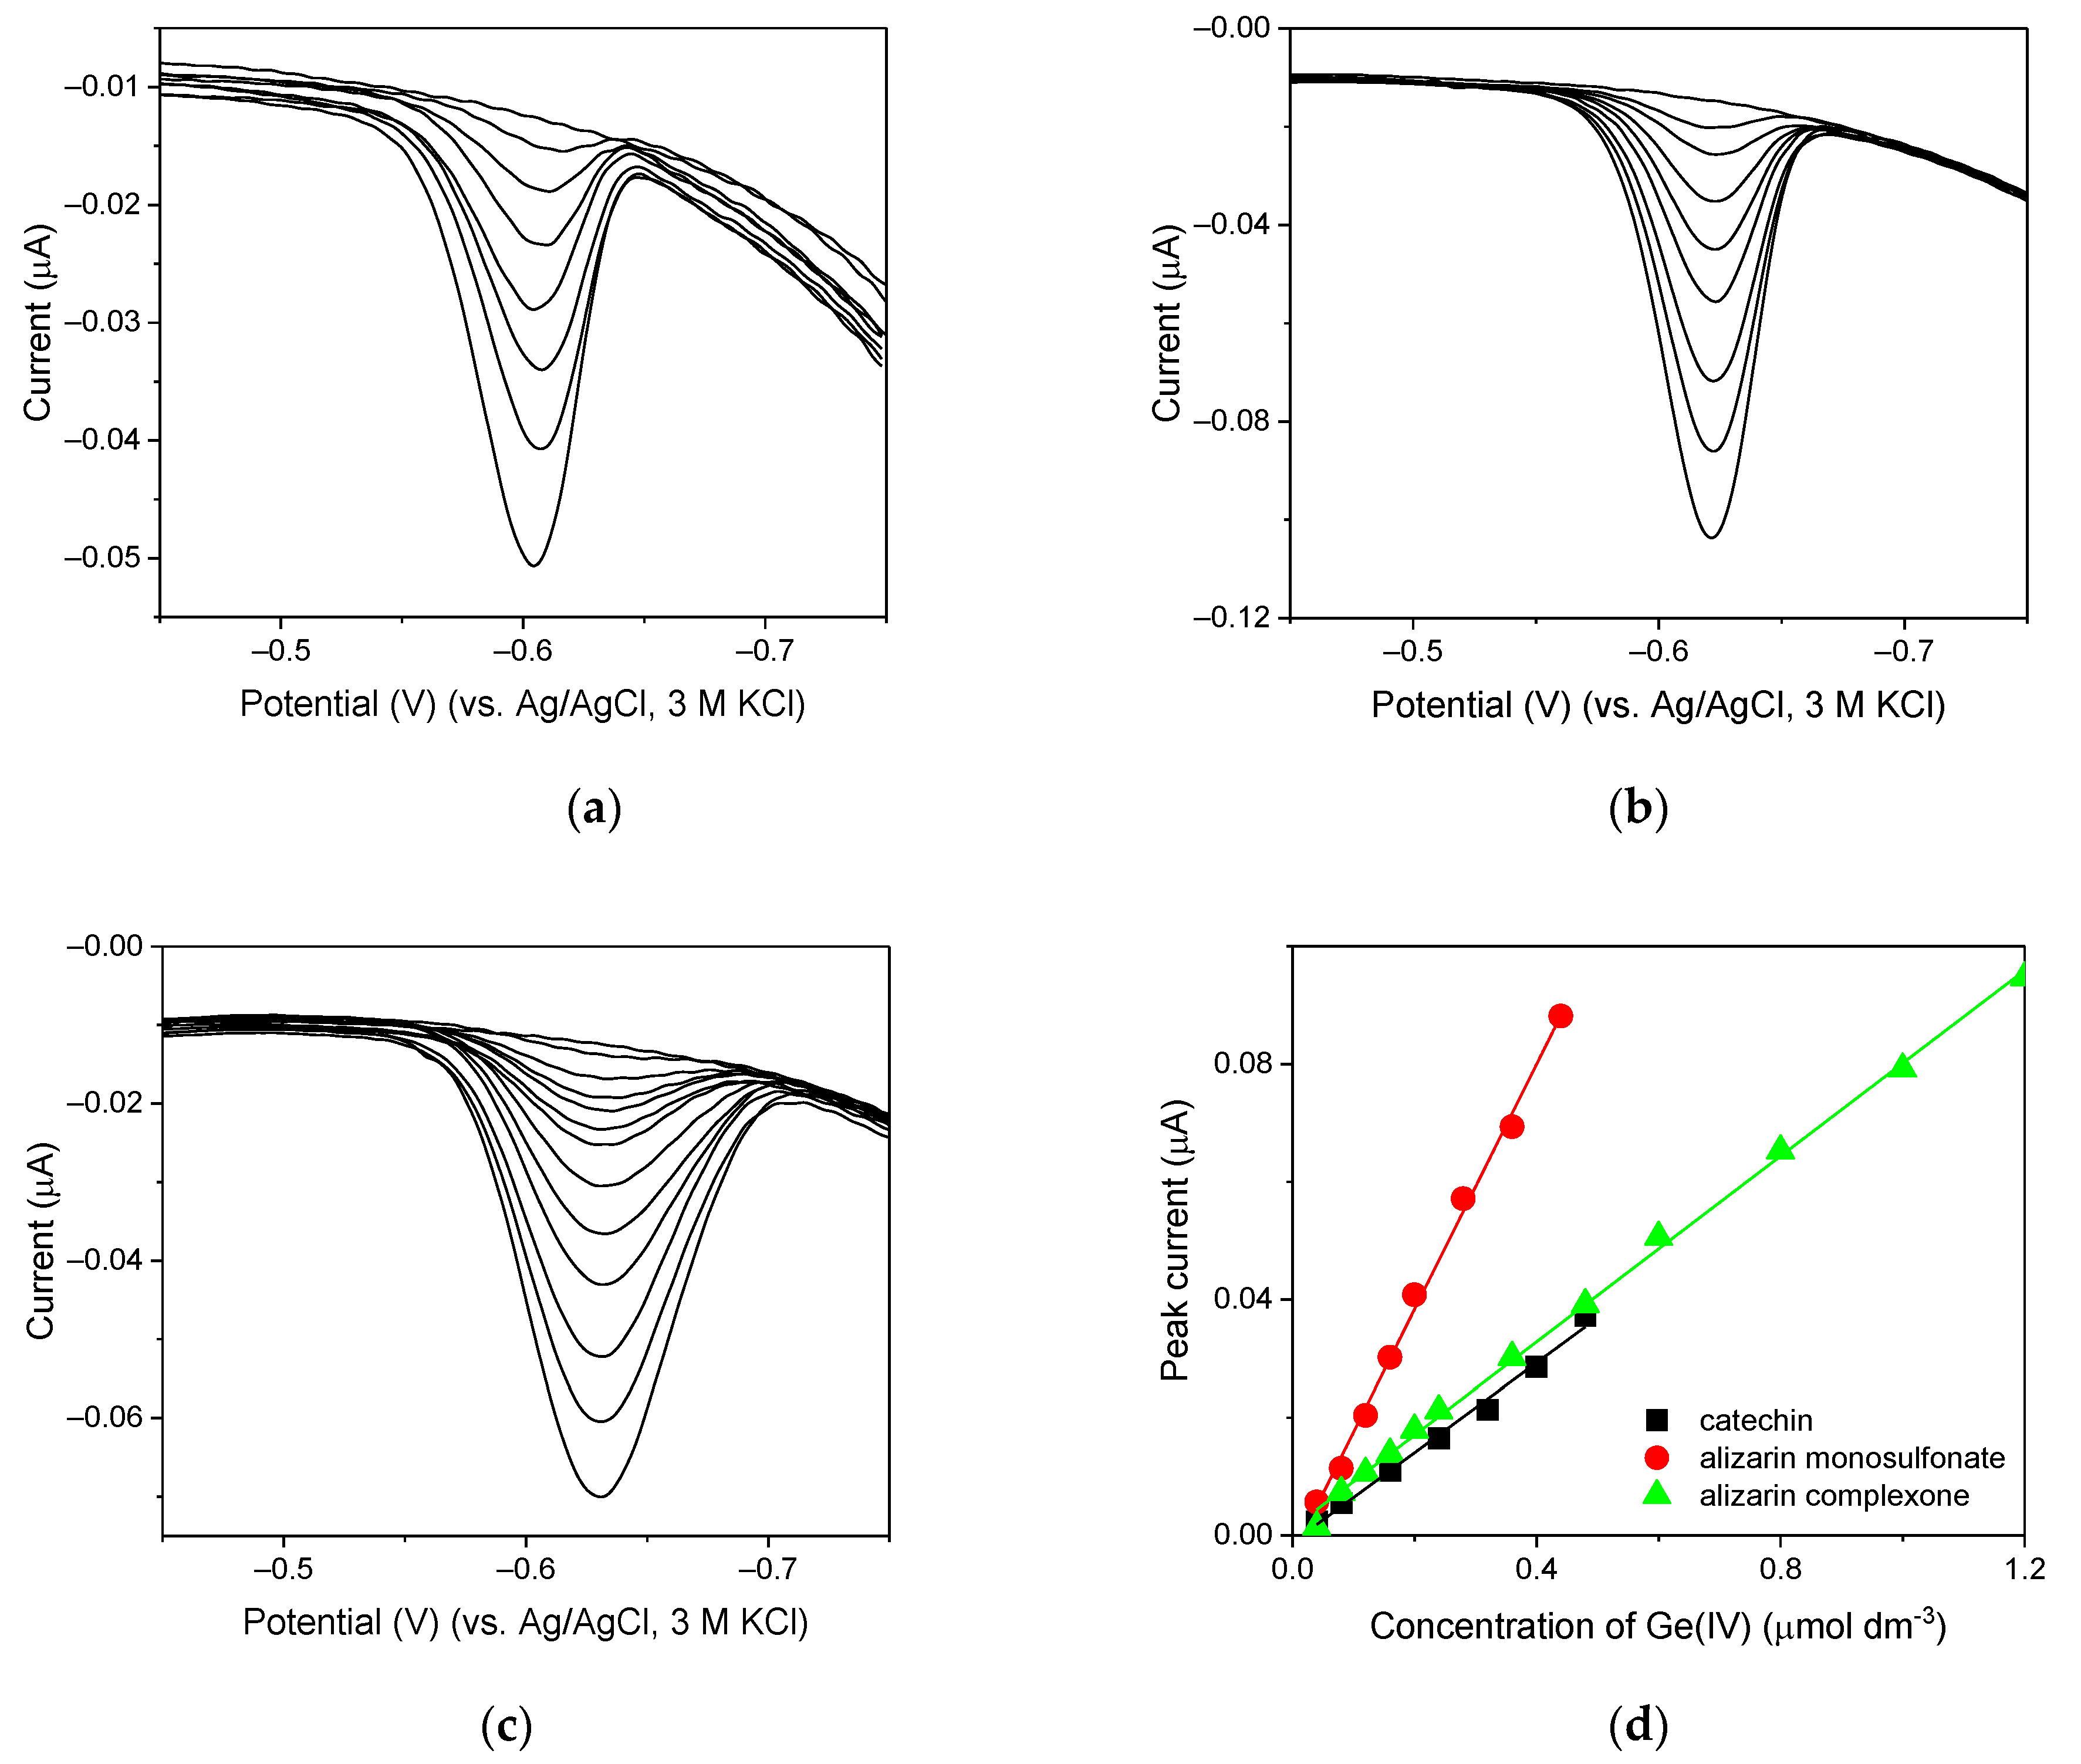
2.7. New Catalytic Systems Comprising Ge(IV) Complexes and V(IV)-HEDTA
3. Conclusions and Prospects
- The reduction of Ge(IV)-catechol (or ligands comprising a catechol moiety) to a very active Ge(II)-catechol complex.
- The formation of a composite complex by Ge(II)-catechol and V(IV)-HEDTA (or other aminopolycarboxylic complexes).
- The facilitated reduction of vanadium(IV) ions, a consequence of the binding of V(IV) to the Ge(II)-catechol-V(IV)-HEDTA complex.
- The dissociation of the composite complex and detachment of Ge(II)-catechol ready to bind the subsequent V(IV)-HEDTA ion.
- Facilitated reduction of newly bound vanadium(IV) ions and the formation of the catalytic cycle.
Author Contributions
Funding
Institutional Review Board Statement
Informed Consent Statement
Data Availability Statement
Conflicts of Interest
References
- Treviño, S.; Díaz, A.; Sánchez-Lara, E.; Sanchez-Gaytan, B.L.; Perez-Aguilar, J.M.; González-Vergara, E. Vanadium in Biological Action: Chemical, Pharmacological Aspects, and Metabolic Implications in Diabetes Mellitus. Biol. Trace Element Res. 2019, 188, 68–98. [Google Scholar] [CrossRef] [Green Version]
- Haber, J. Fifty years of my romance with vanadium oxide catalysts. Catal. Today 2009, 142, 100–113. [Google Scholar] [CrossRef]
- Langeslay, R.R.; Kaphan, D.M.; Marshall, C.L.; Stair, P.C.; Sattelberger, A.P.; Delferro, M. Catalytic Applications of Vanadium: A Mechanistic Perspective. Chem. Rev. 2019, 119, 2128–2191. [Google Scholar] [CrossRef] [PubMed]
- Israel, Y.; Meites, L. Vanadium. In Encyclopedia of Electrochemistry of the Elements; Bard, A.J., Ed.; Marcel Dekker Inc.: New York, NY, USA, 1976; Volume 7, pp. 336–378. [Google Scholar]
- Shaw, M.J. Vanadium Electrochemistry. In Encyclopedia of Electrochemistry; Wiley: Hoboken, NJ, USA, 2006; pp. 357–381. [Google Scholar]
- Galloni, P.; Conte, V.; Floris, B. A journey into the electrochemistry of vanadium compounds. Coord. Chem. Rev. 2015, 301–302, 240–299. [Google Scholar] [CrossRef] [Green Version]
- Krakowiak, J.; Lundberg, D.; Persson, I. A Coordination Chemistry Study of Hydrated and Solvated Cationic Vanadium Ions in Oxidation States +III, +IV, and +V in Solution and Solid State. Inorg. Chem. 2012, 51, 9598–9609. [Google Scholar] [CrossRef] [PubMed]
- Grant, A.W. Vanadium for high school students. J. Chem. Educ. 1977, 54, 500. [Google Scholar] [CrossRef]
- Skyllas-Kazacos, M.; McCann, J. Vanadium redox flow batteries (VRBs) for medium- and large-scale energy storage. In Advances in Batteries for Medium and Large-Scale Energy Storage; Woodhead Publishing: Shaston, UK, 2015; pp. 329–386. [Google Scholar]
- Pessoa, J.C. Thirty years through vanadium chemistry. J. Inorg. Biochem. 2015, 147, 4–24. [Google Scholar] [CrossRef]
- León, I.E.; Díez, P.; Etcheverry, S.B.; Fuentes, M. Deciphering the effect of an oxovanadium(iv) complex with the flavonoid chrysin (VOChrys) on intracellular cell signalling pathways in an osteosarcoma cell line. Metallomics 2016, 8, 739–749. [Google Scholar] [CrossRef] [PubMed]
- D’Cruz, O.J.; Uckun, F.M. Metvan: A novel oxovanadium(IV) complex with broad spectrum anticancer activity. Expert Opin. Investig. Drugs 2002, 11, 1829–1836. [Google Scholar] [CrossRef]
- Del Carpio, E.; Hernández, L.; Ciangherotti, C.; Coa, V.V.; Jiménez, L.; Lubes, V.; Lubes, G. Vanadium: History, chemistry, interactions with α-amino acids and potential therapeutic applications. Coord. Chem. Rev. 2018, 372, 117–140. [Google Scholar] [CrossRef] [PubMed]
- Alberico, E.; Micera, G.; Sanna, D.; Dessì, A. Coordination of oxovanadium(IV) to aminocarboxylic acids in aqueous solution. Polyhedron 1994, 13, 1763–1771. [Google Scholar] [CrossRef]
- Wu, X.; Peters, B.J.; Rithner, C.D.; Crans, D.C. Multinuclear NMR studies of aqueous vanadium–HEDTA complexes. Polyhedron 2016, 114, 325–332. [Google Scholar] [CrossRef]
- Li, H.-Y.; Li, D.-Q.; Yang, Y.; Zhang, X.; Diao, J.; Xie, B. Re-examination of complexation behaviors of V(v) and V(iv): Experimental investigation and theoretical simulation. J. Anal. At. Spectrom. 2020, 35, 878–885. [Google Scholar] [CrossRef]
- Li, X.; Zhang, Z.; Liu, B.; Mu, W.; Yang, Y.; Martin, L.R.; Luo, S.; Rao, L. Complexation of Light Trivalent Lanthanides with N-(2-Hydroxyethyl)ethylenediamine-N,N′,N′-triacetic Acid in Aqueous Solutions: Thermodynamic Analysis and Coordination Modes. Inorg. Chem. 2019, 58, 15618–15628. [Google Scholar] [CrossRef] [PubMed]
- Nash, K.L. The Chemistry of TALSPEAK: A Review of the Science. Solvent Extr. Ion Exch. 2015, 33, 1–55. [Google Scholar] [CrossRef]
- Kanamori, K. Structures and properties of multinuclear vanadium(III) complexes: Seeking a clue to understand the role of vanadium(III) in ascidians. Coord. Chem. Rev. 2003, 237, 147–161. [Google Scholar] [CrossRef]
- Leelavathy, L.; Anbu, S.; Kandaswamy, M.; Karthikeyan, N.; Mohan, N. Synthesis and characterization of a new series of unsymmetrical macrocyclic binuclear vanadyl(IV) complexes: Electrochemical, antimicrobial, DNA binding and cleavage studies. Polyhedron 2009, 28, 903–910. [Google Scholar] [CrossRef]
- Pokrovski, G.S.; Martin, F.; Hazemann, J.-L.; Schott, J. An X-ray absorption fine structure spectroscopy study of germanium-organic ligand complexes in aqueous solution. Chem. Geol. 2000, 163, 151–165. [Google Scholar] [CrossRef]
- Schleich, C.; Henze, C. Trace analysis of germanium. Part 2. Polarographic behaviour and determination by adsorptive strip-ping voltammetry, Fresenius. J. Anal Chem. 1990, 338, 145–148. [Google Scholar]
- Piech, R. Study on simultaneous measurements of trace gallium(III) and germanium(IV) by adsorptive stripping voltammetry using mercury film electrode. J. Appl. Electrochem. 2010, 41, 207–214. [Google Scholar] [CrossRef]
- Ly, S.Y.; Song, S.S.; Kim, S.K.; Jung, Y.S.; Lee, C.H. Determination of Ge(IV) in rice in a mercury-coated glassy carbon electrode in the presence of catechol. Food Chem. 2006, 95, 337–343. [Google Scholar] [CrossRef]
- Alvarez, J.M.; Calzon, J.G.; Fonseca, J.L. Electrochemical Reduction of Ge(IV) Catalyzed by o-Catechol at the Dropping Mercury Electrode and at the Hanging Mercury Drop Electrode after Adsorptive Preconcentration. Electroanalysis 1999, 11, 656–659. [Google Scholar] [CrossRef]
- Alvarez, J.L.M.; Calzón, J.A.G.; Fonseca, J.M.L. Square-wave voltammetry of the o-catechol-Ge(IV) catalytic system after adsorptive preconcentration at a hanging mercury drop electrode. Talanta 2001, 53, 721–731. [Google Scholar] [CrossRef]
- Hasebe, K.; Hikima, S.; Kakizaki, T.; Iwashimizu, T.; Aoki, K. Trace determination of germanium by means of adsorption waves in differential-pulse polarography. Analyst 1990, 115, 413–416. [Google Scholar] [CrossRef]
- Sun, C.; Gao, Q.; Liu, L. Adsorptive stripping measurements of germanium(IV) in the presence of pyrogallol. Talanta 1995, 42, 881–884. [Google Scholar] [CrossRef]
- Aguilar, J.C.; de Gyves, J. Determination of germanium(IV) in sulphide ores by differential pulse polarography in pyrogal-lol-sulfuric acid media. Anal. Chim. Acta 1995, 306, 243–247. [Google Scholar] [CrossRef]
- Gökmeşe, F.; Gökmeşe, E.; Osman Solak, A. A new adsorptive square-wave stripping voltammetric method for the trace anal-ysis of germanium, Hacettepe. J. Biol. Chem. 2008, 36, 215–221. [Google Scholar]
- Bond, A.M.; Kratsis, S.; Newman, O.M.G. Adsorptive Stripping Voltammetric Determination of Germanium in Zinc Plant Electrolyte. Electroanalysis 1998, 10, 387–392. [Google Scholar] [CrossRef]
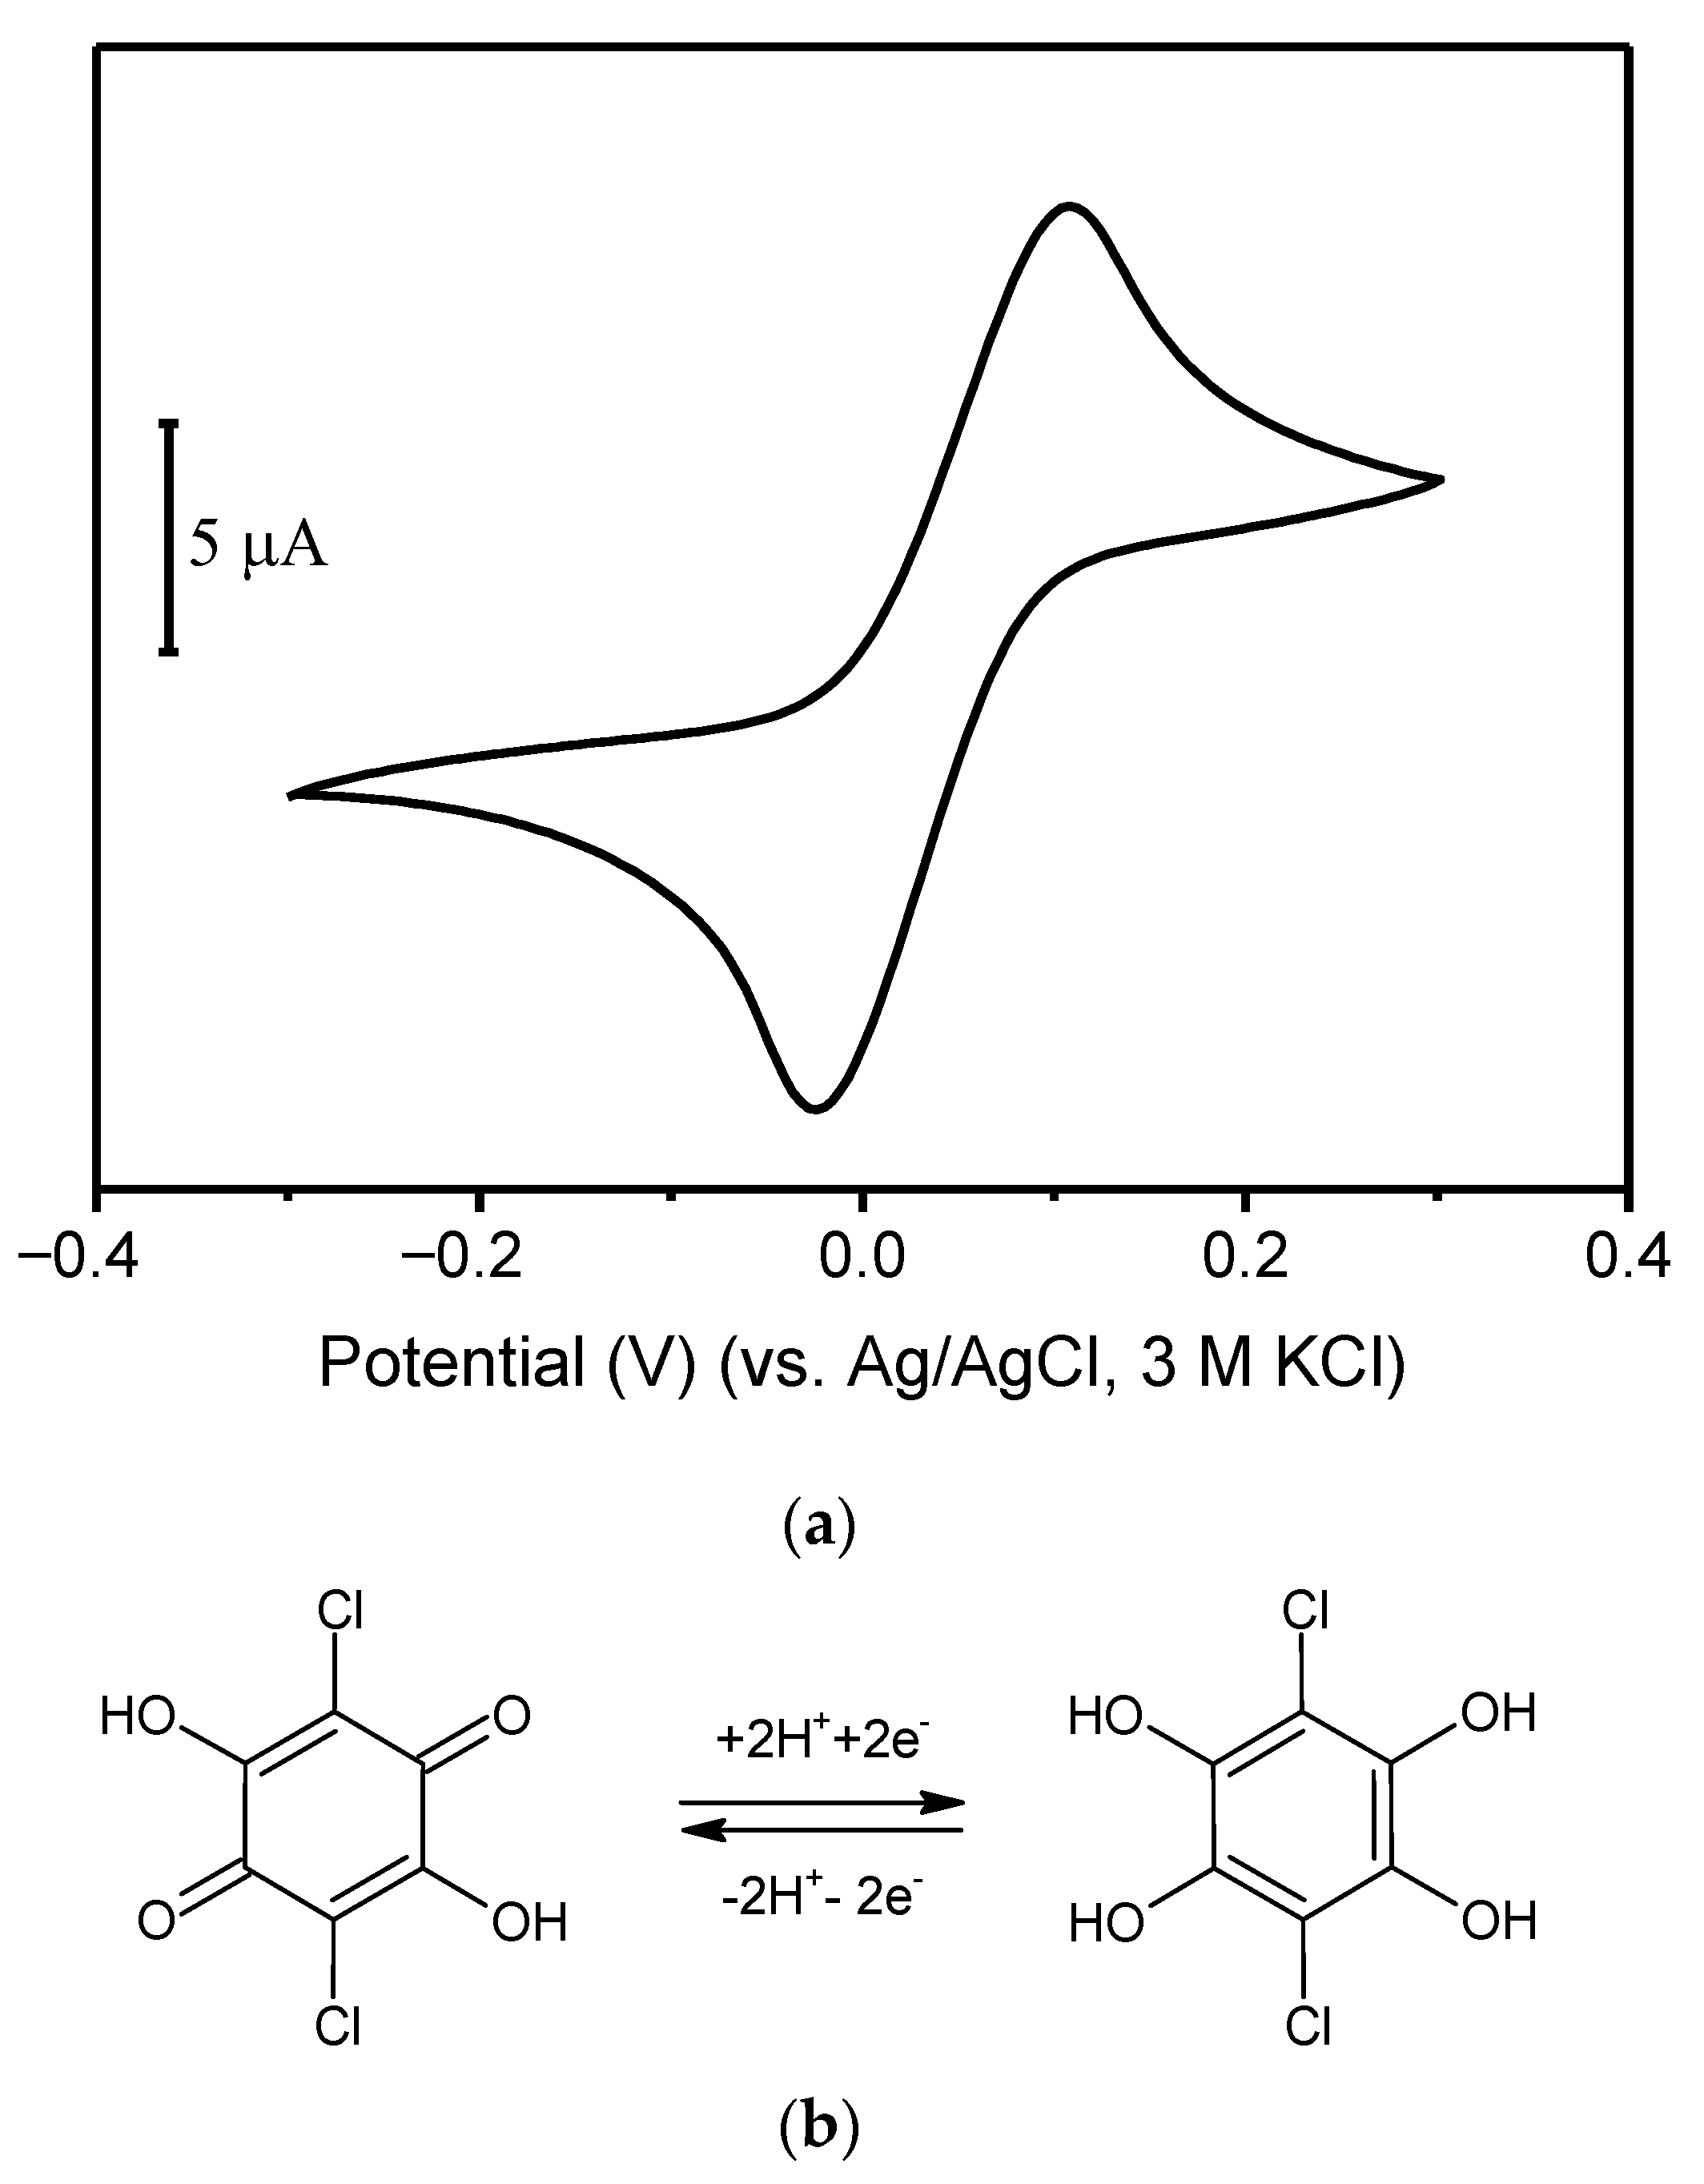
- Grabarczyk, M. Optimization of Adsorptive Stripping Voltammetry Procedure Using Chloranilic Acid as a Complexing Agent for the Determination of Ultra-Trace Germanium in Natural Water Samples. J. Electrochem. Soc. 2017, 164, H872–H876. [Google Scholar] [CrossRef]
- Grabarczyk, M.; Adamczyk, M. Bismuth film electrode and chloranilic acid as a new alternative for simple, fast and sensitive Ge(iv) quantification by adsorptive stripping voltammetry. RSC Adv. 2018, 8, 15215–15221. [Google Scholar] [CrossRef] [Green Version]
- Canham, R.G.; Aikens, D.A.; Winograd, N.; Mazepa, G. Mechanism of polarographic reduction of germanium(IV) in acidic catechol medium. J. Phys. Chem. 1970, 74, 1082–1087. [Google Scholar] [CrossRef]
- Jinhui, S.; Kui, J. Adsorptive complex catalytic polarographic determination of germanium in soils and vegetables. Anal. Chim. Acta 1995, 309, 103–109. [Google Scholar] [CrossRef]
- Zhong, S.; Su, J.; Chen, L.; Tong, J.; Jia, W.; Li, X.; Zou, H. Determination of Total Germanium in Chinese Herbal Remedies by Square-Wave Catalytic Adsorptive Cathodic Stripping Voltammetry at an Improved Bismuth Film Electrode. Int. J. Electrochem. 2013, 2013, 735019. [Google Scholar] [CrossRef]
- Li, Y.-H.; Chen, X.-H.; Huang, M.-H.; Zhou, F.-Q. Catalytic Adsorptive Stripping Voltammetry of Germanium(IV) in the Presence of Gallic Acid and Vanadium(IV)-EDTA. Electroanalysis 2007, 19, 704–708. [Google Scholar] [CrossRef]
- Zhang, Y.; Wu, Y. Enhancement Mechanism of the Oscillopolarographic Current of Germanium(IV)-Trihydroxybenzoic Acid System and Application. Anal. Sci. 1997, 13, 279–284. [Google Scholar] [CrossRef] [Green Version]
- Muniz Alvarez, J.L.; Garcia Calzon, J.A.; Lopez Fonseca, J.M. Coupling of Ligand-Catalyzed Electroreduction of Metal Ions with Redox Electrocatalysis. Application of the o-Catechol-Ge(IV)-V(IV) Double Catalytic System for the Sensitive Determi-nation of o-Catechol. Electroanalysis 2001, 13, 181–185. [Google Scholar] [CrossRef]
- Zarębski, J.; Bobrowski, A.; Gonciarczyk, J.; Królicka, A. Extremely sensitive germanium stripping voltammetric determination with the use of a new Ge(IV)-catechol-V(IV)-HEDTA catalytic adsorptive system. Electrochim. Acta 2019, 324, 134859. [Google Scholar] [CrossRef]
- Królicka, A.; Zarębski, J.; Bobrowski, A. Catalytic Adsorptive Stripping Voltammetric Determination of Germanium Employing the Oxidizing Properties of V(IV)-HEDTA Complex and Bismuth-Modified Carbon-Based Electrodes. Membranes 2021, 11, 524. [Google Scholar] [CrossRef] [PubMed]
- Zarębski, J.; Bobrowski, A.; Gonciarczyk, J.; Królicka, A. Selection of Optimal Ligand and Vanadium(IV) Complexonate for Sensitive Catalytic Adsorptive Stripping Voltammetric Quantification of Germanium. Electroanalysis 2020, 32, 2213–2219. [Google Scholar] [CrossRef]
- Zarębski, J.; Bobrowski, A.; Królicka, A.; Gonciarczyk, J.; Manolopoulou, V.; Economou, A. A novel catalytic adsorptive stripping voltammetric method for the determination of germanium ultratraces in the presence of chloranilic acid and the V(IV)·HEDTA complex. J. Solid State Electrochem. 2020, 24, 2891–2899. [Google Scholar] [CrossRef]
- Sun, C.; Gao, Q.; Xi, J.; Xu, H. Determination of germanium(IV) by catalytic cathodic stripping voltammetry. Anal. Chim. Acta 1995, 309, 89–93. [Google Scholar] [CrossRef]
- Bobrowski, A.; Zarębski, J. Catalytic systems in adsorptive stripping voltammetry. Electroanalysis 2000, 12, 1177–1186. [Google Scholar] [CrossRef]
- Bobrowski, A.; Zarebski, J. Application of catalytic adsorptive stripping voltammetry in water analysis. Water Sci. Technol. Water Supply 2001, 1, 1–8. [Google Scholar] [CrossRef]
- Bobrowski, A.; Zarebski, J. Catalytic Adsorptive Stripping Voltammetry at Film Electrodes. Curr. Anal. Chem. 2008, 4, 191–201. [Google Scholar] [CrossRef]
- Mirčeski, V.; Bobrowski, A.; Zarebski, J.; Spasovski, F. Electrocatalysis of the first and second kind: Theoretical and experimental study in conditions of square-wave voltammetry. Electrochimica Acta 2010, 55, 8696–8703. [Google Scholar] [CrossRef]
- Bobrowski, A.; Królicka, A.; Śliwa, J.; Zarębski, J.; Januś, M.; Kyzioł, K. PVD fabrication of lead film electrodes and their catalytic adsorptive stripping voltammetric performance in the presence of oxidants. Electrochem. Commun. 2018, 94, 49–54. [Google Scholar] [CrossRef]
- Nowack, B.; VanBriesen, J.M. Chelating Agents in the Environment. In Active Learning in General Chemistry: Specific Interventions; American Chemical Society (ACS): Washington, DC, USA, 2005; pp. 1–18. [Google Scholar]


| Ligand | Catalytic Agent | Supporting Electrolyte | Electrode | P2/P1 1 | Linear Range nM | LOD nM | References |
|---|---|---|---|---|---|---|---|
 Benzene-1,2-diol catechol | BrO3− | Acetate buffer | DME | 2.2 | 1–7000 | 1 | [35] |
| VO2+ | HClO4, NaClO4 | HMDE | 11 | n.a. | n.a. | [39] | |
| BrO3− | Acetate buffer | HMDE | 24 | n.a. | n.a. | [40] | |
| V(IV)-EDTA | Acetate buffer | HMDE | 3.5 | n.a. | n.a. | [40] | |
| V(IV)-HEDTA | Acetate buffer | HMDE | 26 | 0.05–20 | 0.01 | [40] | |
| V(IV)-HEDTA | Acetate buffer | Hg(Ag)FE | n. a. | 0.01 | 0.15 | [40] | |
| V(IV)-HEDTA | Acetate buffer | BiFE/GC | n. a. | 1.5–24 | 1.0 | [41] | |
| V(IV)-HEDTA | Acetate buffer | BiFE/SPE | n. a. | 1.5–19.5 | 1.0 | [41] | |
| V(IV)-HEDTA | Acetate buffer | BiFE/SPEmeso | n. a. | 5.0–70 | 1.2 | [41] | |
 Benzene-1,2,3-triol Pyrogallol | BrO3− | Acetate buffer, trisodium citrate | BiFE/GC | 1.5 | 7–230 | 0.8 | [36] |
| V(IV)-HEDTA | Acetate buffer | HMDE | 100 | 0.25–25 | 0.02 | [42] | |
| V(IV)-EDTA | Acetate buffer | HMDE | 10 | n.a. | n.a. | [42] | |
| V(IV)-NTA | Acetate buffer | HMDE | 1.5 | n.a. | n.a. | [42] | |
 3,4,5-Trihydroxybenzoic acid, gallic acid | V(IV)-EDTA | HClO4 | HMDE | n.a. | 0.03–10 | 0.02 | [37] |
| V(IV)-EDTA | H2SO4 | DME | 10 | 0.55–275 | 0.05 | [38] | |
 2,5-Dichloro-3,6-dihydroxycyclohexa-2,5-diene-1,4-dione, chloranilic acid | V(IV)-HEDTA | Acetic acid | HMDE | 21 | 0.75–50 | 0.085 | [43] |
| V(IV)-HEDTA | Acetic acid | Hg(Ag)FE | 12 | 1–25 | 0.7 | [43] | |
 3,4-Dihydroxybenzaldehyde (DHB) | V(IV)-EDTA | KCl | HMDE | 17 | 0.1–10 | 0.05 | [44] |
Publisher’s Note: MDPI stays neutral with regard to jurisdictional claims in published maps and institutional affiliations. |
© 2022 by the authors. Licensee MDPI, Basel, Switzerland. This article is an open access article distributed under the terms and conditions of the Creative Commons Attribution (CC BY) license (https://creativecommons.org/licenses/by/4.0/).
Share and Cite
Królicka, A.; Zarębski, J.; Bobrowski, A. Application of Aminopolycarboxylic Complexes of V(IV) in Catalytic Adsorptive Stripping Voltammetry of Germanium. Chemosensors 2022, 10, 36. https://0-doi-org.brum.beds.ac.uk/10.3390/chemosensors10010036
Królicka A, Zarębski J, Bobrowski A. Application of Aminopolycarboxylic Complexes of V(IV) in Catalytic Adsorptive Stripping Voltammetry of Germanium. Chemosensors. 2022; 10(1):36. https://0-doi-org.brum.beds.ac.uk/10.3390/chemosensors10010036
Chicago/Turabian StyleKrólicka, Agnieszka, Jerzy Zarębski, and Andrzej Bobrowski. 2022. "Application of Aminopolycarboxylic Complexes of V(IV) in Catalytic Adsorptive Stripping Voltammetry of Germanium" Chemosensors 10, no. 1: 36. https://0-doi-org.brum.beds.ac.uk/10.3390/chemosensors10010036