Article

3D Printing Filaments Facilitate the Development of Evanescent Wave Plastic Optical Fiber (POF) Chemosensors

Department of Organic Chemistry, Faculty of Chemistry, Complutense University of Madrid (UCM), 28040 Madrid, Spain
*
Author to whom correspondence should be addressed.
Submission received: 31 December 2021 / Revised: 27 January 2022 / Accepted: 29 January 2022 / Published: 1 February 2022

Abstract

:
One of the major difficulties in the development of evanescent wave optical fiber sensors (EWOFS) lies in the complexity of the manufacturing of the chemosensitive element, particularly when using plastic optical fibers (POFs). While these fibers are appealing waveguides thanks to their low cost, ease of connectorization and robustness, the need for removing the cladding material complicates the EWOFS fabrication. In this paper we discuss how 3D printing filaments can serve as an alternative to commercially available POF for the development of EWOFS. In the process of replacing the traditional POF, we compared the performance of two EWOFS for monitoring airborne formaldehyde. These sensitive elements were manufactured either from 1.75 mm diameter 3D printing filaments, or from a commercially available POF. After the optimization of their respective fabrication protocols, the analytical performance of the two formaldehyde EWOFS was compared in terms of sensitivity and reproducibility. In this regard, the easy-to-manufacture 3D printing filament-based waveguides provided 5-fold lower detection limits with respect to the commercial POF-based sensors. Although no statistically significant differences were found in terms of reproducibility, the simplification of the sensor manufacturing process together with the increased analytical performance for chemical sensing spur the use of 3D printing filaments for the development of new POF-based EWOFS.

Graphical Abstract

1. Introduction

Evanescent wave optical fiber sensors (EWOFS)—based on the interaction with the sensing layer of the small leakage of light (evanescent field) that occurs at the core-cladding interface of the fiber for the light ray propagating along the core by attenuated total reflection—are an attractive solution for complicated sensing scenarios (e.g., mines, wells, aquifers, electrical machinery, explosive areas, chemical reactors, etc.) where conventional detection techniques cannot be implemented [1,2]. Although most optical fiber sensors benefit from remote sensing, spatial resolution and multiparametric determination, EWOFS provide the largest analyte interaction areas and distributed sensing. The enlargement of the sensing region contributes to higher absolute optical responses (emission or absorption of radiation by the sensitive molecule in the case of indicator-based sensors), leading to increased sensitivity compared to extrinsic optical fiber sensors or point sensors [3].
With the exception of distributed sensing in the visible range, EWOFS share the advantages of the intensity modulated optical sensors: easy assembly, low-cost instrumentation and scarce measurement complexity. The possibility of incorporating multimode optical fibers of various diameters and materials, as well as inexpensive illumination sources (LEDs), has enabled the development of evanescent field sensors for the detection of a wide range of chemical species in diverse environments and matrices spanning the medical, biological, industrial and environmental fields [4,5,6,7,8,9,10,11]. The introduction of FBG diffraction gratings, the cladding replacement, the tapering of the optical fiber, the removal of fiber segments, or the use of one-side polished fibers, and D-fiber and S-fiber configurations have improved EWOFS analytical performance [4,5].
Typically, the incorporation of the transduction element onto/into the surface of an optical fiber requires modification of the original structure of the fiber. To this purpose, many strategies can be followed, the choice of which depends on different factors such as the measurement principle, the distribution of the optical fiber in the sensor, the external conditions, the chemical properties of the analyte, and the optical fiber itself. In this regard, plastic optical fibers (POF) have emerged as a cheaper alternative to manufacture optical sensors compared to silica fibers. Additionally, their mechanical strength facilitates the tasks of preparation, polishing and coupling to the light source and the detector during the sensor assembly [12,13].
The major drawback for manufacturing EWOFS is poor mechanical and chemical stability when the cladding of commercial POFs is removed. The purpose of this operation, carried out by mechanical, chemical or laser ablation techniques, is to enhance the interaction between the light traveling through the fiber core with the analyte-sensitive medium layered on top of it. Unfortunately, these uncladding techniques have proven effective only when small segments of the cladding are to be removed, as it leads to important fiber brittleness [14,15,16]. Due to this inconvenience and the consequent lack of manufacturers providing cladding-free plastic fibers, our investigation focused on the replacement of the traditional POF with plastic filaments lacking this cladding element. The use of these filaments as waveguides would significatively reduce the production time and manufacturing costs of future EWOFS, allowing the incorporation of sensitive cladding materials tailored to the sought application.
In this work we discuss how commercial, inexpensive 3D printing filaments can be used as an alternative to available POFs to develop EWOFS. Our motivation for using custom-made fibers arose from the need to develop a sensitive and selective optical fiber sensor to quantify airborne formaldehyde (FA) in workplace environments. To this end, we transferred a well-known laboratory assay for formaldehyde determination. based on the so-called Leuco Fuchsin (LF) dye, into the home-made polymer cladding (made of Nafion) of a plastic optical fiber [17]. In this previous work of ours, the electrostatically immobilized LF reacts with FA to yield a strongly colored violet product (VP) into the cladding of the optical fiber. The formation of the VP can be directly correlated to the power loss of the light propagating through the fiber at the wavelength absorption regions of the VP, and thus correlated to the airborne formaldehyde concentration. Upon FA removal with an air stream, the LF species is regenerated to allow a new measurement. In our first attempts to manufacture the sensitive optical fibers, we started from partially uncladded commercial poly(methyl methacrylate) (PMMA) optical fibers coated with a LF-doped Nafion cladding to manufacture the sensitive element. Unfortunately, the resulting FA-sensitive optical fibers did not offer the required sensitivities to allow occupational FA monitoring (in Europe the short- and long-term occupational exposure limits are 0.74 mg m−3 (0.6 ppmv) and 0.37 mg m−3 (0.3 ppmv), respectively) [18]. The lack of sensitivity was attributed to the poor interaction between the propagating EW and the FA-sensitive cladding, probably due to incomplete removal of the original cladding. To address the limitations related to the use of commercially available optical fibers, we thought of 3D printing filaments as potential plastic waveguides, an application never described before.
Many analytical methods and sensing devices have been described to monitor formaldehyde due to the toxicity of this widespread chemical [19]. We have recently reported a deployable sensor to monitor in situ the levels of airborne FA in industrial environments. The use of commercially available 3D printing filaments in that prototype, as the core of our FA-sensitive waveguides, allowed us to achieve an analytical performance on par with the existing methods [20]. Herein we describe the steps towards the selection and implementation of 3D printing filaments as new waveguide cores for manufacturing chemically sensitive EW-FOCS. Furthermore, we also provide a comparison of their performance with that of “classical” modified-POF FA sensors.

2. Materials and Methods

2.1. Optimization of the Cladding Removal Protocol of a Commercially Available POF

The FA-sensitive OFS were manufactured from an unjacketed multimode step index plastic optical fiber (PFU-FB1000, Toray Raytela, Tokio, Japan). This POF has a 1000 μm external diameter (980 μm poly(methyl methacrylate) core and 10 μm fluorinated polymer cladding) with refractive indexes of 1.49 and 1.42, respectively [17]. Before the sensitive coating can be applied, the original fiber cladding is removed by chemical dissolution. To achieve this [14], 200 mL of a mixture of acetone (VWR International Eurolab, HPLC grade, Llinars del Vallès, Spain), methyl isobutyl ketone (Alfa Aesar, 99.0%, Kabndel, Germany) and type I purified water (Direct-Q3 Water Purifier, Merck Spain, Madrid, Spain) (3:1:1 by volume) is placed into an evaporation dish containing 45 cm pieces of the optical fiber. After magnetically stirring for 20, 30, 45 or 60 min, the cladding leftovers are manually removed with latex gloves.

2.2. Selection of the Experimental Conditions for the Chemical Removal of the Cladding of Commercial Optical Fibers

The 45 cm uncladded PMMA fibers fabricated in 2.1 are fitted with SMA-905 connectors at both ends (Ratioplast Optoelectronics, Lübbecke, Germany), and the fiber ends polished with SiC sandpaper of decreasing grain size. Then, the fiber is placed into a 20 cm silicone tube (12 mm inner diameter) arranged in a “U” shape containing 20 mL of a 2.7 mg L−1 methylene blue (>80%, Merck, Darmstadt, Germany) solution. The fiber ends are connected to a USB spectrometer (FLAME, Ocean Insight, Orlando, FL, USA) and a light source (SL1-LED, StellarNet, Tampa, FL, USA) equipped with a white LED (STS-DA1-1479, Nichia, Anan, Japan) (Figure 1). Finally, prior to the recording of the transmission spectrum, the whole setup is protected from ambient light.

2.3. Nafion Coating of the Uncladded Plastic Waveguides

The Nafion coating is coated onto the uncladded POF and onto three different 1.75 mm (o.d.) commercial transparent 3D printing filaments: PMMA (Rigid.ink, Wetherby, UK), polycarbonate (PC, Prima Creator, Malmö, Sweden) and glycol-modified poly(ethylene terephthalate) (PET-G, Sunlu, Zhuhai, China). Regardless of the filament material, the fiber coating is carried out as follows: In a vertical support equipped with two clamps, the end of a fiber (approximately 45 cm long) is attached to the upper clamp, while its second end is placed between the arms of a second clamp located circa 40 cm down the first one to avoid flexing. The plastic filament is inserted into a perforated 14.9D rubber flapped septum (Saint-Gobain) placed below the upper clamp. The septum is then filled with 0.5 mL of a 5% w/w in water and 1-propanol Nafion dispersion (Alfa Aesar, 42117 Nafion D-521) to coat the commercial uncladded POF, or with 0.5 mL of a 5:1 (v/v) mixture of the Nafion dispersion and methanol (Fisher Scientific Spain, HPLC grade, Madrid, Spain) to coat the 3D printing filaments. Immediately after the introduction of the mixture, the septum is slid on the filament until the lower end is reached (approximate rate of 0.1 m s−1). After this process, the coated filament is left to dry on the vertical support at room temperature for 24 h.

2.4. Indicator Immobilization in the Nafion Cladding of the Manufactured Optical Fibers

Immobilization of the cationic LF in the Nafion coating of the fabricated POFs is carried out by dipping the optical fiber in a solution containing 50 mL of the dyeing solution (40 mL of 0.6 mmol L−1 LF in water plus 10 mL of concentrated phosphoric acid) for 2 h. After this period, the optical fibers are left to dry at room temperature for 1 day. Once dried, the OFS shows a strong yellow color. Finally, 37.5 cm of the manufactured FA-sensitive optical fiber is cut out (discarding the two final sections), its two ends connectorized, polished, and fitted into an opaque, tubular fiber chamber designed in our research group [19].

2.5. Spectroscopic Characterization and Calibration of Sensitive Optical Fibers

The analytical response of each EWOFS is evaluated by exposing it to different concentrations of formaldehyde in air ranging from 0.6 to 7.0 ppmv in a dedicated test rig previously described with a white LED excitation and the above-mentioned FLAME spectrometer [19]. Measurements are carried out at atmospheric pressure, (25 ± 1) °C, constant flow rate and relative humidity (75 mL min−1, 50% RH). The analyte exposure time is 15 min for each tested concentration. Every analyte exposure period is followed by 1 h regeneration with FA-free humid air at the same flow rate. During the different exposure cycles, the optical response is continuously monitored as the ratio of the detected radiant power at 575 and 455 nm (P575/455).

3. Results and Discussion

3.1. Chemical Removal of the Commercial POF Cladding

The typical commercial POF selected for uncladding is made of a thick, high-purity PMMA core (980 µm diameter) surrounded by a thin (10 µm) fluorinated polymer coating. Nevertheless, the design of this optical fiber prevents radiation leakage out of the optical fiber boundaries, as the penetration depth of the evanescent field generated at the core/cladding interface is shorter than the cladding thickness. The penetration distance of the evanescent field is on the order of the propagating light wavelength and its intensity decays exponentially with distance [21]. Therefore, it is essential to place the sensitive surface close to the core of the optical fiber to ensure an efficient interaction with the evanescent field. To achieve this, it is necessary to remove the original cladding from the POF before coating it with the chemically-sensitive layer. Given the composition of the commercial POF, the removal of the fluorinated cladding was carried out by dissolution with a suitable solvent mixture. In order to determine the appropriate contact time required for significant removal of the cladding without damaging the plastic core, the commercial fiber was subject to various immersion times between 20 and 60 min. Unfortunately, the longest contact time led to POF core breakage, so it was removed from the optimization study. In any case, it is noteworthy to emphasize the experimental difficulties faced when mechanically removing long portions of the cladding.
In any EWOFS, it is essential to maximize the interaction between the evanescent wave of the light travelling along the core and the nearest layer to achieve maximum sensitivity. For this reason, the selection of the optimum dissolution time to remove the cladding was based on the effect of the external medium on the transmission spectrum of the progressively uncladded fibers put in contact with a concentrated methylene blue solution. To assess this effect, transmission spectra were recorded for the progressively uncladded fibers dipped into an aqueous solution of methylene blue after 0, 20, 30 and 45 min contact with the dissolution mixture. Methylene blue was selected for the experiment as it strongly absorbs in the emission range of the white LED (550–725 nm). Each recorded spectrum was compared to the respective reference spectrum recorded in the absence of the dye. The normalized spectra are shown in Figure 2.
As shown in Figure 2, the presence of the dye in the fiber environment results in the loss of radiant power in the indicated range due to the evanescent field absorption phenomenon. This is particularly noticeable in the Figure 2D,E spectra. Conversely, no changes are observed for the untreated commercially available optical fiber (Figure 2B) and for the fiber exposed to the shortest dissolution period (20 min). In both cases, the transmission spectrum is not affected by the external solution, as the cladding or the remaining cladding is too thick to allow propagation of the evanescent wave outside the fiber cladding boundary. Figure 2 also evidences the relationship between the dissolution time and the transmitted radiant power losses in the 500–700 nm range. Following the obtained results, a 45 min contact time (Figure 2E) was selected for the subsequent fabrication of the sensitive fibers.

3.2. Analytical Characterization of the FA-OFS Manufactured from Commercial POF

The optimized conditions were used to fabricate 37.5 cm FA-sensitive fiberoptic patches with a U shape. This geometry was selected to increase the contribution of the evanescent field radiation to the overall optical response (due to the sum of core-guided and cladding-guided modes). The U geometry reduces part of the core-guided propagation modes (meridional) and increases the number of cladding-guided modes. Thus, there is a higher ratio of guided modes through the sensitive cladding compared to a straight optical fiber [22,23,24,25]. The analytical response of the U-shaped EWOFS was evaluated from their exposure to different formaldehyde concentrations (1.5, 3.5, 5.4 and 7.0 ppmv) at 50% RH and constant flow rate and temperature. The analyte exposure time was set to 15 min to meet the legal requirements for in situ occupational measurements, and, after each integration, a 1 h sensor regeneration time with clean air at the same HR was used to remove the FA from the sensitive cladding and return the VP to the yellow reactant.
Figure 3 shows a typical dose-response curve obtained for a 37.5 cm U-bend EWOFS subjected to 3 successive cycles of exposure to FA in air (1.5, 3.5, 5.5, 7.0, 5.5, 3.5, 1.5 ppmv). This dose-response plot shows how the spectral transmission (P575/455) decreases upon exposure to the analyte (due to the conversion of LF into the VP), and then recovers upon the exit of FA from the Nafion cladding. In this way, the analytical signal was calculated as the difference between the transmission ratio P575/455 measured immediately before exposure to the analyte and the value obtained after a 15 min exposure (ΔP575/455).
The calibration curves were obtained from the dose-response plots to evaluate the analytical performance of the sensitive optical fibers in terms of sensitivity and reproducibility. Figure 4 and Table 1 show the corresponding calibration curves and equations obtained for three sensitive optical fibers manufactured and tested under identical conditions. Because field blanks are not available, the limits of detection and quantification shown in Table 1 were determined as 3 times the peak-to-peak noise of 10 consecutive samples (LoD) and 10 times the peak-to-peak noise of 10 consecutive samples (LoQ) [26]. The sensitivity of the different terminals was determined as the value of the linear term coefficient of the calibration curve (ΔP575/455/[HCHO]); this value was later compared to the alternative sensing optical fibers manufactured from 3D printing filaments. The fabrication reproducibility was evaluated from the relative standard deviation (RSD) of the linear term coefficient value obtained for three sensing fibers. The calculated RSD for the fibers 37.5UA-C was 12%; this uncertainty is understandable considering that the Nafion coating of the optical fibers is carried out manually. Unfortunately, the calculated LoQ for the sensitive optical fibers is far from the requirements for formaldehyde monitoring in workplace environments (see below). The FA-sensitive elements manufactured from commercial optical fibers would solely allow detection of formaldehyde but not its quantification, since the occupational exposure limits for short- and long-term exposure stipulated by the EU are 0.6 and 0.3 ppmv, respectively [18]. The poor performance of the sensitive optical fibers in terms of sensitivity, probably due to incomplete removal of the original fiber cladding, led us to seek alternative waveguides to increase the evanescent wave absorption by the analyte-sensitive cladding.

3.3. 3D Printing Filament Selection to Manufacture the Novel FA-Sensitive Optical Fibers

The process of manufacturing sensitive optical fibers described in the previous section requires thorough removal of the original cladding of the 1-mm dia. commercial POF by chemical dissolution. The developed protocol allowed cladding elimination until significant interaction between the evanescent field and the external medium is achieved. However, it is neither possible to ascertain complete removal of the cladding, nor to extend the dissolution time beyond 45 min due to the bare core fracturing. This fact led us to consider the use of uncladded plastic filaments. To realize this approach, sensitive optical fibers were fabricated from commercial 3D printing plastic filaments. In this way, there is no need to perform a cladding dissolution step, and an intimate contact between the Nafion coating and the fiber core is ensured from the beginning. To select the best filament material to perform as the core of the new EWOFS, a number of sensing elements were fabricated using different transparent plastic filaments (PMMA, PC and PET-G).
The selection of the polymeric material aimed to achieve the maximum evanescent wave interaction with the LF-doped sensitive Nafion cladding. To achieve an optimal interaction between the indicator located in the coating and the light traveling through the fiber core, the refractive index of the core (n1) must be higher than that of the cladding (n2). If this difference is fulfilled, the condition of total internal reflection is met and the smaller the difference in refractive indexes, the deeper the penetration distance (dp) of the evanescent wave into the cladding (Equation (1)) for a given angle of incidence (θ) and wavelength (λ) [27].
d p = λ 2 π   n 1 2 sin 2 ( θ ) n 2 2
In our particular application, the Nafion ionomer selected as cladding material and indicator support has a refractive index between 1.34 and 1.35, depending on the relative humidity of the medium [28]. Consequently, the materials proposed as waveguide (core) must have refractive indexes higher than 1.35. PMMA, PC and PET-G have refractive indexes of 1.492, 1.586 and 1.563, respectively [29]. The high refractive index of the latter two materials may lead to a poor interaction between the light traveling through the core and the colorimetric indicator dwelling in the sensitive cladding. Figure 5 shows the spectra corresponding to three sensitive optical fibers made of the different 3D printing filaments investigated, namely PMMA (5B), PC (5C) and PET-G (5D). The spectra, recorded under white LED illumination, are corrected for the radiant power measured at 840 nm corresponding to the emission maximum of a second LED centered at this wavelength, where no absorption of either LF or the violet product occurs.
It is noticeable in Figure 5 how the transmission of the sensitive optical fibers (Nafion/LF-coated filaments) manufactured with PET-G and PC shows a smaller variation in the spectral region of the LF absorption (400–550 nm) than that measured for the coated PMMA filament compared to the spectra of the same fiber before the dye doping (i.e., the Nafion-coated filament). The sensing fibers manufactured from PMMA filaments display a dramatic attenuation of their transmission in the LF absorption region, more clearly evidenced in the spectral ratio plot (grey dashed line). These data demonstrate the stronger interaction of the evanescent wave with the indicator dye in the Nafion cladding for the PMMA-based OFS. Consequently, PC and PET-G are less suitable for FA-sensing applications, and so PMMA was selected as the core material for the manufacturing of EWOFS from 3D printing filaments.
After the PMMA filaments were selected as the core of the novel OFS, its optical performance was compared to the optical performance of the uncladded commercial POF when exposed to the methylene blue solution (see above). Figure 6 shows the transmission spectra of the PMMA filament vs the uncladded POF. In both cases, the fiber output recorded in the presence of methylene blue showed a decrease of the transmitted radiant power in the 525–700 nm range due to the absorption of the evanescent wave by the dye.
In the case of the uncladded POF, the relative maximum radiant power loss recorded at 600 nm was 0.09, while for the PMMA filaments it was 0.268. The lower sensitivity of the uncladded POF to methylene blue is attributed to incomplete removal of the original cladding during the dissolution process; the remaining cladding prevents a direct contact of the generated evanescent wave with the external medium. Given the larger interaction between the evanescent wave and the external medium in the 3D printing PMMA filaments, the sensitivity of the manufactured EWOFS for FA detection is expected to be higher than that of the EWOFS prepared from uncladded commercial POF.

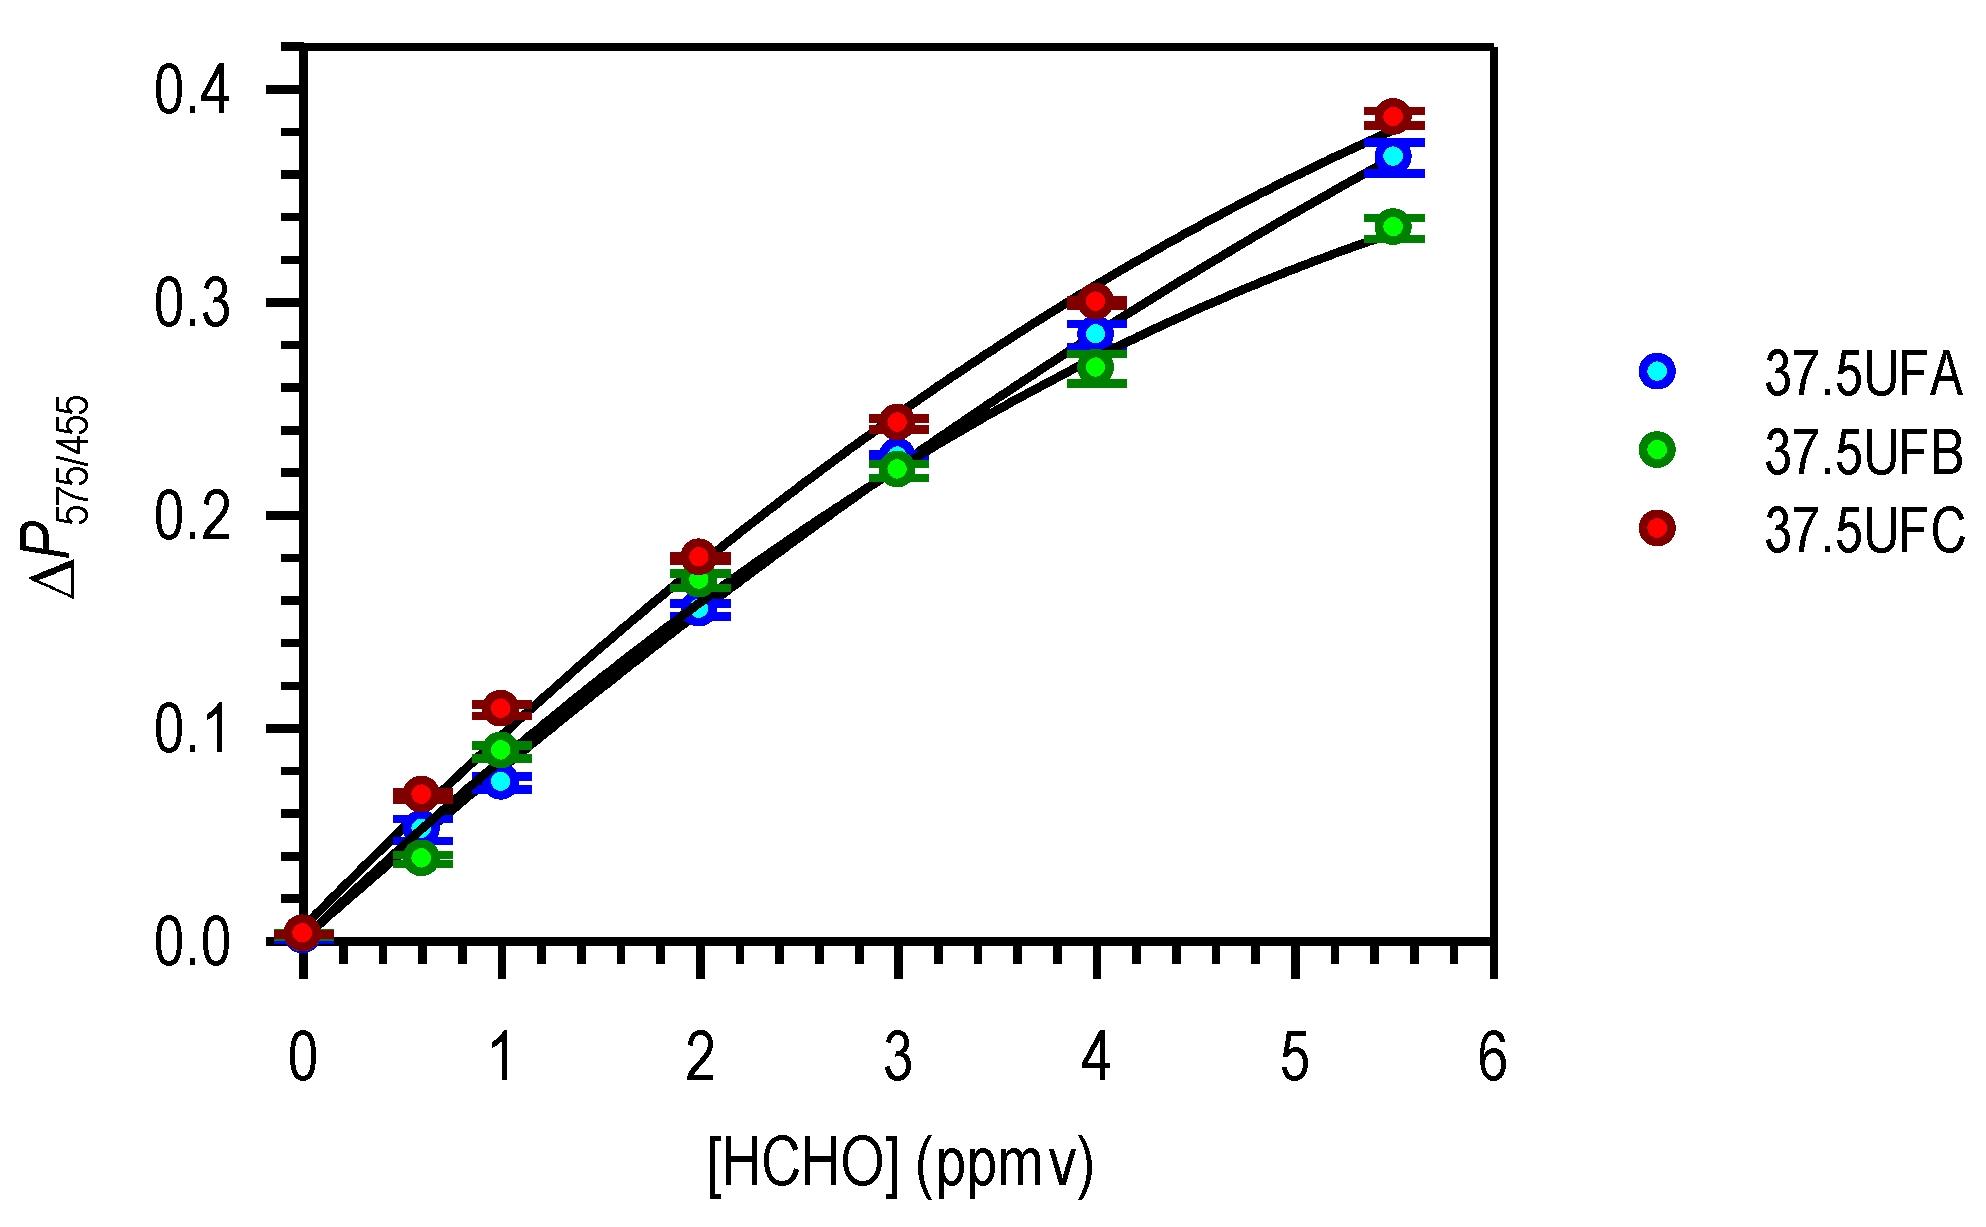
3.4. Analytical Characterization of the FA-Sensitive EWOFS Fabricated from PMMA Filaments

The analytical response of 37.5 cm sensitive elements manufactured from standard 1.75 mm PMMA 3D printing filaments was evaluated by exposing them to different levels of formaldehyde. In this case, the features of the new sensing optical fibers allowed their testing at lower formaldehyde concentrations. The assay consisted of exposing the novel fibers to increasing levels of formaldehyde at 50% RH (0.6, 1.0, 2.0, 2.0, 3.0, 4.0 and 5.5 ppmv). The exposure time was set at 15 min for each concentration tested and, after each determination, 1 h regeneration with a humid air stream (50 %RH) was employed. The analytical response (ΔP575/455) was determined as described in Section 3.2. The results of the analytical characterization are displayed in Figure 7 and Table 2.
The accuracy of sensitive terminals made from PMMA filaments was evaluated in terms of repeatability of formaldehyde measurements carried out on the same sensitive optical fiber for different concentration values. The relative standard deviation (RSD) obtained for three consecutive FA samples show low dispersion and, therefore, good repeatability. The precision in terms of reproducibility for FA measurements carried out with different sensitive fibers was calculated from the comparison of the results obtained in the calibration of three sensitive optical fibers (Table 2) and their corresponding calibration curves (Figure 7 and Table 2). The linear term coefficients of the calibration curves were statistically compared in a paired t-test for two-sample means. From the results obtained, it is statistically proven that there are no significant differences between the linear term coefficients of the different sensitive optical fibers manufactured, for a confidence level of 95% (tscore 37.5UA/37.5UB = 0.86 < tdistribution = 2.45; tscore 37.5UA/37.5UC = 0.85 < tdistribution = 2.45). The calculated RSD for the linear term coefficient is 7%, a lower value than that obtained for the FA sensors made from uncladded PMMA optical fibers (11%). The improvement of the reproducibility in the fabrication of OFS from PMMA filaments may be attributed to their straightforward fabrication process.
The sensitivity increase for the 3D printing filament-based EWOFS (Table 2) was found to be 2.2-fold larger than that obtained with the commercial POF-based EWOFS (Table 1). This improvement is reflected in the higher linear term coefficients obtained for the novel EWOFS (LCfilaments = 0.089 ± 0.006) compared to the average linear term coefficient obtained for the EWOFS obtained from the commercial optical fibers (LCu-POF = 0.040 ± 0.005). The linear term coefficient was calculated for the two types of sensitive optical fibers as the average of the 3 individual linear term coefficients. The difference was found to be statistically significant with respect to the linear term coefficients obtained for the calibration curves of the two types of sensitive fibers for a two-sample t-test assuming equal variances (tdistribution = 2.77 < tscore = 10.73) for a confidence level of 95%. Despite the modest increase in sensitivity provided by the filament-based fibers, the straightforward and fast preparation of the latter adds significant value to the novel sensors. Furthermore, the 5-fold improvement of the LoD and LoQ achieved with the 3D printing filament-based EWOFS (Table 2) now allows FA quantification below the occupational exposure limits. The improvements on the analytical performance of the OFS manufactured from PMMA filaments is attributed to the increased EW interaction with the sensitive cladding of the OFS.
The analytical figures-of-merit of our best 3D printing filament-based FA sensors (50−80 ppbv LoD) can be successfully compared with the reported colorimetric sensors [20]. A raw analysis of the LoDs is, however, difficult to perform, since the various optical sensors use different sampling times, are non-regenerable dosimeters, belong to the laboratory-assays category (and not deployable sensors), or have calculated their LoD using a different method to ours. For instance, Suzuki et al. and Guo et al. describe disposable colorimetric dosimeters showing lower detection limits of 50 and 10 ppbv for sampling times of 15 and 20 min, respectively [30,31], whereas Park et al. have reported colorimetric nanoparticles displaying a LoD of 500 ppbv for 1 min sampling time [32].

4. Conclusions

In this work we have demonstrated that inexpensive 3D printing filaments can be successfully used to develop chemically sensitive EWOFS that can rival, in analytical performance and ease of manufacturing, those made out of commercial POFs using classical procedures to provide a sensitive cladding. Since the tedious process of cladding removal is not required, an expedited fabrication of the tailored chemical (or physical!) EWOFS results. Needless to say, it is essential to make a judicious choice of the core and cladding materials based on their refractive index to maximize the EW interaction between the two elements when developing new EWOFS based on 3D printing filaments. The example application to airborne formaldehyde sensing should serve as stimulus to encourage the use of the ever-growing number of transparent 3D printing filaments to develop novel EWOFS. Further work in this direction is ongoing in our group.

Author Contributions

Conceptualization, M.d.M.D., G.O.; methodology, M.d.M.D., M.B., G.O.; Software, M.d.M.D., M.B.; validation, M.d.M.D., L.A.S., M.B.; formal analysis, M.d.M.D., M.B.; investigation, M.d.M.D., L.A.S., M.B., G.O.; resources, G.O.; data curation, M.d.M.D., L.A.S., M.B.; writing—original draft preparation, M.d.M.D.; writing—review and editing, G.O.; visualization, M.d.M.D., L.A.S.; supervision, M.B., G.O.; project administration, G.O.; funding acquisition, G.O. All authors have read and agreed to the published version of the manuscript.

Funding

This research has been funded by the EU-LIFE Program (“Sensor System for Safe Environments in Industry—SENSSEI”; LIFE16-ENV_ES_00232; http://www.lifesenssei.com) (accessed on 31 January 2021) through UCM R + D contract No. 4156577 with Quirón Prevención S.L.U.

Informed Consent Statement

Not applicable.

Data Availability Statement

The data presented in this study are available on request from the corresponding author. The data are not publicly available due to industrial contract requirements.

Acknowledgments

Support from the University Complutense of Madrid (Spain) Mechanical and Electronic Workshops (CAIs) is gratefully acknowledged.

Conflicts of Interest

The authors declare no conflict of interest.

References

  1. Lu, X.; Thomas, P.J.; Hellevang, J.O. A Review of Methods for Fibre-Optic Distributed Chemical Sensing. Sensors 2019, 19, 2876. [Google Scholar] [CrossRef] [PubMed] [Green Version]
  2. Culshaw, B.; Kersey, A. Fiber-Optic Sensing: A Historical Perspective. J. Lightw. Technol. 2008, 26, 1064–1078. [Google Scholar] [CrossRef]
  3. Jiao, L.; Zhong, N.; Zhao, X.; Ma, S.; Fu, X.; Dong, D. Recent advances in fiber-optic evanescent wave sensors for monitoring organic and inorganic pollutants in water. TrAC Trends Anal. Chem. 2020, 127, 115892. [Google Scholar] [CrossRef]
  4. Potyrailo, R.A.; Hobbs, S.E.; Hieftje, G.M. Near-Ultraviolet Evanescent-Wave Absorption Sensor Based on a Multimode Optical Fiber. Anal. Chem. 1998, 70, 1639–1645. [Google Scholar] [CrossRef]
  5. Girei, S.H.; Alkhabet, M.M.; Kamil, Y.M.; Lim, H.N.; Mahdi, M.A.; Yaacob, M.H. Wavelength Dependent Graphene Oxide-Based Optical Microfiber Sensor for Ammonia Gas. Sensors 2021, 21, 556. [Google Scholar] [CrossRef]
  6. Valadez, A.; Lana, C.; Tu, S.-I.; Morgan, M.; Bhunia, A. Evanescent Wave Fiber Optic Biosensor for Salmonella Detection in Food. Sensors 2009, 9, 5810–5824. [Google Scholar] [CrossRef] [Green Version]
  7. Sai, V.V.R.; Kundu, T.; Deshmukh, C.; Titus, S.; Kumar, P.; Mukherji, S. Label-free fiber optic biosensor based on evanescent wave absorbance at 280nm. Sens. Actuators B Chem. 2010, 143, 724–730. [Google Scholar] [CrossRef]
  8. Azargoshasb, T.; Navid, H.A.; Parvizi, R.; Heidari, H. Evanescent Wave Optical Trapping and Sensing on Polymer Optical Fibers for Ultra-Trace Detection of Glucose. ACS Omega 2020, 5, 22046–22056. [Google Scholar] [CrossRef]
  9. Nag, P.; Sadani, K.; Mohapatra, S.; Mukherji, S.; Mukherji, S. Evanescent Wave Optical Fiber Sensors Using Enzymatic Hydrolysis on Nanostructured Polyaniline for Detection of β-Lactam Antibiotics in Food and Environment. Anal. Chem. 2021, 93, 2299–2308. [Google Scholar] [CrossRef]
  10. Türkmen, D.; Krug, A.; Mizaikoff, B. Monitoring Corrosion Processes via Visible Fiber-Optic Evanescent Wave Sensor. Chemosensors 2020, 8, 76. [Google Scholar] [CrossRef]
  11. Cennamo, N.; Pesavento, M.; Zeni, L. A review on simple and highly sensitive plastic optical fiber probes for bio-chemical sensing. Sens. Actuators B Chem. 2021, 331, 129393. [Google Scholar] [CrossRef]
  12. Bartlett, R.J.; Philip-Chandy, R.; Eldridge, P.; Merchant, D.F.; Morgan, R.; Scully, P.J. Plastic optical fibre sensors and devices. Trans. Inst. Meas. Control 2000, 22, 431–457. [Google Scholar] [CrossRef]
  13. Bunge, C.A.; Bremer, K.; Lustermann, B.; Woyessa, G. Polymer Optical Fibres; Elsevier: Amsterdam, The Netherlands, 2017; ISBN 9780081000397. [Google Scholar]
  14. Merchant, D.F.; Scully, P.J.; Schmitt, N.F. Chemical tapering of polymer optical fibre. Sens. Actuators A Phys. 1999, 76, 365–371. [Google Scholar] [CrossRef]
  15. Lee, J.R.; Dhital, D.; Yoon, D.J. Investigation of cladding and coating stripping methods for specialty optical fibers. Opt. Lasers Eng. 2011, 49, 324–330. [Google Scholar] [CrossRef]
  16. An, J.; Zhao, Y.; Jin, Y.; Shen, C. Relative humidity sensor based on SMS fiber structure with polyvinylalcohol coating. Optik (Stuttg.) 2013, 124, 6178–6181. [Google Scholar] [CrossRef]
  17. Darder, M.M.; Serrano, L.A.; Moreno-bondi, M.C.; Alba, M.A.; Orellana, G. Fiberoptic Formaldehyde Field Sensors for Industrial Environments: Capitalizing on Evanescent-Wave. Spectroscopy 2020, s6, 25–29. [Google Scholar]
  18. Directive EU 2019/983. Available online: https://eur-lex.europa.eu/legal-content/EN/TXT/?uri=CELEX%3A32019L0983 (accessed on 17 August 2021).
  19. Darder, M.d.M.; Bedoya, M.; Serrano, L.A.; Alba, M.Á.; Orellana, G. Fiberoptic colorimetric sensor for in situ measurements of airborne formaldehyde in workplace environments. Sens. Actuators B Chem. 2022, 353, 131099. [Google Scholar] [CrossRef]
  20. Liao, C.; Shi, J.; Zhang, M.; Dalapati, R.; Tian, Q.; Chen, S.; Wang, C.; Zang, L. Optical chemosensors for the gas phase detection of aldehydes: Mechanism, material design, and application. Mater. Adv. 2021, 2, 6213–6245. [Google Scholar] [CrossRef]
  21. Sharma, A.K.; Gupta, J.; Sharma, I. Fiber optic evanescent wave absorption-based sensors: A detailed review of advancements in the last decade (2007–18). Optik (Stuttg.) 2019, 183, 1008–1025. [Google Scholar] [CrossRef]
  22. Gupta, B.D.; Dodeja, H.; Tomar, A.K. Fibre-optic evanescent field absorption sensor based on a U-shaped probe. Opt. Quantum Electron. 1996, 28, 1629–1639. [Google Scholar] [CrossRef]
  23. Azkune, M.; Ruiz-Rubio, L.; Aldabaldetreku, G.; Arrospide, E.; Pérez-Álvarez, L.; Bikandi, I.; Zubia, J.; Vilas-Vilela, J. U-Shaped and Surface Functionalized Polymer Optical Fiber Probe for Glucose Detection. Sensors 2017, 18, 34. [Google Scholar] [CrossRef] [PubMed] [Green Version]
  24. Iadicicco, A.; Paladino, D.; Campopiano, S.; Bock, W.J.; Cutolo, A.; Cusano, A. Evanescent wave sensor based on permanently bent single mode optical fiber. Sens. Actuators B Chem. 2011, 155, 903–908. [Google Scholar] [CrossRef]
  25. Raichlin, Y.; Katzir, A. Fiber-optic evanescent wave spectroscopy in the middle infrared. Appl. Spectrosc. 2008, 62. [Google Scholar] [CrossRef] [PubMed]
  26. McCormick, R.M.; Karger, B.L. Guidelines For Data Acquisition And Data Quality Evaluation In Environmental Chemistry. Anal. Chem. 1980, 52, 2242–2249. [Google Scholar] [CrossRef]
  27. López-Higuera, J.M. Handbook of Optical Fibre Sensing Technology; John Wiley and Sons: West Sussex, UK, 2002; ISBN 978-0-471-82053-6. [Google Scholar]
  28. Grot, W. Copyright. In Fluorinated Ionomers, 2nd ed.; Grot, W., Ed.; William Andrew (Elsevier): Kidlington, UK, 2011; ISBN 9781437744613. [Google Scholar]
  29. Rudolf Kingslake, R.B.J. Lens Design Fundamentals; Academic Press: Burlington, MA, USA, 2010; ISBN 9780123743015. [Google Scholar]
  30. Suzuki, Y.; Nakano, N.; Suzuki, K. Portable Sick House Syndrome Gas Monitoring System Based on Novel Colorimetric Reagents for the Highly Selective and Sensitive Detection of Formaldehyde. Environ. Sci. Technol. 2003, 37, 5695–5700. [Google Scholar] [CrossRef]
  31. Guo, X.-L.; Chen, Y.; Jiang, H.-L.; Qiu, X.-B.; Yu, D.-L. Smartphone-Based Microfluidic Colorimetric Sensor for Gaseous Formaldehyde Determination with High Sensitivity and Selectivity. Sensors 2018, 18, 3141. [Google Scholar] [CrossRef] [Green Version]
  32. Park, J.J.; Kim, Y.; Lee, C.; Kook, J.W.; Kim, D.; Kim, J.H.; Hwang, K.S.; Lee, J.Y. Colorimetric visualization using polymeric core-shell nanoparticles: Enhanced sensitivity for formaldehyde gas sensors. Polymers (Basel) 2020, 12, 998. [Google Scholar] [CrossRef]
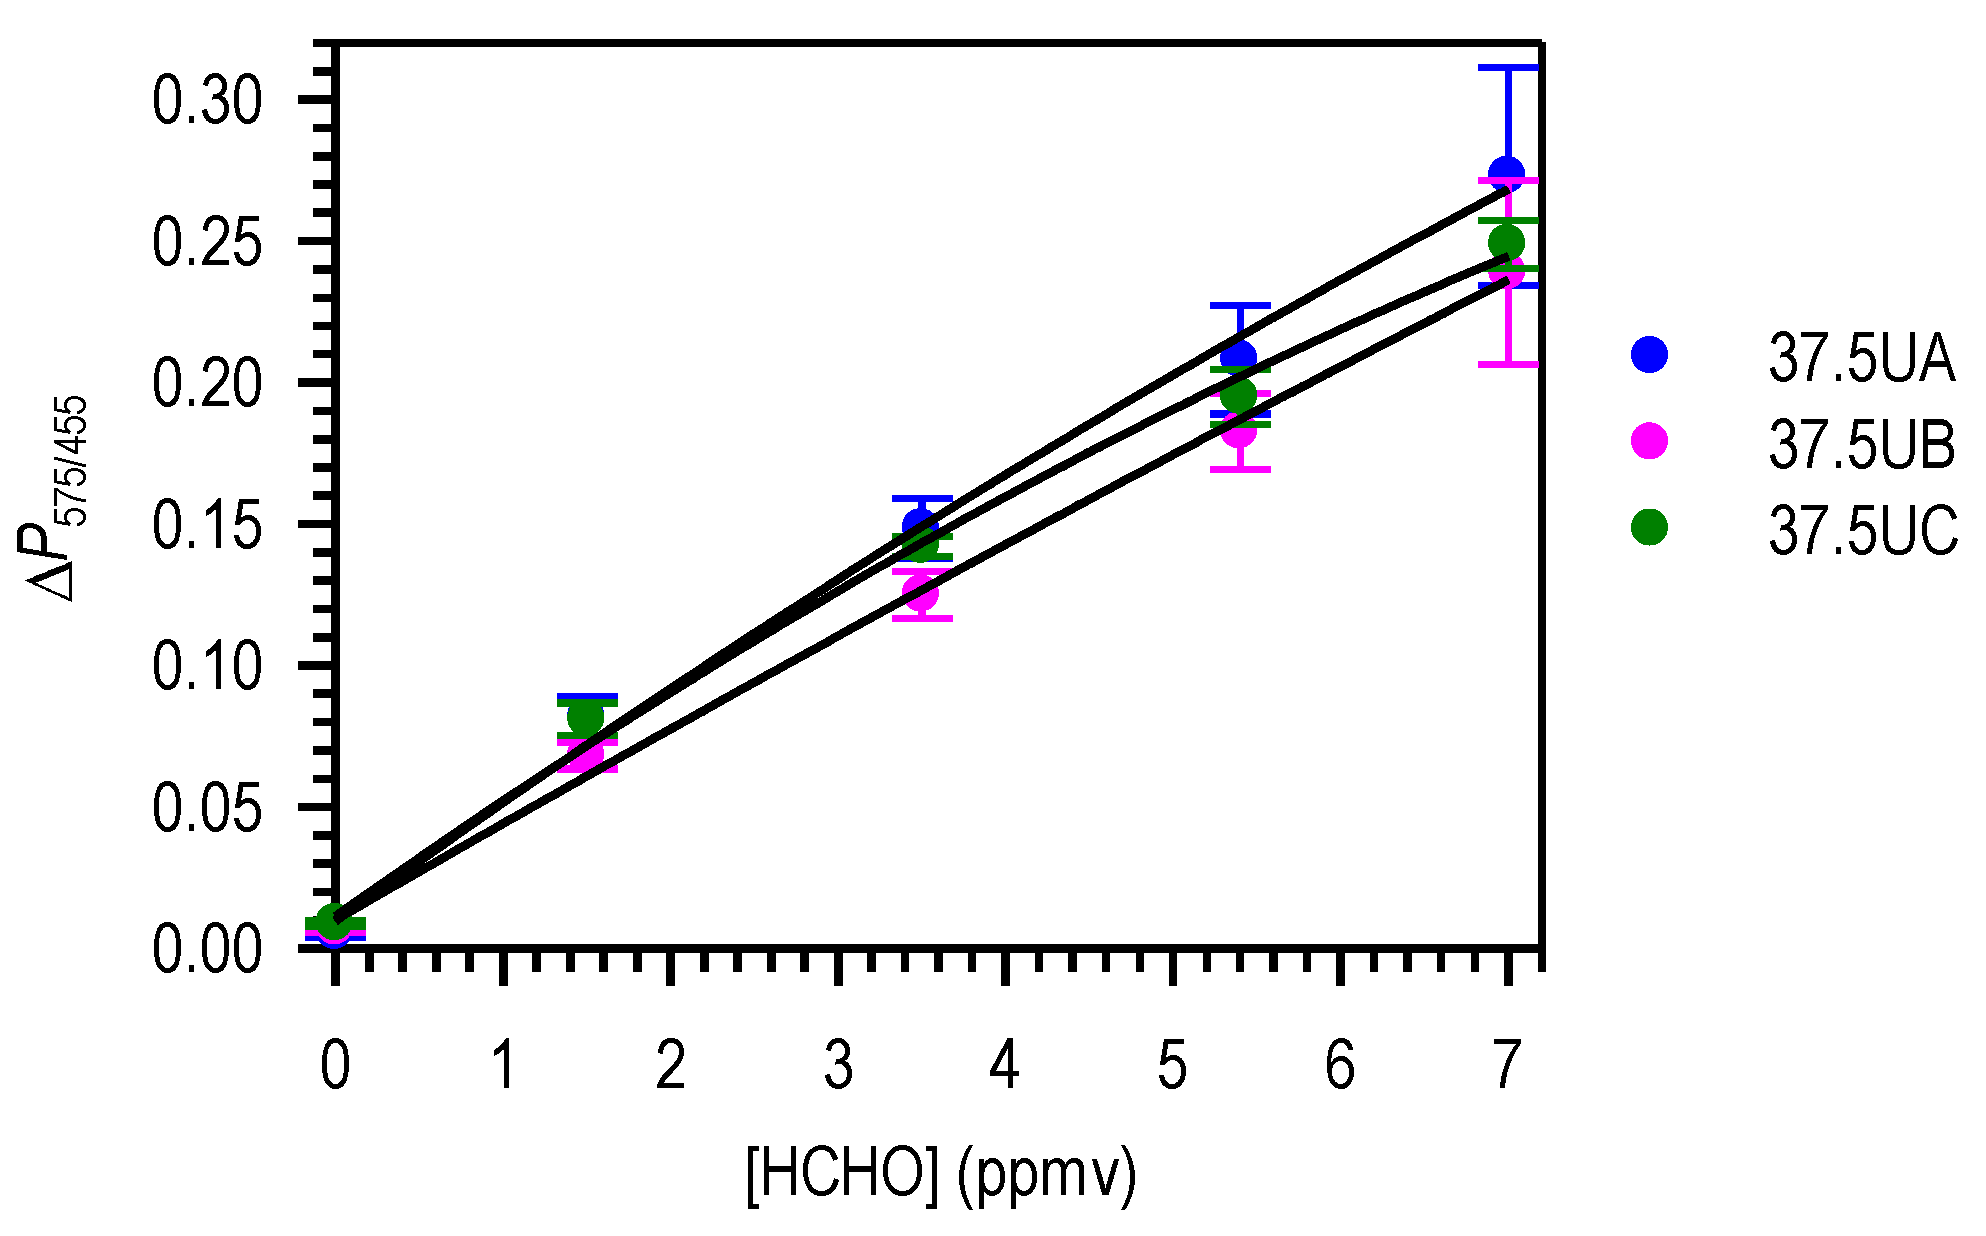
Figure 1. Scheme of the test rig employed for the evaluation of the evanescent wave absorption in the uncladded fibers.
Chemosensors 10 00061 g001
Figure 2. (A) Absorption spectrum of an aqueous solution of methylene blue 2.7 mg L−1 recorded with a Varian Cary 3Bio spectrophotometer. (BE) Normalized (at 455 nm) transmission spectra of the white LED-illuminated optical fibers subjected to the cladding dissolution process for 0 min (B), 20 min (C), 30 min (D) and 45 min (E) (blue lines) when dipped into a 2.7 mg L−1 methylene blue solution; the black line represents the normalized spectra in the absence of methylene blue (spectral acquisition parameters: boxcar 0; 10-scan average; 36 ms integration time).
Chemosensors 10 00061 g002
Figure 3. Typical airborne formaldehyde dose-response plot of a manufactured sensitive optical fiber in the 1.5–7.0 ppmv range (total flow rate 75 mL min−1, atmospheric pressure, 50% RH and controlled temperature (25 ± 1) °C).
Chemosensors 10 00061 g003
Figure 4. Typical formaldehyde dose-response plot of a sensitive optical fiber in the 1.5–7.0 ppmv range (total flow rate 75 mL min−1, atmospheric pressure, 50% RH, (25 ± 1) °C). The error bars depict the confidence interval (±t sn−1 n−1/2) for a 95% confidence level (n = 3).
Chemosensors 10 00061 g004
Figure 5. (A) Absorption spectra of aqueous solutions of the violet product (0.08 mmol L−1, purple line) and of LF (0.6 mmol L−1, black line) recorded in a Varian Cary 3Bio spectrophotometer. (BD) Normalized (at 840 nm) transmission spectra of three EWOFS manufactured from Nafion-coated PMMA, PC and PET-G filaments in the presence (blue lines) and in the absence (black lines) of LF indicator in the cladding. The gray dashed lines represent the ratio between the reference and the OFS spectra. Spectral acquisition parameters: 40 ms (PMMA), 1 ms (PC) and 10 ms (PET-G) exposure times; boxcar 7; 10 scans per spectrum.
Chemosensors 10 00061 g005
Figure 6. Normalized transmission spectra at 455 nm of two PMMA fiber cores before (black line) and during their exposure to a 2.7 mg L−1 methylene blue solution (blue line). (A) PMMA optical fiber subjected to a chemical dissolution process to remove its cladding for 45 min. (B) 3D printing PMMA filament. Acquisition parameters: 36 ms (A) and 100 ms (B) exposure times; boxcar 7; 10 scans per spectrum.
Chemosensors 10 00061 g006
Figure 7. Dose-response curves obtained for three sensitive optical fibers. Each point represents the average of 3 individual measurements (n) obtained for each airborne formaldehyde concentration in the 0.6−5.5 ppmv range at 50% RH. The error bars depict the confidence interval for a 95% confidence level (± tsn−1 n−1/2).
Chemosensors 10 00061 g007
Table 1. Formaldehyde calibration equations, LoD and LoQ obtained from the corresponding dose-response curve for the sensing fibers coded 37.5UA—UC.
CodeCalibration Equation ar2LoD (ppmv)LoQ (ppmv)
37.5UAΔP575/455 = 0.0010 + 0.042 [HCHO] − 0.0010 [HCHO]²0.9800.191.10
37.5UBΔP575/455 = 0.0014 + 0.034 [HCHO] − 0.0002 [HCHO]²0.9830.281.74
37.5UCΔP575/455 = 0.0010 + 0.043 [HCHO] − 0.0010 [HCHO]²0.9990.582.0
a [ppmv]: HCHO concentration expressed in ppmv; ΔP575/455: Analytical signal calculated as the difference between the P575/455 ratio before formaldehyde exposure and after 15 min exposure at 75 mL min−1 and (25 ± 1) °C. The LoD and LoQ were calculated from the peak-to-peak noise of 10 blank samples.
Table 2. Formaldehyde calibration equations, LoD and LoQ obtained from the corresponding dose-response curve for OFS coded 37.5UFA–37.5UFC.
CodeCalibration Equation ar2LoD (ppmv)LoQ (ppmv)
37.5UFAΔP575/455 = 0.0017 + 0.089 [HCHO] − 0.0050 [HCHO]²0.9960.080.32
37.5UFBΔP575/455 = 0.0015 + 0.083 [HCHO] − 0.00020 [HCHO]²0.9980.050.22
37.5UFCΔP575/455 = 0.0010 + 0.095 [HCHO] − 0.0050 [HCHO]²0.9970.060.25
a [ppmv]: HCHO concentration expressed in ppmv; ΔP575/455: analytical signal calculated as the difference between the P575/455 ratio before formaldehyde exposure and after 15 min exposure at 75 mL min−1 and (25 ± 1) °C. The LoD and LoQ were calculated from the peak-to-peak noise of 10 blank samples.
Publisher’s Note: MDPI stays neutral with regard to jurisdictional claims in published maps and institutional affiliations.

