
How Surface-Enhanced Raman Spectroscopy Could Contribute to Medical Diagnoses
by
 ,
,
Aleksandra Szaniawska
1,* ,
,
Kinga Mazur
1,†,
Dominika Kwarta
1,†,
Edyta Pyrak
1,2 and
Andrzej Kudelski
1
1
Faculty of Chemistry, University of Warsaw, 1 Pasteur St., 02-093 Warsaw, Poland
2
Nencki Institute of Experimental Biology, Polish Academy of Sciences, 3 Pasteur St., 02-093 Warsaw, Poland
*
Author to whom correspondence should be addressed.
†
These authors contributed equally to this work.
Chemosensors 2022, 10(5), 190; https://0-doi-org.brum.beds.ac.uk/10.3390/chemosensors10050190
Submission received: 10 April 2022
/
Revised: 5 May 2022
/
Accepted: 16 May 2022
/
Published: 19 May 2022
(This article belongs to the Special Issue Advanced Bio-Chemical Sensors Based on Plasmonic Nanostructures)
Abstract
:In the last decade, there has been a rapid increase in the number of surface-enhanced Raman scattering (SERS) spectroscopy applications in medical research. In this article we review some recent, and in our opinion, most interesting and promising applications of SERS spectroscopy in medical diagnostics, including those that permit multiplexing within the range important for clinical samples. We focus on the SERS-based detection of markers of various diseases (or those whose presence significantly increases the chance of developing a given disease), and on drug monitoring. We present selected examples of the SERS detection of particular fragments of DNA or RNA, or of bacteria, viruses, and disease-related proteins. We also describe a very promising and elegant ‘lab-on-chip’ approach used to carry out practical SERS measurements via a pad whose action is similar to that of a pregnancy test. The fundamental theoretical background of SERS spectroscopy, which should allow a better understanding of the operation of the sensors described, is also briefly outlined. We hope that this review article will be useful for researchers planning to enter this fascinating field.
Keywords:
SERS; surface-enhanced Raman spectroscopy; nanosensor; biosensor; medical; cells; DNA; multiplexing1. Introduction
Raman spectroscopy is a spectroscopic technique typically used to determine vibrational modes of molecules, although rotational and electronic transitions of molecules may also be observed. While a non-linear molecule with N atoms has 3N–6 normal modes of vibration, the number of spectral bands identified in the recorded vibrational Raman spectrum is usually different, since some vibrational modes may be degenerated or silent in Raman spectroscopy, whereas some ‘addition bands’ due to overtones, combinational modes, and spectral splitting due to Fermi resonance may be also observed. In general, molecules have complex vibrational Raman spectra that can be treated as a structural fingerprint by which molecules can be identified. Moreover, the half-width of many vibrational Raman bands is only a few or a dozen cm−1, whereas the spectral range in which a typical vibrational Raman spectrum is recorded amounts to about 1600 or 3000 cm−1. In many cases (if the Raman bands are sufficiently separated), this makes possible a relatively simple and precise simultaneous determination of the intensity of bands belonging to many different compounds. This makes Raman spectroscopy an ideal tool for the simultaneous detection in one Raman measurement of a large number of compounds.
In addition to the possibility of easy simultaneous detection, Raman spectroscopy reveals very high sensitivity in some cases. Standard Raman spectroscopy is not an especially sensitive analytical tool, since a typical total Raman scattering cross-section is only ca. 10−29 cm2 per molecule, whereas, for comparison, typical cross-sections for absorption in ultraviolet and infrared are ca. 10−18 and 10−21 cm2 per molecule, respectively [1]. Therefore, in order to record a reliable ‘standard’ Raman spectrum, one has to use a solution of an analyte having a concentration larger than ca. 0.01 M. However, when molecules of an analyte are adsorbed on nano-resonators constructed from plasmonic metals, the Raman scattering cross sections for some molecules can be significantly increased, even to e.g., 2 × 10⁻¹⁴ cm2 per molecule (i.e., about 15 orders of magnitude in comparison with normal Raman scattering) [2] in an effect known as surface-enhanced Raman scattering (SERS). Such large increases in efficiency of the generation of the Raman signal permits the observation of Raman spectra of even single molecules [2,3,4]; therefore, SERS is among the most sensitive analytical tools available.
Due to the ease with which the two above-mentioned advantages can be combined, SERS spectroscopy has found many promising applications in biochemical and medical analyses. In this review, we present what we consider to be some of the most interesting and most promising applications of SERS spectroscopy in biochemical and medical analyses. We mainly focus on the SERS-based detection of markers of various diseases, the detection of species whose presence significantly increases the chance of developing a given disease, and on drug monitoring. Among the examples of SERS analysis focused on the detection of markers of various diseases, we describe, for example, the detection of a fragment of DNA or RNA having a particular sequence, the detection of bacteria and viruses, and the detection of disease-related proteins. The basic methodologies of label-free SERS detection (see Section 3.1) and SERS detection utilizing Raman reporters (molecules/moieties generating a Raman signal with especially high efficiency—see Section 3.2) are also discussed. Since label-free applications of SERS are rather exceptional situations resulting from the properties of specific molecules detected in the described experiments rather than from the possibility of applying this methodology in general in biochemical environments, the majority of the examples presented use Raman reporters. A very promising and elegant so-called ‘lab-on-chip’ approach for carrying out practical SERS measurements using a pad whose action is similar to that of a pregnancy test is also presented (see Section 4.6). The basic theoretical background of SERS spectroscopy, which should permit a better understanding of the operation of many SERS sensors, is also briefly described (see Section 2). We hope that this review article will be useful for researchers planning to enter this fascinating field.
2. Surface-Enhanced Raman Spectroscopy (SERS)
The history of the development of SERS spectroscopy dates back almost half a century. The first paper reporting a very strong Raman signal from an interface (pyridine adsorbed on an electrochemically-roughened silver surface) was published by Fleischmann and co-workers in 1974 [5]. Unfortunately, this group incorrectly suggested that the very high intensity of the recorded Raman spectrum was only due to the large number of adsorption sites on the roughened silver surface [5]. A proper interpretation of the observed effect was independently announced in 1977 by two other groups (Jeanmaire and van Duyne [6], and Albrecht and Creighton [7]), who proved that very strong Raman spectra were actually due to a very large increase in the Raman cross section of the molecules adsorbed on the nanostructured silver. Because of this, the effect came to be called surface-enhanced Raman scattering (SERS). Intense SERS spectra were later observed for many other compounds adsorbed on many different nanostructured materials (usually nanostructured plasmonic metals from group 11 of the periodic table). The mechanism of the increased efficiency in the generation of the Raman signal in SERS measurements is explained by the synergistic cooperation of two mechanisms: (i) connections with a local increase in the intensity of the electric field in close proximity to the illuminated plasmonic material due to the excitation of the localized surface plasmons, and (ii) resonance-like Raman scattering leading to an increased cross section for Raman scattering in the chemisorbed molecules.
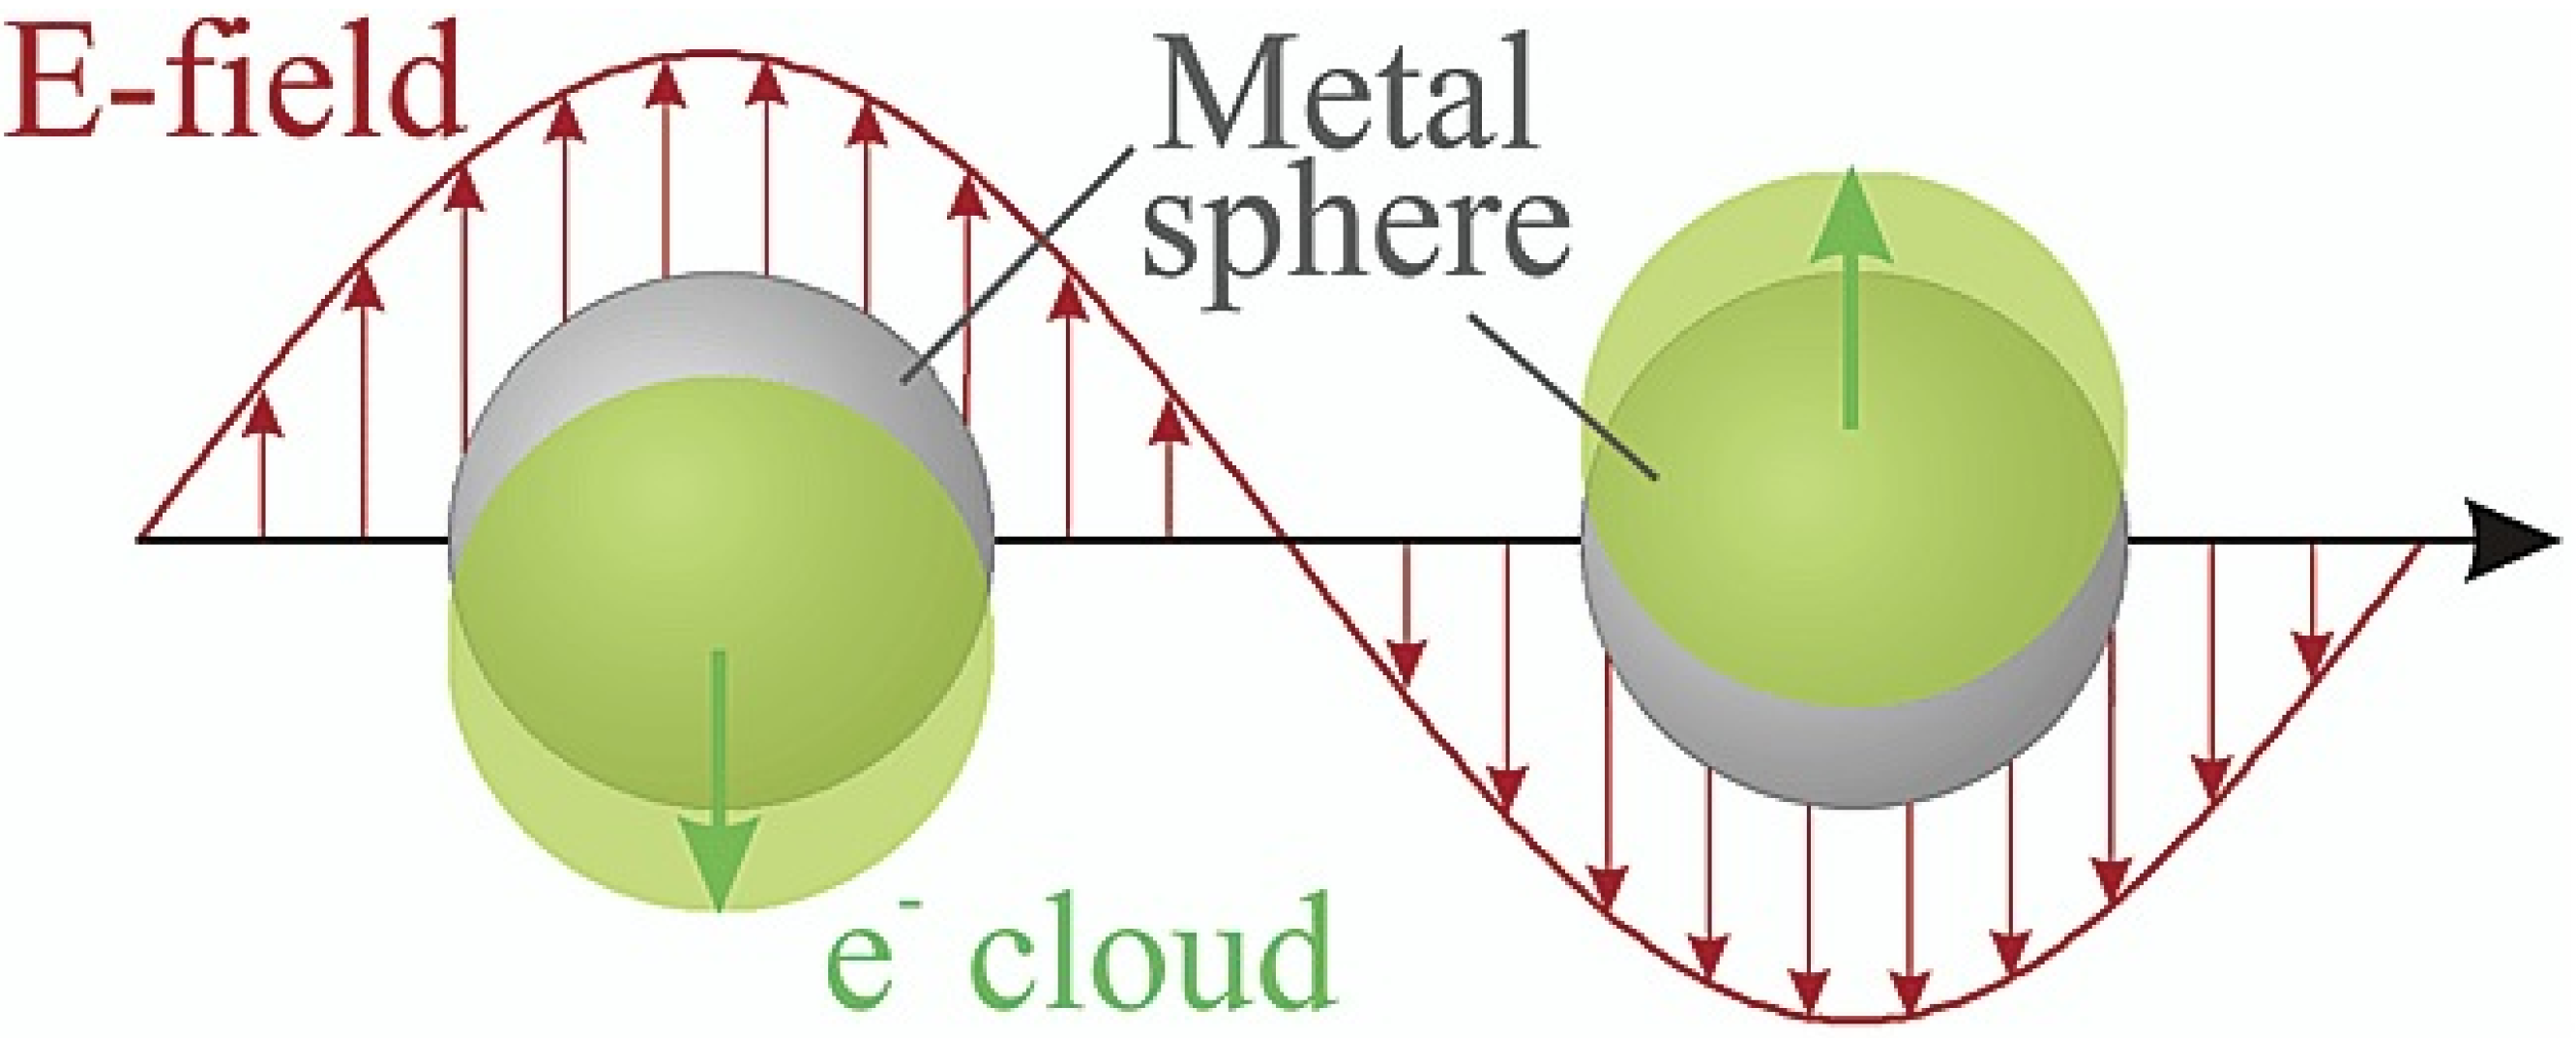
Usually, the main source of the SERS enhancement is a large local increase in the intensity of the electric field in the proximity of the illuminated plasmonic nano-objects (meaning nano-objects formed from a material with a negative real and a small positive imaginary dielectric constant at a given excitation frequency). When such nanostructures are illuminated by an electromagnetic wave, the electric field of the excitation radiation induces collective oscillations of the surface conduction electrons, called surface plasmons [1,8]—see Figure 1.
Induced by the electric field of the electromagnetic wave, the oscillations of electrons can be viewed as the appearance of an oscillating electric dipole. For a spherical metal nanoparticle, the induced electric dipole (p) is proportional to the following:
where: ν is the frequency of the excitation electromagnetic wave, and and are the dielectric functions of the metal and the surrounding medium, respectively [1,9]. The induced electric dipole generates an additional electric field in close proximity to the illuminated plasmonic nano-object. As can be seen from the above equation, where the value of is close to the value of , p is very large, which means that a very strong electric field is locally induced. Such resonance conditions occur, for example, with silver nano-objects in air or in an aqueous environment for any visible excitation radiation, or with gold nanostructures in these environments when red excitation radiation is used.
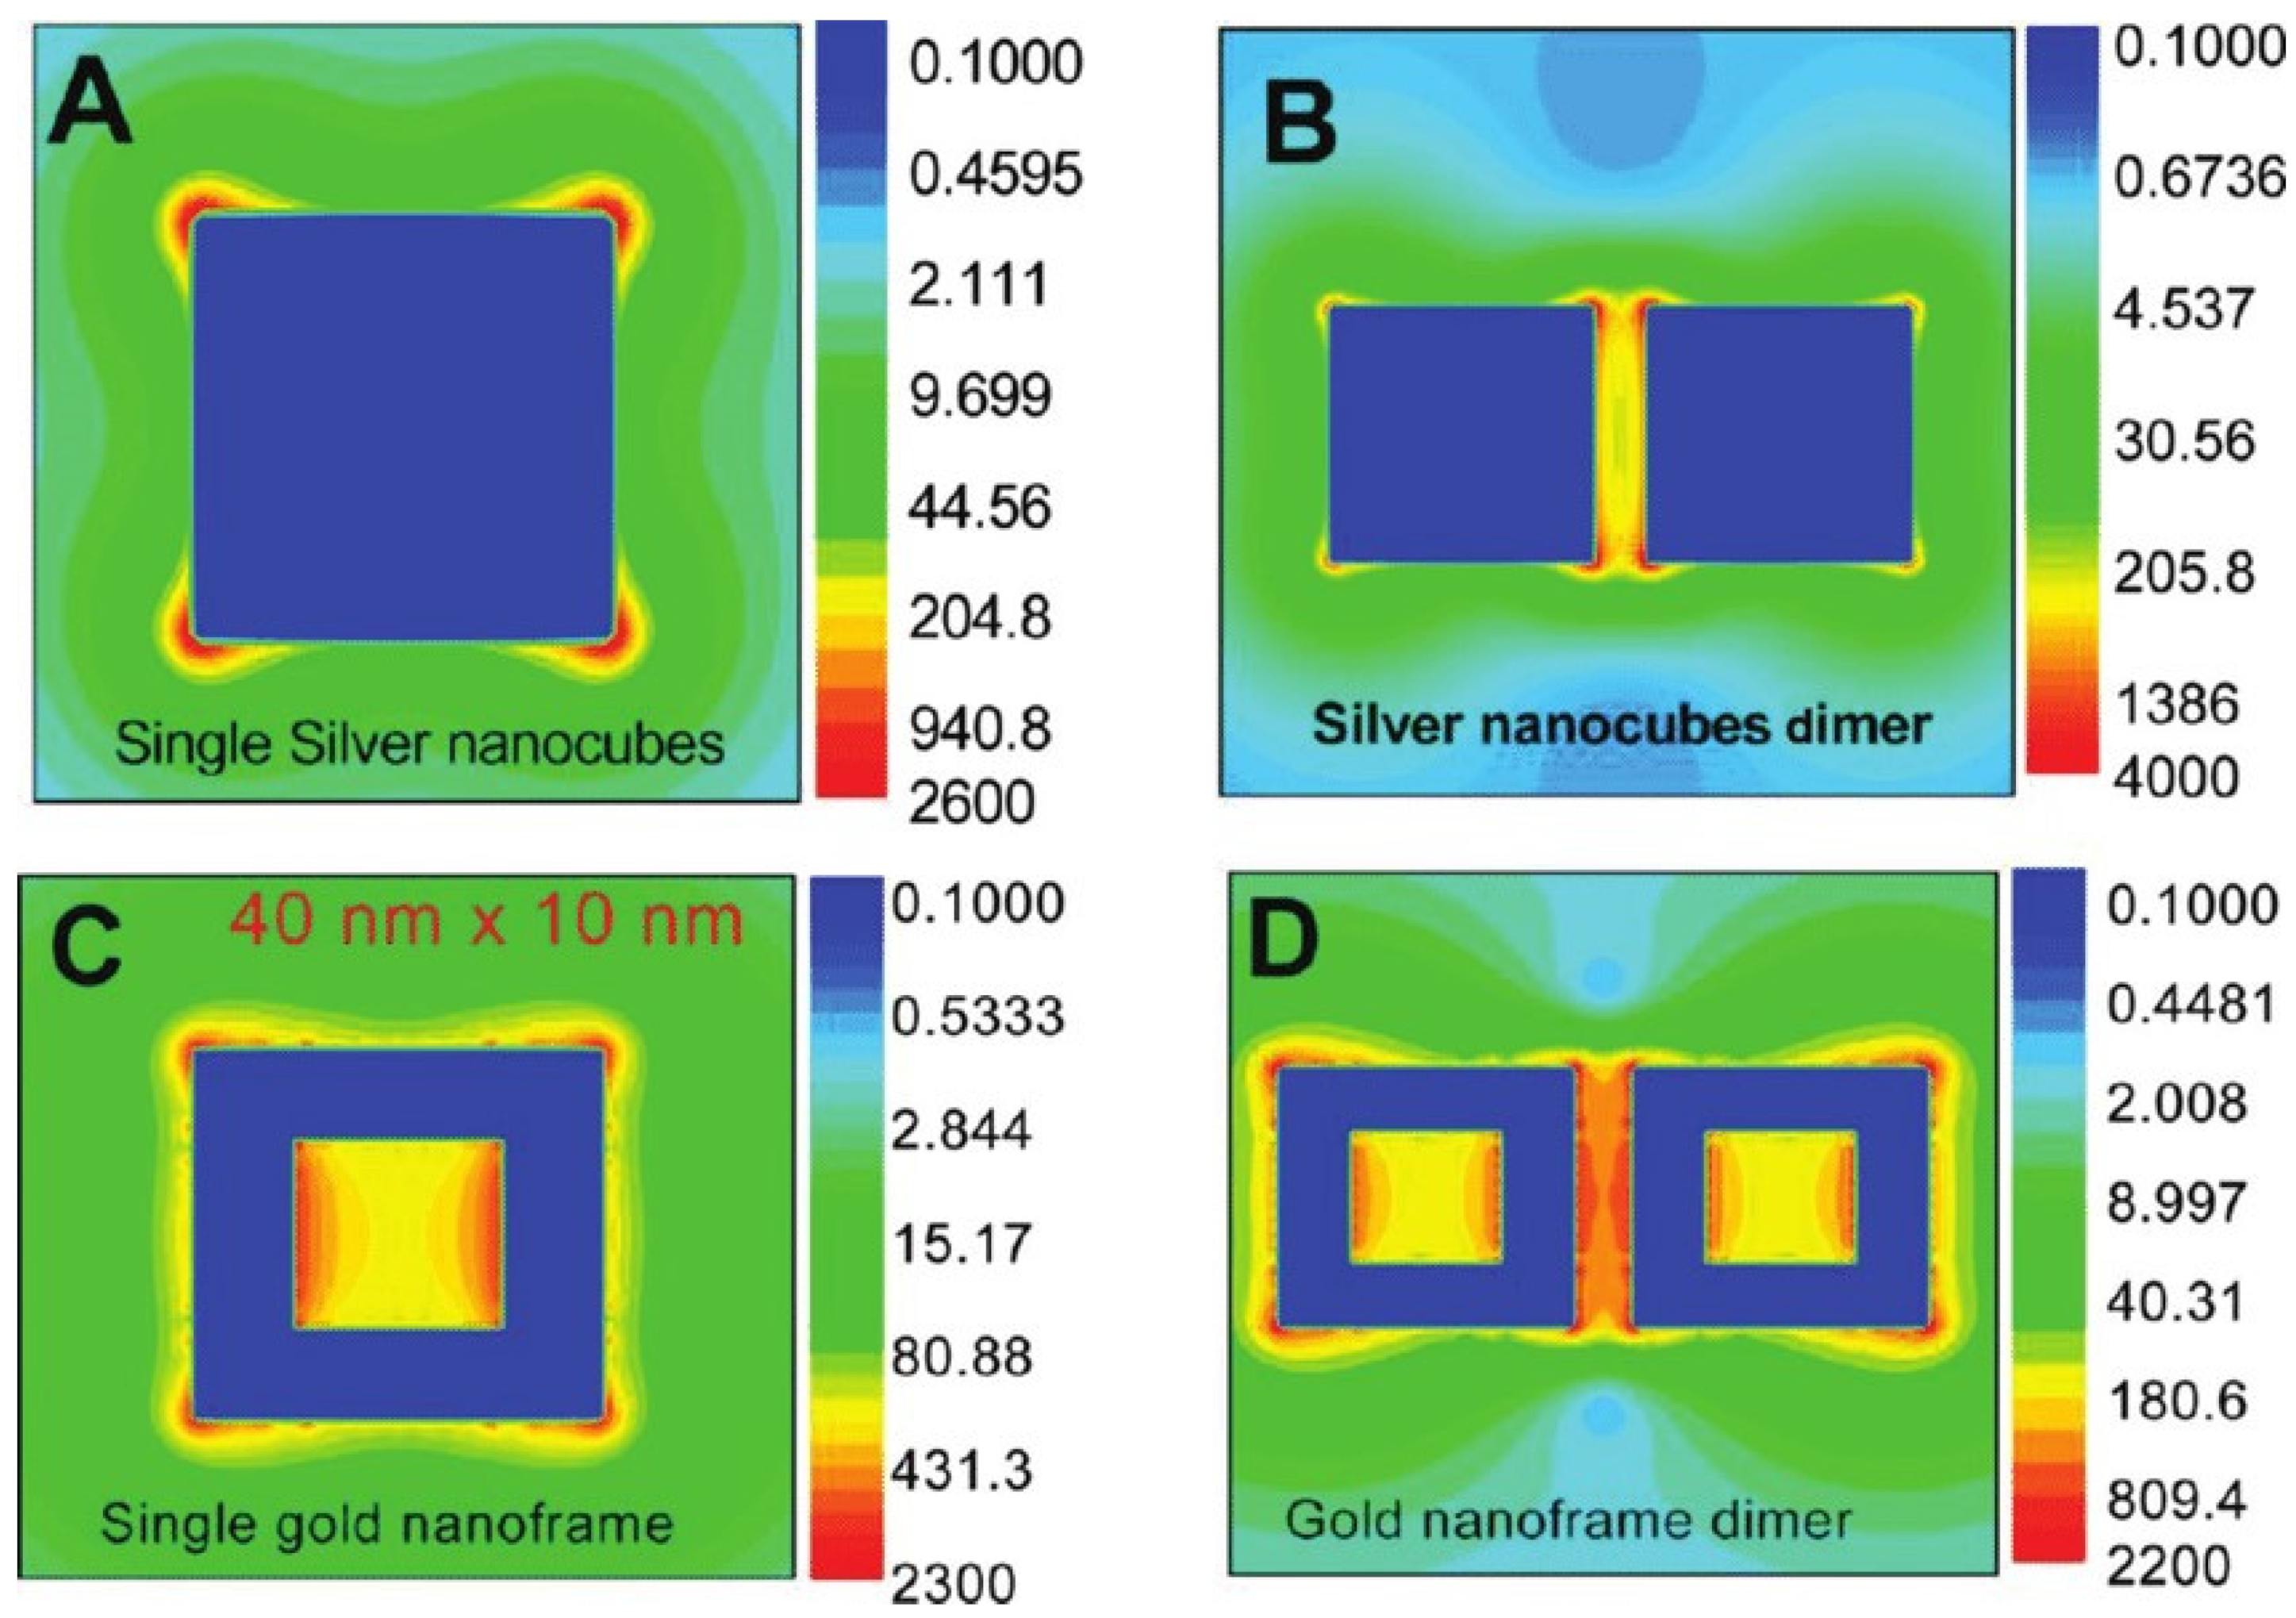
When interpreting the results of SERS measurements, one should remember the following dependencies of the SERS enhancement factor on the geometry of the plasmonic systems used: (i) for illuminated isolated anisotropic plasmonic nanostructures, the strongest electromagnetic field is generated at their sharp apexes and edges; (ii) for illuminated agglomerates or aggregates of plasmonic nanostructures, the strongest field is generated in the slits between the plasmonic nanoobjects—such places are called ‘hot spots’ [10]. This means that, for SERS measurements carried out on sols of plasmonic nanoparticles, the agglomeration of nanoparticles induces a strong increase in the intensity of the measured SERS spectrum. Figure 2 shows some sample results of the simulation of the field enhancement due to the excitation of plasmons [11].
As can be seen from Figure 2, at some places around the illuminated plasmonic nanostructures the local field enhancement exceeds three orders of magnitude. Since the increase in the efficiency of the generation of the Raman signal in the SERS effect is roughly proportional to the fourth power of the field enhancement [1,12], one can expect that the local SERS enhancement factor in SERS ‘hot spots’ can even exceed 12 orders of magnitude. The other important rule in SERS spectroscopy is that the achievable enhancement factor decreases roughly as a function of r−10 with increasing distance from a plasmonic nanoparticle [13]. Therefore, one can observe very large changes in the intensity of the measured SERS signal if there is a change in the distance between the surface of the plasmonic structure and the moiety generating the Raman scattering. This phenomenon explains the functionality of many SERS sensors.
In addition to above-described electromagnetic mechanism of SERS enhancement, there is also a so-called chemical (or charge-transfer-CT) SERS enhancement. The mechanism of this enhancement is described analogously to the standard resonance Raman scattering. Resonance Raman spectroscopy is a Raman spectroscopy technique in which the energy of incident photons is close to an electronic transition of a compound under examination—in this case, the intensity of Raman bands can be increased by several orders of magnitude. The mechanism of SERS chemical enhancement involves the hybridization of the orbitals of the adsorbed molecules with the orbitals of the metal, and the formation of complexes for whose resonance the Raman effect leads to an increased cross section for Raman scattering. This resonance-like mechanism is only important for molecules interacting directly with the metal surface, and its contribution to the total SERS enhancement usually does not exceed two orders of magnitude [14,15]. For electrochemical systems, where it is possible to easily control the potential of the metallic SERS substrate (and thus the energy of the Fermi level, which depends on the applied potential), it is possible to change the magnitude of the chemical SERS enhancement by changing the applied potential.
3. Biomedical Applications of SERS—General Principles of the Measurements
We achieve progress in medicine every day. Diagnoses are made faster and more accurately, drugs are becoming more specific, and we are far less helpless in relation to many diseases. The faster a diagnosis is made, the greater the chance for recovery, thus a substantial effort by countless research groups is being invested into accelerating and correcting medical diagnoses. As SERS spectroscopy can offer speed, high sensitivity and multiplexing, medical samples have become popular as a research subject for SERS spectroscopy. Currently, with countless applications of SERS, several directions seem to hold out the greatest promise of joining the ranks of routinely applied methods in the future. First of all, there is the simultaneous detection of several disease markers. This approach is in contrast to fluorescence, in which the technique is limited by the number of channels in the fluorimeter. With SERS, a very large number of biomarkers could be detected together, provided that we can find reporter molecules that vary in the fingerprint region of SERS spectra. Secondly, applying SERS spectroscopy to the identification of DNA/RNA mutations, which traditionally involve the long times and high costs of genetic tests. SERS spectroscopy can also be applied to monitoring drug levels in the blood (with the main emphasis on tumour drug monitoring, TDM, though it is also important to monitor the level of antibiotics or cardiac medications, especially because they are taken daily in contrast to, e.g., methotrexate, which is taken weekly). Moreover, during surgery or optical fiber-guided imaging procedures, SERS can be used to detect and visualize diseased tissues.
The most recent literature in the field of biomedical SERS shows that the technique is being developed in a myriad of ways. The pandemic multiplied the efforts made into conducting experiments that sought the rapid detection of viruses, and this included SERS experiments. Below, we describe subjectively selected articles showing the potential of SERS in medical applications, together with our commentary regarding trends and possibilities for the future. We decided to describe label-free experiments only briefly, and to focus on SERS-based nanosensors utilizing Raman reporters (molecules or moieties with an exceptionally large cross-section for Raman scattering), since these seem to be more promising in medicine; in fact, we are limited only by our imagination when selecting what molecules could be detected by very differently designed sensors. We have divided this text into sections, although the division is a rather conventional one, since several works could be assigned to different paragraphs.
3.1. Basics of Label-Free SERS
Label-free or direct SERS detection requires the use of only SERS-active substrates free of any molecular species that generate their own Raman signals [16]. This approach is experimentally much simpler than nanosensors that utilize Raman reporters; however, the spectra obtained during label-free SERS experiments are often difficult to analyse without advanced data analysis software [17]. Often, the signal-to-noise ratio in the recorded spectra is unsatisfactory, and the differences between various spectra are marginal.
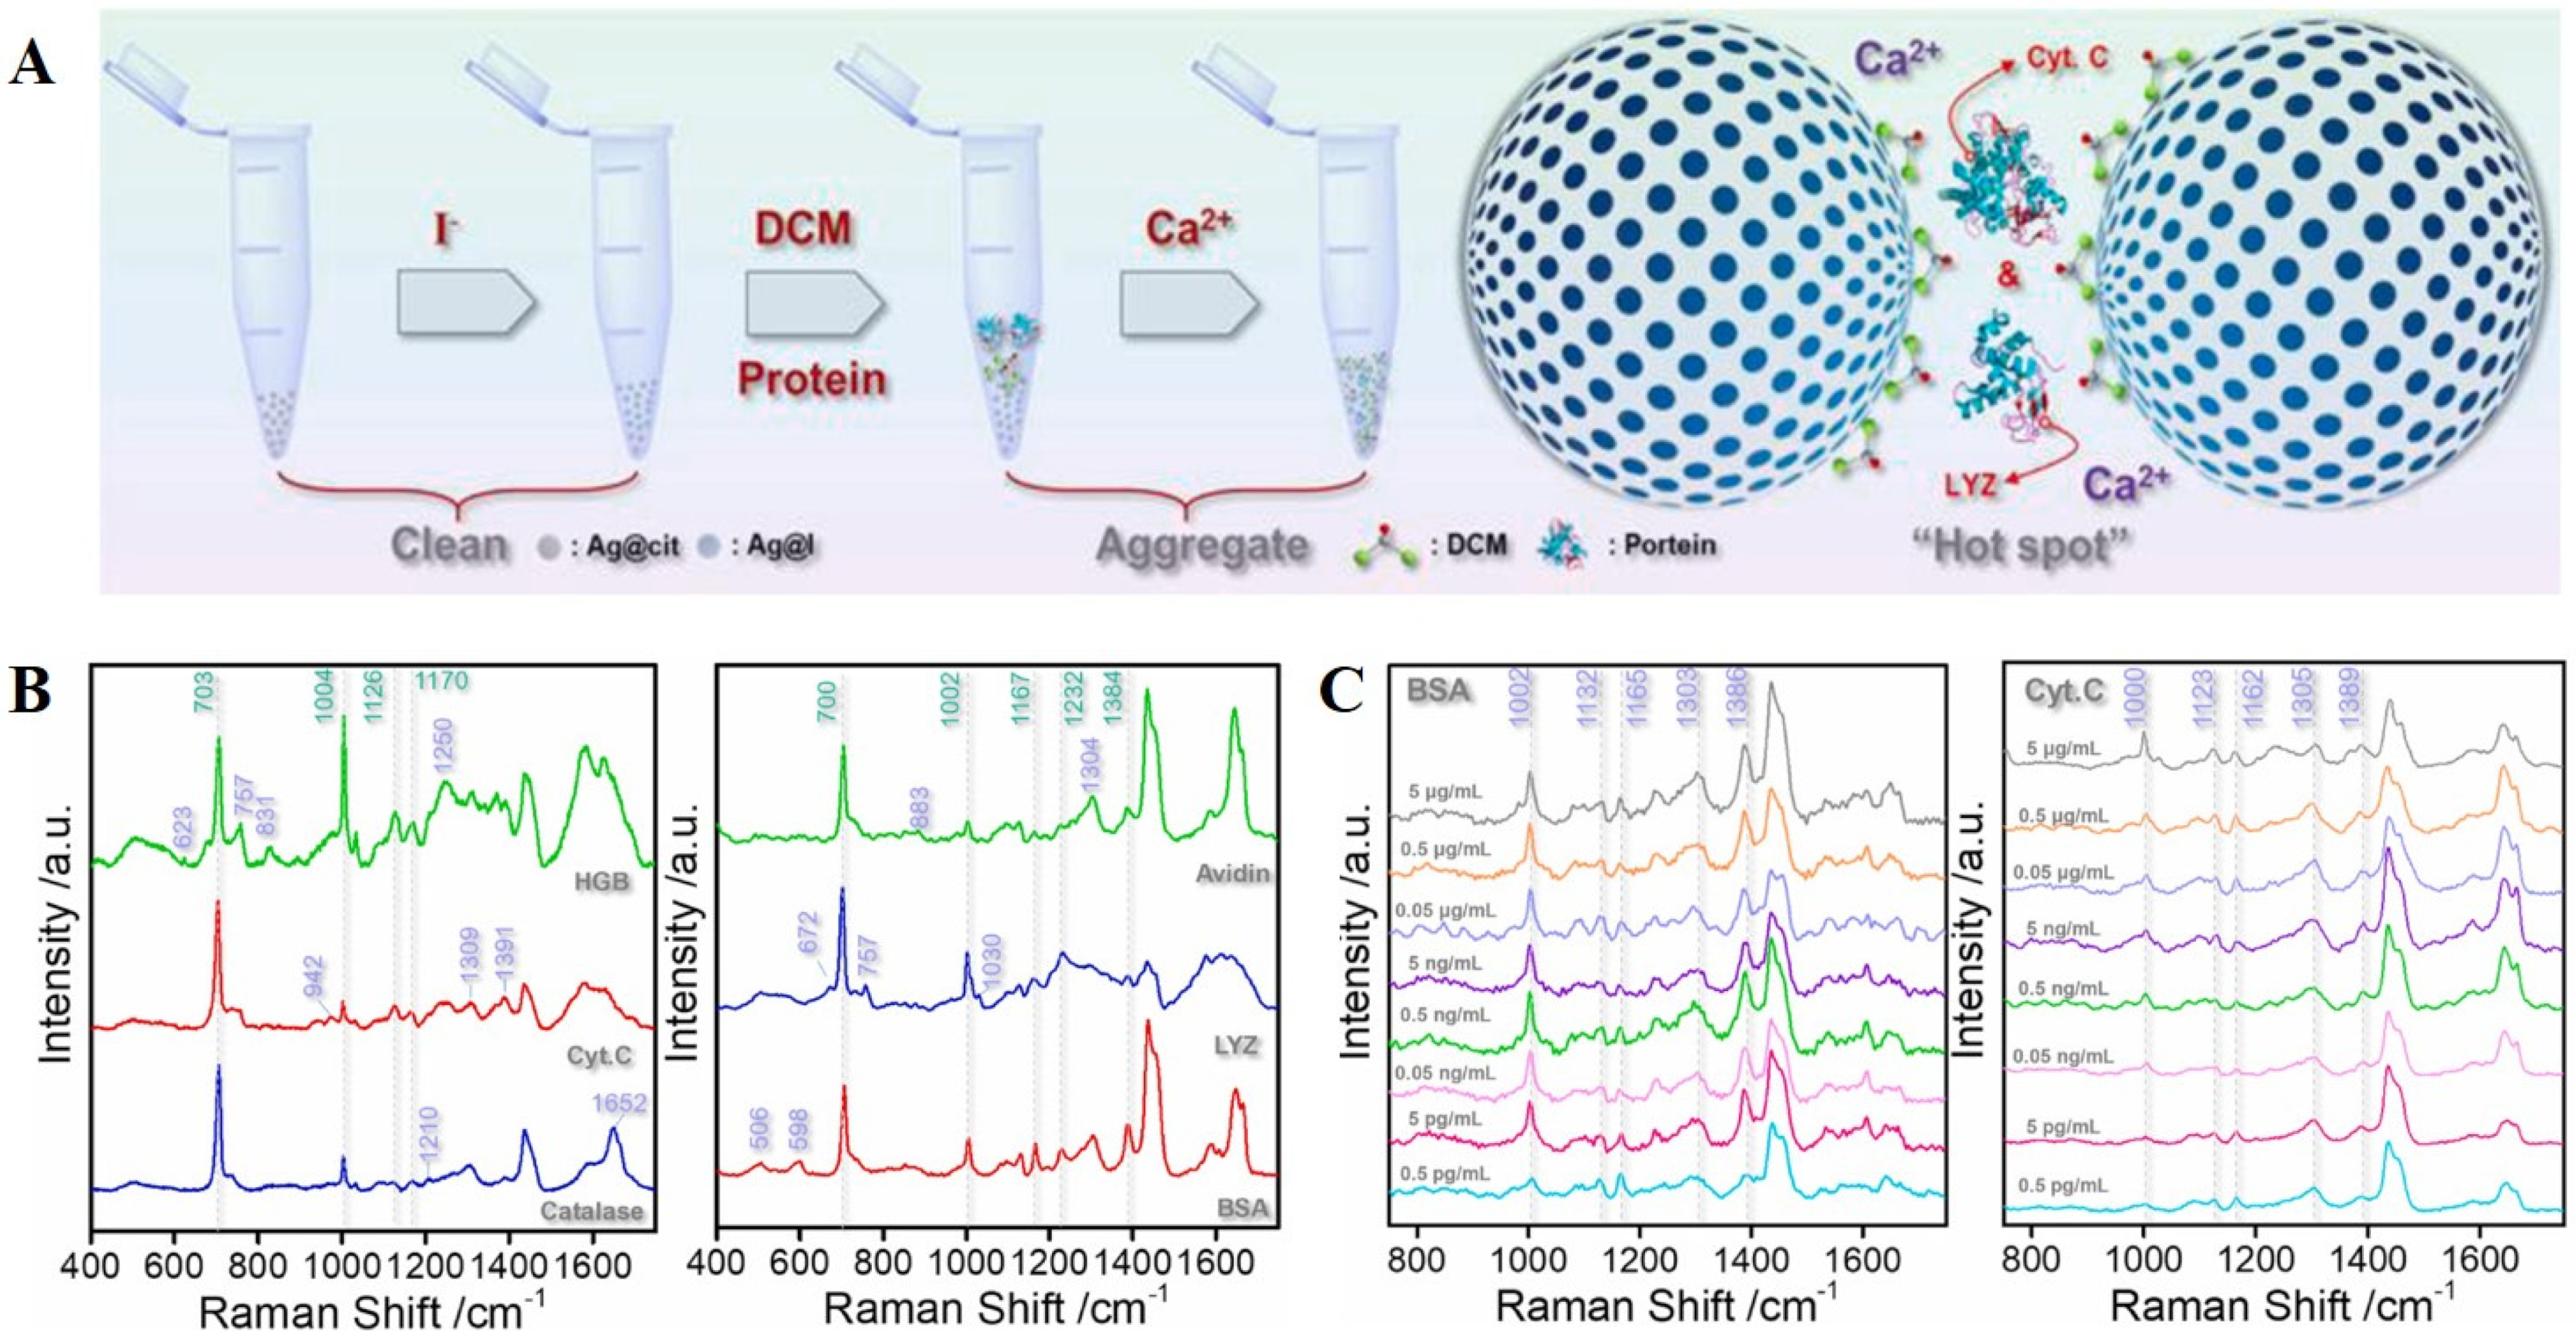
That being said, there are some interesting examples of the label-free detection of proteins. These range from cytochrome C, myoglobin, proteins containing intrinsic chromophores (tryptophan, tyrosine, phenylalanine), to proteins without chromophores such as lysozyme, bovine serum albumin, or avidin [17] (and therein). Li et al. performed SERS studies on seven standard proteins, including bovine serum albumine (BSA), cytochrome C (cyt. C), lysozyme (LYZ), avidin, haemoglobin (HGB), catalase, and γ-glutamyl transpeptidase (GGT) [18]. They used silver nanoparticles aggregated by calcium ions, and showed that each peptide had unique fingerprint peaks; they also detected GGT in human serum at a concentration of 40 µg/mL. In Figure 3, there is a scheme of an experimental procedure and SERS spectra of six different proteins adsorbed on silver nanoparticles, including concentration-dependent spectra of bovine serum albumine and cytochrome C.
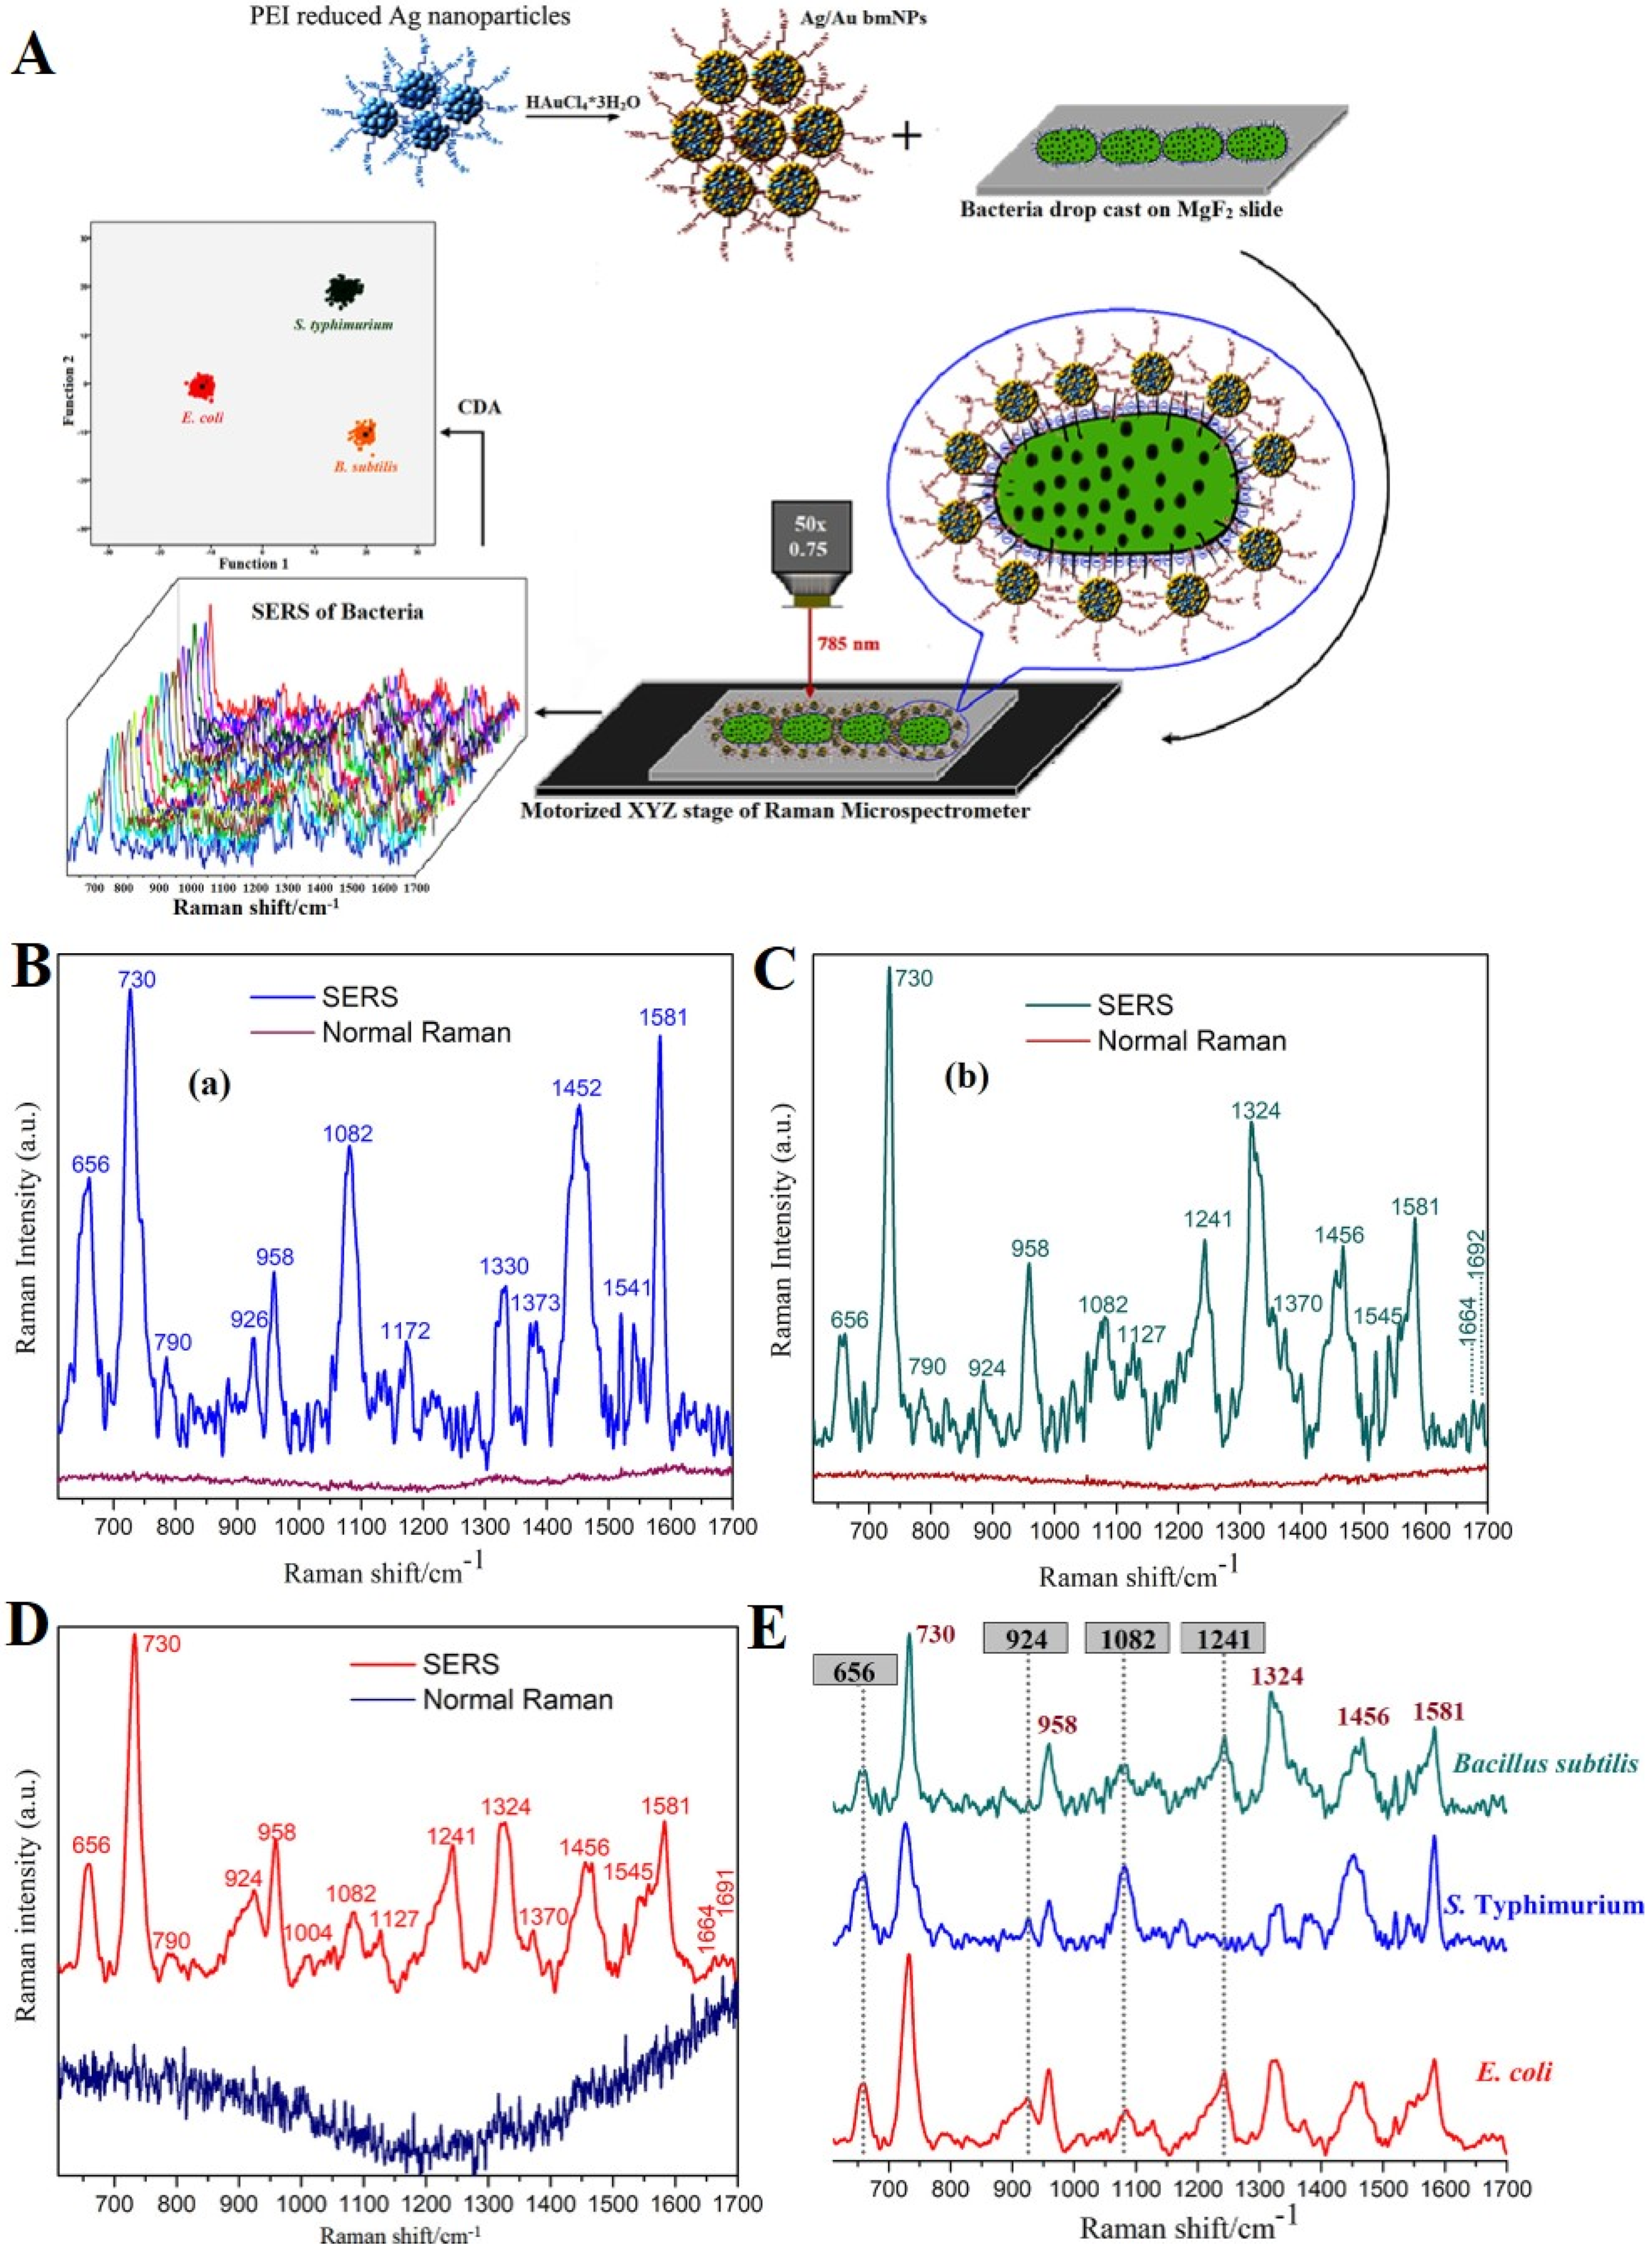
There are also examples of the label-free recognition of different types of bacteria. Prakash et al. have shown that the SERS spectra of Escherichia coli differ significantly from those of Salmonella typhimurium and Bacillus subtilis, although the latter two are similar to each other and require chemometrics to differentiate between them [19]. The detection was performed according to a scheme shown in Figure 4 with the use of Ag/Au bimetallic nanoparticles initially tested on 4-mercaptopyridine.
Hunter et al. have developed a Raman platform consisting of microfluidic driven hollow-core photonic crystal fiber and silver nanoparticles, enabling detection of planktonic bacteria at 4 CFU/mL in 15 min [20]. With the use of chemometrics, they differentiated different bacteria (P. aeruginosa, S. aureus, and E. coli) in fetal bovine albumine.
Unless there are specific peaks in SERS spectra making it possible to identify particular molecules, the SERS spectra of, e.g., samples from healthy and ill patients with Alzheimer’s disease [21], Dengue virus [22] or cancer, from blood samples [23,24], urine [25,26], plasma [27], tears [28], circulating exosomes [29] or healthy and cancer cells [30] and tissues [31] can be very similar and require advanced chemometrics to distinguish between them. Label-free SERS can be also used to detect some morphological changes, e.g., a decrease in fluidity in the erythrocyte plasma membrane, or a decrease in the mobility of the heme of membrane-bound hemoglobin caused by hypertension [32], as well as platelet activity [33]. When combined with PCR (polymerase chain reaction), even very subtle differences, such as gene methylation levels, can be detected [34].
These examples show the huge advantage of label-free detection in terms of its ease of experimental procedure. However, we simply need to be lucky to detect the molecules showing specific peaks in the fingerprint region. It is worth attempting, though, since once specific molecules have been found and detected via label-free SERS, this could potentially result in a rapid and simple diagnostic test.
3.2. Basics of SERS Detection Utilizing Raman Reporters—Multiplexing
In contrast to the label-free approach, the preparation of SERS-based nanosensors that utilize Raman reporters is more time-consuming and complicated. However, Raman reporters offer greater control over both the experiment and the results. The Raman signal is not generated by the measured analytes, but by Raman reporter molecules (RRM)—sometimes chromophore moieties exhibiting a high cross-section for Raman scattering and therefore providing a strong SERS signal. The most commonly used reporters are dyes (brilliant blue, cresyl violet, malachite green, methylene blue, crystal violet, etc.), thiolated molecules (e.g., 4-mercaptobenzoic acid or 4-methoxythiophenol), and other small molecules known to have a characteristic Raman spectrum (e.g., 1,2-bis(4-pyridyl)ethylene) [35]. In order to maximize the SERS enhancement, the target molecule should be very close to the metal surface, otherwise the signal rapidly decreases [36]. With this approach, the specificity of a given substance is considerably increased. Moreover, the use of reporter molecules with a narrow spectral width of the Raman bands offers higher multiplexing capability when imaging selected markers, as compared with fluorescence measurements which are usually limited to three channels. For example, Yu et al. demonstrated the non-invasive and five-plex SERS imaging of the nanoparticle accumulation in tumours of living mice [37], while Zavaleta et al. described the detection of ten different RRM in one live mouse [38] (see Figure 5). In both cases, nanoparticles were injected via the tail and migrated to a solid tumour, showing the possibility of differentiating up to 10 different RRM in vivo, which could speed up diagnoses in, e.g., the treatment of cancer.
Multiplexing is one of the biggest advantages SERS offers for medical purposes. Since SERS-based nanosensors can be used in a variety of modifications that permit the detection of DNA/RNA strands, disease markers, glucose, small ions, proteins, and other molecules, below we focus on some examples that might be considered as an alternative to the biochemical tests routinely performed.
4. Biomedical Applications of SERS—Sample Implementations
4.1. DNA and RNA Detection
Unarguably, DNA is a very significant biomolecule. Specific DNA fragments are involved in genetic mutations, and hence in processes concerning diseases development, as well [39], which means that the detection of specific fragments of DNA could lead to new therapies [40]. Currently, the primary methods of DNA detection include PCR (polymerase chain reaction) and NGS (next-generation sequencing) [41]. Although these techniques are commonly used, their reliability is sometimes questioned because they are prone to contamination, and have only low sensitivity. Additionally, they are time-consuming and relatively expensive [40,42]. Detection based on SERS is reported to be a promising alternative. Label-free SERS requires an analyte and metallic nanostructures. While it is simple to perform, it may prove unreliable for complex samples. Also, the label-free approach may be unsuitable for some samples, such as those that contain double-stranded DNA; this is due to electrostatic repulsion between the negatively-charged phosphate moiety in DNA and the nanoparticle surface. In order to overcome this problem, ions such as Mg2+ [43], Ca2+, Pb2+ or Al3+ [44], or spermine [40,45,46] can be used for nanoparticle modification, resulting in the formation of a positively-charged surface.
An interesting example of DNA detection using SERS was presented by Yu et al. [45]. The aim of this experiment was to develop a detection method for DNA that have what are known as BRAF mutations, which are associated with genetic disorders and cancer [46,47]. The sensor consisted of two types of probe nanostructures: DNA-covered Fe3O4@SiO2@Au nanoparticles, and DNA-covered Ag nanoparticles, both also consisting of RRM. Both of the DNAs used to modify the plasmonic nanoparticles were partially complimentary to the target analyte, namely DNA with a BRAF mutation. When the probe nanostructures and the analyte were combined, a hybridization of the DNA strands occurred (see Figure 6). Now, in the presence of DNA ligase, both probe DNA chains could be bonded. After the hybridization and the ligase-induced bonding step, a reverse de-hybridization step was induced using a decrease in temperature. The whole two-step cycle was repeated to bridge the probe nanostructures very close to each other, since bonding of the probes result in the creation of SERS ‘hot spots’, and consequently, in an increase in the SERS signal obtained. The idea of the experiment is briefly presented in Figure 6. The method described by Yu et al. makes it possible to detect BRAF-mutation DNA in solution, from 1 to 5000 fmol, and with outstanding selectivity in a range of 1–100 fmol [45].
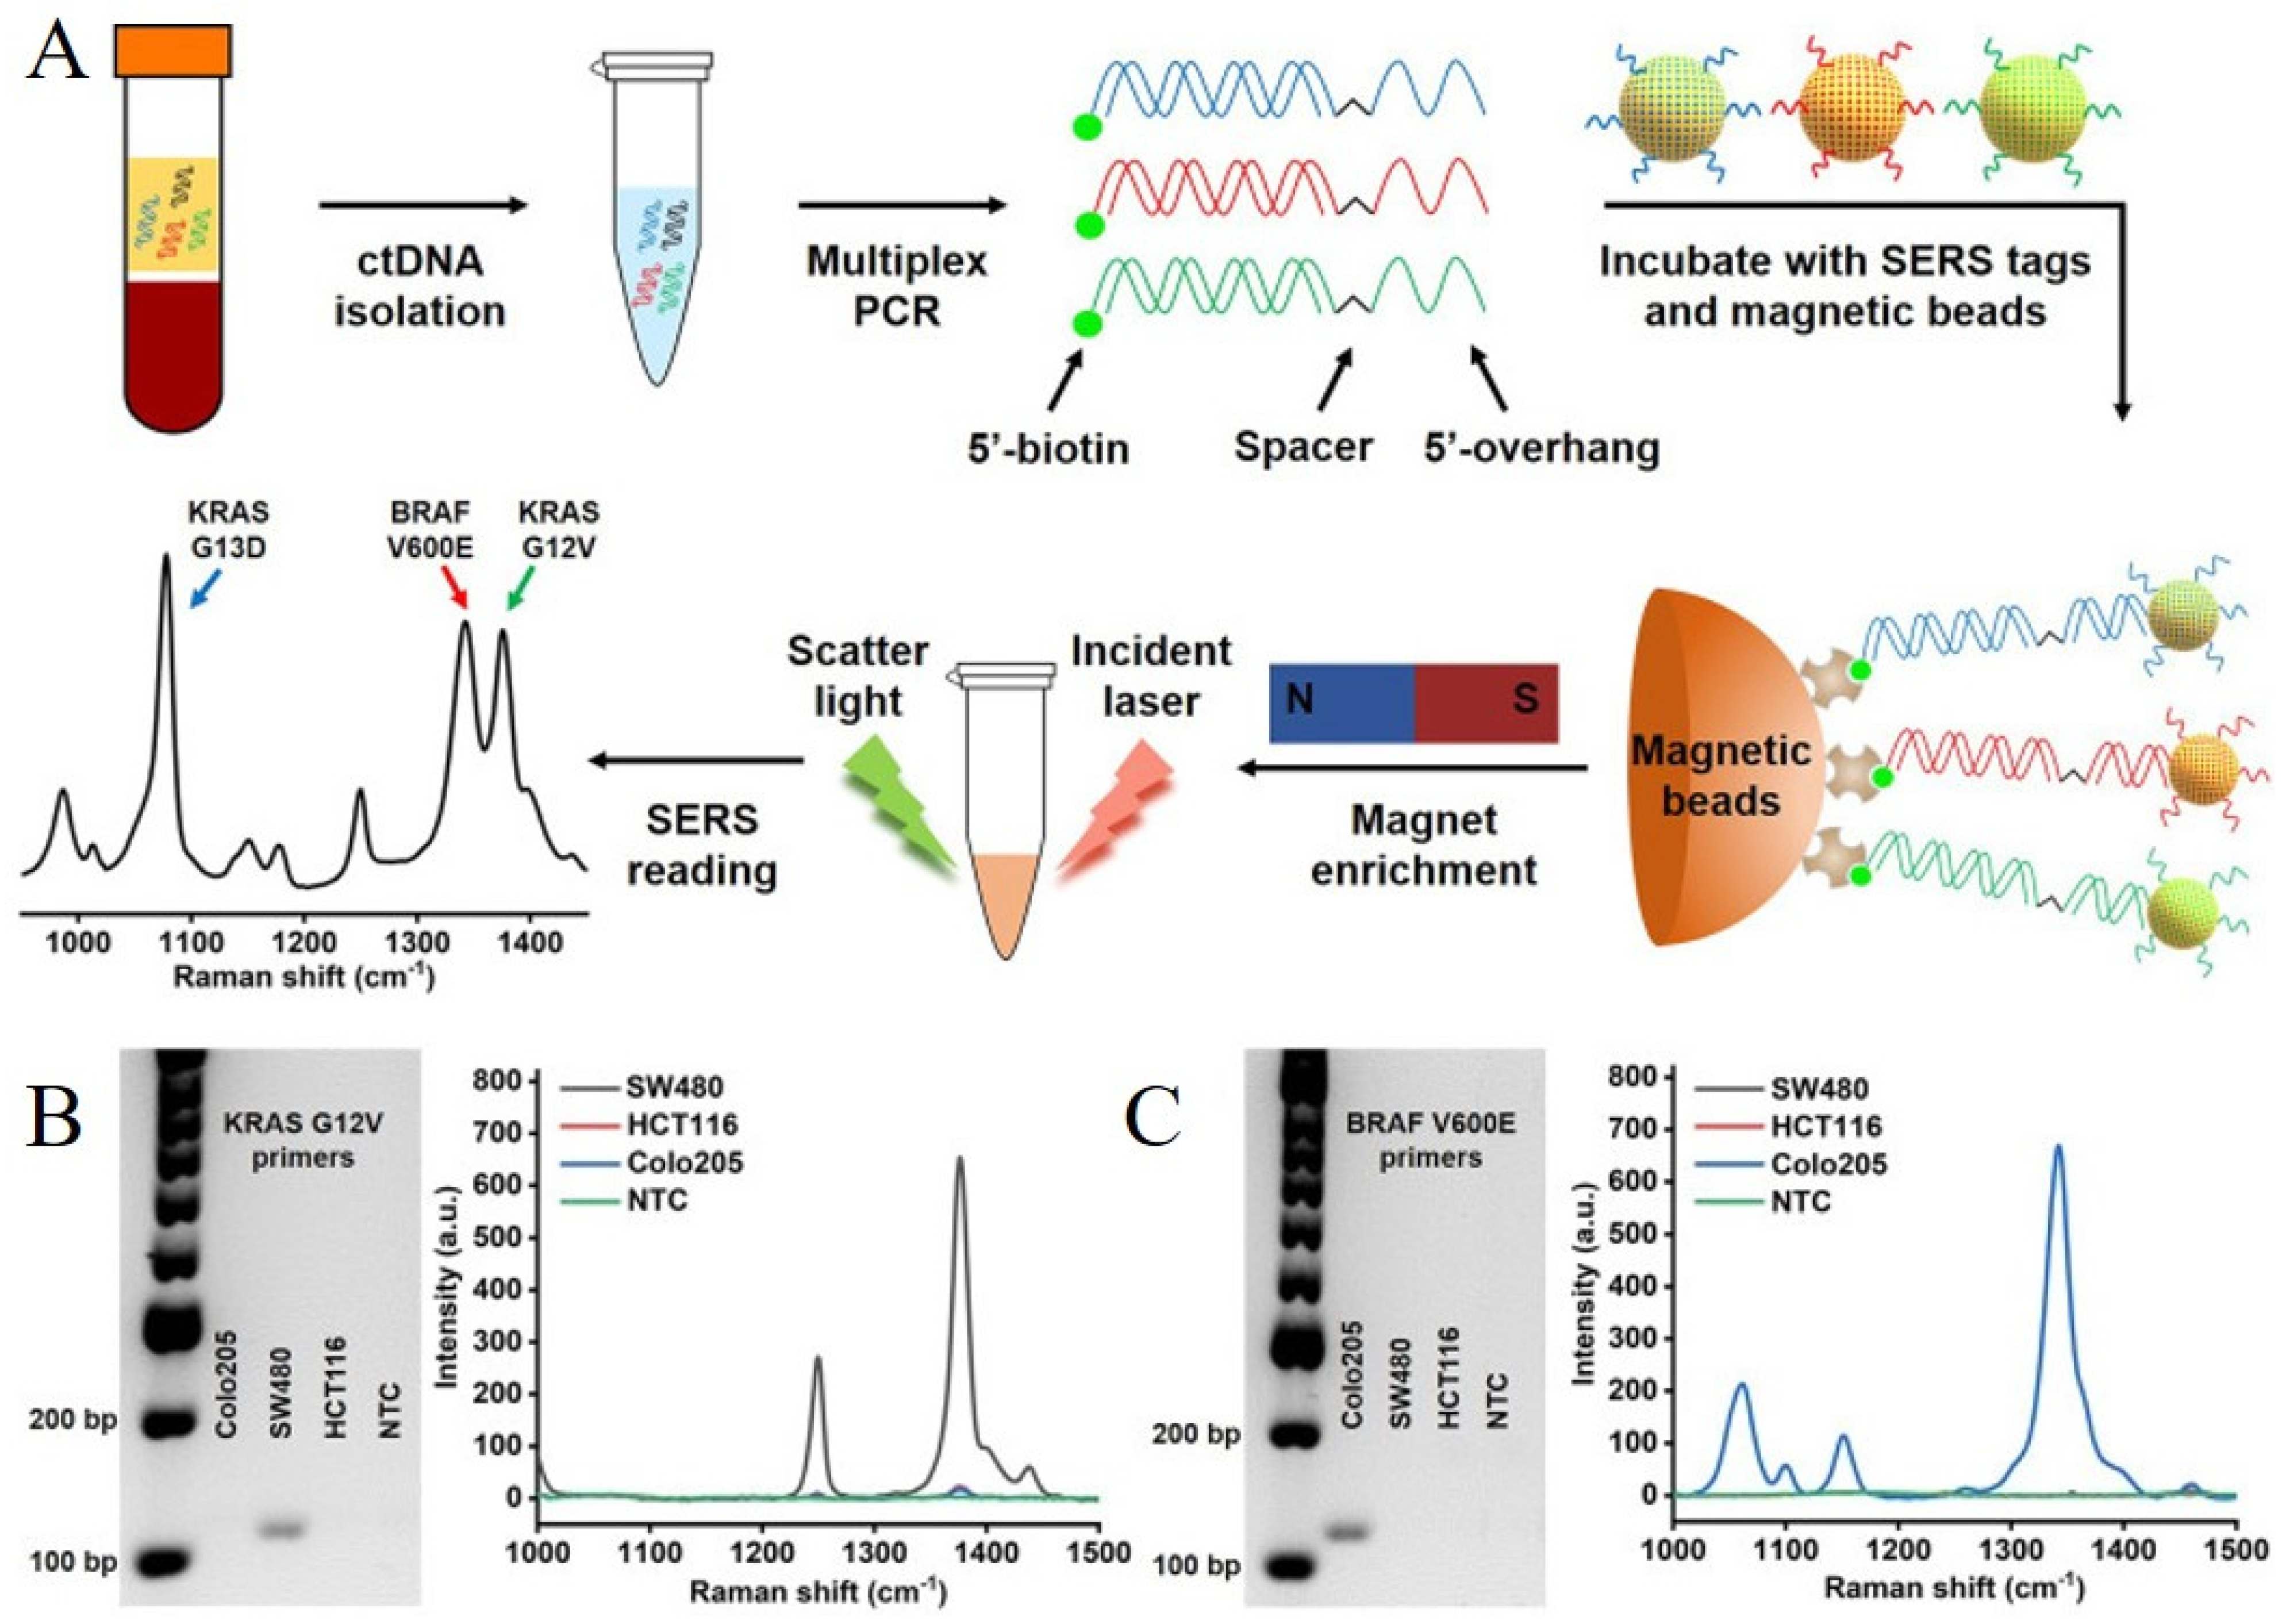
Like BRAF mutations, KRAS mutations are being studied closely by researchers because their activity is associated with cancer development [48,49]. Both BRAF and KRAS mutations were detected, for example, by Lyu et al., who developed a PCR/SERS method for the one-tube, simultaneous detection of three types of BRAF and KRAS mutations, namely KRAS G12V (c.35G > T), KRAS G13D (c.38G > A) and BRAF V600E (c.1799T > A) in circulating cell-free tumour DNA for the diagnosis of colorectal cancer [50]. Since every analytical technique has its limits and drawbacks, coupling SERS and PCR seems to be a more beneficial way of detecting DNA. The PCR amplification of an analyte increases SERS selectivity and reliability, and fewer PCR cycles are needed than in standard measurements because the detection levels are lower in the SERS method than in PCR [51]. This method that couples SERS and PCR developed by Lyu et al. is reported to detect as low as 0.1% mutant alleles from a sample abundant in wild-type circulating free DNA [50]. The proposed analytical procedure consists of: (i) isolating a DNA sample and amplifying it with PCR; (ii) mixing the amplicons with a probe consisting of gold nanoparticles modified with DNA oligonucleotides complementary to the amplicons, and Raman reporters (2,3,5,6-tetrafluoro-4-mercaptobenzoic acid for KRAS G12V, 4-mercaptobenzoic acid for KRAS G13D and 5,5′-dithiobis-(2-nitrobenzoic acid) for BRAF V600E); (iii) attaching biotin to the amplicons—its high affinity to streptavidin on magnetic beads is used for purification with magnetic force; (iv) accumulating a SERS spectrum. A diagram of the working principle of this method is shown in Figure 7A; SERS spectra compared with electrophoresis results are shown in Figure 7B,C.
The place and level of methylation of DNA are believed to be related to the presence of specific cancerous cells [52,53]. Currently, the techniques used to analyse the methylation of DNA include chromatography, mass spectrometry, enzyme-linked immunosorbent assay (ELISA) tests, and bisulfide sequencing [54]. High purity, high concentration, and tagging are essential for reliable analyses using these methods. Traditional methods to sense molecular changes in genomic DNA include, but are not limited to, pyrosequencing and mass spectrometry. These methods involve extensive chemical modification of DNA, which alters the native structure of DNA, thereby rendering the results unreliable [55]. An interesting approach for assessing the methylation level of DNA in lymph node tissue associated with different types of lymphadenopathy, and thereby various diseases (B-cell lymphomas, T-cell lymphomas, lymph node metastasis of melanoma, and reactive lymph nodes present in benign disorders), is SERS spectroscopy [56]. Preliminary results of such SERS experiments have shown an overall accuracy in distinguishing these diseases of 94.7%. A similar aim was intended in publication [55], as comprehensive information on DNA’s base and methylation was collected from concentrations as low as femtograms per μL. In that work, genomic DNA from the following cells was investigated: fibroblasts, breast cancer, pancreatic cancer, and lung cancer. It is worth mentioning that satisfactory compliance was achieved between the SERS and colorimetric methods for assessing DNA methylation levels.
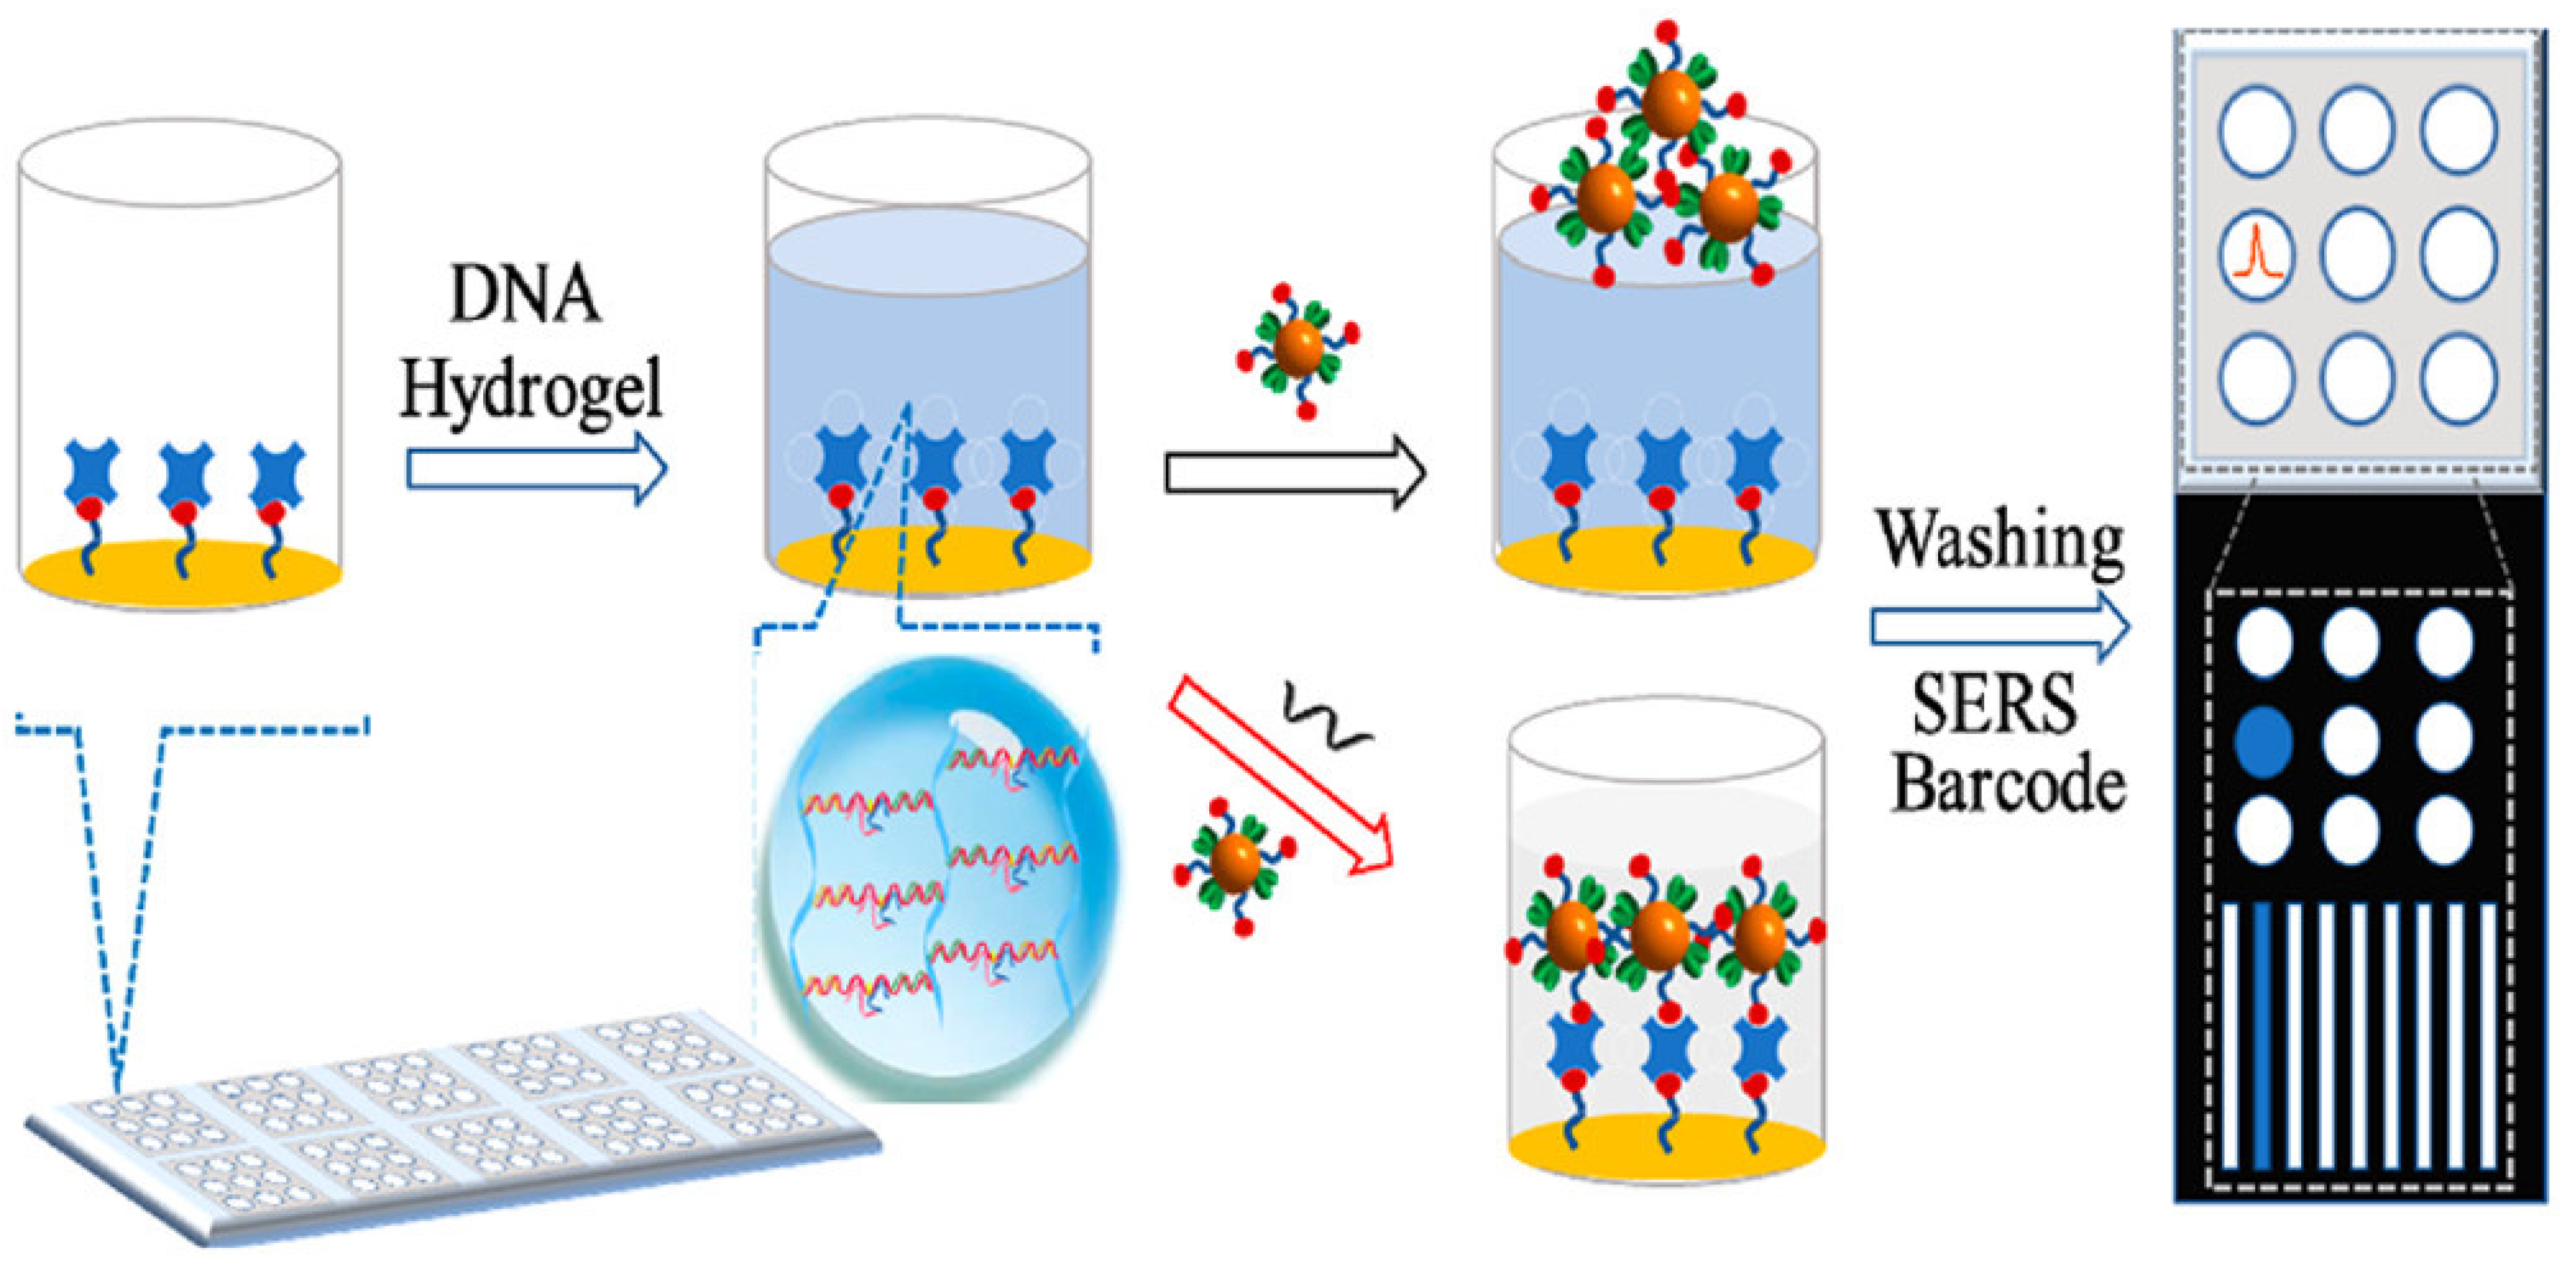
Like DNA, RNA is an important biomolecule. RNA that consists of 19–25 nucleotides is called microRNA (miRNA) [57]. Several techniques for detecting it have been developed and studied, such as colorimetry, fluorescence, electrochemistry, mass spectrometry, and SERS [58,59]. miRNA is under close examination due to its abnormal activity regarding cancer development in terms of stage and type [57,60]. A sensor array for SERS microRNA detection was developed, for example, by Si et al. [61]. Each of nine ‘detection sites’ was coated with a hydrogel containing DNA with an MNA enzyme, and each DNA composition was specific to a particular microRNA, so only in the presence of a target microRNA is the analyte captured and is there an accompanying change in the SERS signal generated (generated by biotin/4-mercaptobenzonitrile-functionalized AuAg alloy nanoparticles)—for details, see Figure 8. This sensor developed by Si et al. allowed for the sensitive recognition and quantification of nine types of microRNA in a range of 4–1200 nM [61]. The detection limit was assessed as 0.11 nM [61]. The tool’s uniformity and reproducibility were also successfully demonstrated.
The SERS-based method of intracellular miRNA detection was developed by Lee et al. as an alternative to the fluorescence resonance energy transfer (FRET) DNA/RNA detection technique [62]. The developed SERS probe used in that study included gold nanoparticles, 4-mercaptobenzoic acid as a Raman reporter, and two types of single-stranded DNA complementary to the target miRNA (miR-200c). The hybridization of the two types of single-stranded DNA and miRNA created a junction of plasmonic nanoparticles (known as a SERS hotspot) and, consequently, ideal conditions for enhancing the SERS signal, whose intensity was correlated to the quantity of miR-200c on an attomolar scale.
Another example of the SERS sensing of miRNA was performed by Jiang et al. [63]. Briefly, the probe consisted of gold nanoparticles, 5,5′-dithiobis-(2-nitrobenzoic acid) as a Raman reporter, and one of two types of locked nucleic acid complementary to the target analyte, miRNA-10b. Firstly, the probes were introduced into cells, where hybridization with the target occurred. Subsequently, Fe3O4@TiO2 nanostructures were added, as they bond to the phosphate moiety of nucleic acids. The whole structure was placed in a magnetic field resulting in a concentration of nanoparticles (due to the magnetic properties of Fe3O4) and, consequently, a significant enhancement in the SERS signal. The method made it possible for the recognition of the target to achieve a single-base accuracy in a range of 0.33 fM–1.65 pM, with a value of 0.21 fM as the detection limit in both in vitro and in situ tests in the laboratory, as well as on biological samples [63].
SERS spectroscopy can also be used to identify viral RNA, and hence the presence of viruses [64]. For example, Nasir et al. carried out a SERS-based analysis of hepatitis C virus (HCV) in blood [65]. Prior to recording the SERS spectra, the samples underwent RNA extraction, amplification with RT-PCR, and adsorption on silver nanoparticles. The results obtained showed a clear distinction between the healthy and HCV-positive samples. However, there was no striking difference between the stages of HCV infection (low, medium, high). Additionally, it was observed that the signal intensities of specific Raman bands depended on the viral load values. Another example of viral RNA detection using the SERS method is found in the work of Dardir et al. [66], where the RNA of influenza A virus was recognized with the help of gold nanostars modified with thiolated DNA and a fluorescent Raman reporter [66]. A more detailed description of SERS-based detection of viruses can be found in Section 4.4.
4.2. Drugs Monitoring
Label-free SERS analyses have often been applied in drug examinations, especially in therapeutic drug monitoring (TDM). TDM involves assessing the concentration of a drug in a biological matrix (usually in plasma or serum) at a specific time, in relation to the notification and interpretation of that concentration in terms of appropriate clinical parameters (target range, drug pharmacokinetics) [67]. In drug monitoring, the most straightforward approach is to investigate the recorded SERS spectra of body fluids (urine, blood, blood plasma) that contain the drug of interest, and to determine the intensity of the bands assigned to that drug [68]. Due to the complexity of the sample, this procedure requires some luck. One of the main problems with this method is the interference caused by the components of body fluids.
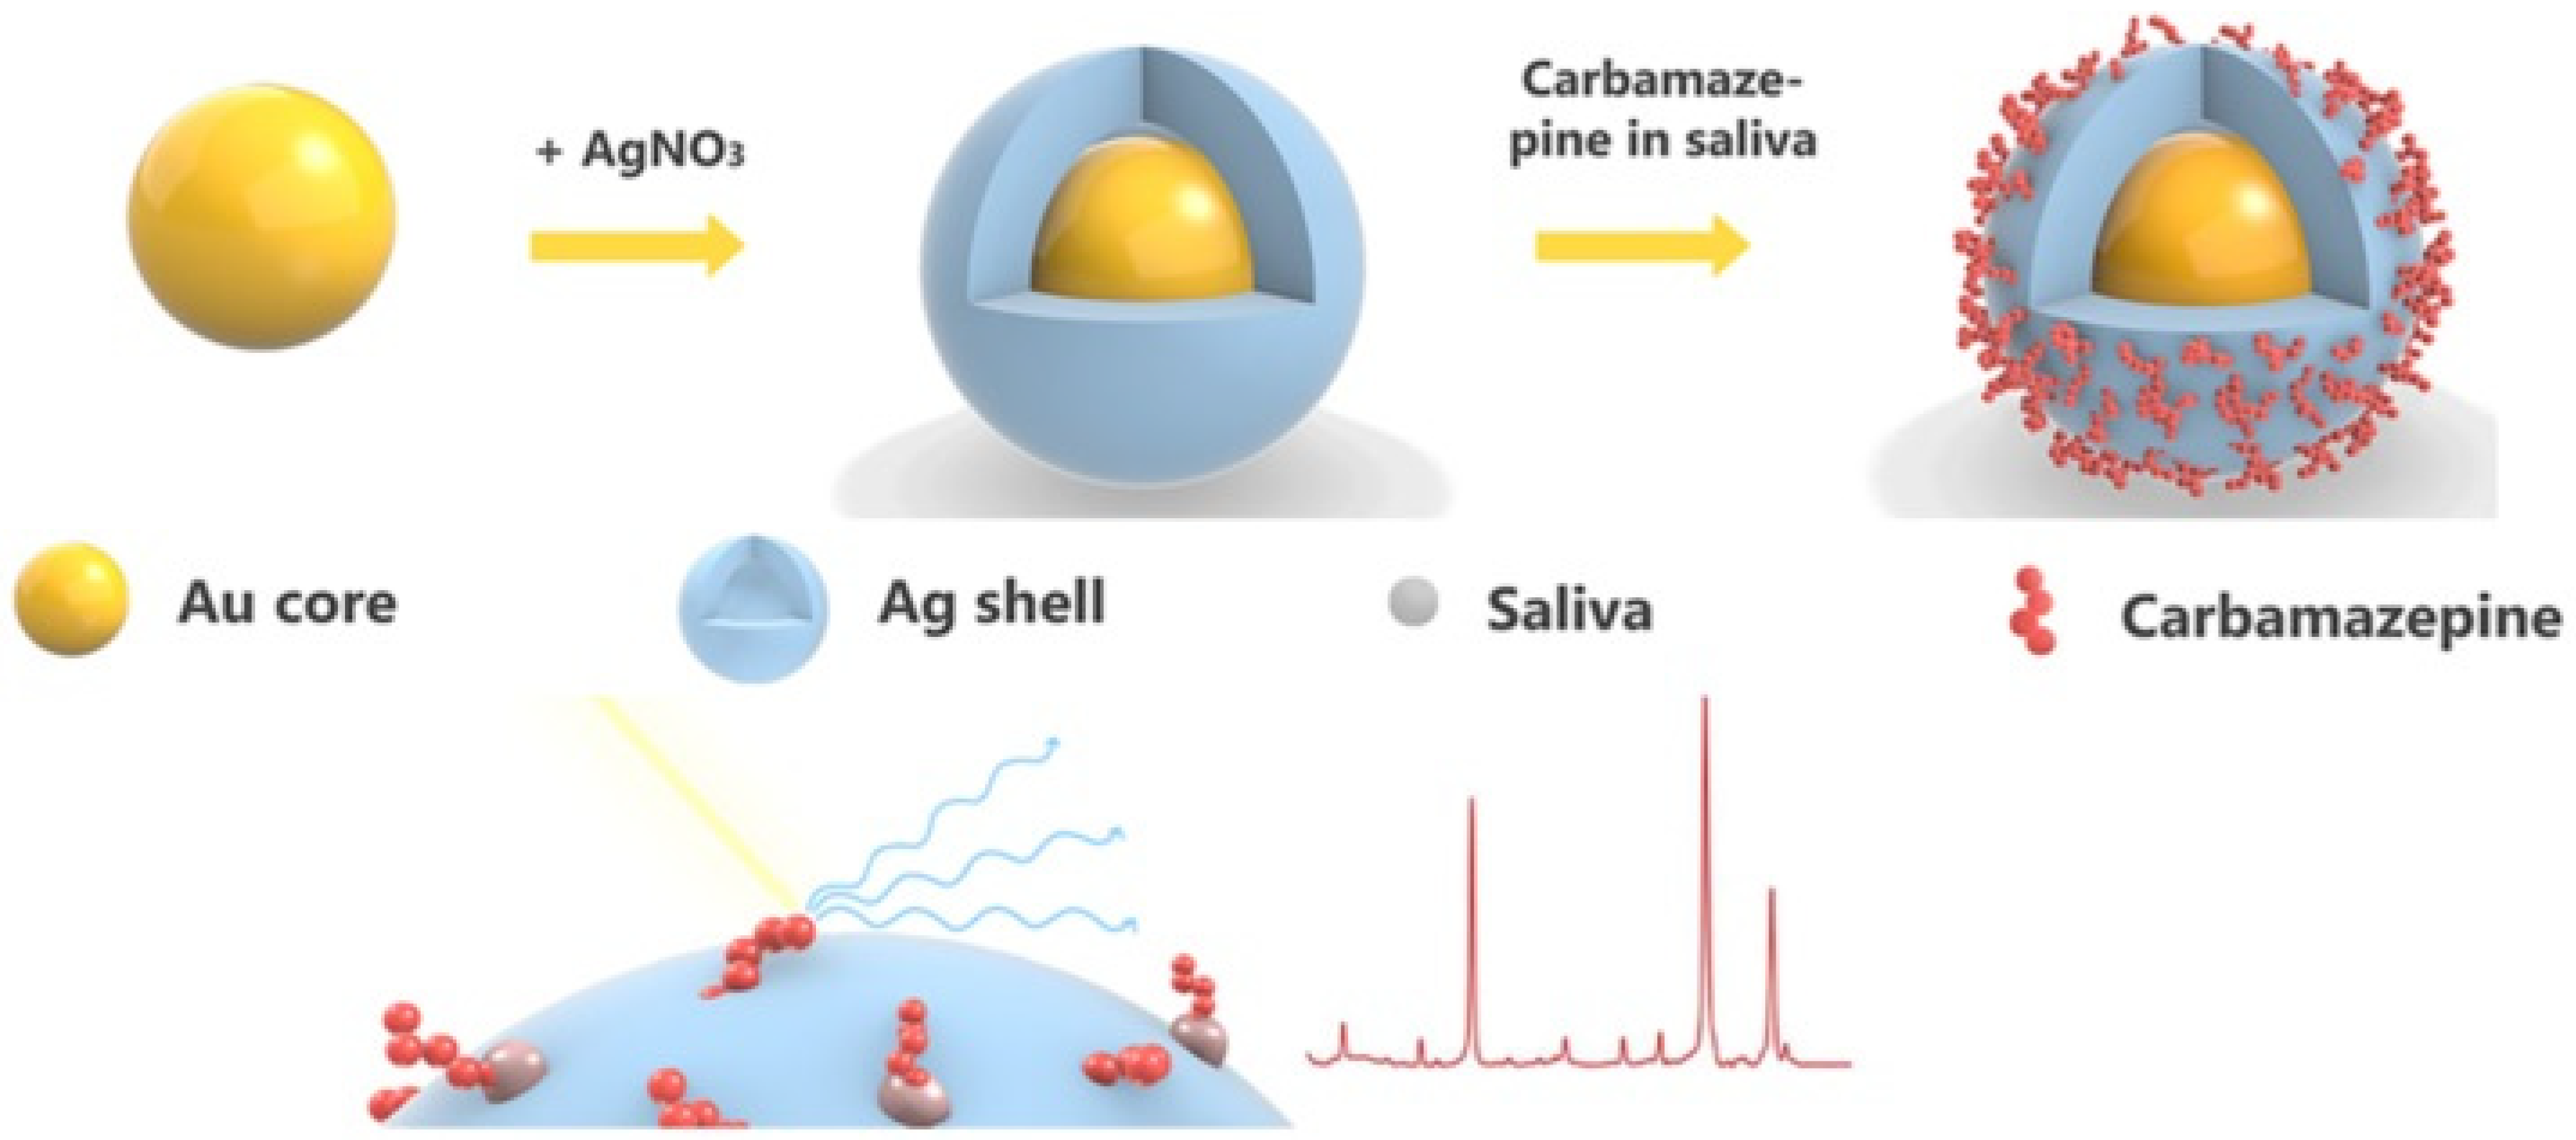
In the case of drugs that require long-term use or are effective only in a narrow concentration range, the first crucial improvement achieved was the development of an approach that departed from the invasive procedure of blood collection in favour of performing tests using the patient’s urine or saliva [69]. An important example here is the monitoring of the concentration of carbamazepine (CBZ), a commonly used anti-epilepsy drug. The idea was to monitor the concentration of this drug in saliva using a gold-silver core-shell nanomaterial. Cheng et al. showed that it is possible to monitor this drug in a concentration range of from 3.26 × 10⁻⁹ M for CBZ in saliva [69] (see Figure 9).
Barveen, Wang, and Chang proposed a different non-invasive approach to drug detection, that of detecting chlorpromazine (CPZ) in human saliva or urine [70]. This method used gold nanoparticles on TiC as the SERS substrate. The lower limit of detection of CPZ was a concentration of 3.92 × 10⁻¹¹ M. The authors also checked the influence of interfering substances (including uric acid, dopamine, or sodium and magnesium ions) on the detectability of CPZ. This showed that even when the concentration of the interfering substances is ten times higher than that of the CPZ, the measured SERS signal of the CPZ is not affected. Moreover, the nanoparticles used by the authors in their protocol were stable at room temperature for up to 15 days.
Various types of chemotherapeutic agents are used in the treatment of cancer, including chemotherapy [71]. The major obstacle in the use of chemotherapy is the numerous side effects it entails. In addition, a related significant problem is adjusting the appropriate dose or set of medicines, which are determined on the basis of the patient’s body weight [72]. However, TDM has not yet gained popularity in oncology due to a lack of studies that establish the optimal patient exposure ranges for many drugs [72]. Essential here is the lack of available studies determining drug concentrations in human plasma. Nevertheless, methotrexate (MTX) is an example of a promising anticancer medicine. A clinical trial on MTX with TDM resulted in a significant reduction in patient mortality [73].
Markina et al. developed a method to detect the anticancer drug MTX [74]. Their tests were performed on human urine samples that had been artificially enriched. The authors proposed a solid phase extraction (SPE)-SERS protocol. SPE was used to concentrate and clean the test samples. Markina et al. used aluminium oxide loaded with silver nanoparticles as the SERS-active sorbent. The protocol they developed allows MTX to be detected in a concentration range of 20–300 μg mL−1. Significant advantages of this method are its short implementation time of 15 min, and the possibility of using portable Raman spectrometers.
Due to its substantial cytotoxic effects, doxorubicin (DOX) is commonly used to treat human malignancies [75], including neoplasms such as breast cancer, small cell lung cancer, and sarcomas [76]. However, this medicine has numerous side effects, the most dangerous being cardiotoxicity [75]. Panikar et al. proposed a detection method for this drug in human serum. The substrate they used was created as a result of the controlled sputtering of a 10-nanometer-thick gold layer on self-assembled silica nanoparticles (SiNP) created on glass. Moreover, the SiNPs@Au had been modified with a self-assembled monolayer (SAM) of zwitterionic L-cysteine. The use of such a SERS sensor made it possible to detect DOX in undiluted blood, with a detection limit of 20 nM.
Another chemotherapeutic agent with a narrow safe range of use is 6-thioguanine (6-TG) [77]. It is used to treat acute leukemia, i.e., lymphoblastic leukemia [78]. Lui et al. proposed a method to monitor this drug in human urine and serum [77]. The analytical protocol was based on a free-standing fluid membrane (FLM) and core-shell (Ag-core and Au-shell) bimetallic nanoparticles, which made it possible to quantify the drug. The authors optimized the gold-to-silver ratio in the SERS-active nanoparticles. The advantage of using bimetallic nanoparticles was that they resulted in a greater SERS enhancement factor than for the single-element silver or gold nanoparticles. The detection limit of this drug was 5 μg/kg.
Antibiotics are another group of drugs that should be monitored in certain situations. Critically ill patients are an important case, where what is most important is the early initiation of antibiotic therapy, and an appropriately selected drug dosage. TDM is used routinely with some antibiotics, i.e., vancomycin and aminoglycoside [79]. In addition, as in the previous cases, there are antibacterial drugs with a narrow range of applicability or those whose side effects can be life-threatening [80].
Markina et al. proposed a method aimed at detecting three antibiotics from the group of cephalosporin: ceftriaxone (CTR), cefazolin (CZL), and cefoperazone (CPR), in human urine [68]. The proposed protocol was based on modified copper nanoparticles. The advantages of this method are its short implementation time of 20 min, and the fact that for all three antibiotics, the lower limit of detection was lower than that required for TDM (7.5 mg/mL for CTR, 8.8 mg/mL for CZL, and 36 mg/mL for CPR; see Figure 10). However, according to the authors, the disadvantage of using copper nanoparticles is that compared with nanoparticles of gold or silver, they exhibited worse stability over time.
Markina et al. also developed a SERS method for detecting another antibiotic, sulfamethoxazole (SMX), a bacteriostatic antibiotic from the sulfonamide group [81]. As with the three previous antibiotics, their research was designed to detect this antibiotic in enriched human urine, but in this case the samples were taken from cancer patients. The SERS substrate was silver nanoparticles stabilized with hydroxylamine. The lower detection limit for SMX was 1.7 mg/mL. As in the case of the previous method, the execution time for this protocol was relatively short.
Moxifloxacin is an example of a bactericidal drug, one of whose side effects may be extensive damage to the liver [78]. The SERS detection of moxifloxacin and four other antibiotics (ciprofloxacin, meropenem, piperacillin, and amoxicillin) in human serum was proposed by Wang et al. [80]. The SERS substrate used in this method was based on silver plasmonic nanostructures. The detection limit for moxifloxacin was 0.05 μg/mL.
4.3. Detection of Bacteria
The SERS technique has been widely developed for detecting bacteria as well. In the label-free approach, advanced chemometric methods are included. For example, Dina et al. characterized three bacteria species (S. aureus, E. faecalis and P. aeruginosa) at the single-cell level by means of SERS and advanced chemometric methods (fuzzy c-means, fuzzy linear discriminant analysis, and principal component analysis) [82]. The SERS detection was performed using a silver plasmonic nanostructure in a microfluidic device built in-house connected to an automated syringe pump and a portable Raman spectrometer. Ding et al., in turn, used a multi-scale convolutional neural network to analyse Salmonella on gold nanoparticles [83]. This model, proposed in order to achieve a multi-dimensional extraction of SERS spectral features, reached recognition accuracy of more than 97%.
Combining SERS with electrophoresis can often increase the speed of diagnosis. Nowicka et al. combined a SERS platform with the negative dielectrophoretic phenomenon for the quick isolation, concentration, and label-free identification of E. coli [84]. Their platform, made from poly (ethylene terephthalate), contained layers of indium tin oxide and silver, and provided high stability and reproducibility of the SERS signal, and a large SERS enhancement factor. Bacteria were identified in urine and apple juice in 5 min. This approach is universal and may be carried out using handheld point-of-care devices.
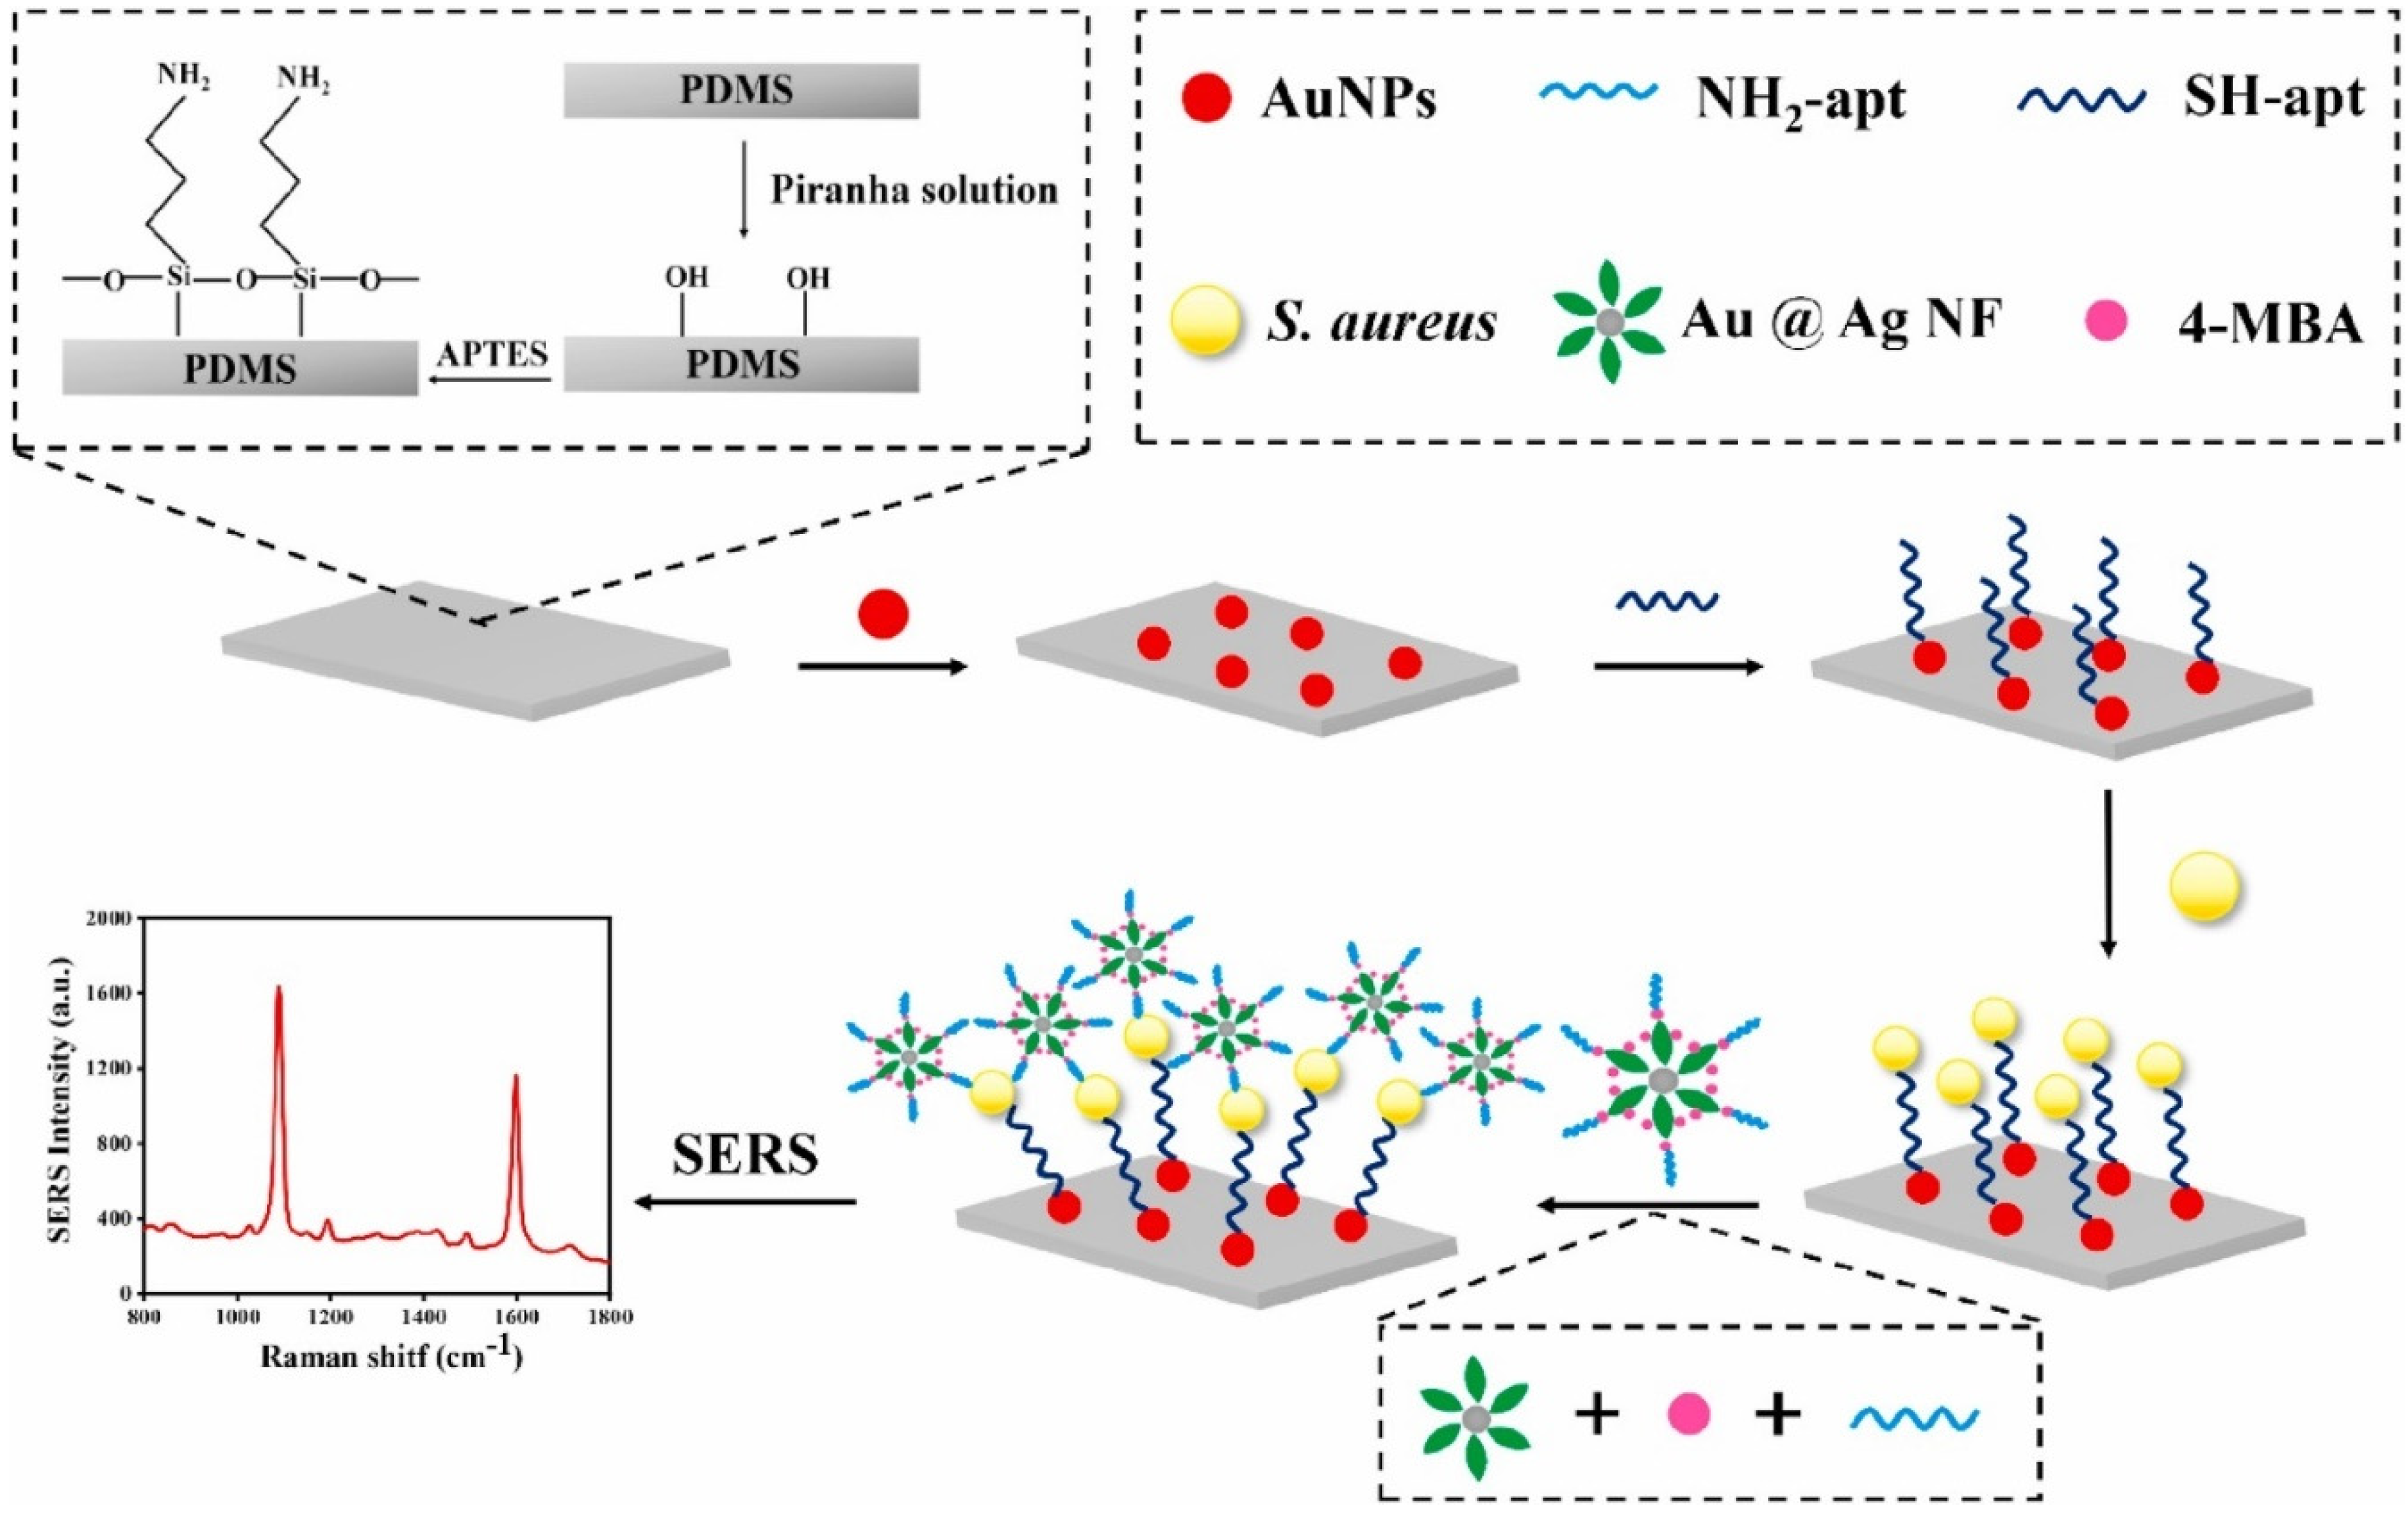
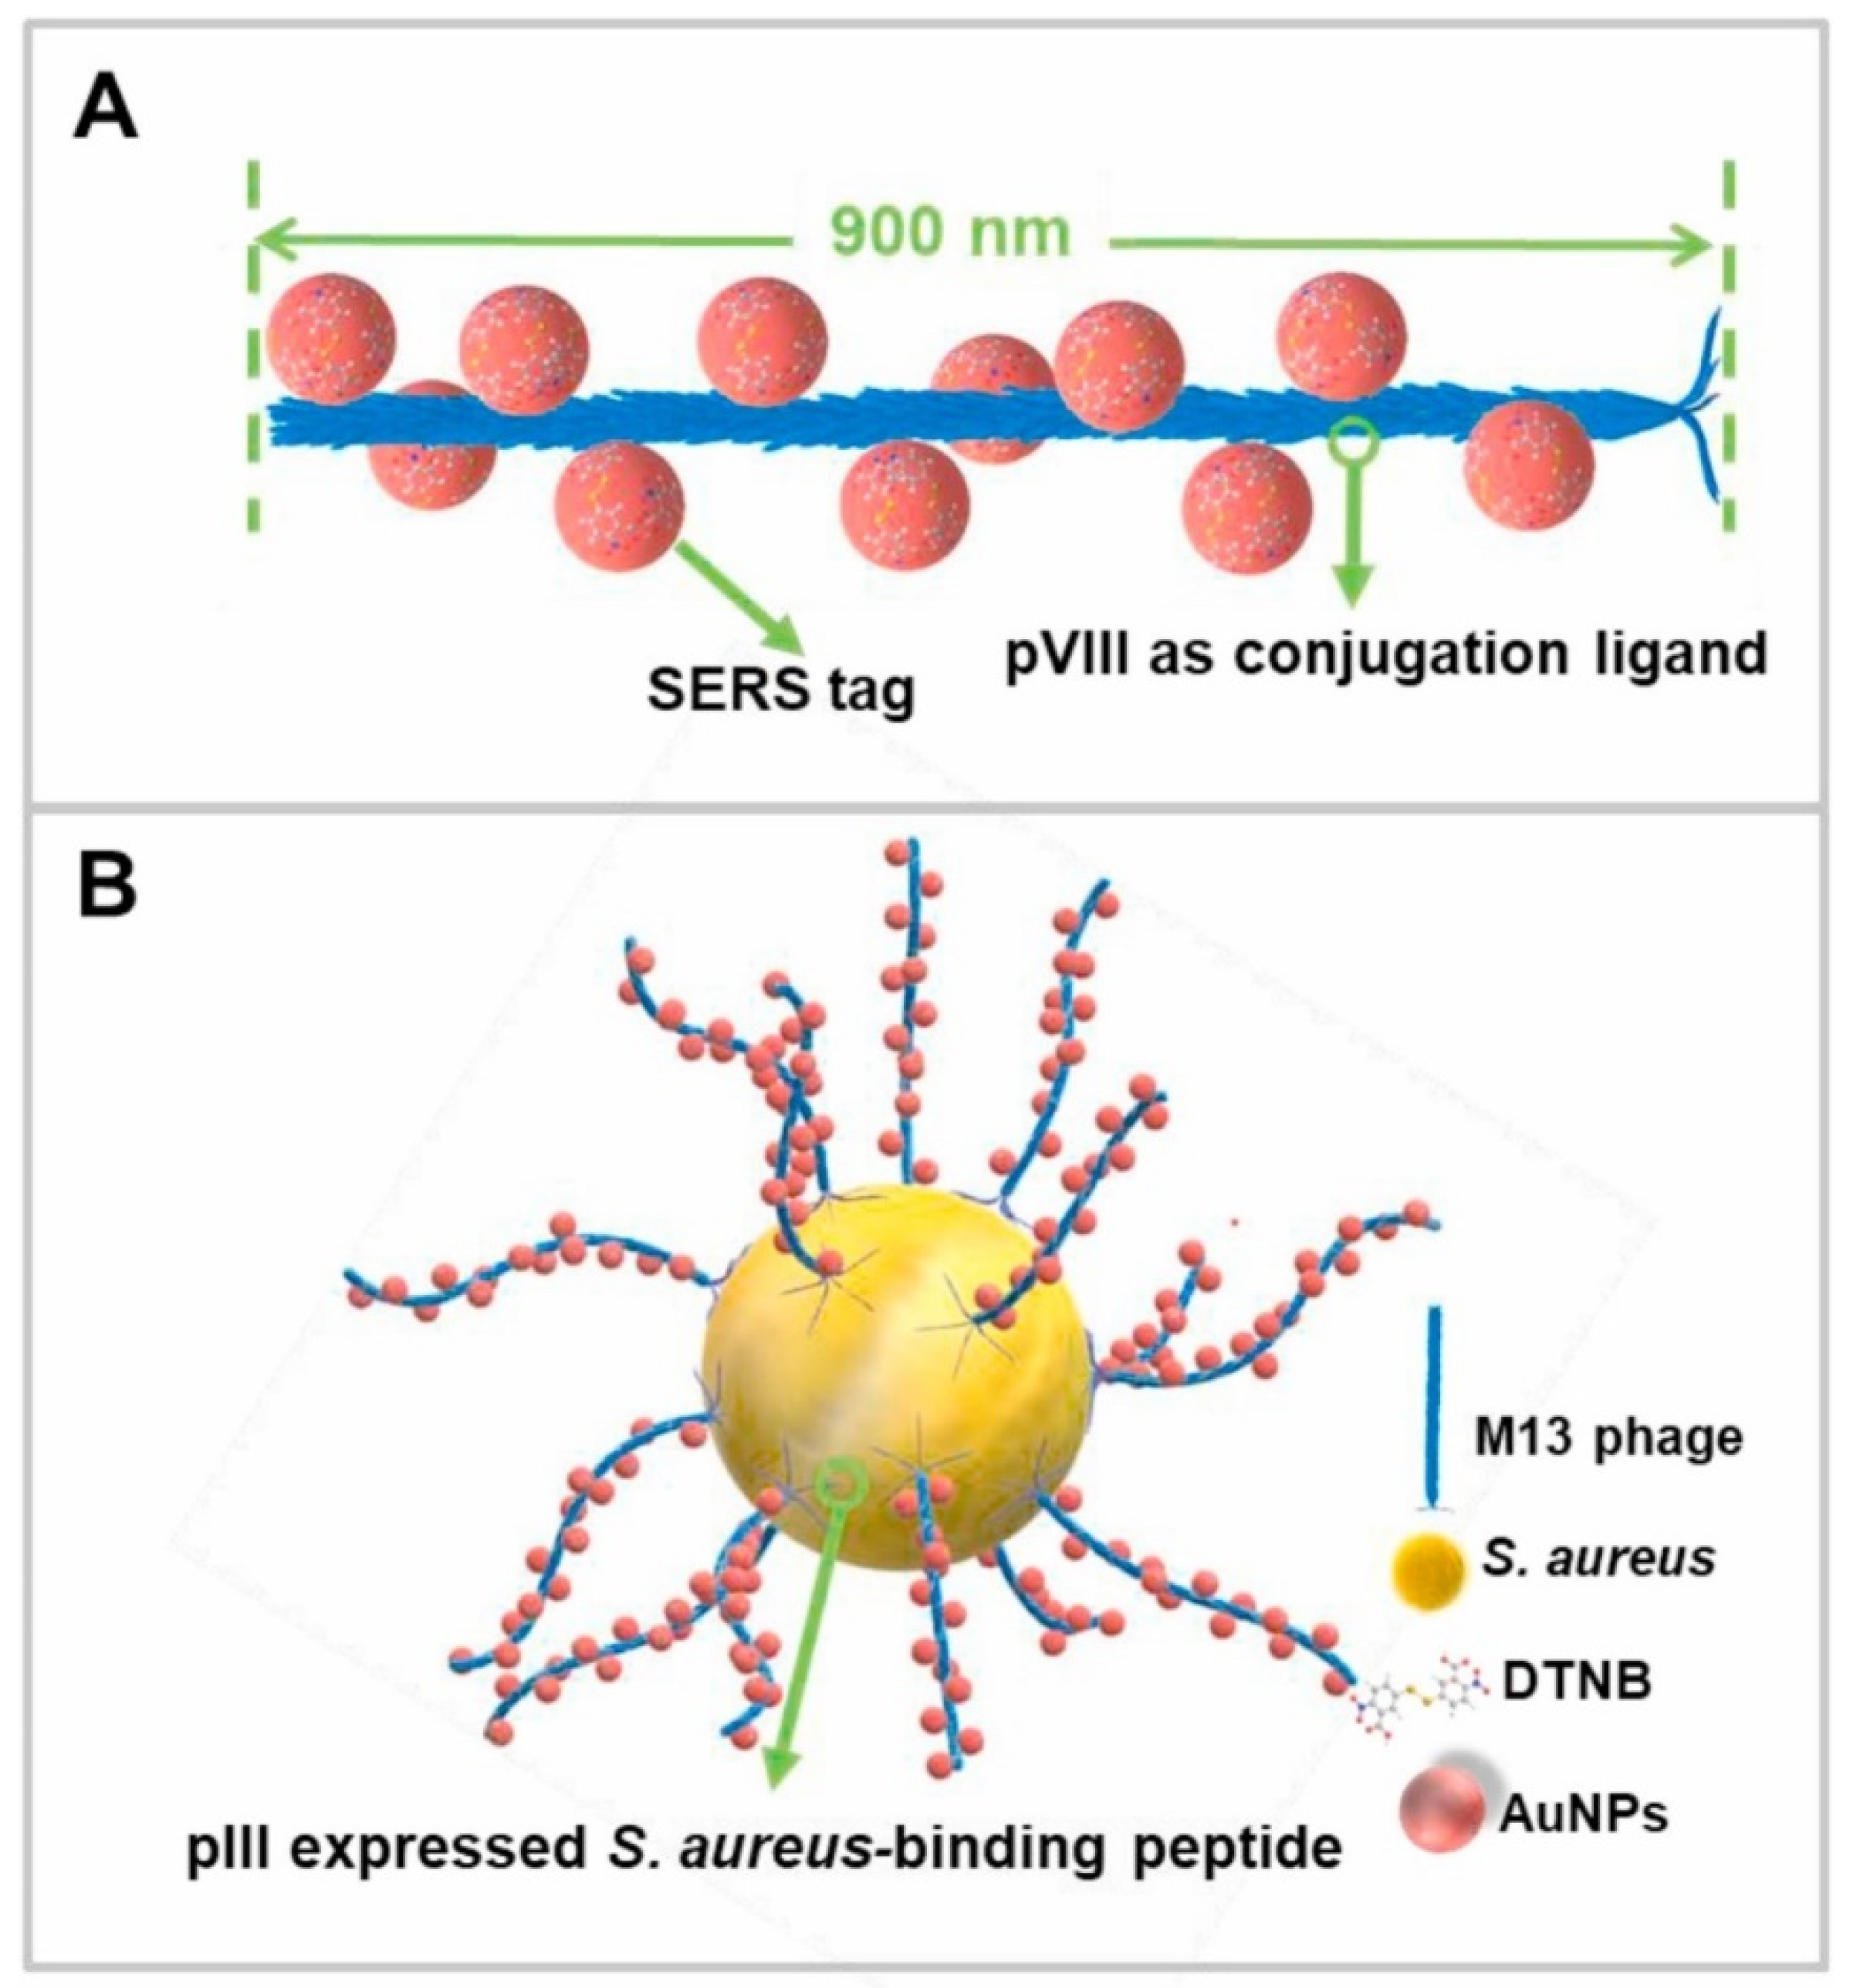
A common procedure for detecting bacteria is to fabricate aptamer-based nanosensors with the use of specific DNA-targeting bacteria. For example, Jin et al. detected Salmonella among five other bacteria (E. coli DH5a, S. Typhimurium, S. aureus, B. subtilis, and P. aeruginosa) with an aptamer-based nanosensor in a spiked sample of Wenxin granule, a botanical drug, at a level of 52 CFU/mL [85]. In another study, a biosensor composed of gold nanoparticles with an aptamer-functionalized polydimethylsiloxane film as a capture probe and gold-silver core-shell nanoflowers modified with mercaptobenzoic acid, and aptamers were used as a signal probe [86]. In the presence of the target bacteria, Staphylococcus aureus, a combination of these three components was achieved, with a detection limit of 13 CFU/mL (see Figure 11). Some other versions of DNA sensors have been also successfully applied for the detection of bacteria, e.g., a DNA-walker on the surface of gold-modified magnetic nanoparticles for the detection of Salmonella typhimurium at a level of 4 CFU/mL [87]; aptameric DNA sequences, covalently conjugated to 4-aminothiophenol-gold nanoparticle complexes enabled detection of E. coli at level of 10 CFU/mL in pure culture and 100 CFU/mL in ground beef samples [88]; vectors such as M13 (the vector most commonly used to construct peptide libraries), which binds to bacteria and induces an anchoring of gold nanoparticles on its surface (see Figure 12) [89]; aptamer combined with vancomycin [90] or with an immune hybridization chain reaction, where bacteria were specifically captured by immunomagnetic beads forming hairpin probes [91].
Xie et al. detected S. aureus using nano-balloons in food samples (milk, orange juice) and biological samples (human urine and saliva at a level of ~10 cells/mL) using a proper SERS aptasensor [92]. Tian et al. described nanoparticle arrays for the simultaneous capture, identification, and differentiation of Gram-positive and Gram-negative bacteria [93]. Apart from identifying bacteria in different samples, it is possible to use SERS to differentiate between bacterial strains that are sensitive or resistant to ampicillin [94]. Gukowsy et al. tested three approaches (a conventional SERS approach of mixing a droplet of bacterial culture with gold nanoparticles, extracellular matrix analysis, and in situ mapping of bacterial cells on a filter membrane), where the last two methods proved more effective [94].
Andrei et al. developed a nanosensor for the detection of Escherichia coli in urine at a level of 10 CFU/mL [95]. Bacteria were caught on anti-fimbrial antibodies integrated with acid-terminated oligoethylene glycol molecular layers grafted onto amorphous hydrogenated silicon thin films. The SERS detection was based on the interaction between the positively-charged gold nanorods and the negatively-charged cell membrane of E. coli trapped on the surface. Additionally, with this sensor, the authors were able to differentiate three E. coli strains: E. coli JM101TR, Katushka, and AAEC185 (pUT2002).
4.4. Detection of Viruses on an Example of SARS-CoV-2
The hottest topic in viral detection of late has been the detection of a novel coronavirus (SARS-CoV-2) which started a pandemic of the respiratory disease COVID-19 in December 2019. Due to the fact that the incubation period of SARS-CoV-2 is 2–7 days (when an infected person shows non-specific symptoms), COVID-19 turned out to be extremely infectious. According to the World Health Organization, there have been over half a billion confirmed cases and over 6.2 million deaths globally since the first case. Moreover, it also significantly impacted on the global economy and social life, and put tremendous pressure on healthcare. COVID-19 symptoms such as fever, cough, fatigue or body aches are similar to other respiratory illnesses caused by other viruses or bacteria. Therefore, the urgent need for a fast and specific detection method in an early stage of the disease was a challenge for the numerous research groups.
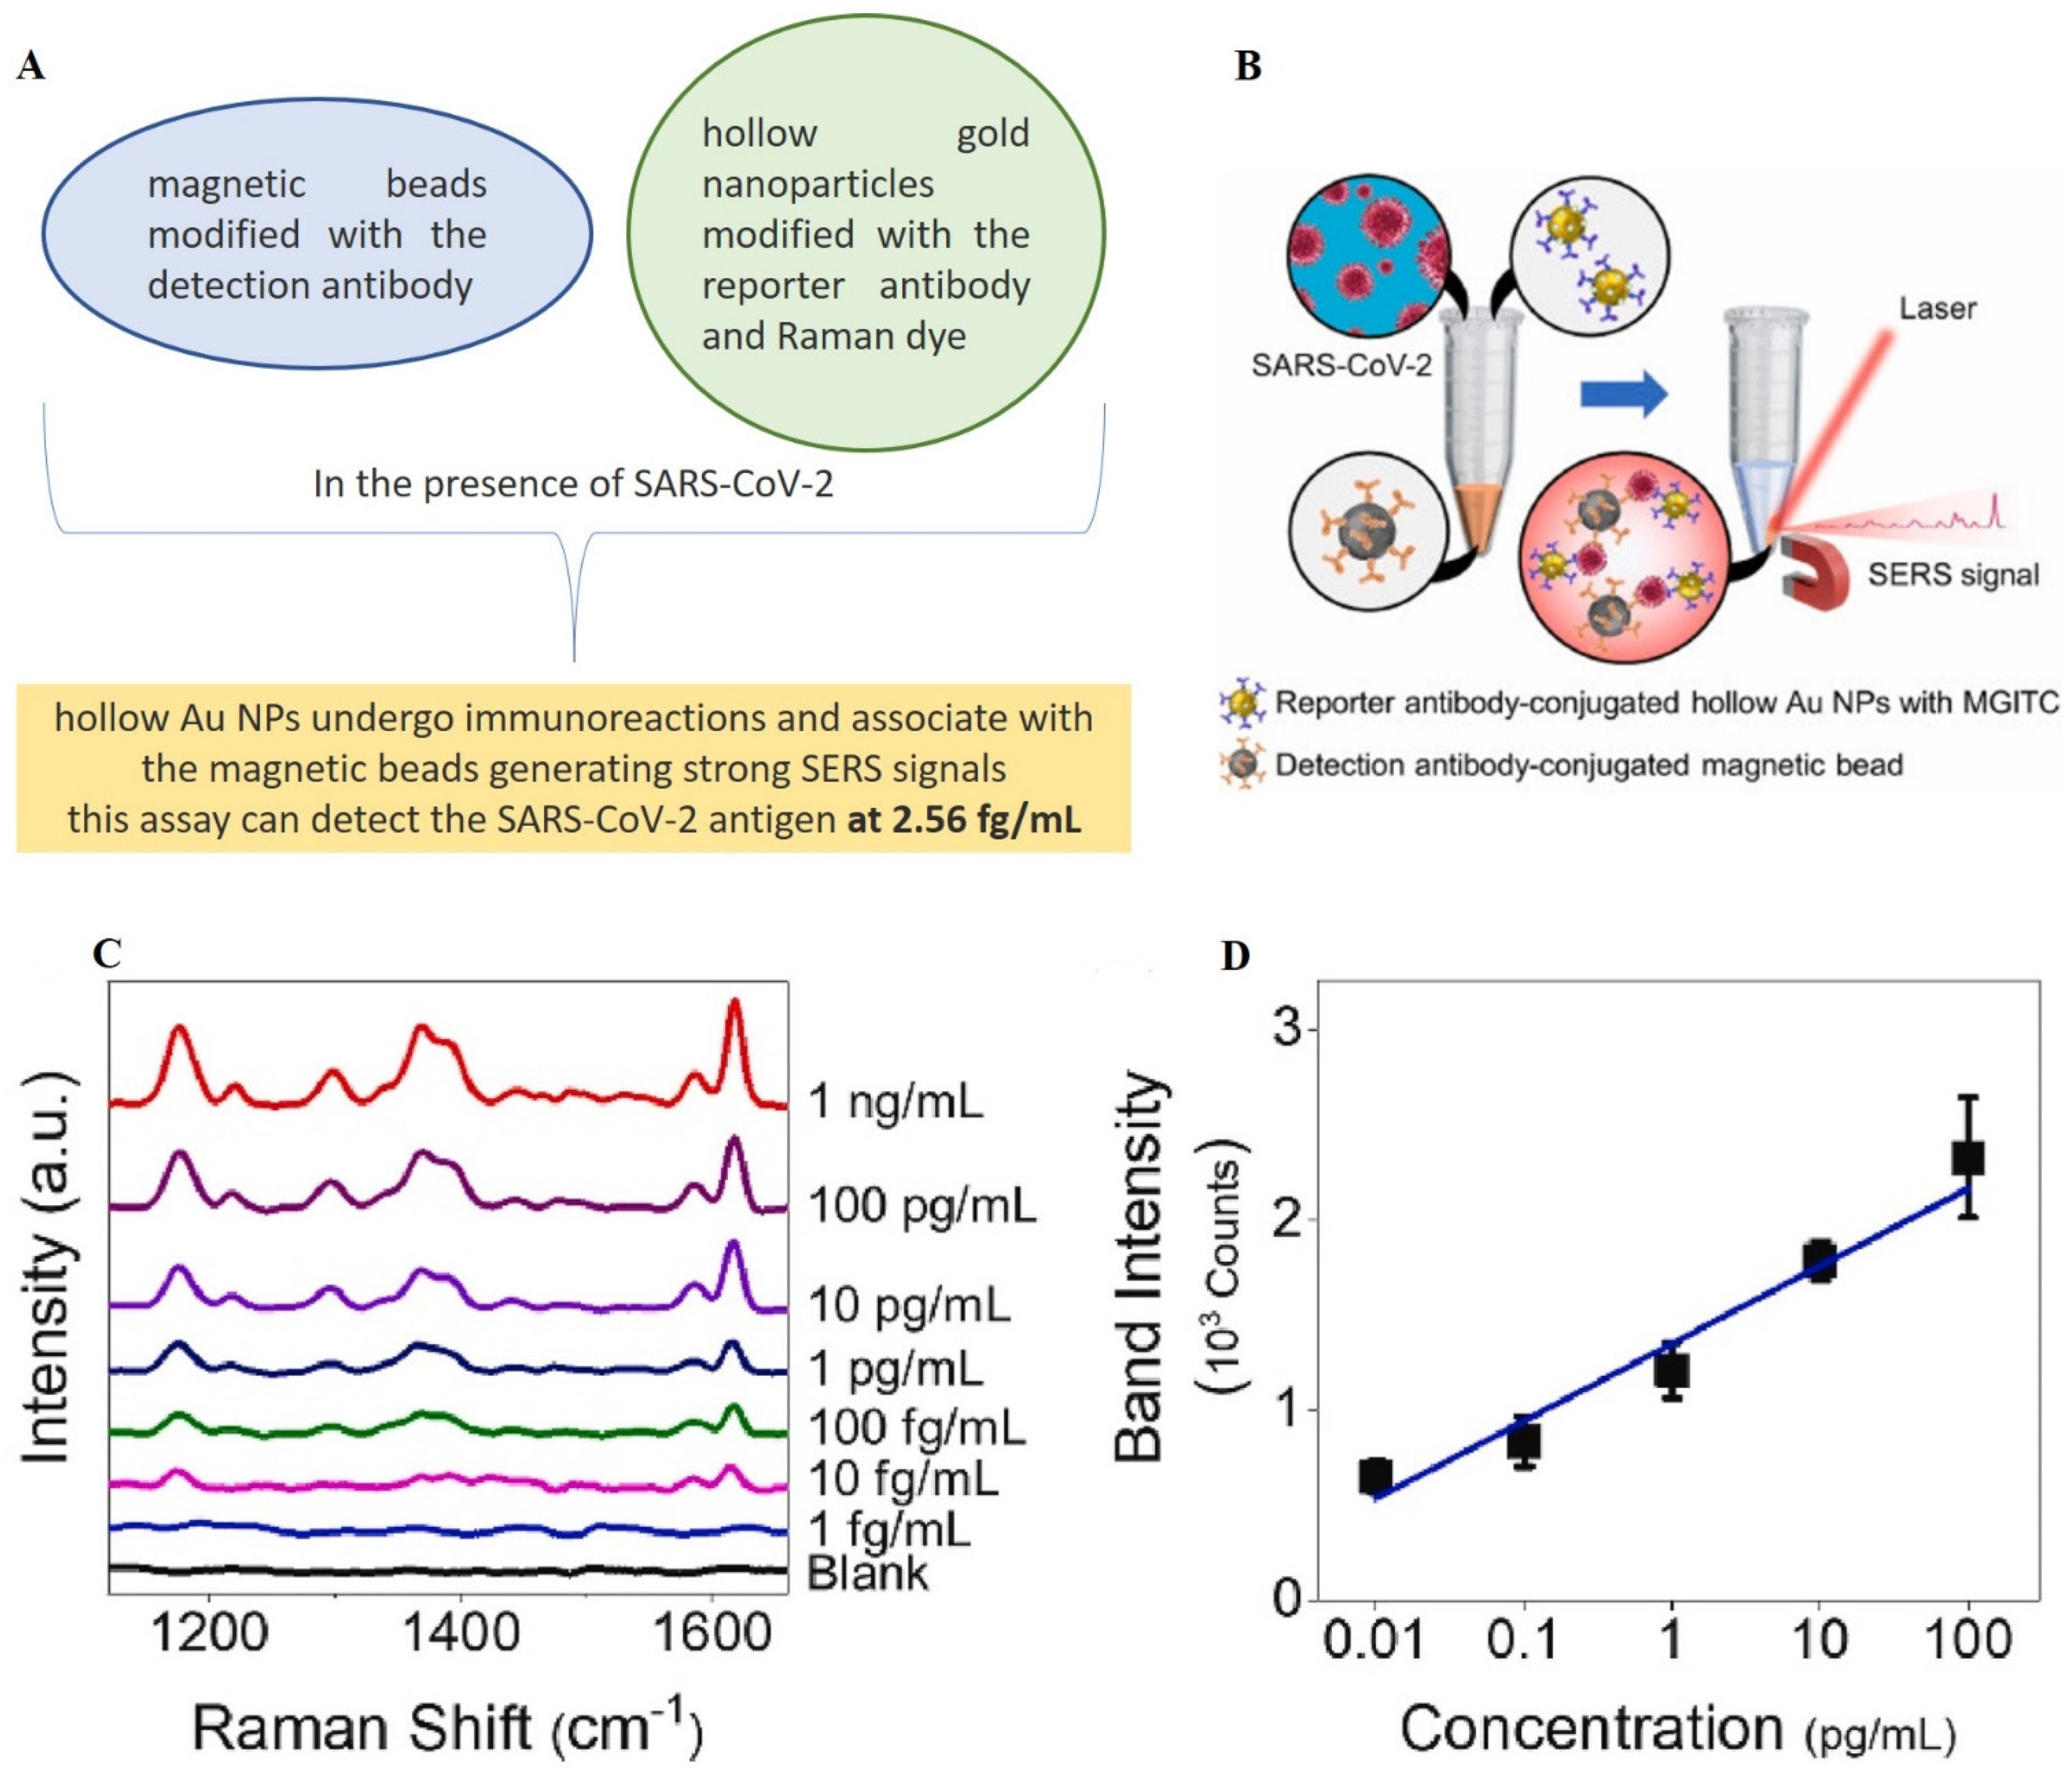
PCR tests are widely used, but faster or cheaper solutions are always welcome, especially during a pandemic. Wu et al. proposed a reduction in the number of thermocycling steps needed to amplify the DNA when combining PCR with magnetic beads-based SERS, which would shorten the diagnosis time required to successfully differentiate between healthy and infected patients [96]. Cha et al. used antibody-modified magnetic beads and hollow gold nanoparticles, which were interacting in the presence of SARS-CoV-2, thus enabling the detection at a level of 2.56 fg/mL [97]. The flow chart and scheme of this experiment are shown in Figure 13. Malachite green was used as the Raman reporter molecule for labelling hollow gold nanoparticles.
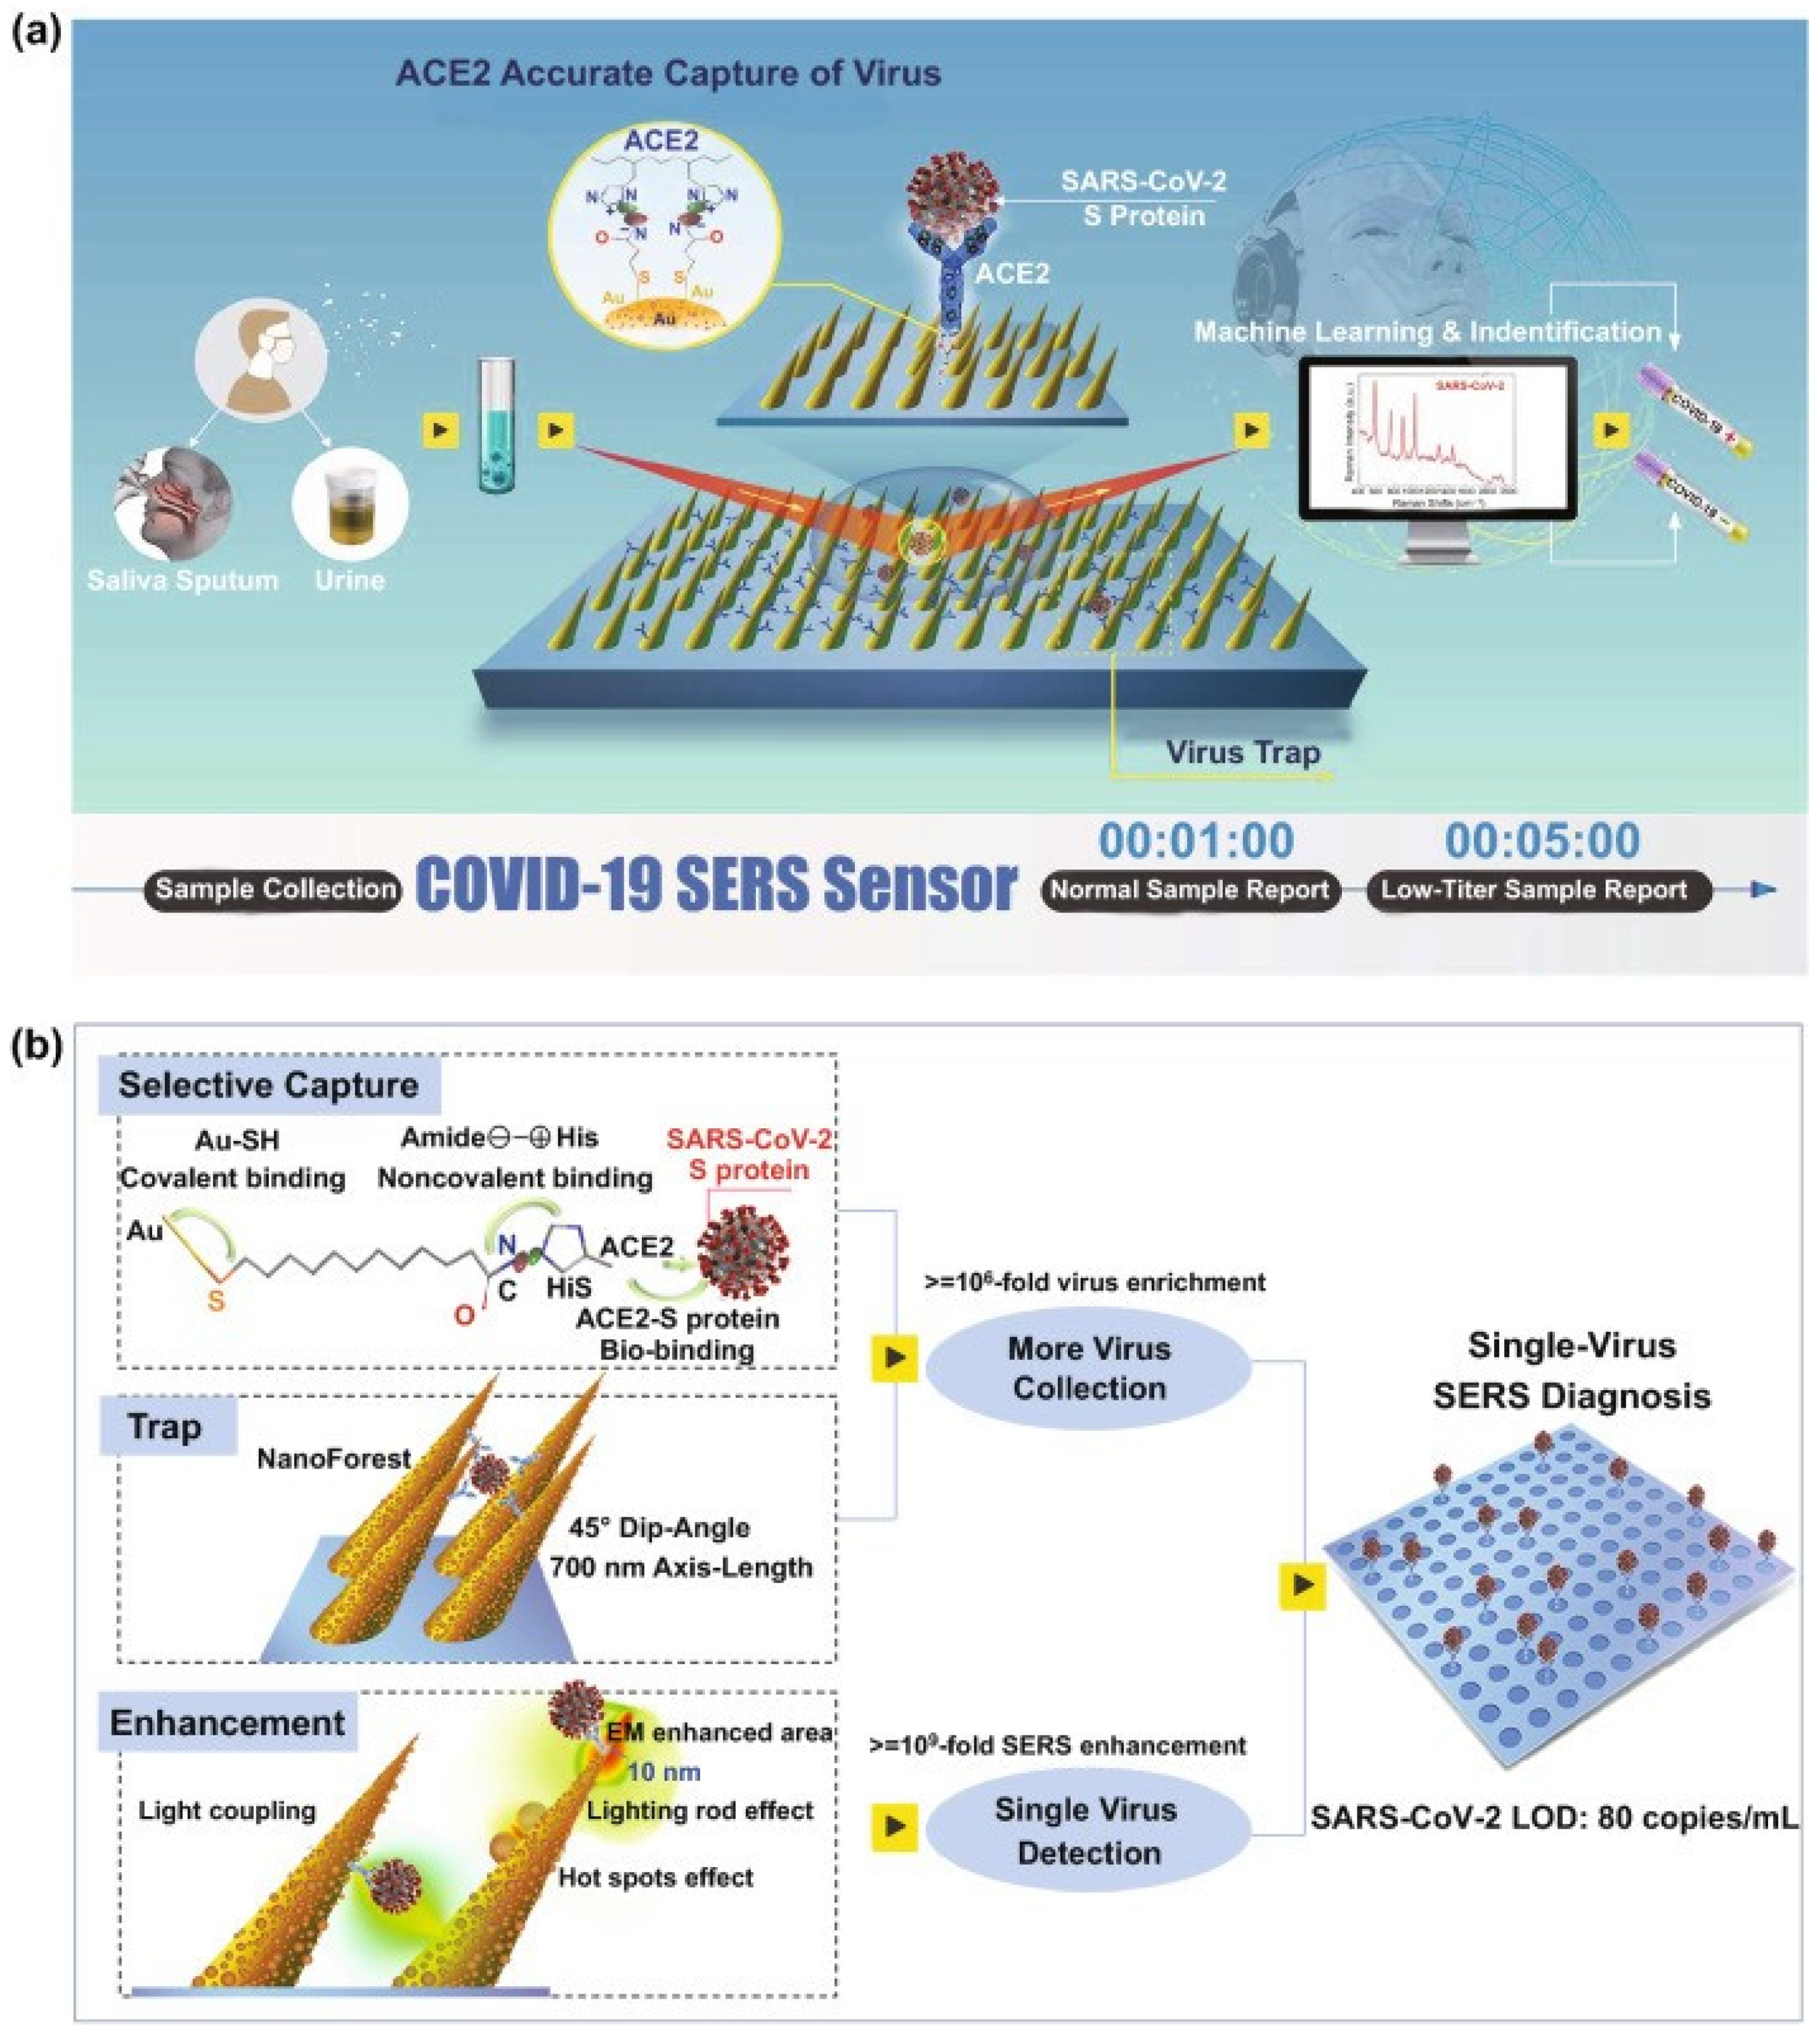
Several different approaches have been used for the detection of proteins of SARS-CoV-2. For example, Sanchez et al. created a SERS platform composed of gold nanostars and MoS2 with a detection limit for proteins of SARS-CoV-2 of 8.89 × 10⁻⁹ M [98]. Peng et al. used novel semiconductor-based Nb2C and Ta2C MXenes SERS substrates (generating SERS enhancement factors of 3.0 × 10⁶ and 1.4 × 10⁶, respectively), and obtained an LOD for proteins of SARS-CoV-2 of 5 × 10⁻⁹ M [99]. Yang et al. fabricated human angiotensin-converting-enzyme 2 (ACE2)-functionalized gold ‘virus trap’ nanostructures enabling the detection of SARS-CoV-2 S-protein at the single-virus level in urine samples, in an impressive time of 5 min [100]. A diagram of the procedure is shown in Figure 14.
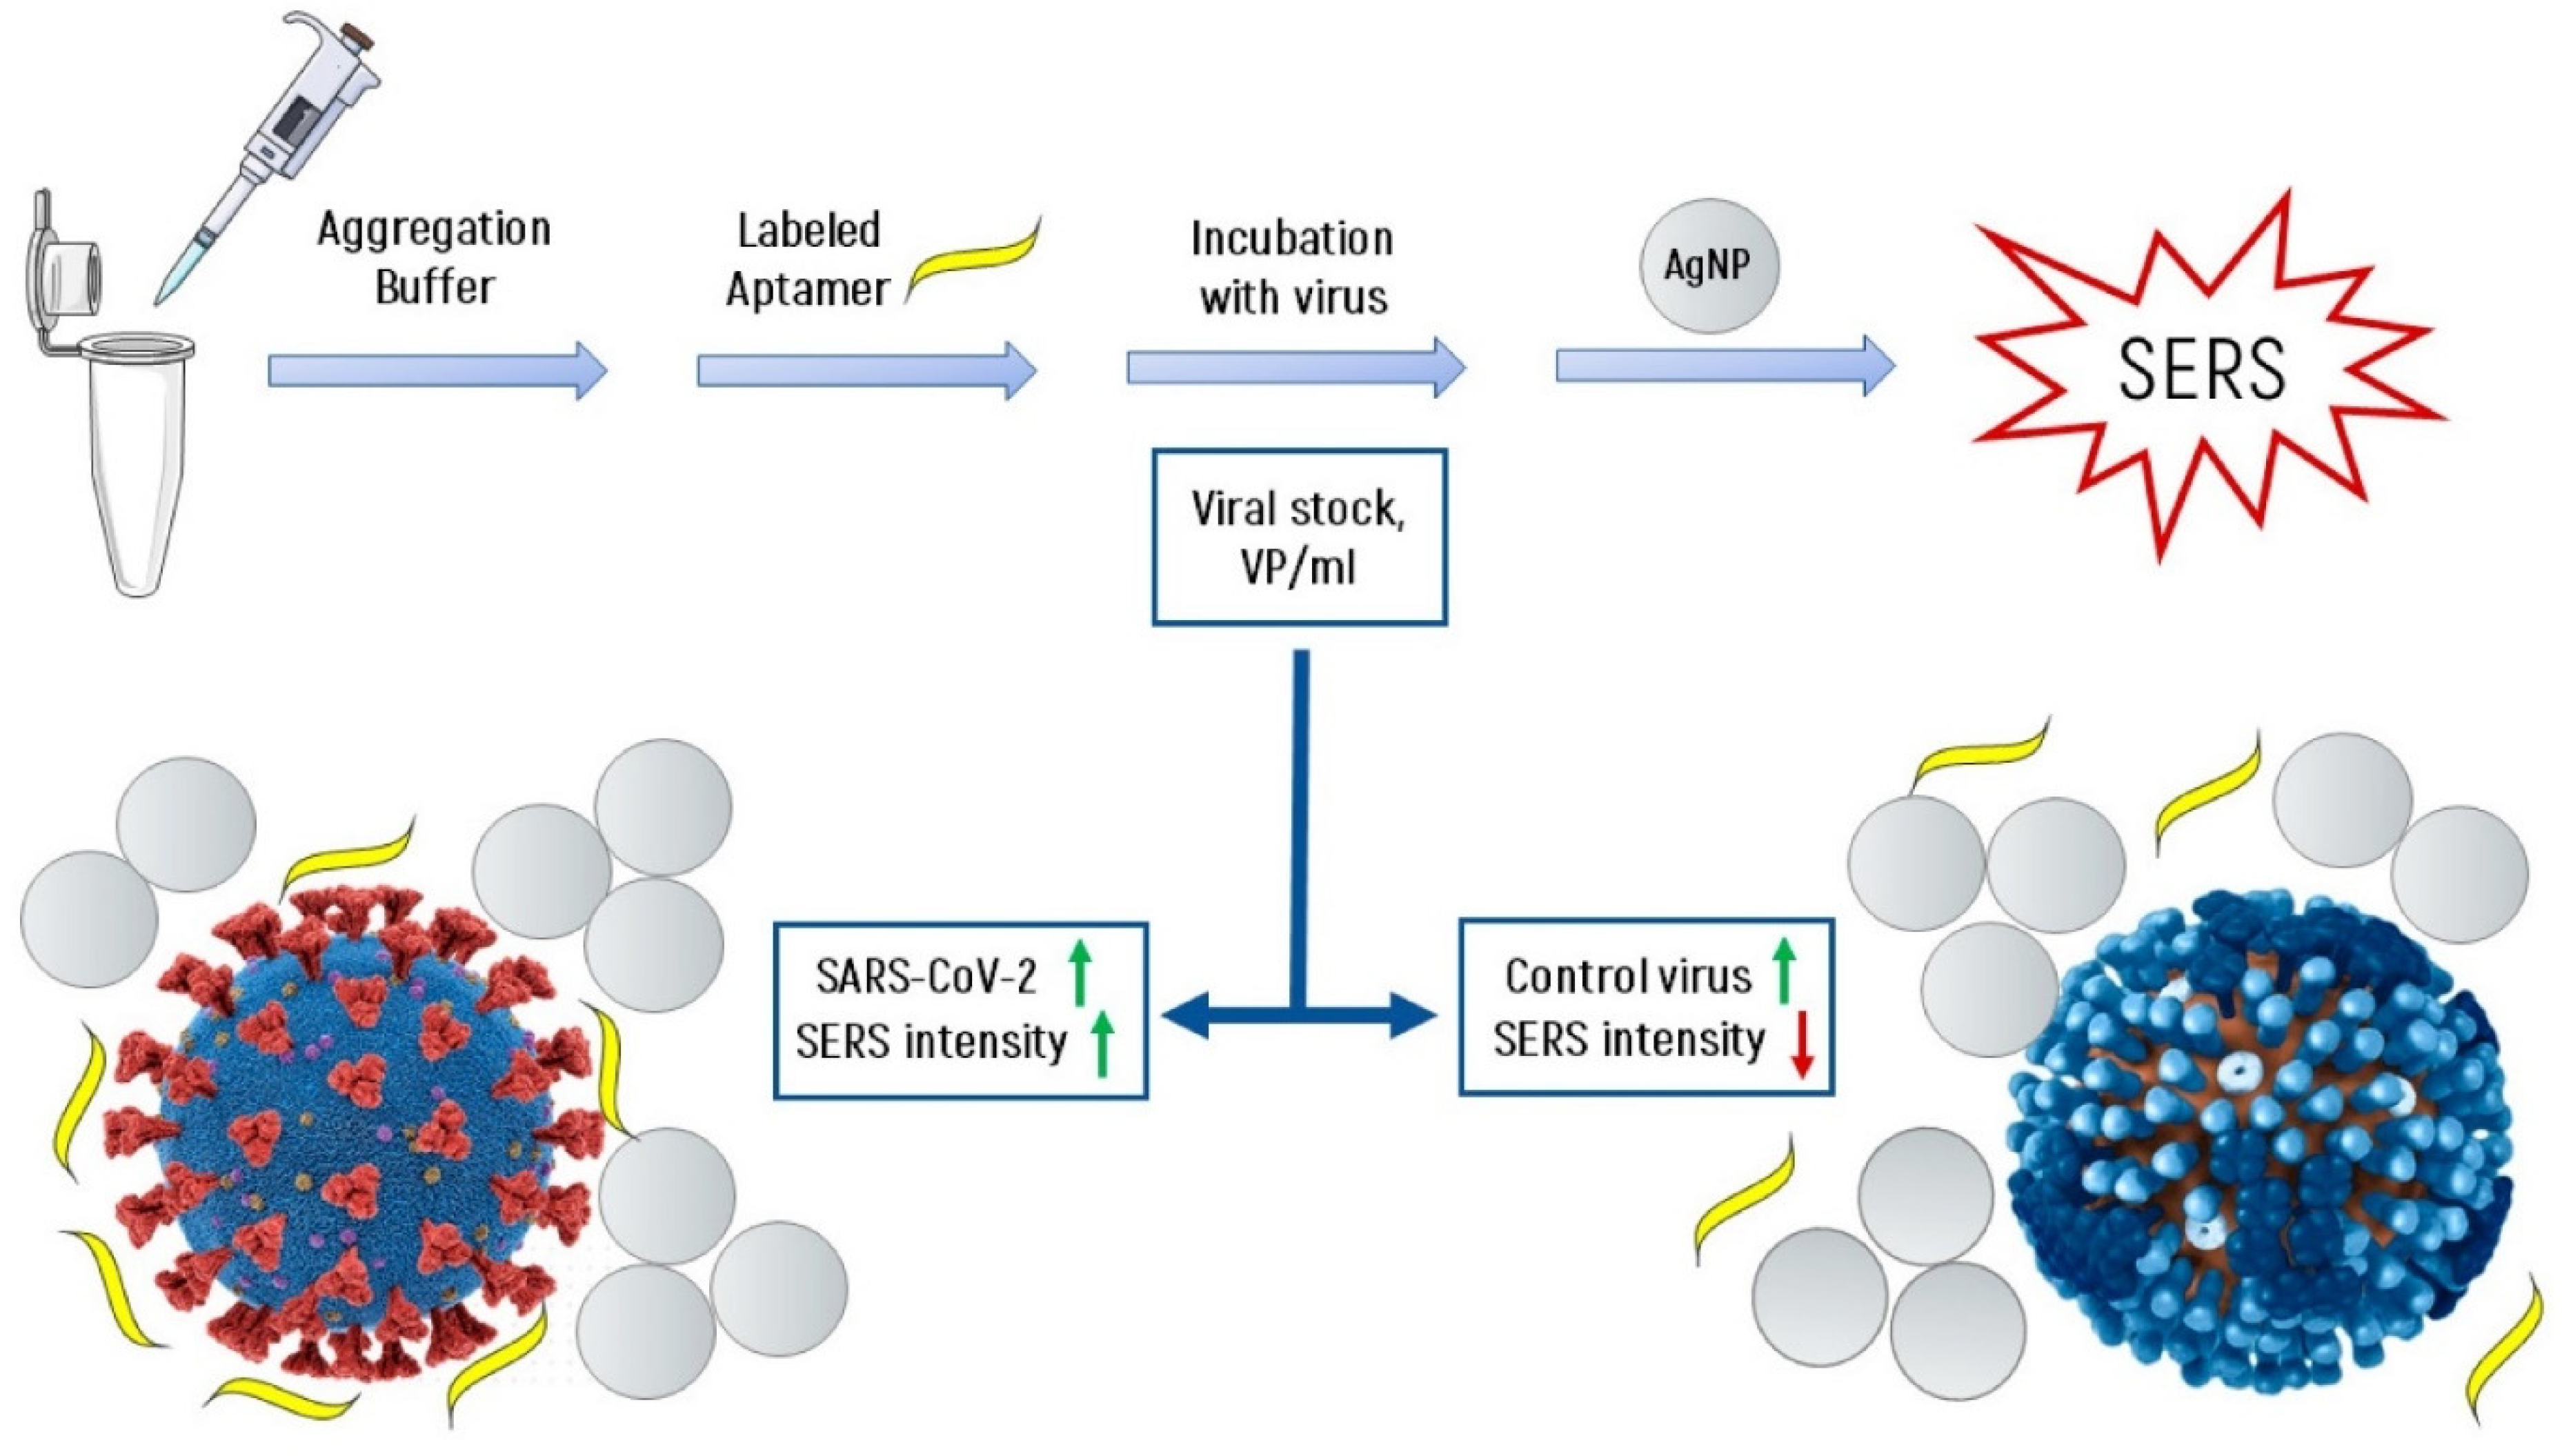
Like bacteria, viruses can be detected with the use of DNA strands. Zavyalova et al. fabricated a colloidal SERS-based aptasensor with an RBD-1C aptamer, which was shown to have a high affinity for the receptor binding domain (RBD) of the surface S-protein of SARS-CoV-2 [101]. This simple, one-step procedure (shown in Figure 15) permits the detection of SARS-CoV-2 in 7 min. In another study, Chen et al. described a DNA-based ON/OFF SERS sensor [102]. In this experiment, a combination of a spike protein DNA aptamer as receptor, and a self-grown gold nano-popcorn surface as the SERS platform was used, and the presence of the virus lysate caused binding with the DNA aptamer that could be monitored as a change in the intensity of the SERS signal.
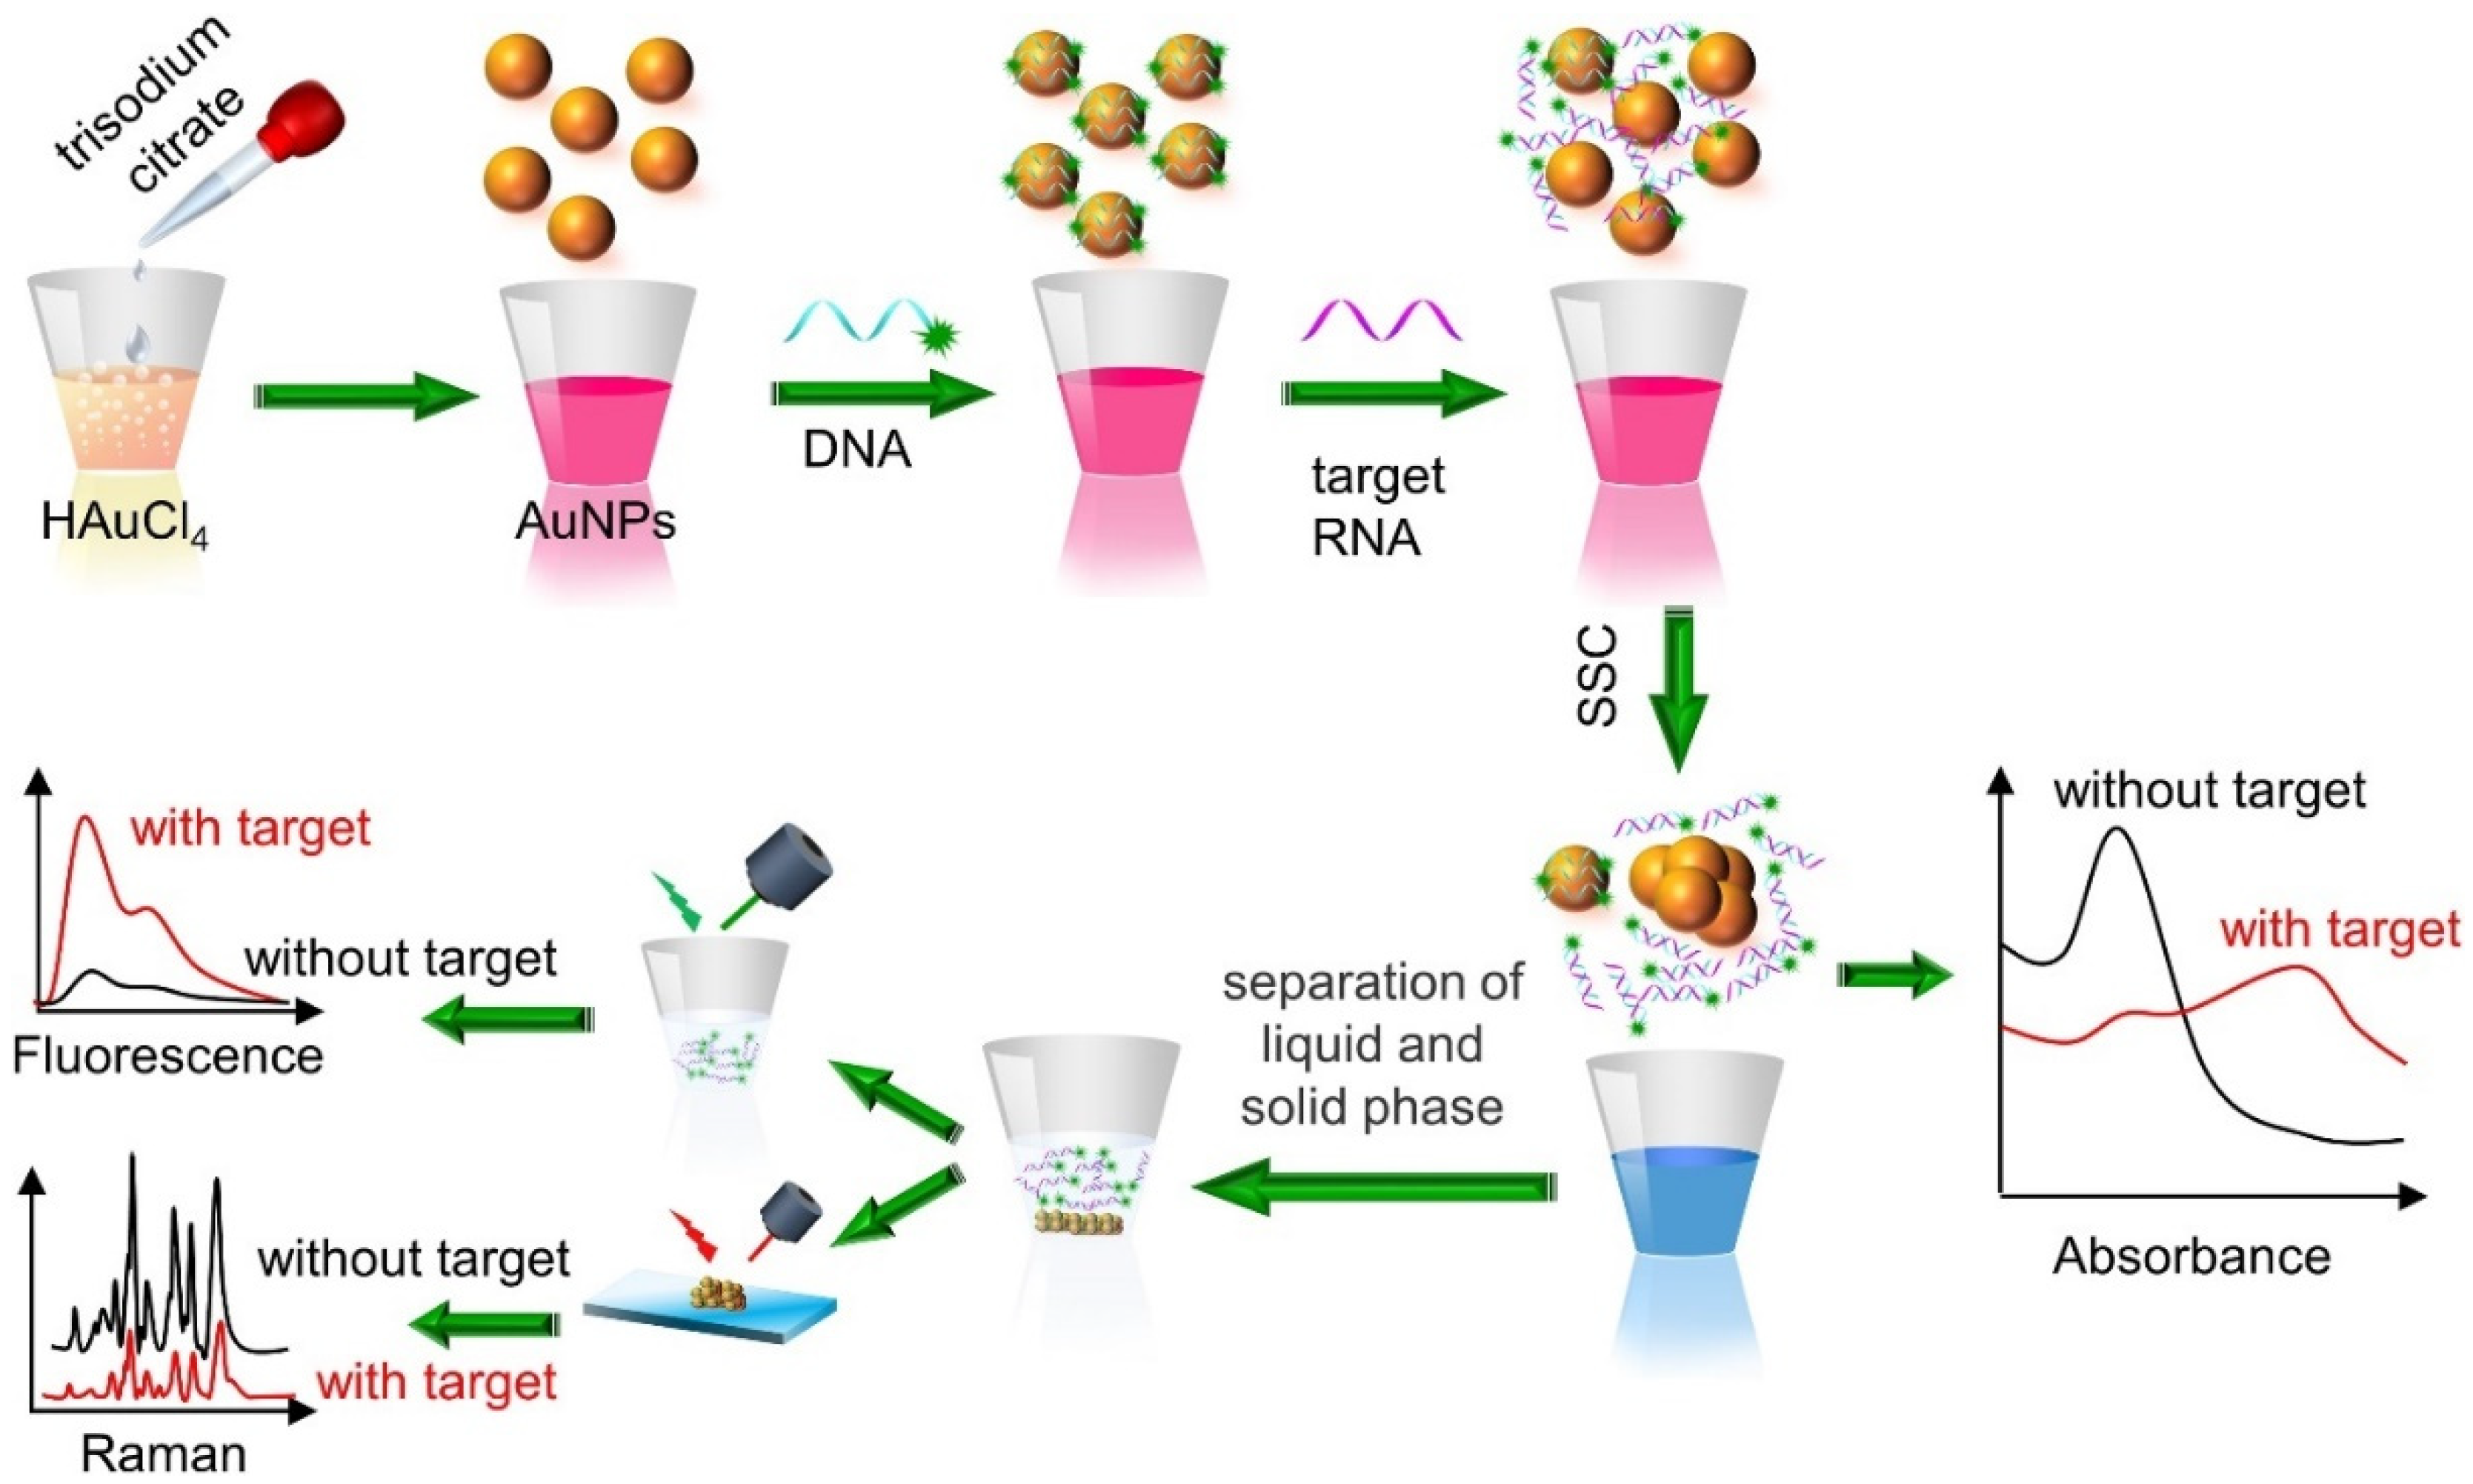
Gao et al. developed a sensor that enabled the three-mode detection of SARS-CoV-2 using SERS, fluorescence, and colorimetry [103]. This sensor contained a gold colloid with attached DNA modified with cyanide 3 (Cy3); it displayed a high cross-section for Raman scattering and strong fluorescence properties. The presence of the target RNA induced an aggregation of the modified gold nanoparticles, which in turn caused a change in the intensity of the extinction, and a change in the intensity of the Raman spectrum generated. A diagram of this procedure is shown in Figure 16. SARS-CoV-2 has been also detected using the oil/water/oil three-phase liquid-liquid interfaces self-assembly method [104], via the differential detection of the spike glycoprotein and nucleocapsid protein of SARS-CoV-2; this was achieved by obtaining metal-dielectric cavities through the interaction of protein sulfhydryl groups with a SERS-active silver surface at the picomolar level [105], with a silver nanorod platform functionalized with cellular receptor angiotensin-converting enzyme 2 (ACE2). This was carried out by the recognition and binding of the receptor binding domain (RBD) of the virus spike protein [106] or with an anti-spike antibody attached to the gold nanoparticles, which resulted in a simple colorimetric change observable within a 5-min time period [107].
4.5. Liquid Biopsy
Liquid biopsy is the in vitro detection of disease biomarkers in body fluids (blood, cerebrospinal fluid, urine, sputum, and ascites) [108], which can be useful not only for identifying diseases, but also for identifying drug resistance mechanisms, stratifying patients, and predicting treatment efficacy. Many different molecules have been identified in body fluids, including disease-related proteins, circulating tumour cells, cell-free tumour DNA, cancer-derived exosomes, mRNA, and cell-free microRNAs [108]. As biomarkers are present in body fluids at trace levels, the nanosensors used need to be very sensitive, and also resistant to the presence of many interfering molecules.
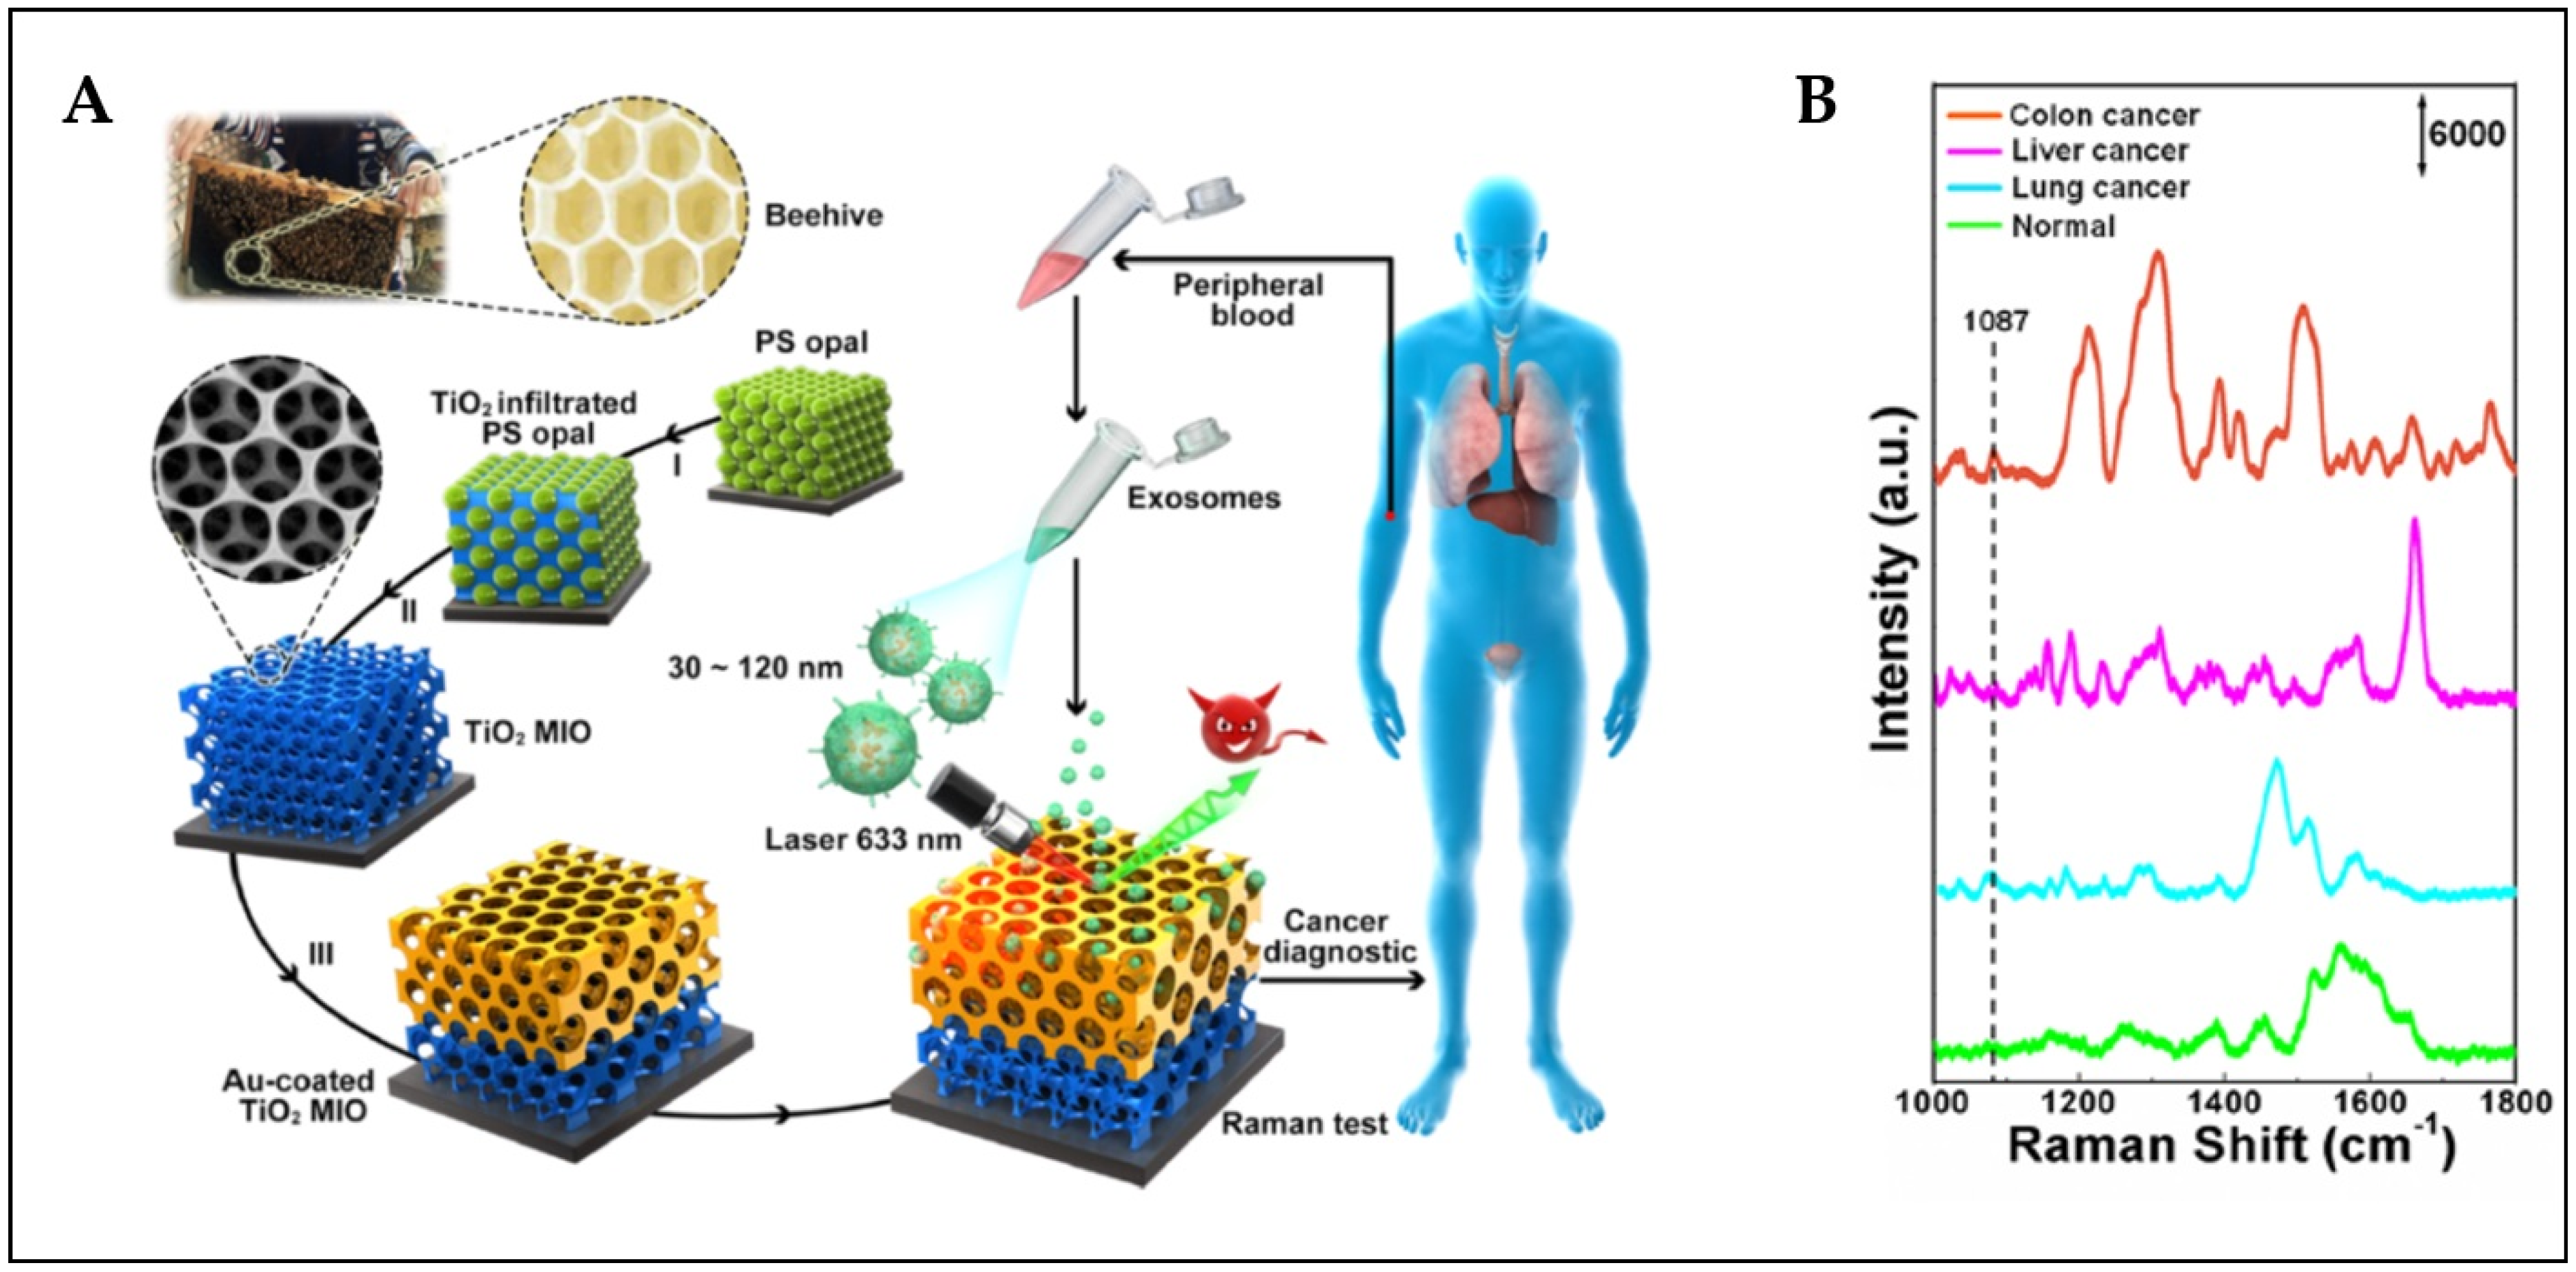
One type of nanosensor that makes it possible to capture markers directly and identify them is based on the immobilization of specific antibodies on a SERS substrate. The sample is placed on the substrate, the detected molecules bind to the surface, the rest of the sample is washed away, and the SERS signal is recorded. Raman reporter molecules can be added to such structures in order to strengthen the signal, although this disables any signal being recorded from the detected molecules, which could give additional information about the sample. For example, Kowalska et al. applied this approach to identify L-selectin in plasma and serum at a concentration of 60 ng/mL without any pre-treatment of the samples [109]. Gholami et al. enriched a chip with benzothiazole azo dye to detect tumour necrosis factor α in blood at a level of 173 pg/L [110]. Muhammad et al. fabricated a SERS platform consisting of gold nanoparticles functionalized with an aptamer that can recognize interleukin-6 (IL-6) [111]. The detection was based on changes in the conformation of the aptamer during the recognition of IL-6 in mouse serum, which resulted in a corresponding change in the output SERS spectrum. Dong et al. created a nanotrap for capturing and analyzing exosomes in plasma [112]. In order to study the protein phosphorylation status of exosomes, they designed an Au-coated TiO2 macroporous inverse opal structure that made it possible to capture and analyse exosomes from the plasma of cancer patients without any labelling processes. Fortunately, the intensity of the 1087 cm−1 SERS band from the exosomes of cancer patients is unanimously stronger (by at least twice) than the corresponding band from healthy people; this indicates that this may be a very versatile method in cancer diagnostics (see Figure 17).
Jiang et al. used the two-dimensional molybdenum disulfide nanosheet as a platform for the specific and sensitive detection of carbohydrate antigen 19-9 (CA19-9) with LOD of 3.43 × 10⁻⁴ IU/mL. This sensor was also used for the discrimination of the CA19-9 level in clinical serum samples, and presented higher sensitivity than the traditional method [113].
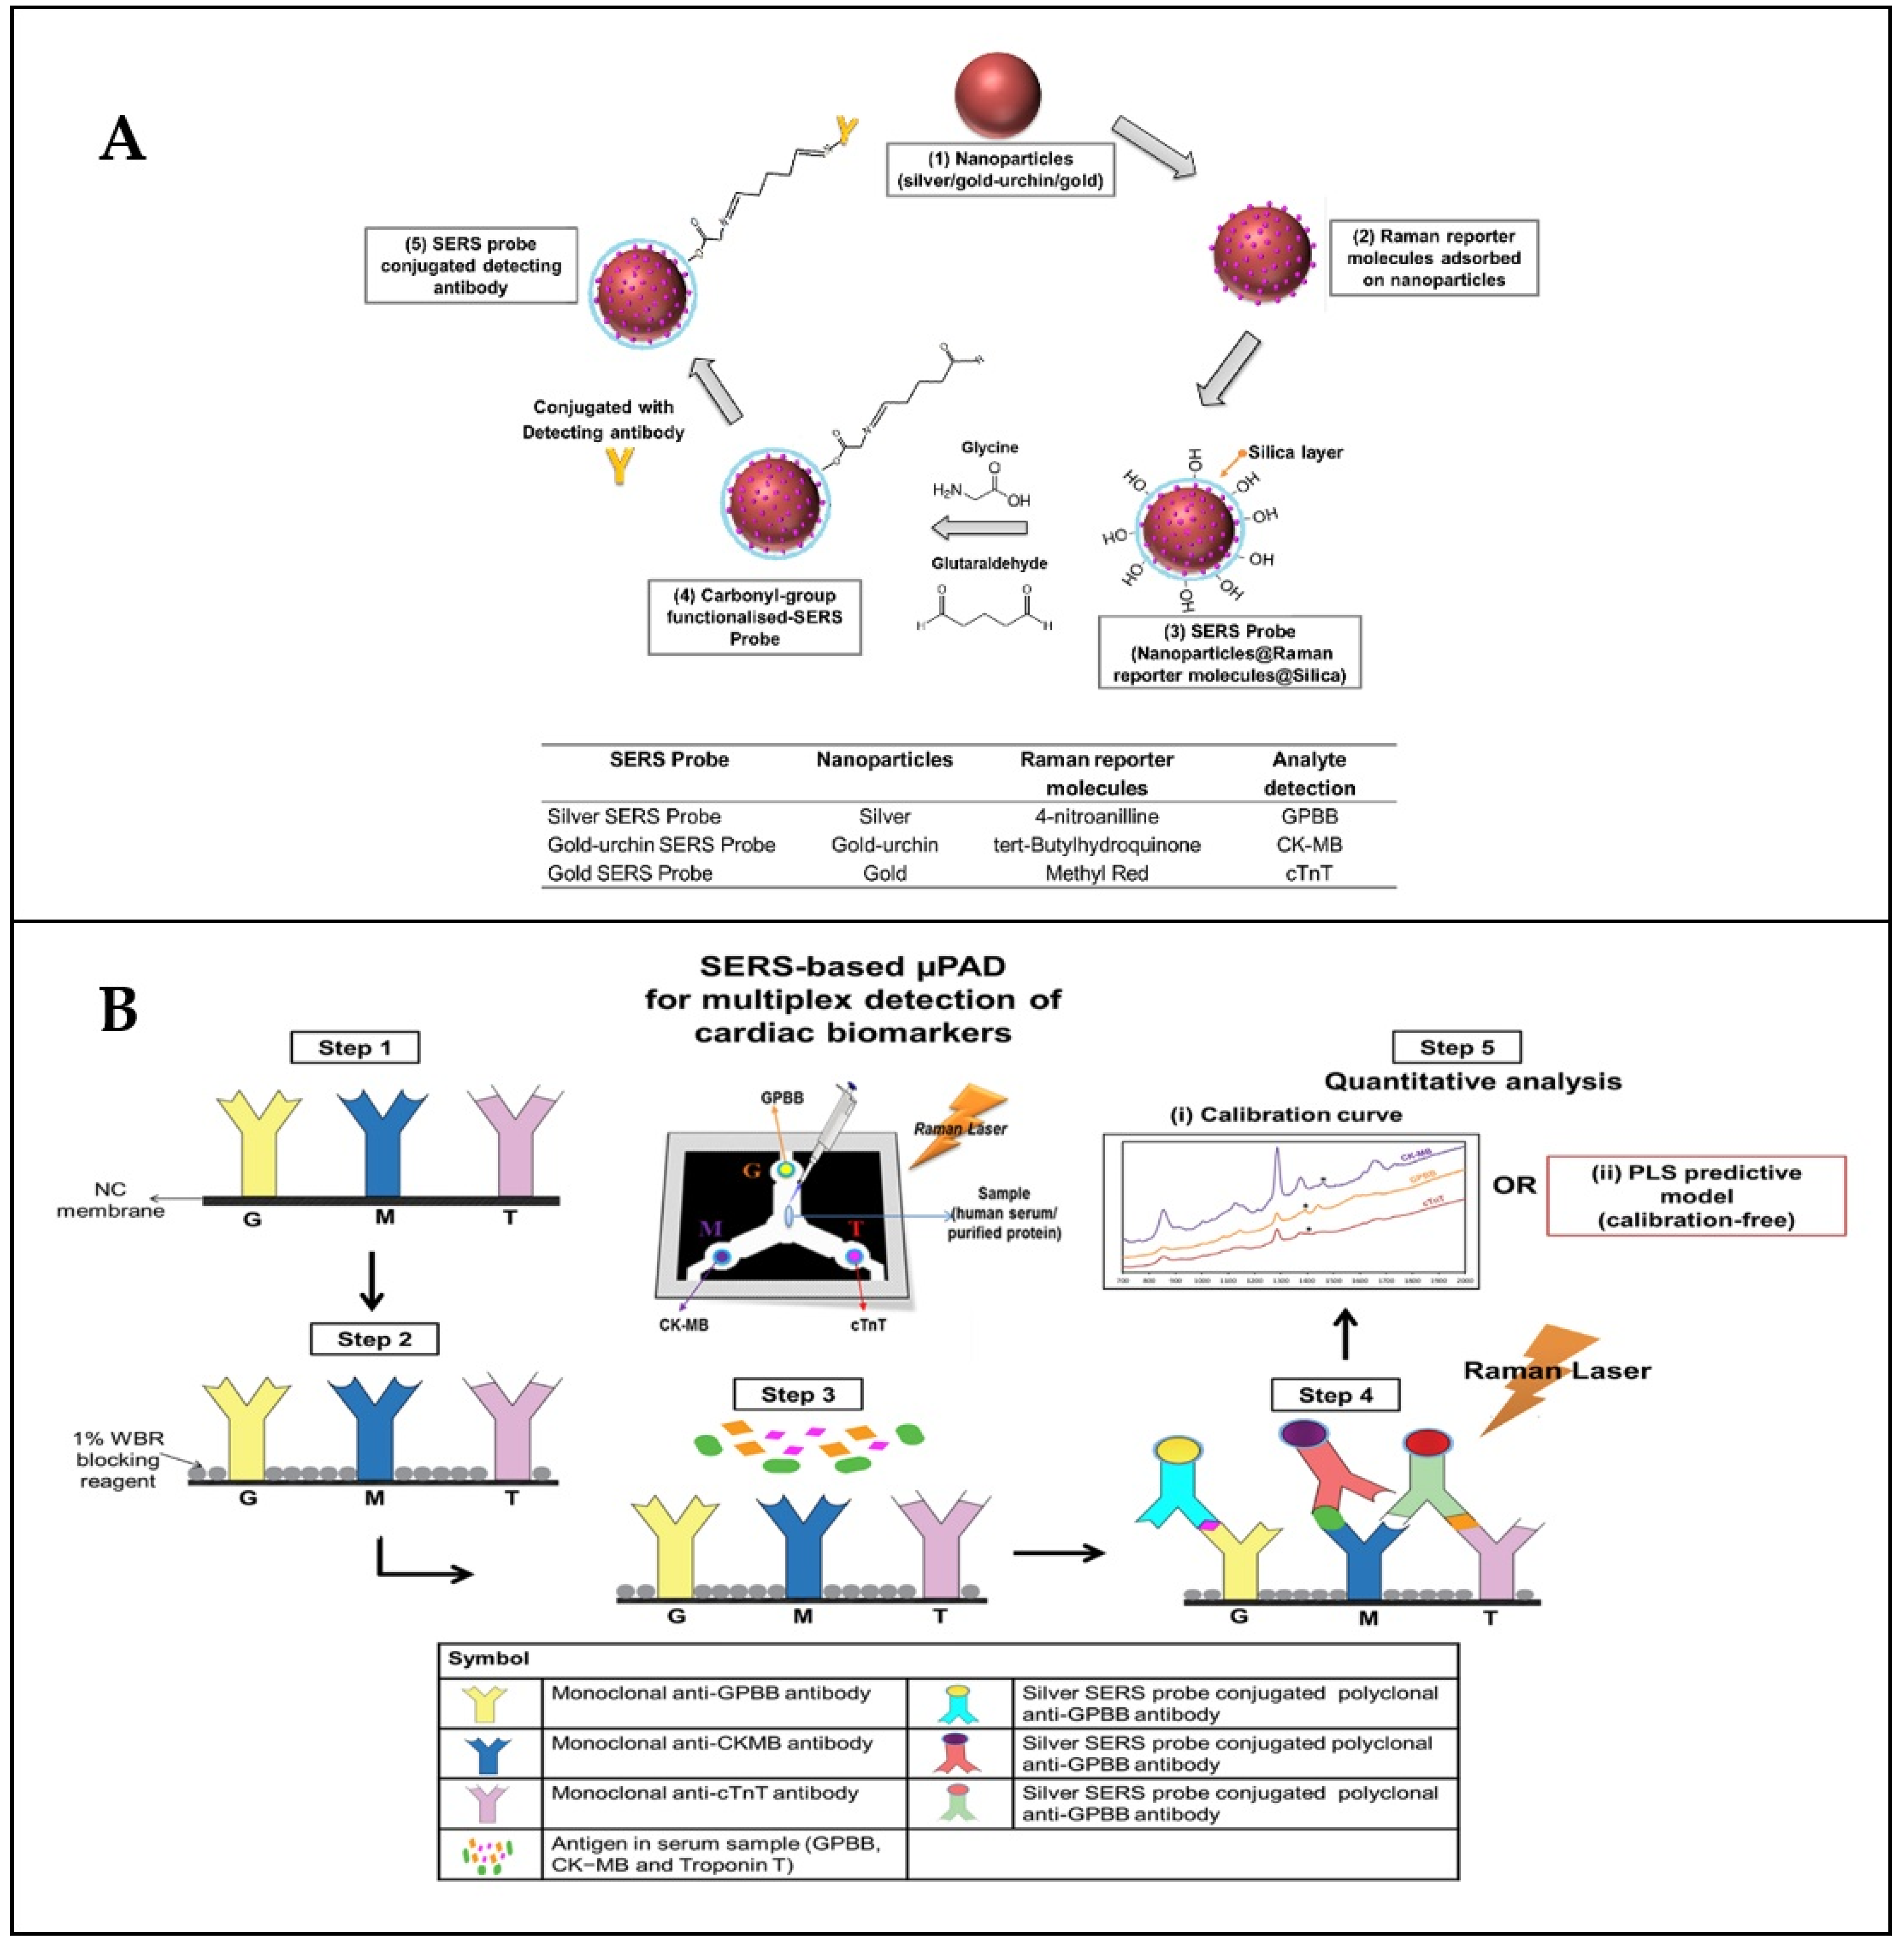
Multiplexing the possibilities of SERS can be also used in liquid biopsy experiments. Lim et al. constructed a sensor for the simultaneous detection of three acute myocardial infarction markers in serum [114]. An elegant description of the nanosensor is shown in Figure 18.
To enhance a SERS signal, sandwich structures consisting of two different metal nanostructures are often made. For example, Yang et al. described a sensor consisting of a head-flocked nanopillar substrate and SERS nanotags modified with half antibody fragments, permitting a qualitative and quantitative determination of tau protein in human plasma at the femtomolar level, by capturing a protein molecule between two tau antibodies conjugated to the metal nanostructures [115].
Molecularly imprinted polymers can also be used as capture agents for detecting proteins. For example, Turan et al. applied such a material to detect prostate-specific antigen, with a sensitivity at the level of the ELISA test [116].
To conclude this part of the article, with the use of SERS it is even possible to detect single molecules [3,4,117]. However, as the most important consideration is not to push the methodology to such low limits of detection, since the physiological level is satisfactory. What is more important is to focus on excluding the risk of false-positive results, which are very dangerous in medical diagnoses [118].
4.6. Detection of Disease Markers on an Example of Lab-On-Chip Procedure
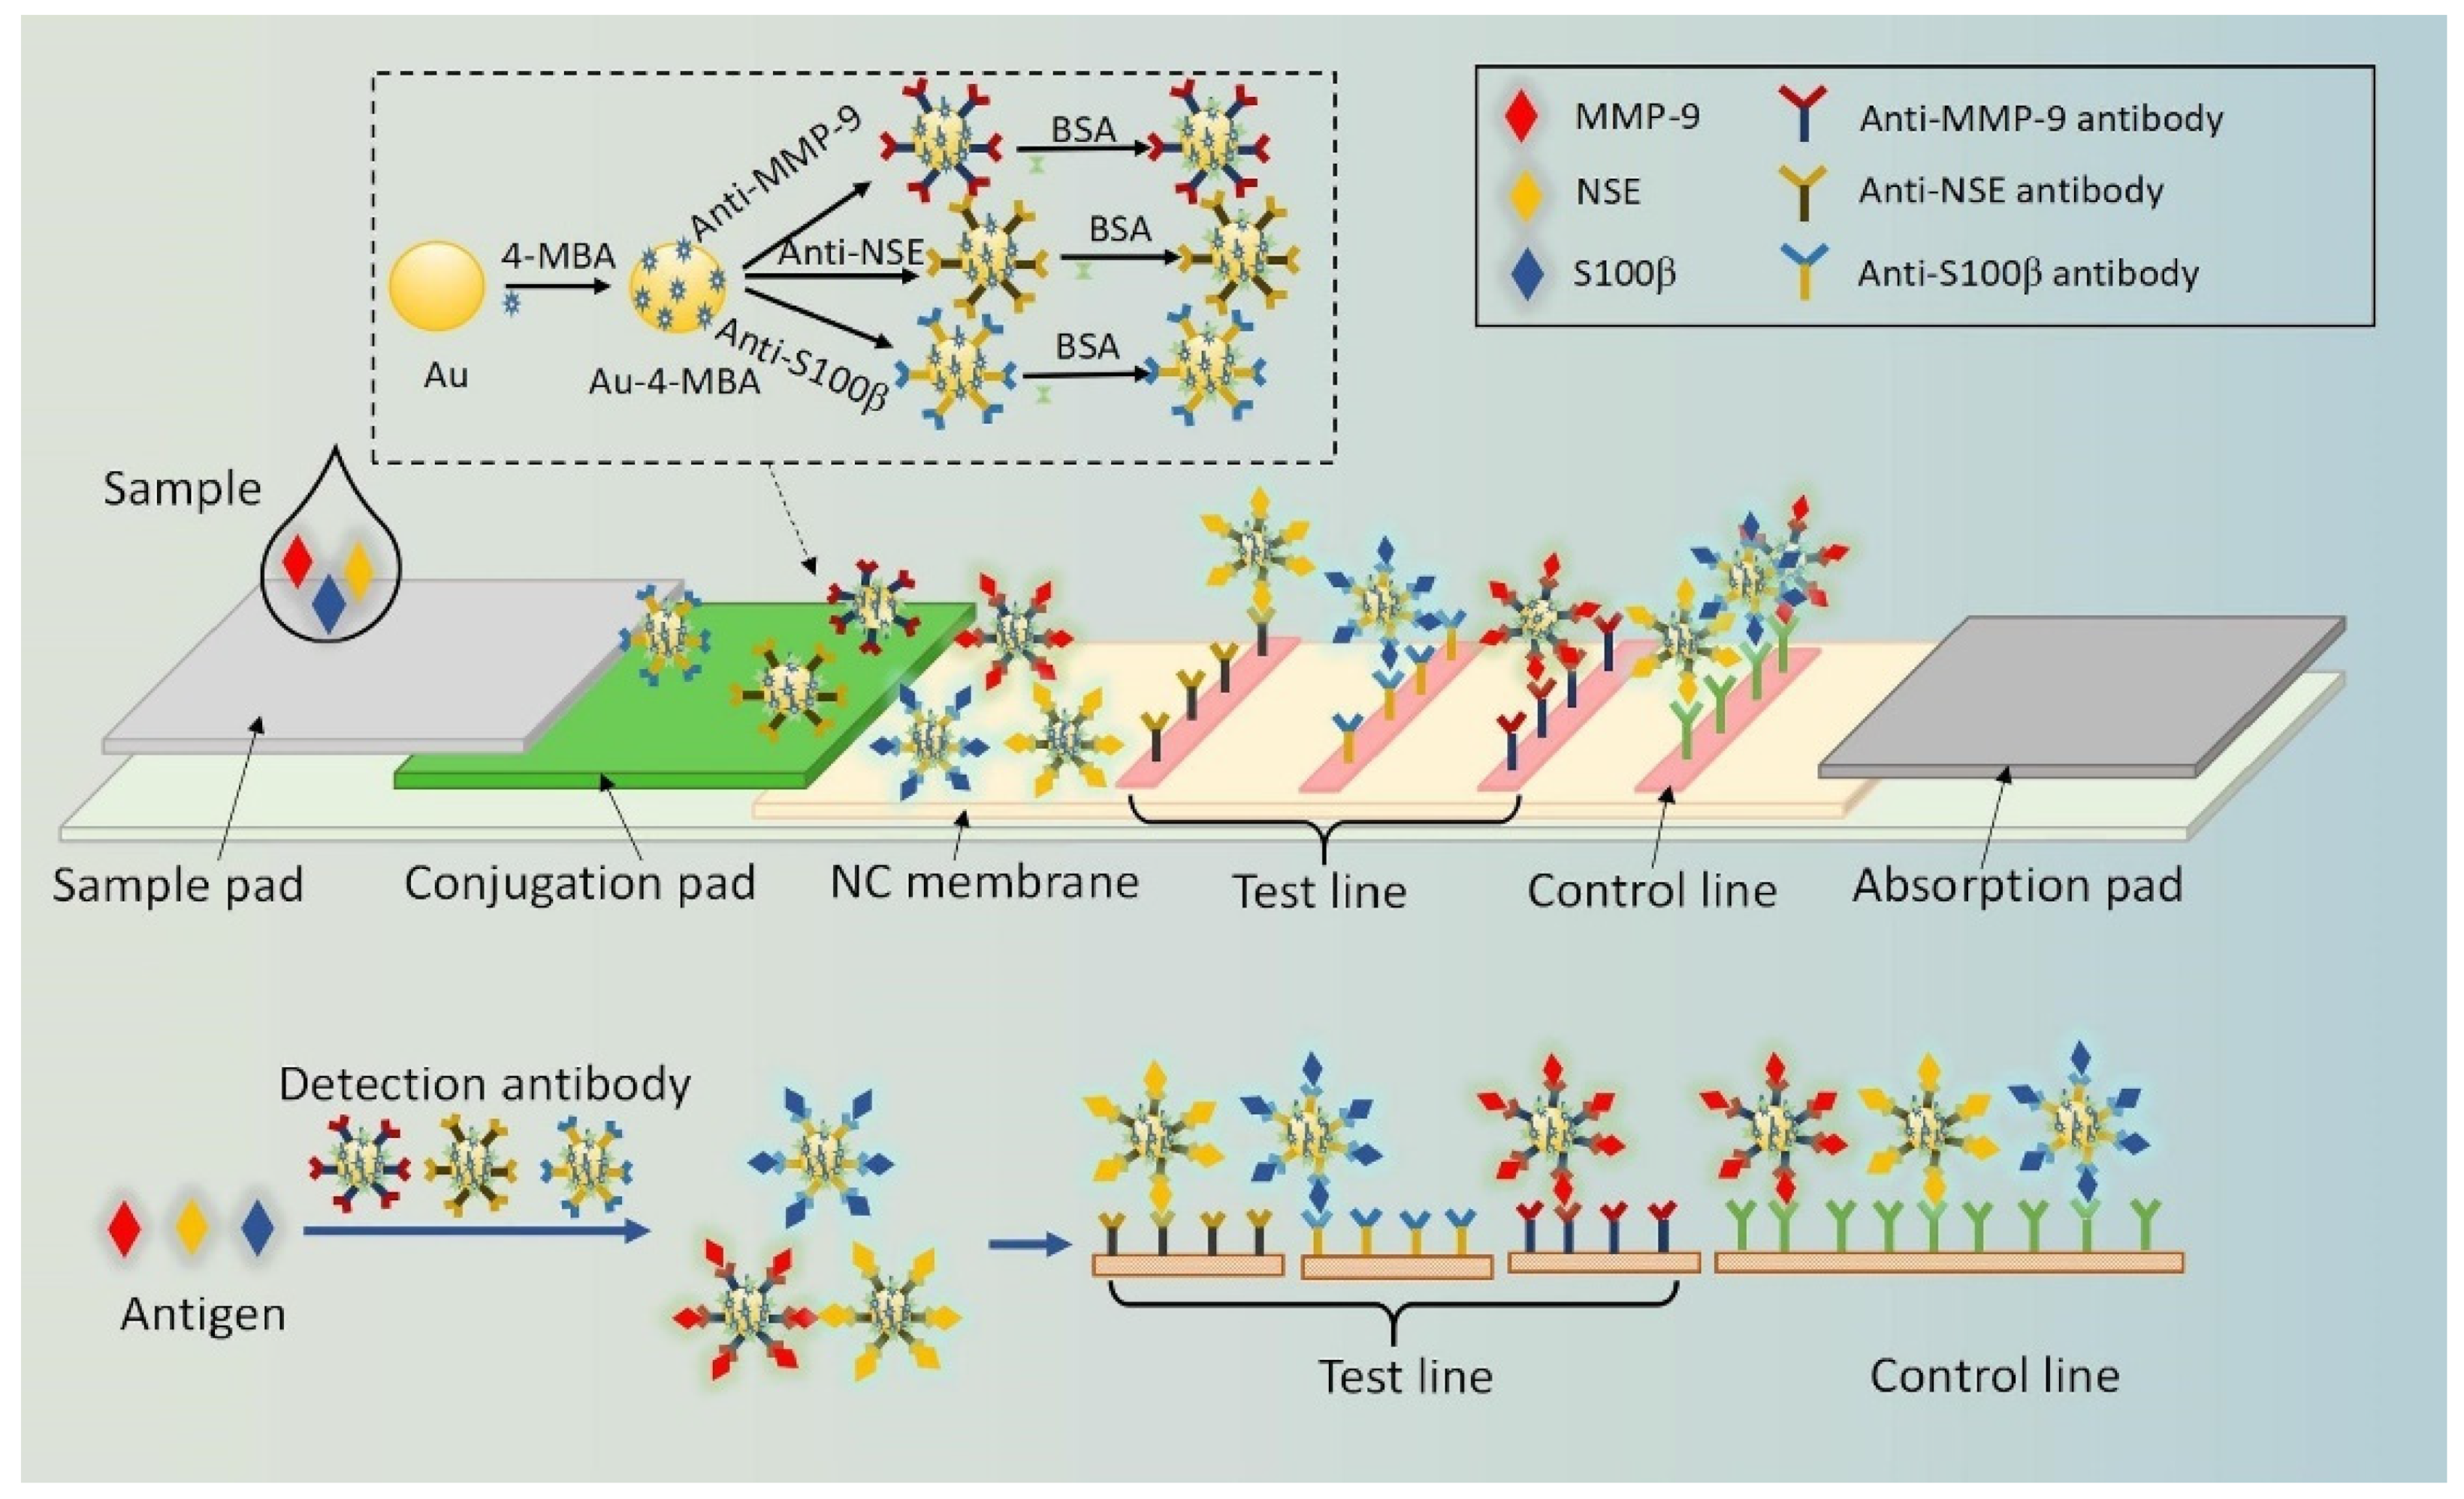
A very interesting and elegant strategy of SERS measurements is to ‘enclose’ the experimental setup in a pad with the similar action as a pregnancy test. In this approach, one of several analyses which normally would be performed in the laboratory, is applied into a miniaturized device called ‘lab-on-chip’. That miniaturization has numerous advantages, such as the improvement of diagnostic speed and sensitivity, cost efficiency, automation, and ergonomics. In case of SERS, in theory all you need is a specific pad, sample, and portable Raman spectrometer for the biomedical experiments. For example, Song et al. designed a sensor for stroke biomarkers detection in blood (see Figure 19) [119]. The test enabled detection of metalloproteinase-9, S100 calcium-binding protein B protein, and neuro-specific enolase over a wide range from 0.0001 ng/mL to 1000 ng/mL, and a limit of detection of 0.01 pg/mL. Very similar procedures have been applied for detection of other disease markers, such as acrosomal protein SP10 in semen [120], blood biomarkers related to intrauterine growth restriction PI3K and CRAF in unprocessed blood [117], E. coli [121], or even SARS-CoV-2 [122]. This solution seems very promising towards entering SERS into actual medical diagnoses; however, selected pads should be tested on a large scale [123], including for its repeatability and stability.
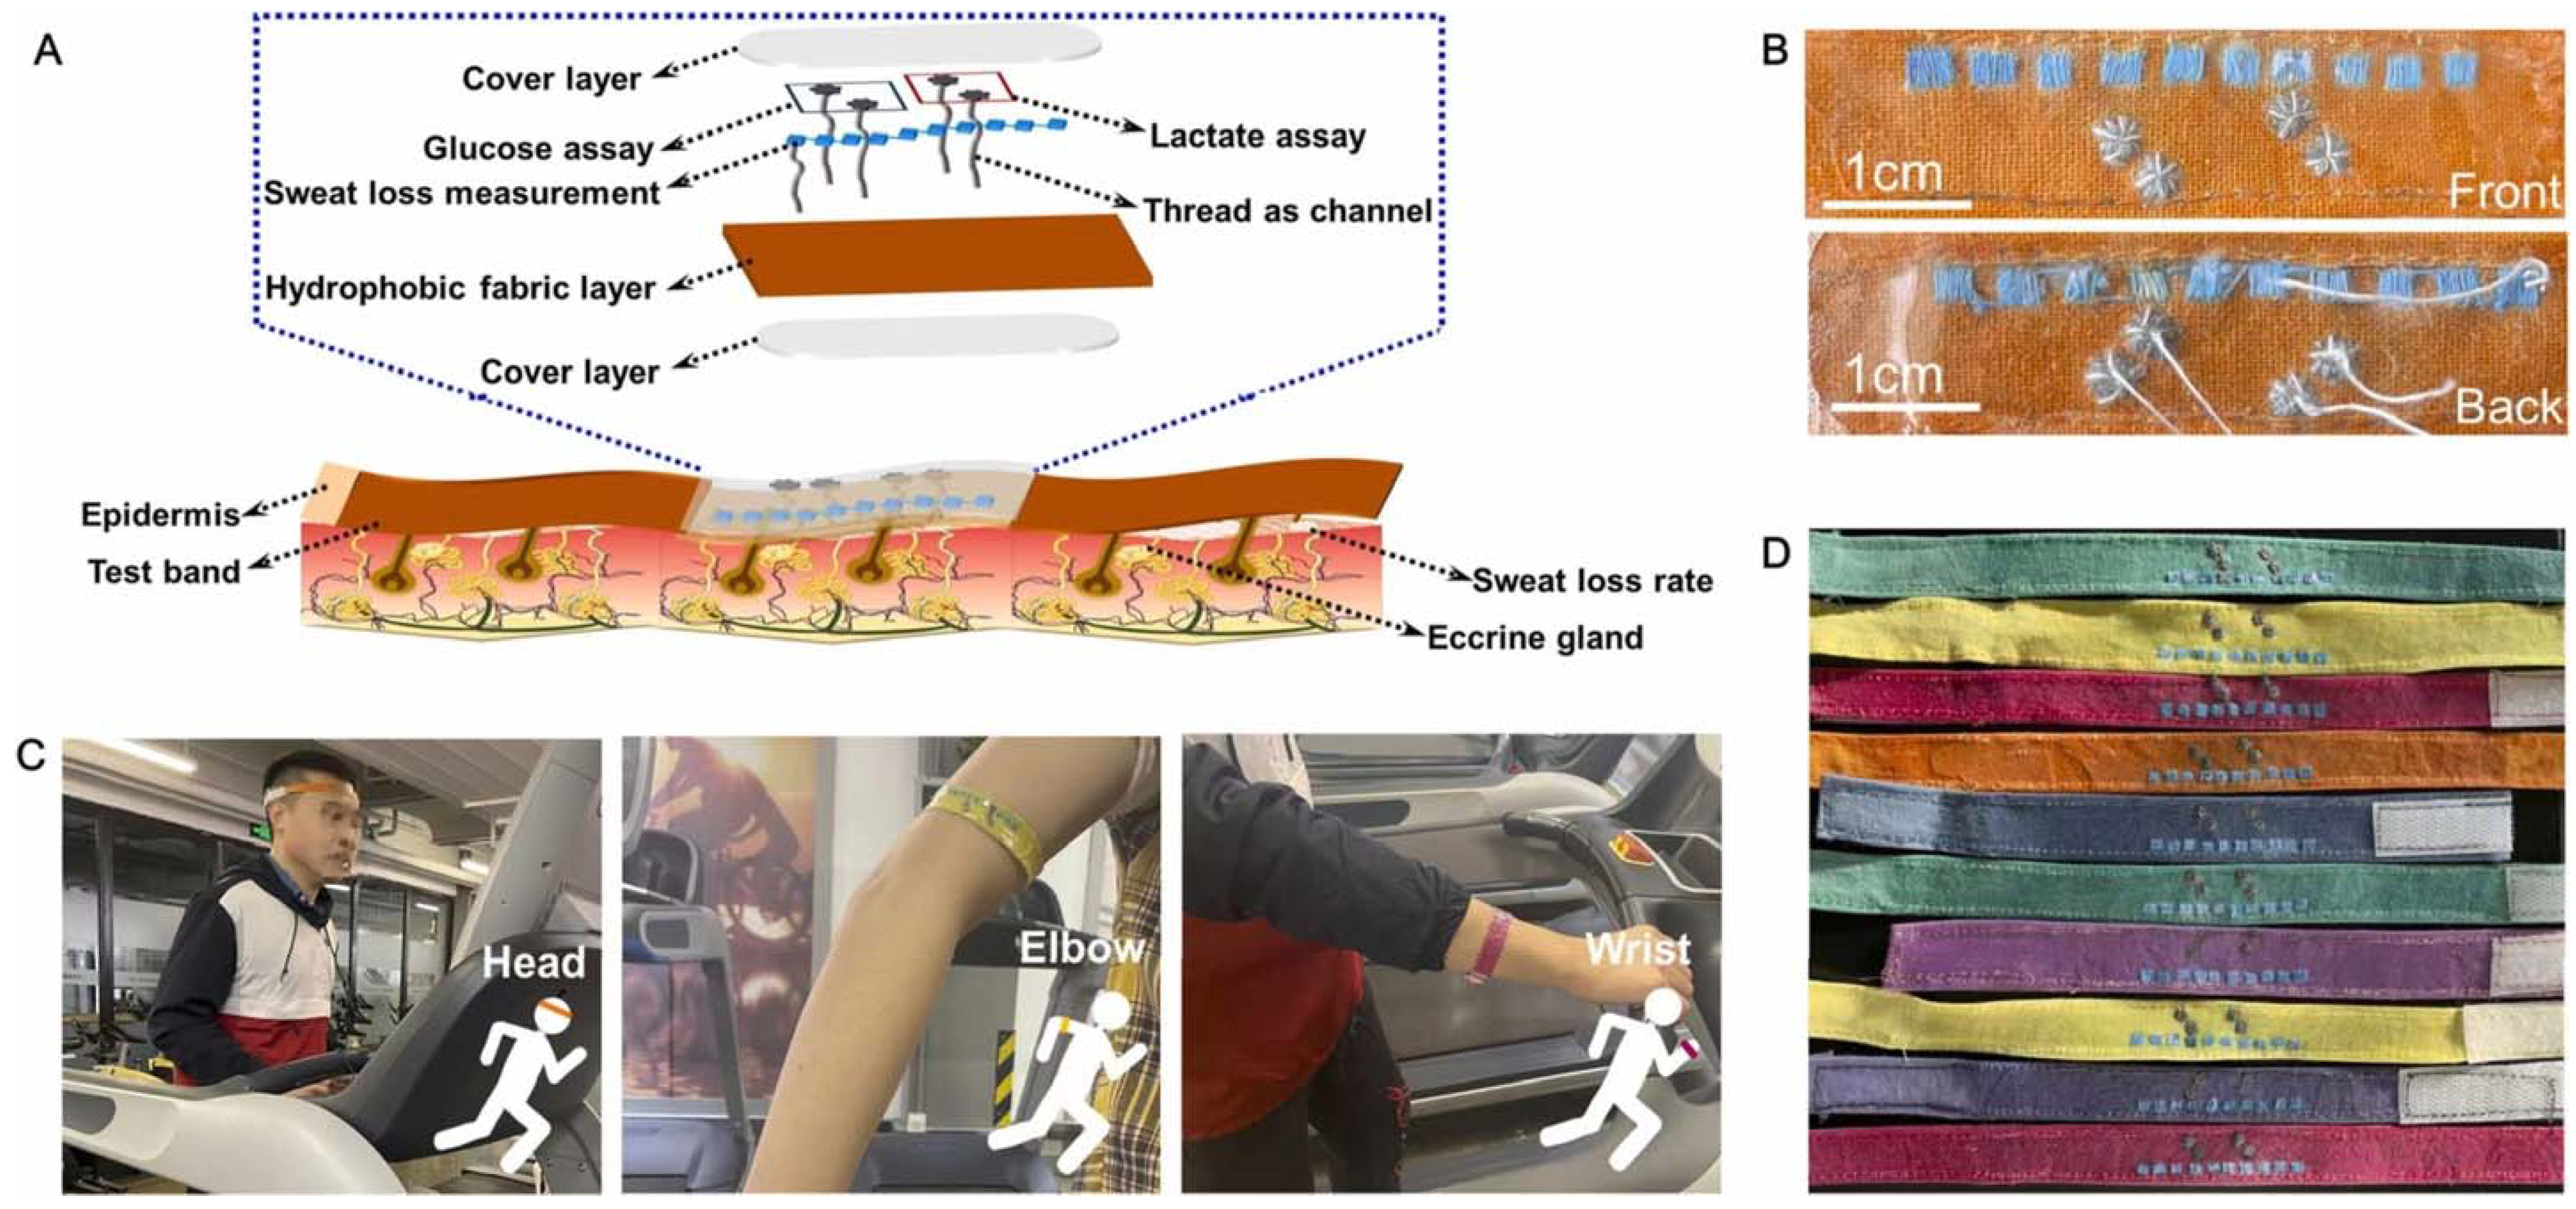
Zhao et al. prepared a textile-based device for detection of glucose and lactate in sweat [124]. The scheme of such a sensor is shown in Figure 20, where CTAB (hexadecyltrimethylammonium bromide) molecules are capturing lactate, and MPBA (4-mercaptophenylboronic acid) are capturing glucose. The assay was tested on four volunteers, and the glucose results matched quite well with the blood glucose measured with a commercial blood glucose meter. Similarly, fibbers were prepared using a wet-spinning method and used for pH sensing [125]. SERS substrate was fabricated for pH sensing by using sodium alginate with gold nanoparticles and 4-mercaptopyridine (Figure 21). The nanosensor responded to the pH changes and enabled pH measurements of sweat, saliva, and urine. Also, silk fibroin fibbers decorated with metal nanodendrites were used to detect lactic acid in human sweat [126].
SERS-based lateral flow immunoassay was also applied for rapid and ultra-sensitive detection of anti-SARS-CoV-2 IgM/IgG in clinical samples [127]. Raman tags were made of two types of nanoparticles, two layers of reporter molecules, silver layer, and SARS-CoV-2 S specifically binding to anti-SARS-CoV-2 IgM/IgG. A biosensor, similar to other lab-on-chip sensors, consisted of an absorption pad, an NC membrane, a conjugate pad, and a sample pad, schematically shown in Figure 22. If the sample has no target anti-SARS-CoV-2 IgM/IgG, then immunocomplex cannot be formed and no SERS tags will be captured by the test lines. A very similar approach was described by Chen et al. [128].
4.7. Expression of Disease Markers from Cells to In Vivo
The expression by SERS of disease markers (usually tumour markers in the literature) on a cell surface has been well described and optimized. The method has been widely used on cell cultures, tissues, and even on live animals. Briefly, the conception is as follows: metallic nanoparticles are labelled with reporter molecules and antibodies that interact with the markers; then, the whole sensor is immobilized on the cell [129,130,131,132]/spheroid [133]/tissue [134]/tumour [135] surface via the antibody-marker interaction, and the SERS signal is recorded. The spectra of the Raman reporters are visible in the region of expression of marker being searched for. The main difficulties presented in this experiment are: (1) the stability of the nanoparticles, (2) the successful conjugation of antibodies, and (3) the risk of an unspecific interaction between the antibodies and the area under study. The procedure for histopathological staining with fluorescence detection is very similar, although the above-mentioned multiplexing possibilities of SERS suggest that it might be wise to focus on the development of the SERS approach as having great potential for the future.
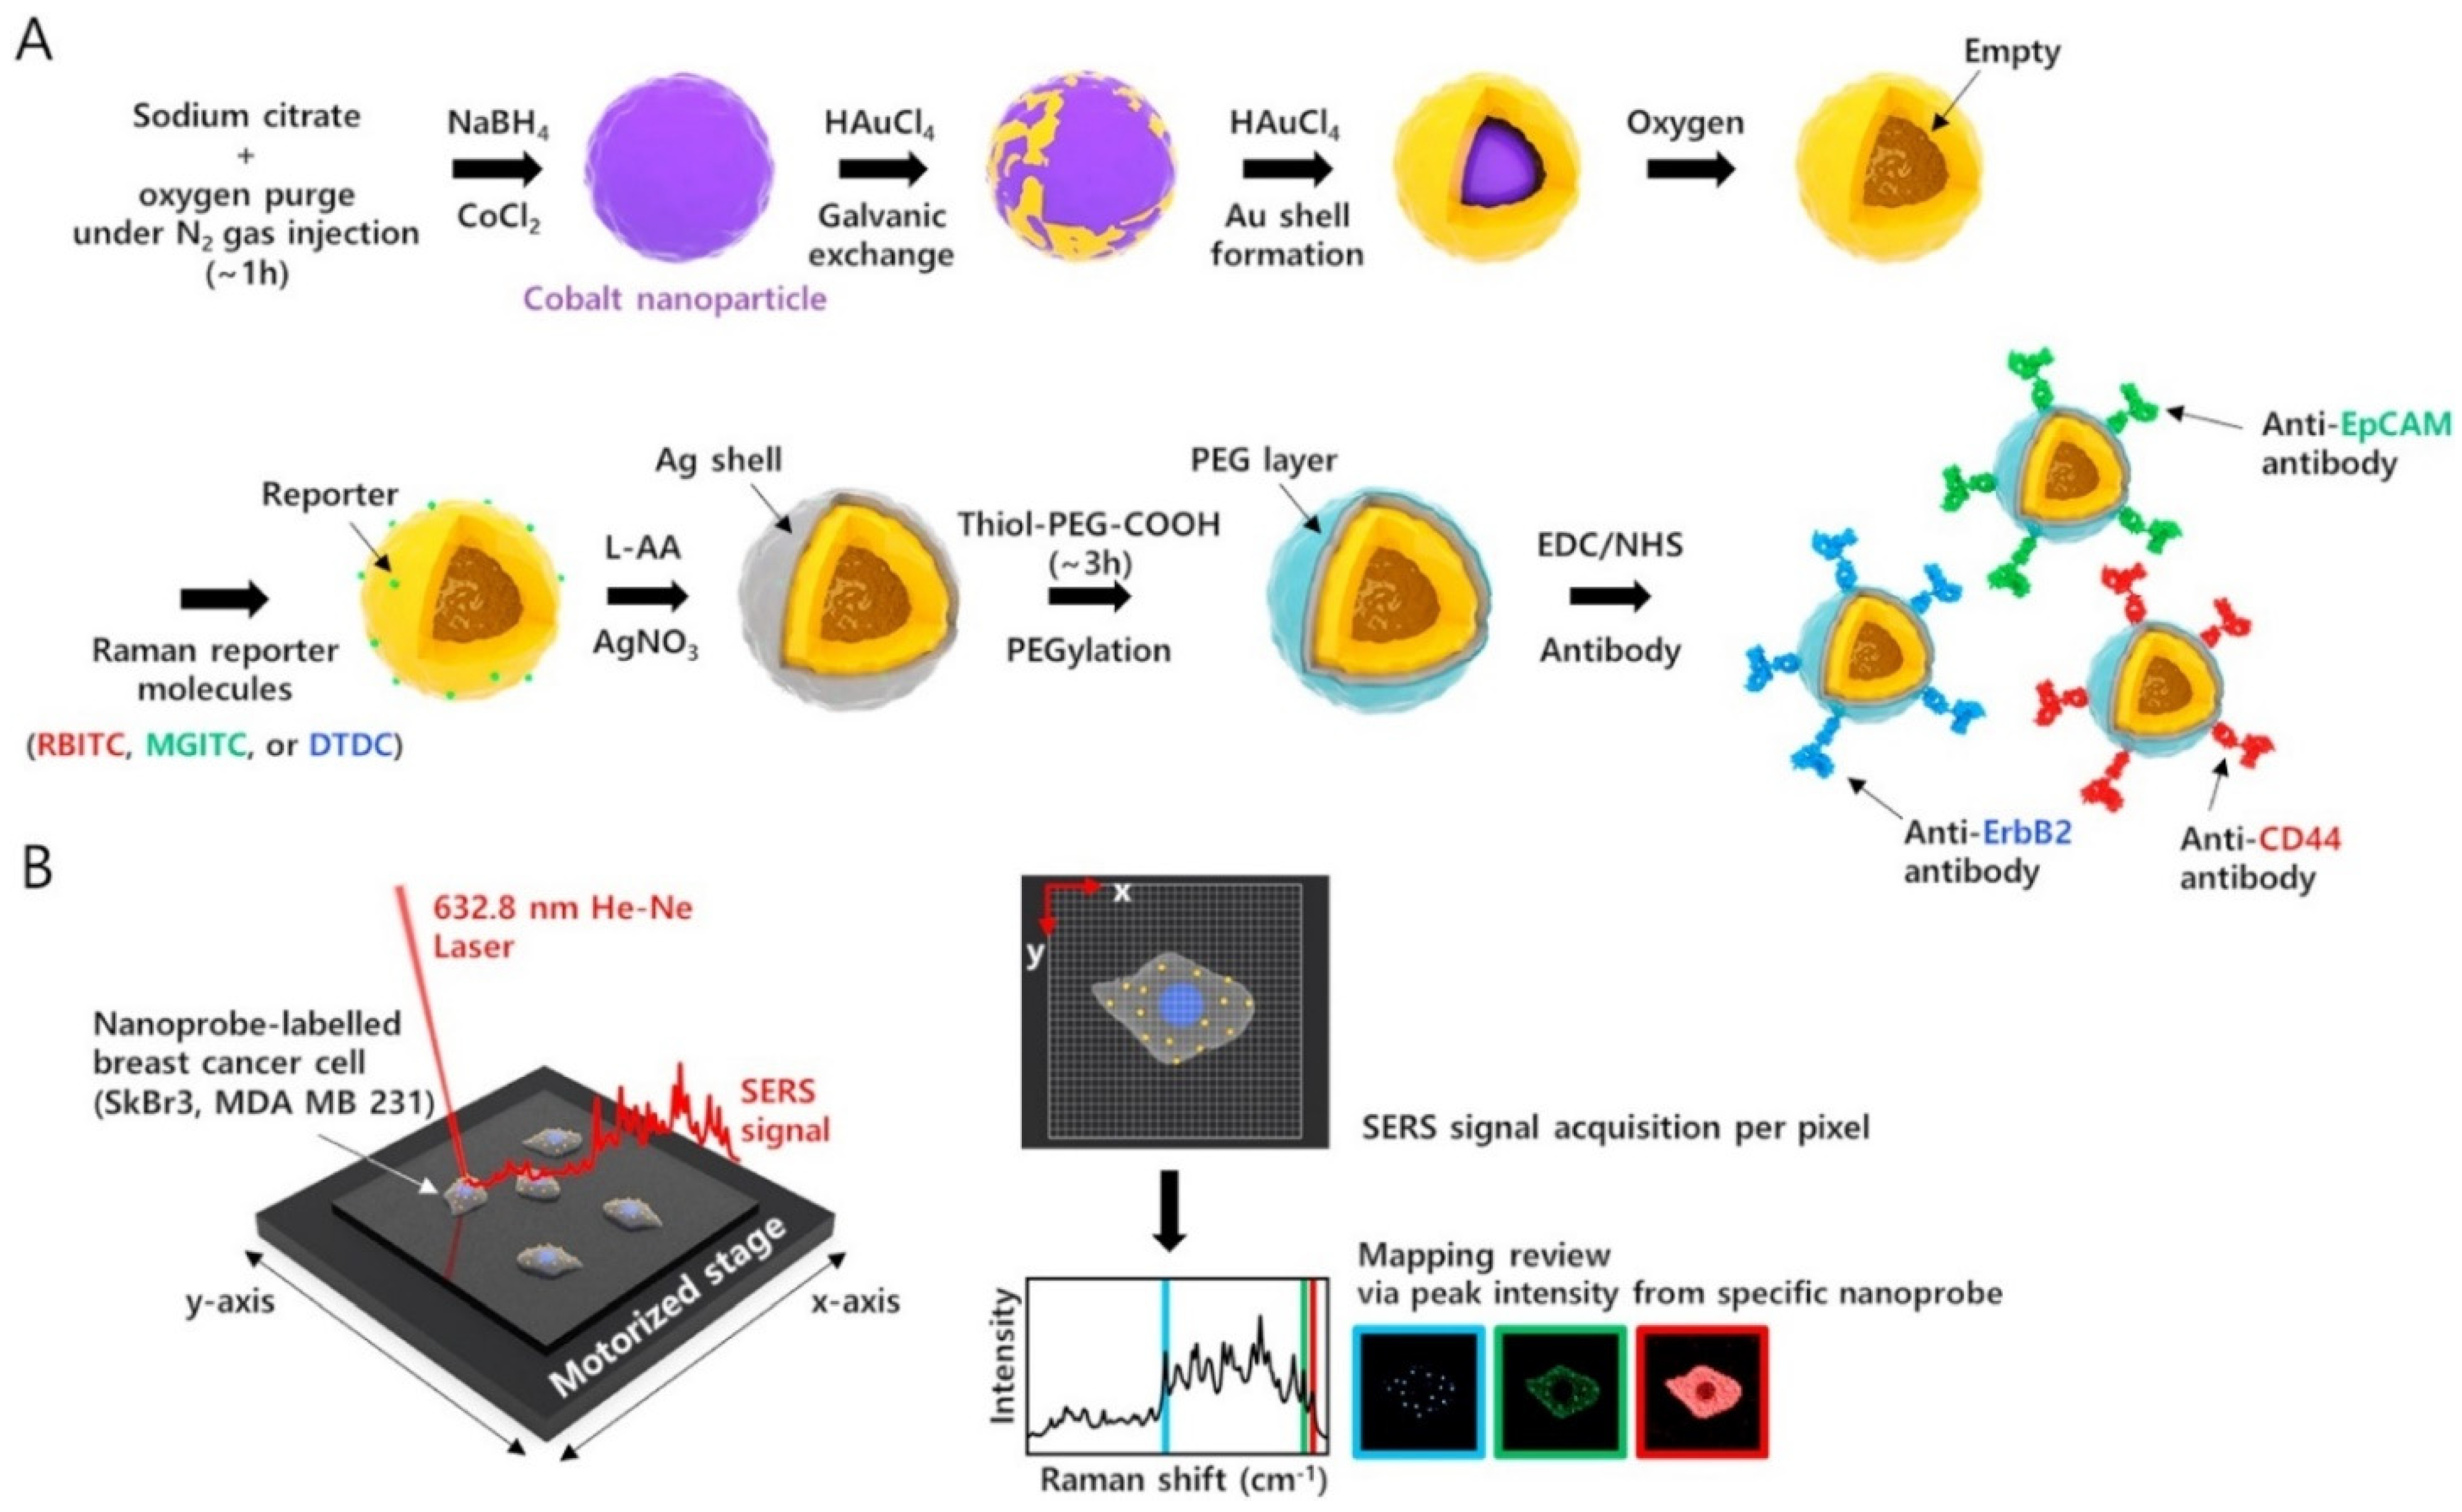
A very elegant example of the multiplexing possibilities of SERS measurements of disease markers overexpressed on a cellular surface was shown by Choi et al. [129]. This group formed SERS nanotags for the simultaneous detection of three breast cancer markers (CD44, ErbB2, EpCAM) on human adenocarcinoma cell lines, and then implemented the simultaneous expression of all these breast cancer markers on the cellular surface (see Figure 23) [129]. In such experiments, the use of magnetic nanoparticles makes it possible to additionally separate cells expressing different markers on their surface [136]. Kim et al. functionalized the surface of Au@Fe2O3@SiO2 nanostructures with cyclic peptides in order to improve their binding efficiency and rigidity, since cyclic peptides are more stable, potent, and specific than linear ones (see Figure 24).
In our subjective opinion, the Holy Grail of SERS applications in medicine would be the real-time use of this method during surgery. Apart from detecting tumour regions, the SERS technique could be of tremendous help in visualizing tumour margins, since during resection a large stock of tissue around the tumour is excised as a precaution, since no clear border is visible. Experiments carried out on mice show the potential of this technique in this field [137]. For example, Karabeber et al. explored a hand-held Raman scanner, guided by surface-enhanced Raman scattering (SERS) nanoparticles, to identify the extent of a microscopic tumour in a genetically engineered RCAS/tv-a glioblastoma mouse model [138]. Mice were injected with SERS-active Au@SiO2 nanoparticles via the tail vein; these were allowed to circulate for 24 h to make sure they accumulated in the tumours. Afterwards, the brains were harvested, fixed in 4% paraformaldehyde, and measured. The SERS nanoparticles accurately outlined the extent of the tumours, and a hand-held Raman probe allowed near real-time scanning.
In another experiment, Rotter et al. used SERS in order to monitor an epidermal growth factor receptor and a human epidermal growth factor receptor 2 in intracerebral and peripheral tumours [135]. They injected nanoparticles functionalized with cetuximab or trastuzumab via the tail, and performed Raman imaging after 18 h in the excised tumours, and in vivo through the skull. The advantages of this procedure over biopsy are that, firstly, the latter is invasive, and secondly, because it is performed on only a very small piece of tissue, it can miss the heterogeneity of the whole tumour. Therefore, in study [137], apart from a ‘yes/no’ answer, the authors were able to quantify the levels of expression of the surface markers in different regions of the tumour.
5. Conclusions and Future Prospects
Surface-enhanced Raman spectroscopy has advanced greatly since its discovery almost five decades ago, and has moved from being a physicochemical technique used to study the adsorption of simple compounds (such as pyridine and its derivatives) on silver or gold, to become a technique that allows the identification in body fluids of even very complex compounds, such as DNA of a given sequence, or specific large proteins used by the immune system (e.g., antibodies).
In this article, we reviewed what we believe are some of the most interesting recent applications of SERS spectroscopy in medical diagnostics, with special attention paid to detection of DNA/RNA, bacteria, viruses, drugs, and various disease markers in cells, tissues, and body fluids. We described advantages and pitfalls of different experimental approaches, focusing on label-free SERS as the fastest, and lab-on-chip as closest to clinical applications. Moreover, we described methods that allow the simultaneous determination of many different compounds in a concentration range relevant to actual clinical samples. Despite the huge number of scientific articles devoted to the detection of medically important compounds by means of SERS spectroscopy (which illustrates the intensity of research in this field)—for example, the number of articles found in the Scopus database that contain a combination of two keywords: ‘SERS’ and ‘DNA’ in the title or abstract is 9.7 × 10³ (results from 20 March 2022)—there is still plenty of room for improvement. The main problem is the reproducibility of the results of analyses carried out using SERS spectroscopy—it seems that before being introduced into clinical practice, the SERS sensors being developed will have to be tested on a much larger number of clinical samples than has been done in research published recently. The second problem involves the complex procedure required to analyze many medical samples using SERS spectroscopy. The ideal solution would seem to be a wider use of the ‘lab-on-a-chip’ approach—carrying out practical SERS measurements using a pad whose action is similar to that of a pregnancy test. Here, the important problem is achieving the required reproducibility and stability of the plasmonic systems that must be used as a key element in all SERS sensors. Despite the fact that many problems still need to be resolved before we see SERS spectroscopy being widely used in clinical analytics, we hope that this review will convince readers that SERS spectroscopy is indeed a very promising method for use in medical diagnoses.
Author Contributions
Conceptualization, A.S.; literature searching and writing fragments of the manuscript, A.S., E.P., D.K., K.M., and A.K.; first draft preparation, A.S.; editing of the manuscript and preparation of final version, A.S. and A.K.; funding acquisition, A.S. All authors have read and agreed to the published version of the manuscript.
Funding
This work was funded by the National Science Centre, Poland, grant SONATA, No. UMO-2020/39/D/ST4/01973.
Institutional Review Board Statement
Not applicable.
Informed Consent Statement
Not applicable.
Acknowledgments
This work was funded by the National Science Centre, Poland, grant SONATA, No. UMO-2020/39/D/ST4/01973. E.P.’s work was implemented as a part of Operational Project Knowledge Education Development 2014–2020 co-financed by European Social Fund.
Conflicts of Interest
The authors declare no conflict of interest.
References
- Aroca, R. Surface-Enhanced Vibrational Spectroscopy; John Wiley & Sons: Hoboken, NJ, USA, 2006; ISBN 978-0-470-03565-8. [Google Scholar]
- Michaels, A.M.; Nirmal, M.; Brus, L.E. Surface enhanced Raman spectroscopy of individual rhodamine 6G molecules on large Ag nanocrystals. J. Am. Chem. Soc. 1999, 121, 9932–9939. [Google Scholar] [CrossRef]
- Kneipp, K.; Wang, Y.; Kneipp, H.; Perelman, L.T.; Itzkan, I.; Dasari, R.R.; Feld, M.S. Single molecule detection using surface-enhanced Raman scattering (SERS). Phys. Rev. Lett. 1997, 78, 1667–1670. [Google Scholar] [CrossRef] [Green Version]
- Nie, S.; Emory, S.R. Probing single molecules and single nanoparticles by surface-enhanced Raman scattering. Science 1997, 275, 1102–1106. [Google Scholar] [CrossRef] [PubMed]
- Fleischmann, M.; Hendra, P.J.; McQuillan, A.J. Raman spectra of pyridine adsorbed at a silver electrode. Chem. Phys. Lett. 1974, 26, 163–166. [Google Scholar] [CrossRef]
- Jeanmaire, D.L.; Van Duyne, R.P. Surface Raman spectroelectrochemistry: Part I heterocyclic, aromatic, and aliphatic amines adsorbed on the anodized silver electrode. J. Electroanal. Chem. Interfacial Electrochem. 1977, 84, 1–20. [Google Scholar] [CrossRef]
- Albrecht, M.G.; Creighton, J.A. Anomalously intense Raman spectra of pyridine at a silver electrode. J. Am. Chem. Soc. 1977, 99, 5215–5217. [Google Scholar] [CrossRef]
- Kelly, K.L.; Coronado, E.; Zhao, L.L.; Schatz, G.C. The optical properties of metal nanoparticles: The influence of size, shape, and dielectric environment. J. Phys. Chem. B 2003, 107, 668–677. [Google Scholar] [CrossRef]
- Etchegoin, P.G.; Le Ru, E.C. Basic electromagnetic theory of SERS. In Surface Enhanced Raman Spectroscopy; Schlücker, S., Ed.; Wiley-VCH Verlag GmbH & Co., KGaA: Weinheim, Germany, 2010; pp. 1–37. ISBN 978-3-527-63275-6. [Google Scholar]
- Hao, E.; Schatz, G.C. Electromagnetic fields around silver nanoparticles and dimers. J. Chem. Phys. 2004, 120, 357–366. [Google Scholar] [CrossRef] [Green Version]
- Mahmoud, M.A.; O’Neil, D.; El-Sayed, M.A. Hollow and solid metallic nanoparticles in sensing and in nanocatalysis. Chem. Mater. 2014, 26, 44–58. [Google Scholar] [CrossRef]
- Kudelski, A. Raman spectroscopy of surfaces. Surf. Sci. 2009, 603, 1328–1334. [Google Scholar] [CrossRef]
- Sur, U.K. Surface-enhanced Raman spectroscopy. Reson 2010, 15, 154–164. [Google Scholar] [CrossRef]
- Kudelski, A.; Bukowska, J. The chemical effect in surface enhanced Raman scattering (SERS) for piperidine adsorbed on a silver electrode. Surf. Sci. 1996, 368, 396–400. [Google Scholar] [CrossRef]
- Jiang, X.; Campion, A. Chemical effects in surface-enhanced Raman scattering: Pyridine chemisorbed on silver adatoms on Rh (100). Chem. Phys. Lett. 1987, 140, 95–100. [Google Scholar] [CrossRef]
- Zheng, X.-S.; Jahn, I.J.; Weber, K.; Cialla-May, D.; Popp, J. Label-free SERS in biological and biomedical applications: Recent progress, current challenges and opportunities. Spectrochim. Acta Part A Mol. Biomol. Spectrosc. 2018, 197, 56–77. [Google Scholar] [CrossRef] [PubMed]
- Szaniawska, A.; Kudelski, A. Applications of surface-enhanced Raman scattering in biochemical and medical analysis. Front. Chem. 2021, 9, 664134. [Google Scholar] [CrossRef]
- Li, D.; Zhang, Z.; Wang, X.; Wang, Y.; Gao, X.; Li, Y. A direct method for detecting proteins in body fluids by surface-enhanced Raman spectroscopy under native conditions. Biosens. Bioelectron. 2022, 200, 113907. [Google Scholar] [CrossRef] [PubMed]
- Prakash, O.; Sil, S.; Verma, T.; Umapathy, S. Direct detection of bacteria using positively charged Ag/Au bimetallic nanoparticles: A Label-free surface-enhanced Raman scattering study coupled with multivariate analysis. J. Phys. Chem. C 2020, 124, 861–869. [Google Scholar] [CrossRef] [Green Version]
- Hunter, R.; Sohi, A.N.; Khatoon, Z.; Berthiaume, V.R.; Alarcon, E.I.; Godin, M.; Anis, H. Optofluidic label-free SERS platform for rapid bacteria detection in serum. Sens. Actuators B Chem. 2019, 300, 126907. [Google Scholar] [CrossRef]
- Hao, N.; Wang, Z.; Liu, P.; Becker, R.; Yang, S.; Yang, K.; Pei, Z.; Zhang, P.; Xia, J.; Shen, L.; et al. Acoustofluidic multimodal diagnostic system for alzheimer’s disease. Biosens. Bioelectron. 2022, 196, 113730. [Google Scholar] [CrossRef]
- Gahlaut, S.K.; Savargaonkar, D.; Sharan, C.; Yadav, S.; Mishra, P.; Singh, J.P. SERS platform for dengue diagnosis from clinical samples employing a hand held Raman spectrometer. Anal. Chem. 2020, 92, 2527–2534. [Google Scholar] [CrossRef]
- Ma, Y.; Chi, J.; Zheng, Z.; Attygalle, A.; Kim, I.Y.; Du, H. Therapeutic prognosis of prostate cancer using surface-enhanced Raman scattering of patient urine and multivariate statistical analysis. J. Biophotonics 2021, 14, e202000275. [Google Scholar] [CrossRef] [PubMed]
- Chen, X.; Li, X.; Yang, H.; Xie, J.; Liu, A. Diagnosis and staging of diffuse large B-cell lymphoma using label-free surface-enhanced Raman spectroscopy. Spectrochim. Acta Part A Mol. Biomol. Spectrosc. 2022, 267, 120571. [Google Scholar] [CrossRef] [PubMed]
- Lin, J.; Huang, Z.; Lin, X.; Wu, Q.; Quan, K.; Cheng, Y.; Zheng, M.; Xu, J.; Dai, Y.; Qiu, H.; et al. Rapid and label-free urine test based on surface-enhanced Raman spectroscopy for the non-invasive detection of colorectal cancer at different stages. Biomed. Opt. Express BOE 2020, 11, 7109–7119. [Google Scholar] [CrossRef] [PubMed]
- Moisoiu, T.; Dragomir, M.P.; Iancu, S.D.; Schallenberg, S.; Birolo, G.; Ferrero, G.; Burghelea, D.; Stefancu, A.; Cozan, R.G.; Licarete, E.; et al. Combined MiRNA and SERS urine liquid biopsy for the point-of-care diagnosis and molecular stratification of bladder cancer. Mol. Med. 2022, 28, 39. [Google Scholar] [CrossRef]
- Ye, M.; Chen, Y.; Wang, Y.; Xiao, L.; Lin, Q.; Lin, H.; Duan, Z.; Feng, S.; Cao, Y.; Zhang, J.; et al. Subtype discrimination of acute myeloid leukemia based on plasma SERS technique. Spectrochim. Acta Part A Mol. Biomol. Spectrosc. 2022, 271, 120865. [Google Scholar] [CrossRef]
- Kim, S.; Kim, T.G.; Lee, S.H.; Kim, W.; Bang, A.; Moon, S.W.; Song, J.; Shin, J.-H.; Yu, J.S.; Choi, S. Label-free surface-enhanced Raman spectroscopy biosensor for on-site breast cancer detection using human tears. ACS Appl. Mater. Interfaces 2020, 12, 7897–7904. [Google Scholar] [CrossRef]
- Shin, H.; Oh, S.; Hong, S.; Kang, M.; Kang, D.; Ji, Y.; Choi, B.H.; Kang, K.-W.; Jeong, H.; Park, Y.; et al. Early-stage lung cancer diagnosis by deep learning-based spectroscopic analysis of circulating exosomes. ACS Nano 2020, 14, 5435–5444. [Google Scholar] [CrossRef]
- Zhang, B.Y.; Yin, P.; Hu, Y.; Szydzik, C.; Khan, M.W.; Xu, K.; Thurgood, P.; Mahmood, N.; Dekiwadia, C.; Afrin, S.; et al. Highly accurate and label-free discrimination of single cancer cell using a plasmonic oxide-based nanoprobe. Biosens. Bioelectron. 2022, 198, 113814. [Google Scholar] [CrossRef]
- Dey, P.; Vaideanu, A.; Mosca, S.; Salimi, M.; Gardner, B.; Palombo, F.; Uchegbu, I.; Baumberg, J.; Schatzlein, A.; Matousek, P.; et al. Surface enhanced deep Raman detection of cancer tumour through 71 mm of heterogeneous tissue. Nanotheranostics 2022, 6, 337–349. [Google Scholar] [CrossRef]
- Nikelshparg, E.I.; Baizhumanov, A.A.; Bochkova, Z.V.; Novikov, S.M.; Yakubovsky, D.I.; Arsenin, A.V.; Volkov, V.S.; Goodilin, E.A.; Semenova, A.A.; Sosnovtseva, O.; et al. Detection of hypertension-induced changes in erythrocytes by SERS nanosensors. Biosensors 2022, 12, 32. [Google Scholar] [CrossRef]
- Zyubin, A.; Rafalskiy, V.; Tcibulnikova, A.; Moiseeva, E.; Matveeva, K.; Tsapkova, A.; Lyatun, I.; Medvedskaya, P.; Samusev, I.; Demin, M. Surface-enhanced raman spectroscopy for antiplatelet therapy effectiveness assessment. Laser Phys. Lett. 2020, 17, 045601. [Google Scholar] [CrossRef]
- Li, X.; Yang, T.; Li, C.S.; Song, Y.; Wang, D.; Jin, L.; Lou, H.; Li, W. Polymerase chain reaction—Surface-enhanced Raman spectroscopy (PCR-SERS) method for gene methylation level detection in plasma. Theranostics 2020, 10, 898–909. [Google Scholar] [CrossRef] [PubMed]
- Sánchez-Purrà, M.; Roig-Solvas, B.; Rodriguez-Quijada, C.; Leonardo, B.M.; Hamad-Schifferli, K. Reporter selection for nanotags in multiplexed surface enhanced raman spectroscopy assays. ACS Omega 2018, 3, 10733–10742. [Google Scholar] [CrossRef] [PubMed]
- Laing, S.; Gracie, K.; Faulds, K. Multiplex in vitro detection using SERS. Chem. Soc. Rev. 2016, 45, 1901–1918. [Google Scholar] [CrossRef] [Green Version]
- Yu, J.H.; Steinberg, I.; Davis, R.M.; Malkovskiy, A.V.; Zlitni, A.; Radzyminski, R.K.; Jung, K.O.; Chung, D.T.; Curet, L.D.; D’Souza, A.L.; et al. Noninvasive and highly multiplexed five-color tumor imaging of multicore near-infrared resonant surface-enhanced Raman nanoparticles in vivo. ACS Nano 2021, 15, 19956–19969. [Google Scholar] [CrossRef]
- Zavaleta, C.L.; Smith, B.R.; Walton, I.; Doering, W.; Davis, G.; Shojaei, B.; Natan, M.J.; Gambhir, S.S. Multiplexed imaging of surface enhanced raman scattering nanotags in living mice using noninvasive Raman spectroscopy. Proc. Natl. Acad. Sci. USA 2009, 106, 13511–13516. [Google Scholar] [CrossRef] [Green Version]
- Bronkhorst, A.J.; Ungerer, V.; Holdenrieder, S. The emerging role of cell-free DNA as a molecular marker for cancer management. Biomol. Detect. Quantif. 2019, 17, 100087. [Google Scholar] [CrossRef]
- Pyrak, E.; Krajczewski, J.; Kowalik, A.; Kudelski, A.; Jaworska, A. Surface enhanced Raman spectroscopy for DNA biosensors—How far are we? Molecules 2019, 24, 4423. [Google Scholar] [CrossRef] [Green Version]
- Zhang, J.; Dong, Y.; Zhu, W.; Xie, D.; Zhao, Y.; Yang, D.; Li, M. Ultrasensitive detection of circulating tumor DNA of lung cancer via an enzymatically amplified SERS-based frequency shift assay. ACS Appl. Mater. Interfaces 2019, 11, 18145–18152. [Google Scholar] [CrossRef]
- Zhu, H.; Zhang, H.; Xu, Y.; Laššáková, S.; Korabečná, M.; Neužil, P. PCR past, present and future. BioTechniques 2020, 69, 317–325. [Google Scholar] [CrossRef]
- Garcia-Rico, E.; Alvarez-Puebla, R.A.; Guerrini, L. Direct surface-enhanced Raman scattering (SERS) spectroscopy of nucleic acids: From fundamental studies to real-life applications. Chem. Soc. Rev. 2018, 47, 4909–4923. [Google Scholar] [CrossRef] [PubMed]
- Iancu, S.D.; Stefancu, A.; Moisoiu, V.; Leopold, L.F.; Leopold, N. The role of Ag+, Ca2+, Pb2+ and Al3+ adions in the SERS Turn-on effect of anionic analytes. Beilstein J. Nanotechnol. 2019, 10, 2338–2345. [Google Scholar] [CrossRef] [PubMed] [Green Version]
- Yu, Z.; Grasso, M.F.; Cui, X.; Silva, R.N.; Zhang, P. Sensitive and label-free SERS detection of single-stranded DNA assisted by silver nanoparticles and gold-coated magnetic nanoparticles. ACS Appl. Bio Mater. 2020, 3, 2626–2632. [Google Scholar] [CrossRef] [PubMed]
- Safaee Ardekani, G.; Jafarnejad, S.M.; Tan, L.; Saeedi, A.; Li, G. The Prognostic Value of BRAF Mutation in Colorectal Cancer and Melanoma: A Systematic Review and Meta-Analysis. PLoS ONE 2012, 7, e47054. [Google Scholar] [CrossRef] [PubMed] [Green Version]
- Xing, M. BRAF mutation in thyroid cancer. Endocr. Relat. Cancer 2005, 12, 245–262. [Google Scholar] [CrossRef] [Green Version]
- Roberts, P.J.; Stinchcombe, T.E. KRAS mutation: Should We test for it, and does it matter. J. Clin. Oncol. 2013, 31, 1112–1121. [Google Scholar] [CrossRef]
- Tan, C.; Du, X. KRAS mutation testing in metastatic colorectal cancer. World J. Gastroenterol. WJG 2012, 18, 5171. [Google Scholar] [CrossRef]
- Lyu, N.; Rajendran, V.K.; Diefenbach, R.J.; Charles, K.; Clarke, S.J.; Engel, A.; Rizos, H.; Molloy, M.P.; Wang, Y. Multiplex detection of CtDNA mutations in plasma of colorectal cancer patients by PCR/SERS assay. Nanotheranostics 2020, 4, 224. [Google Scholar] [CrossRef]
- Lee, H.G.; Choi, W.; Yang, S.Y.; Kim, D.H.; Park, S.G.; Lee, M.Y.; Jung, H.S. PCR-coupled paper-based surface-enhanced Raman scattering (SERS) sensor for rapid and sensitive detection of respiratory bacterial DNA. Sens. Actuators B Chem. 2021, 326, 128802. [Google Scholar] [CrossRef]
- Kim, M.; Costello, J. DNA methylation: An epigenetic mark of cellular memory. Exp. Mol. Med. 2017, 49, e322. [Google Scholar] [CrossRef] [Green Version]
- Luczak, M.W.; Jagodziński, P.P. The role of DNA methylation in cancer development. Folia Histochem. Cytobiol. 2006, 44, 143–154. [Google Scholar] [PubMed]
- Kurdyukov, S.; Bullock, M. DNA methylation analysis: Choosing the right method. Biology 2016, 5, 3. [Google Scholar] [CrossRef] [PubMed]
- Ganesh, S.; Venkatakrishnan, K.; Tan, B. Quantum scale organic semiconductors for SERS detection of DNA methylation and gene expression. Nat. Commun. 2020, 11, 1135. [Google Scholar] [CrossRef] [Green Version]
- Stefancu, A.; Moisoiu, V.; Desmirean, M.; Iancu, S.D.; Tigu, A.B.; Petrushev, B.; Jurj, A.; Cozan, R.G.; Budisan, L.; Fetica, B.; et al. SERS-based DNA methylation profiling allows the differential diagnosis of malignant lymphadenopathy. Spectrochim. Acta Part A Mol. Biomol. Spectrosc. 2022, 264, 120216. [Google Scholar] [CrossRef] [PubMed]
- Lu, T.X.; Rothenberg, M.E. MicroRNA. J. Allergy Clin. Immunol. 2018, 141, 1202–1207. [Google Scholar] [CrossRef] [PubMed] [Green Version]
- Han, Y.; Qiang, L.; Gao, Y.; Gao, J.; He, Q.; Liu, H.; Han, L.; Zhang, Y. Large-area surface-enhanced Raman spectroscopy substrate by hybrid porous GaN with Au/Ag for breast cancer MiRNA detection. Appl. Surf. Sci. 2021, 541, 148456. [Google Scholar] [CrossRef]
- Sun, Y.; Shi, L.; Mi, L.; Guo, R.; Li, T. Recent progress of SERS optical nanosensors for MiRNA analysis. J. Mater. Chem. B 2020, 8, 5178–5183. [Google Scholar] [CrossRef]
- Schwarzenbach, H.; Hoon, D.S.B.; Pantel, K. Cell-free nucleic acids as biomarkers in cancer patients. Nature Rev. Cancer 2011, 11, 426–437. [Google Scholar] [CrossRef]
- Si, Y.; Xu, L.; Wang, N.; Zheng, J.; Yang, R.; Li, J. Target MicroRNA-responsive DNA hydrogel-based surface-enhanced Raman scattering sensor arrays for MicroRNA-marked cancer screening. Anal. Chem. 2020, 92, 2649–2655. [Google Scholar] [CrossRef]
- Lee, W.J.; Kim, K.J.; Hossain, M.K.; Cho, H.Y.; Choi, J.W. DNA–gold nanoparticle conjugates for intracellular MiRNA detection using surface-enhanced Raman spectroscopy. Biochip J. 2022, 16, 33–40. [Google Scholar] [CrossRef]
- Jiang, S.; Li, Q.; Wang, C.; Pang, Y.; Sun, Z.; Xiao, R. In situ exosomal MicroRNA determination by target-triggered SERS and Fe3O4@TiO2-based exosome accumulation. ACS Sens. 2021, 6, 852–862. [Google Scholar] [CrossRef] [PubMed]
- Saviñon-Flores, F.; Méndez, E.; López-Castaños, M.; Carabarin-Lima, A.; López-Castaños, K.A.; González-Fuentes, M.A.; Méndez-Albores, A. A review on SERS-based detection of human virus infections: Influenza and coronavirus. Biosensors 2021, 11, 66. [Google Scholar] [CrossRef] [PubMed]
- Nasir, S.; Majeed, M.I.; Nawaz, H.; Rashid, N.; Ali, S.; Farooq, S.; Kashif, M.; Rafiq, S.; Bano, S.; Ashraf, M.N.; et al. Surface enhanced Raman spectroscopy of RNA samples extracted from blood of hepatitis C patients for quantification of viral loads. Photodiagnosis Photodyn. Ther. 2021, 33, 102152. [Google Scholar] [CrossRef] [PubMed]
- Dardir, K.; Wang, H.; Martin, B.E.; Atzampou, M.; Brooke, C.B.; Fabris, L. SERS nanoprobe for intracellular monitoring of viral mutations. J. Phys. Chem. C 2020, 124, 3211–3217. [Google Scholar] [CrossRef]
- Jaworska, A.; Fornasaro, S.; Sergo, V.; Bonifacio, A. Potential of surface enhanced raman spectroscopy (SERS) in therapeutic drug monitoring (TDM). A critical review. Biosensors 2016, 6, 47. [Google Scholar] [CrossRef] [Green Version]
- Markina, N.E.; Ustinov, S.N.; Zakharevich, A.M.; Markin, A.V. Copper nanoparticles for SERS-based determination of some cephalosporin antibiotics in spiked human urine. Anal. Chim. Acta 2020, 1138, 9–17. [Google Scholar] [CrossRef]
- Chen, N.; Yuan, Y.; Lu, P.; Wang, L.; Zhang, X.; Zhang, X.; Chen, H.; Ma, P. Detection of carbamazepine in saliva based on surface-enhanced Raman spectroscopy. Biomed. Opt. Express BOE 2021, 12, 7673–7688. [Google Scholar] [CrossRef]
- Barveen, N.R.; Wang, T.-J.; Chang, Y.-H. A Photochemical approach to anchor Au NPs on MXene as a prominent SERS substrate for ultrasensitive detection of chlorpromazine. Mikrochim. Acta 2021, 189, 16. [Google Scholar] [CrossRef]
- Martin, J.H.; Dimmitt, S. The rationale of dose-response curves in selecting cancer drug dosing. Br. J. Clin. Pharmacol. 2019, 85, 2198–2204. [Google Scholar] [CrossRef]
- Clarke, W.A.; Chatelut, E.; Fotoohi, A.K.; Larson, R.A.; Martin, J.H.; Mathijssen, R.H.J.; Salamone, S.J. Therapeutic drug monitoring in oncology: International association of therapeutic drug monitoring and clinical toxicology consensus guidelines for imatinib therapy. Eur. J. Cancer 2021, 157, 428–440. [Google Scholar] [CrossRef]
- Evans, W.E.; Pratt, C.B.; Taylor, R.H.; Barker, L.F.; Crom, W.R. Pharmacokinetic monitoring of high-dose methotrexate. Early recognition of high-risk patients. Cancer Chemother. Pharm. 1979, 3, 161–166. [Google Scholar] [CrossRef] [PubMed]
- Markina, N.E.; Zakharevich, A.M.; Markin, A.V. Determination of methotrexate in spiked human urine using SERS-active sorbent. Anal. Bioanal. Chem. 2020, 412, 7757–7766. [Google Scholar] [CrossRef] [PubMed]
- Panikar, S.S.; Banu, N.; Escobar, E.-R.; García, G.-R.; Cervantes-Martínez, J.; Villegas, T.-C.; Salas, P.; De la Rosa, E. Stealth modified bottom up SERS substrates for label-free therapeutic drug monitoring of doxorubicin in blood serum. Talanta 2020, 218, 121138. [Google Scholar] [CrossRef] [PubMed]
- Thorn, C.F.; Oshiro, C.; Marsh, S.; Hernandez-Boussard, T.; McLeod, H.; Klein, T.E.; Altman, R.B. Doxorubicin pathways: Pharmacodynamics and adverse effects. Pharm. Genom. 2011, 21, 440–446. [Google Scholar] [CrossRef]
- Liu, W.; Zhou, S.; Liu, J.; Zhao, X.; Feng, Z.; Wang, D.; Gong, Z.; Fan, M. Quantitative detection of 6-thioguanine in body fluids based on a free-standing liquid membrane SERS substrate. Anal. Bioanal. Chem. 2022, 414, 1663–1670. [Google Scholar] [CrossRef]
- Larsen, R.H.; Rank, C.U.; Grell, K.; Møller, L.N.; Overgaard, U.M.; Kampmann, P.; Nersting, J.; Degn, M.; Nielsen, S.N.; Holst, H.; et al. Increments in DNA-thioguanine level during thiopurine-enhanced maintenance therapy of acute lymphoblastic leukemia. Haematologica 2021, 106, 2824–2833. [Google Scholar] [CrossRef]
- Koch, B.C.P.; Muller, A.E.; Hunfeld, N.G.M.; de Winter, B.C.M.; Ewoldt, T.M.J.; Abdulla, A.; Endeman, H. Therapeutic drug monitoring of antibiotics in critically III patients: Current practice and future perspectives with a focus on clinical outcome. Ther. Drug Monit. 2022, 44, 11–18. [Google Scholar] [CrossRef]
- Wang, X.; Liu, X.; Wang, X.; Wang, Y.; Xiao, Y.; Zhuo, Z.; Li, Y. A versatile technique based on surface-enhanced Raman spectroscopy for label-free detection of amino acids and peptide formation in body fluids. Mikrochim. Acta 2022, 189, 82. [Google Scholar] [CrossRef]
- Markina, N.E.; Markin, A.V.; Weber, K.; Popp, J.; Cialla-May, D. Liquid-liquid extraction-assisted SERS-based determination of sulfamethoxazole in spiked human urine. Anal. Chim. Acta 2020, 1109, 61–68. [Google Scholar] [CrossRef]
- Dina, N.E.; Gherman, A.M.R.; Colniță, A.; Marconi, D.; Sârbu, C. Fuzzy characterization and classification of bacteria species detected at single-cell level by surface-enhanced Raman scattering. Spectrochim. Acta Part A Mol. Biomol. Spectrosc. 2021, 247, 119149. [Google Scholar] [CrossRef]
- Ding, J.; Lin, Q.; Zhang, J.; Young, G.M.; Jiang, C.; Zhong, Y.; Zhang, J. Rapid identification of pathogens by using surface-enhanced Raman spectroscopy and multi-scale convolutional neural network. Anal. Bioanal. Chem. 2021, 413, 3801–3811. [Google Scholar] [CrossRef] [PubMed]
- Nowicka, A.B.; Czaplicka, M.; Szymborski, T.; Kamińska, A. Combined negative dielectrophoresis with a flexible SERS plat-form as a novel strategy for rapid detection and identification of bacteria. Anal. Bioanal. Chem. 2021, 413, 2007–2020. [Google Scholar] [CrossRef] [PubMed]
- Jin, L.; Wang, S.; Shao, Q.; Cheng, Y. A Rapid and facile analytical approach to detecting salmonella enteritidis with ap-tamer-based surface-enhanced Raman spectroscopy. Spectrochim. Acta Part A Mol. Biomol. Spectrosc. 2022, 267, 120625. [Google Scholar] [CrossRef] [PubMed]
- Zhu, A.; Ali, S.; Xu, Y.; Ouyang, Q.; Chen, Q. A SERS aptasensor based on AuNPs functionalized PDMS film for selective and sensitive detection of staphylococcus aureus. Biosens. Bioelectron. 2021, 172, 112806. [Google Scholar] [CrossRef] [PubMed]
- Yang, E.; Li, D.; Yin, P.; Xie, Q.; Li, Y.; Lin, Q.; Duan, Y. A novel surface-enhanced Raman scattering (SERS) strategy for ultrasensitive detection of bacteria based on three-dimensional (3D) DNA walker. Biosens. Bioelectron. 2021, 172, 112758. [Google Scholar] [CrossRef] [PubMed]
- Díaz-Amaya, S.; Lin, L.-K.; Deering, A.J.; Stanciu, L.A. Aptamer-based SERS biosensor for whole cell analytical detection of E. coli O157:H7. Anal. Chim. Acta 2019, 1081, 146–156. [Google Scholar] [CrossRef]
- Wang, X.-Y.; Yang, J.-Y.; Wang, Y.-T.; Zhang, H.-C.; Chen, M.-L.; Yang, T.; Wang, J.-H. M13 phage-based nanoprobe for SERS detection and inactivation of staphylococcus aureus. Talanta 2021, 221, 121668. [Google Scholar] [CrossRef]
- Pang, Y.; Wan, N.; Shi, L.; Wang, C.; Sun, Z.; Xiao, R.; Wang, S. Dual-recognition surface-enhanced Raman scattering (SERS) biosensor for pathogenic bacteria detection by using vancomycin-SERS tags and aptamer-Fe3O4@Au. Anal. Chim. Acta 2019, 1077, 288–296. [Google Scholar] [CrossRef]
- Li, A.; Zuo, P.; Ye, B.-C. An aptamer biosensor based dual signal amplification system for the detection of salmonella typhimurium. Anal. Biochem. 2021, 615, 114050. [Google Scholar] [CrossRef]
- Xie, B.; Wang, Z.-P.; Zhang, R.; Zhang, Z.; He, Y. A SERS aptasensor based on porous Au-NC nanoballoons for staphylococcus aureus detection. Anal. Chim. Acta 2022, 1190, 339175. [Google Scholar] [CrossRef]
- Tian, T.; Yi, J.; Liu, Y.; Li, B.; Liu, Y.; Qiao, L.; Zhang, K.; Liu, B. Self-assembled plasmonic nanoarrays for enhanced bacterial identification and discrimination. Biosens. Bioelectron. 2022, 197, 113778. [Google Scholar] [CrossRef] [PubMed]
- Gukowsky, J.C.; Yang, T.; He, L. Assessment of three SERS approaches for studying E. coli O157:H7 susceptibility to ampicillin. Spectrochim. Acta Part A Mol. Biomol. Spectrosc. 2022, 264, 120239. [Google Scholar] [CrossRef] [PubMed]
- Andrei, C.-C.; Moraillon, A.; Lau, S.; Félidj, N.; Yamakawa, N.; Bouckaert, J.; Larquet, E.; Boukherroub, R.; Ozanam, F.; Szunerits, S.; et al. Rapid and sensitive identification of uropathogenic escherichia coli using a surface-enhanced-Raman-scattering-based biochip. Talanta 2020, 219, 121174. [Google Scholar] [CrossRef] [PubMed]
- Wu, Y.; Dang, H.; Park, S.-G.; Chen, L.; Choo, J. SERS-PCR assays of SARS-CoV-2 target genes using au nanoparti-cles-internalized Au nanodimple substrates. Biosens. Bioelectron. 2022, 197, 113736. [Google Scholar] [CrossRef]
- Cha, H.; Kim, H.; Joung, Y.; Kang, H.; Moon, J.; Jang, H.; Park, S.; Kwon, H.-J.; Lee, I.-C.; Kim, S.; et al. Surface-enhanced Raman scattering-based immunoassay for severe acute respiratory syndrome coronavirus 2. Biosens. Bioelectron. 2022, 202, 114008. [Google Scholar] [CrossRef]
- Sanchez, J.E.; Jaramillo, S.A.; Settles, E.; Salazar, J.J.V.; Lehr, A.; Gonzalez, J.; Aranda, C.R.; Navarro-Contreras, H.R.; Rani-ere, M.O.; Harvey, M.; et al. Detection of SARS-CoV-2 and its S and N proteins using surface enhanced Raman spectroscopy. RSC Adv. 2021, 11, 25788–25794. [Google Scholar] [CrossRef]
- Peng, Y.; Lin, C.; Long, L.; Masaki, T.; Tang, M.; Yang, L.; Liu, J.; Huang, Z.; Li, Z.; Luo, X.; et al. Charge-transfer resonance and electromagnetic enhancement synergistically enabling MXenes with excellent sers sensitivity for SARS-CoV-2 S protein detection. Nanomicro. Lett. 2021, 13, 52. [Google Scholar] [CrossRef]
- Yang, Y.; Peng, Y.; Lin, C.; Long, L.; Hu, J.; He, J.; Zeng, H.; Huang, Z.; Li, Z.-Y.; Tanemura, M.; et al. Human ACE2-functionalized gold “Virus-Trap” nanostructures for accurate capture of SARS-CoV-2 and single-virus SERS detection. Nano-Micro Lett. 2021, 13, 109. [Google Scholar] [CrossRef]
- Zavyalova, E.; Ambartsumyan, O.; Zhdanov, G.; Gribanyov, D.; Gushchin, V.; Tkachuk, A.; Rudakova, E.; Nikiforova, M.; Kuznetsova, N.; Popova, L.; et al. SERS-based aptasensor for rapid quantitative detection of SARS-CoV-2. Nanomaterials 2021, 11, 1394. [Google Scholar] [CrossRef]
- Chen, H.; Park, S.-G.; Choi, N.; Kwon, H.-J.; Kang, T.; Lee, M.-K.; Choo, J. Sensitive detection of SARS-CoV-2 using a SERS-based aptasensor. ACS Sens. 2021, 6, 2378–2385. [Google Scholar] [CrossRef]
- Gao, Y.; Han, Y.; Wang, C.; Qiang, L.; Gao, J.; Wang, Y.; Liu, H.; Han, L.; Zhang, Y. Rapid and sensitive triple-mode detection of causative SARS-CoV-2 virus specific genes through interaction between genes and nanoparticles. Anal. Chim. Acta 2021, 1154, 338330. [Google Scholar] [CrossRef] [PubMed]
- Zhang, M.; Li, X.; Pan, J.; Zhang, Y.; Zhang, L.; Wang, C.; Yan, X.; Liu, X.; Lu, G. Ultrasensitive detection of SARS-CoV-2 spike protein in untreated saliva using SERS-based biosensor. Biosens. Bioelectron. 2021, 190, 113421. [Google Scholar] [CrossRef] [PubMed]
- Mochalov, K.; Samokhvalov, P.; Nifontova, G.; Tsoi, T.; Sukhanova, A.; Nabiev, I. Surface-enhanced Raman scattering of CoV-SARS-2 viral proteins in a strong coupling regime. J. Phys. Conf. Ser. 2021, 2058, 012020. [Google Scholar] [CrossRef]
- Zhang, D.; Zhang, X.; Ma, R.; Deng, S.; Wang, X.; Wang, X.; Zhang, X.; Huang, X.; Liu, Y.; Li, G.; et al. Ultra-fast and onsite interrogation of severe acute respiratory syndrome coronavirus 2 (SARS-CoV-2) in waters via surface enhanced Raman scattering (SERS). Water Res. 2021, 200, 117243. [Google Scholar] [CrossRef]
- Pramanik, A.; Gao, Y.; Patibandla, S.; Mitra, D.; McCandless, M.G.; Fassero, L.A.; Gates, K.; Tandon, R.; Ray, P.C. The rapid diagnosis and effective inhibition of coronavirus using spike antibody attached gold nanoparticles. Nanoscale Adv. 2021, 3, 1588–1596. [Google Scholar] [CrossRef]
- Dell’Olio, F. Multiplexed liquid biopsy and tumor imaging using surface-enhanced Raman scattering. Biosensors 2021, 11, 449. [Google Scholar] [CrossRef]
- Kowalska, A.A.; Nowicka, A.B.; Szymborski, T.; Piecyk, P.; Kamińska, A. SERS-based sensor for direct L-selectin level determination in plasma samples as alternative method of tumor detection. J. Biophotonics 2021, 14, e202000318. [Google Scholar] [CrossRef]
- Gholami, M.D.; Sonar, P.; Ayoko, G.A.; Izake, E.L. A highly sensitive SERS quenching nanosensor for the determination of tumor necrosis factor alpha in blood. Sens. Actuators B Chem. 2020, 310, 127867. [Google Scholar] [CrossRef]
- Muhammad, M.; Shao, C.; Huang, Q. Aptamer-functionalized Au nanoparticles array as the effective SERS biosensor for label-free detection of interleukin-6 in serum. Sens. Actuators B Chem. 2021, 334, 129607. [Google Scholar] [CrossRef]
- Dong, S.; Wang, Y.; Liu, Z.; Zhang, W.; Yi, K.; Zhang, X.; Zhang, X.; Jiang, C.; Yang, S.; Wang, F.; et al. Beehive-inspired macroporous SERS probe for cancer detection through capturing and analyzing exosomes in plasma. ACS Appl. Mater. Interfaces 2020, 12, 5136–5146. [Google Scholar] [CrossRef]
- Jiang, J.; Liu, H.; Li, X.; Chen, Y.; Gu, C.; Wei, G.; Zhou, J.; Jiang, T. Nonmetallic SERS-based immunosensor byintegrating MoS2 nanoflower and nanosheet towards the direct serum detection of carbohydrate antigen 19-9. Biosens. Bioelectron. 2021, 193, 113481. [Google Scholar] [CrossRef] [PubMed]
- Lim, W.Y.; Goh, C.-H.; Thevarajah, T.M.; Goh, B.T.; Khor, S.M. Using SERS-based microfluidic paper-based device (ΜPAD) for calibration-free quantitative measurement of AMI cardiac biomarkers. Biosens. Bioelectron. 2020, 147, 111792. [Google Scholar] [CrossRef]
- Yang, S.J.; Lee, J.U.; Jeon, M.J.; Sim, S.J. Highly sensitive surface-enhanced Raman scattering-based immunosensor incorporating half antibody-fragment for quantitative detection of alzheimer’s disease biomarker in blood. Anal. Chim. Acta 2022, 1195, 339445. [Google Scholar] [CrossRef] [PubMed]
- Turan, E.; Zengin, A.; Suludere, Z.; Kalkan, N.Ö.; Tamer, U. Construction of a sensitive and selective plasmonic biosensor for prostate specific antigen by combining magnetic molecularly-imprinted polymer and surface-enhanced Raman spectroscopy. Talanta 2022, 237, 122926. [Google Scholar] [CrossRef] [PubMed]
- Song, Y.; Sun, J.; Li, C.; Lin, L.; Gao, F.; Yang, M.; Sun, B.; Wang, Y. Long-term monitoring of blood biomarkers related to intrauterine growth restriction using AgNPs SERS tags-based lateral flow assay. Talanta 2022, 241, 123128. [Google Scholar] [CrossRef] [PubMed]
- False Positive Result—An Overview|ScienceDirect Topics. Available online: https://0-www-sciencedirect-com.brum.beds.ac.uk/topics/medicine-and-dentistry/false-positive-result (accessed on 25 February 2022).
- Song, Y.; Sun, J.; Zhao, S.; Gao, F.; Yuan, H.; Sun, B.; Wang, B.; Wang, Y. Based lateral flow immunosensor for ultrasensitive and selective surface-enhanced Raman spectroscopy stroke biomarkers detection. Appl. Surf. Sci. 2022, 571, 151153. [Google Scholar] [CrossRef]
- Liu, B.; Zheng, S.; Liu, Q.; Gao, B.; Zhao, X.; Sun, F. SERS-based lateral flow immunoassay strip for ultrasensitive and quan-titative detection of acrosomal protein SP10. Microchem. J. 2022, 175, 107191. [Google Scholar] [CrossRef]
- Yan, S.; Liu, C.; Fang, S.; Ma, J.; Qiu, J.; Xu, D.; Li, L.; Yu, J.; Li, D.; Liu, Q. SERS-based lateral flow assay combined with machine learning for highly sensitive quantitative analysis of escherichia coli O157:H7. Anal. Bioanal. Chem. 2020, 412, 7881–7890. [Google Scholar] [CrossRef]
- Yadav, S.; Sadique, M.A.; Ranjan, P.; Kumar, N.; Singhal, A.; Srivastava, A.K.; Khan, R. SERS based lateral flow immunoassay for point-of-care detection of SARS-CoV-2 in clinical samples. ACS Appl. Bio. Mater. 2021, 4, 2974–2995. [Google Scholar] [CrossRef]
- Fornasaro, S.; Alsamad, F.; Baia, M.; de Carvalho, L.A.E.B.; Beleites, C.; Byrne, H.J.; Chiadò, A.; Chis, M.; Chisanga, M.; Daniel, A.; et al. Surface enhanced Raman spectroscopy for quantitative analysis: Results of a large-scale european multi-instrument interlaboratory study. Anal. Chem. 2020, 92, 4053–4064. [Google Scholar] [CrossRef]
- Zhao, Z.; Li, Q.; Dong, Y.; Gong, J.; Li, Z.; Zhang, J. Core-Shell structured gold nanorods on thread-embroidered fabric-based microfluidic device for ex situ detection of glucose and lactate in sweat. Sens. Actuators B Chem. 2022, 353, 131154. [Google Scholar] [CrossRef]
- Zhang, Y.; Zhou, J.; He, Y.; Ye, Y.; An, J. SERS active fibers from wet-spinning of alginate with gold nanoparticles for PH sensing. Spectrochim. Acta Part A Mol. Biomol. Spectrosc. 2022, 271, 120848. [Google Scholar] [CrossRef] [PubMed]
- Ma, H.; Tian, Y.; Jiao, A.; Wang, C.; Zhang, M.; Zheng, L.; Li, S.; Chen, M. Silk fibroin-decorated with tunable Au/Ag nanodendrites: A plastic near-infrared SERS substrate with periodic microstructures for ultra-sensitive monitoring of lactic acid in human sweat. Vib. Spectrosc. 2022, 118, 103330. [Google Scholar] [CrossRef]
- Liu, H.; Dai, E.; Xiao, R.; Zhou, Z.; Zhang, M.; Bai, Z.; Shao, Y.; Qi, K.; Tu, J.; Wang, C.; et al. Development of a SERS-based lateral flow immunoassay for rapid and ultra-sensitive detection of Anti-SARS-CoV-2 IgM/IgG in clinical samples. Sens. Actuators B Chem. 2021, 329, 129196. [Google Scholar] [CrossRef]
- Chen, S.; Meng, L.; Wang, L.; Huang, X.; Ali, S.; Chen, X.; Yu, M.; Yi, M.; Li, L.; Chen, X.; et al. SERS-based lateral flow immunoassay for sensitive and simultaneous detection of Anti-SARS-CoV-2 IgM and IgG antibodies by using gap-enhanced Raman nanotags. Sens. Actuators B Chem. 2021, 348, 130706. [Google Scholar] [CrossRef]
- Choi, N.; Dang, H.; Das, A.; Sim, M.S.; Chung, I.Y.; Choo, J. SERS biosensors for ultrasensitive detection of multiple biomarkers expressed in cancer cells. Biosens. Bioelectron. 2020, 164, 112326. [Google Scholar] [CrossRef]
- Guo, X.; Wu, X.; Sun, M.; Xu, L.; Kuang, H.; Xu, C. Tetrahedron probes for ultrasensitive in situ detection of telomerase and surface glycoprotein activity in living cells. Anal. Chem. 2020, 92, 2310–2315. [Google Scholar] [CrossRef]
- Luo, S.; Ma, L.; Tian, F.; Gu, Y.; Li, J.; Zhang, P.; Yang, G.; Li, H.; Qu, L.-L. Fluorescence and surface-enhanced Raman scattering dual-mode nanoprobe for monitoring telomerase activity in living cells. Microchem. J. 2022, 175, 107171. [Google Scholar] [CrossRef]
- Lv, J.; Chang, S.; Wang, X.; Zhou, Z.; Chen, B.; Qian, R.; Li, D. Live-cell profiling of membrane sialic acids by fluorescence imaging combined with SERS labelling. Sens. Actuators B Chem. 2022, 351, 130877. [Google Scholar] [CrossRef]
- Kapara, A.; Paterson, K.A.F.; Brunton, V.G.; Graham, D.; Zagnoni, M.; Faulds, K. Detection of estrogen receptor alpha and assessment of fulvestrant activity in MCF-7 tumor spheroids using microfluidics and SERS. Anal. Chem. 2021, 93, 5862–5871. [Google Scholar] [CrossRef]
- Zhang, Y.; Tran, V.; Adanalic, M.; Schlücker, S. Chapter 9—ISERS microscopy: Point-of-care diagnosis and tissue imaging. In Principles and Clinical Diagnostic Applications of Surface-Enhanced Raman Spectroscopy; Wang, Y., Ed.; Elsevier: Amsterdam, The Netherlands, 2022; pp. 327–372. ISBN 978-0-12-821121-2. [Google Scholar]
- Rotter, L.K.; Berisha, N.; Hsu, H.-T.; Burns, K.H.; Andreou, C.; Kircher, M.F. Visualizing surface marker expression and intratumoral heterogeneity with SERRS-NPs imaging. Nanotheranostics 2022, 6, 256–269. [Google Scholar] [CrossRef] [PubMed]
- Kim, M.S.; Park, B.C.; Kim, Y.J.; Lee, J.H.; Koo, T.M.; Ko, M.J.; Kim, Y.K. Design of magnetic-plasmonic nanoparticle assemblies via interface engineering of plasmonic shells for targeted cancer cell imaging and separation. Small 2020, 16, 2001103. [Google Scholar] [CrossRef] [PubMed]
- Kenry, F.N.; Clark, L.; Panikkanvalappil, S.R.; Andreiuk, B.; Andreou, C. Advances in surface enhanced Raman spectroscopy for in vivo imaging in oncology. Nanotheranostics 2022, 6, 31–49. [Google Scholar] [CrossRef] [PubMed]
- Karabeber, H.; Huang, R.; Iacono, P.; Samii, J.M.; Pitter, K.; Holland, E.C.; Kircher, M.F. Guiding brain tumor resection using surface-enhanced Raman scattering nanoparticles and a hand-held Raman scanner. ACS Nano 2014, 8, 9755–9766. [Google Scholar] [CrossRef] [PubMed] [Green Version]
Figure 1.
Schematic illustration of the displacement of the conduction electron cloud relative to the nuclei induced by the electromagnetic wave. Reproduced with permission from [8]. Copyright 2002 American Chemical Society.
Figure 1.
Schematic illustration of the displacement of the conduction electron cloud relative to the nuclei induced by the electromagnetic wave. Reproduced with permission from [8]. Copyright 2002 American Chemical Society.

Figure 2.
Plasmon electric field enhancement for Ag nanocubes and their dimer, and for Au nanoframes and their dimer, calculated using the discrete dipole approximation. (A) Individual Ag nanocube, (B) dimer of Ag nanocubes, (C) single Au nanoframe, and (D) dimer of Au nanoframes. Reproduced with permission from [11]. Copyright 2014 American Chemical Society.

Figure 3.
(A) Schematic diagram of a label-free SERS detection of proteins; (B) SERS spectra of three easily-detectable proteins (HGB, Cyt. C and Catalase) and three difficult-to-detect proteins (Avidin, LYZ and BSA); (C) SERS spectra of BSA and Cyt. C at different concentrations. Reprinted with permission from [18]. Copyright 2022 Elsevier B.V.

Figure 4.
(A) A schematic diagram of SERS-based detection of bacteria using label-free Ag/Au bimetallic nanoparticles and canonical discriminant analysis-based classification; (B) SERS spectrum of Salmonella typhimurium; (C) SERS spectrum of Bacillus subtilis; (D) SERS spectrum of Escherichia coli and (E) comparison of SERS spectra of three types of bacteria with marked spectral differences. Reprinted with permission from [19]. Copyright 2019 American Chemical Society.

Figure 5.
Schematic representation of SERS multiplexing possibilities with the use of 10 different Raman reporters. (A) Schematic of a SERS nanosensor consisting of a 60-nanometer gold core with a unique Raman active layer adsorbed onto the gold surface and coated with glass, totaling 120 nm in diameter. The trade name of each SERS nanoparticle is depicted on the right, where a color has been assigned to the Raman active layer of each SERS nanoparticle. (B) Graph depicting Raman spectra of all 10 SERS nanoparticles. (C) Raman map of 10 different SERS particles injected s.c. into a nude mouse. Reproduced with permission from [38]. Copyright 2009 National Academy of Sciences.

Figure 6.
The scheme presenting a SERS method developed by Yu et al. of BRAF mutation detection by using two types of probe plasmonic nanostructures: DNA-covered Fe3O4@SiO2@Au nanoparticles and DNA-covered Ag nanoparticles. Reprinted with permission from [45]. Copyright 2020 American Chemical Society.

Figure 7.
(A) Scheme of the multiplex PCR/SERS assay. Multiplex mutation-specific primers were used to amplify mutant targets (the wild-type dsDNA is shown in black). Amplicons were then labelled with mutation-specific nanotags and enriched with streptavidin magnetic beads. The status of mutations was then analysed with SERS spectrum where unique spectral peaks demonstrated the presence of targeting mutations; (B,C) Left: Gel electrophoresis verified the specific amplification of the mutant gDNA with the corresponding individual primers, where no amplification of the wild-type gDNA was observed. Right: Specific detection of individual mutant PCR products with the corresponding single SERS nanotags. Reproduced with permission from [50]. Copyright 2020 Lyu et al.

Figure 8.
Schematic illustration of the preparation and application of the developed method by Si et al. using a target miRNA-responsive DNA hydrogel-based SERS sensor array for measuring multiple miRNAs in one sample. Reproduced with permission from [61]. Copyright 2020 American Chemical Society.
Figure 8.
Schematic illustration of the preparation and application of the developed method by Si et al. using a target miRNA-responsive DNA hydrogel-based SERS sensor array for measuring multiple miRNAs in one sample. Reproduced with permission from [61]. Copyright 2020 American Chemical Society.

Figure 9.
The schematic illustration of the synthesis of Au@Ag nanoparticles and the SERS detection of CBZ in saliva. Reproduced with permission from [69]. Copyright 2021 Optical Society of America.
Figure 9.
The schematic illustration of the synthesis of Au@Ag nanoparticles and the SERS detection of CBZ in saliva. Reproduced with permission from [69]. Copyright 2021 Optical Society of America.

Figure 10.
(a) Schematic illustration of synthesis of copper nanoparticles and SERS determination of antibiotics in samples of spiked human urine. (b) SERS spectra of antibiotics of interest: ceftriaxone, cefazolin, and cefoperazone. Reproduced with permission from [68]. Copyright 2020 Elsevier B.V.

Figure 11.
Schematic representation of the developed SERS aptasensor. Reproduced with permission from [86]. Copyright 2020 Elsevier B.V.
Figure 11.
Schematic representation of the developed SERS aptasensor. Reproduced with permission from [86]. Copyright 2020 Elsevier B.V.

Figure 12.
(A) Depiction of M13-SERS probe and (B) M13-SERS probe capturing S. aureus. The pVIII protein acts as conjugation ligand for the in situ growth of gold nanoparticles. The pIII protein is genetically engineered for selecting specific peptides. Reproduced with permission from [89]. Copyright 2020 Elsevier B.V.

Figure 13.
(A,B) Flow chart and scheme showing experimental approach for the detection of SARS-CoV-2 using gold hollow nanoparticles and magnetic beads; (C) SERS spectra of malachite green measured from the hollow Au nanoparticle-assembled magnetic beads after the detection of the SARS-CoV-2 antigen (0–1 ng/mL); (D) a plot of 1170 cm−1 band intensity as a function of the SARS-CoV-2 antigen concentration. The blue line is linearly fitted. Data represent average ± standard deviation from 10 measurements. Reprinted with permission from [97]. Copyright 2022 Cha et al.

Figure 14.
Schematic diagram of COVID-19 SERS sensor design and single-virus detection mechanism. (a) Schematic diagram of COVID-19 SERS sensor design and operation procedure. SARS-CoV-2 can be localized by a ‘virus-traps’ nanoforest composed of oblique gold-nanoneedles array (GNAs), and be captured by ACE2 anchored on amide-modified GNAs from virus-containing urine, even with complex multi-protein circumstances. Through machine learning and identification techniques, the identification standards of virus signals are established, and utilized for virus diagnoses. (b) Schematic diagrams of single-virus detection by selectively capturing and trapping virus, and the multi-SERS enhancement mechanism. Reproduced with permission from [100]. Copyright 2021 Yang et al.

Figure 15.
The scheme of the experiment and the formation of the SERS signal with an RBD-1C aptamer nanosensor. Reproduced with permission from [101]. Copyright 2021 Zavyalova et al.
Figure 15.
The scheme of the experiment and the formation of the SERS signal with an RBD-1C aptamer nanosensor. Reproduced with permission from [101]. Copyright 2021 Zavyalova et al.

Figure 16.
Scheme of the triple-mode nanosensor for detection of SARS-CoV-2. Reproduced with permission from [103]. Copyright 2021 Elsevier B.V.
Figure 16.
Scheme of the triple-mode nanosensor for detection of SARS-CoV-2. Reproduced with permission from [103]. Copyright 2021 Elsevier B.V.

Figure 17.
(A) Detection process and design inspiration of the Au-coated TiO2 MIO SERS probe. (B) Typical SERS spectra of exosomes separated from plasma of normal individual, and lung, liver, and colon cancer patients. Reproduced with permission from [112]. Copyright 2020 American Chemical Society.
Figure 17.
(A) Detection process and design inspiration of the Au-coated TiO2 MIO SERS probe. (B) Typical SERS spectra of exosomes separated from plasma of normal individual, and lung, liver, and colon cancer patients. Reproduced with permission from [112]. Copyright 2020 American Chemical Society.

Figure 18.
(A) Preparation of SERS probe conjugated with detecting antibodies for targeting a specific cardiac biomarker. (B) Schematic illustration of multiplex SERS detection of cardiac biomarkers at respective reaction zone(s), G for GPBB, M for CK−MB, and T for cTnT on μPAD. Reproduced with permission from [114]. Copyright 2019 Elsevier B.V.

Figure 19.
Schematic illustration of the SERS tags-based multiplex lateral flow assay devices. 4-MBA is 4-methoxybenzioic acid; MMP-9 is matrix metalloproteinase-9; NSE is neuro-specific enolase; S100-β is S100 calcium-binding protein B protein; BSA is bovine serum albumin; and NC membrane is nitrocellulose filter membrane. Reproduced with permission from [119]. Copyright 2021 Elsevier B.V.

Figure 20.
(A) Exploded view illustration of a thread-embroidered/fabric sensing band and its interface with the skin. (B) Front view and back views of the band. (C) The band can serve as a wearable device deployed on regions of the human body with different curvatures and shapes, e.g., head, elbow and wrist. (D) Optical images of flexible, wearable thread-embroidered/fabric microfluidic devices for sweat sensing and monitoring. Reproduced with permission from [124]. Copyright 2021 Elsevier B.V.

Figure 21.
Illustration for the preparation of AuNPs@4-MPY/Ca-ALG composite fibber and pH sensing based on SERS. Reproduced with permission from [125]. Copyright 2022 Elsevier B.V.
Figure 21.
Illustration for the preparation of AuNPs@4-MPY/Ca-ALG composite fibber and pH sensing based on SERS. Reproduced with permission from [125]. Copyright 2022 Elsevier B.V.

Figure 22.
(A) Schematic diagram of the preparation of the dual-layers DTNB-modified SiO2@Ag nanoparticles. (B) Preparation of SARS-CoV-2 S protein-modified SiO2@Ag SERS tags. (C) Operating principle of the high-sensitivity and simultaneous analysis of anti-SARS-CoV-2 IgM/IgG via the SERS-LFIA strip. Reproduced with permission from [127]. Copyright 2020 Elsevier B.V.

Figure 23.
Schematic illustrations (A) for the fabrication of three different PEGylated Ag-Au hollow nanospheres, which are environmentally stable under various pH values, temperatures, and salt concentrations; and (B) for simultaneous detection of three different biomarkers expressed in breast cancer cells using SERS mapping techniques. Reproduced with permission from [129]. Copyright 2020 Elsevier B.V.

Figure 24.
Targeted cell imaging and cell separation using cRGDyK-functionalized SERS probes. (a) Schematic of target-specific SERS cell imaging. (b) A bright-field image, Raman mapping, and merged image of U87MG cells with cRGDyK-functionalized SERS probes. (c) A bright-field image, Raman mapping, and merged image of MCF7 cells with cRGDyK-functionalized SERS probes. The scale bars in (b,c) are 10 µm. (d) SERS spectra were obtained from the points in Figure 24b. (e) Schematic of magnetic separation of SERS probe-tagged cancer cells. (f) A bright-field image and merged image with a Raman mapping data of separated U87MG cells by cRGDyK-functionalized SERS probes. The scale bars are 50 µm. Reprinted with permission from [136]. Copyright 2020 Wiley.

Publisher’s Note: MDPI stays neutral with regard to jurisdictional claims in published maps and institutional affiliations. |
© 2022 by the authors. Licensee MDPI, Basel, Switzerland. This article is an open access article distributed under the terms and conditions of the Creative Commons Attribution (CC BY) license (https://creativecommons.org/licenses/by/4.0/).
Share and Cite
MDPI and ACS Style
Szaniawska, A.; Mazur, K.; Kwarta, D.; Pyrak, E.; Kudelski, A. How Surface-Enhanced Raman Spectroscopy Could Contribute to Medical Diagnoses. Chemosensors 2022, 10, 190. https://0-doi-org.brum.beds.ac.uk/10.3390/chemosensors10050190
AMA Style
Szaniawska A, Mazur K, Kwarta D, Pyrak E, Kudelski A. How Surface-Enhanced Raman Spectroscopy Could Contribute to Medical Diagnoses. Chemosensors. 2022; 10(5):190. https://0-doi-org.brum.beds.ac.uk/10.3390/chemosensors10050190
Chicago/Turabian StyleSzaniawska, Aleksandra, Kinga Mazur, Dominika Kwarta, Edyta Pyrak, and Andrzej Kudelski. 2022. "How Surface-Enhanced Raman Spectroscopy Could Contribute to Medical Diagnoses" Chemosensors 10, no. 5: 190. https://0-doi-org.brum.beds.ac.uk/10.3390/chemosensors10050190
Note that from the first issue of 2016, this journal uses article numbers instead of page numbers. See further details here.