Article

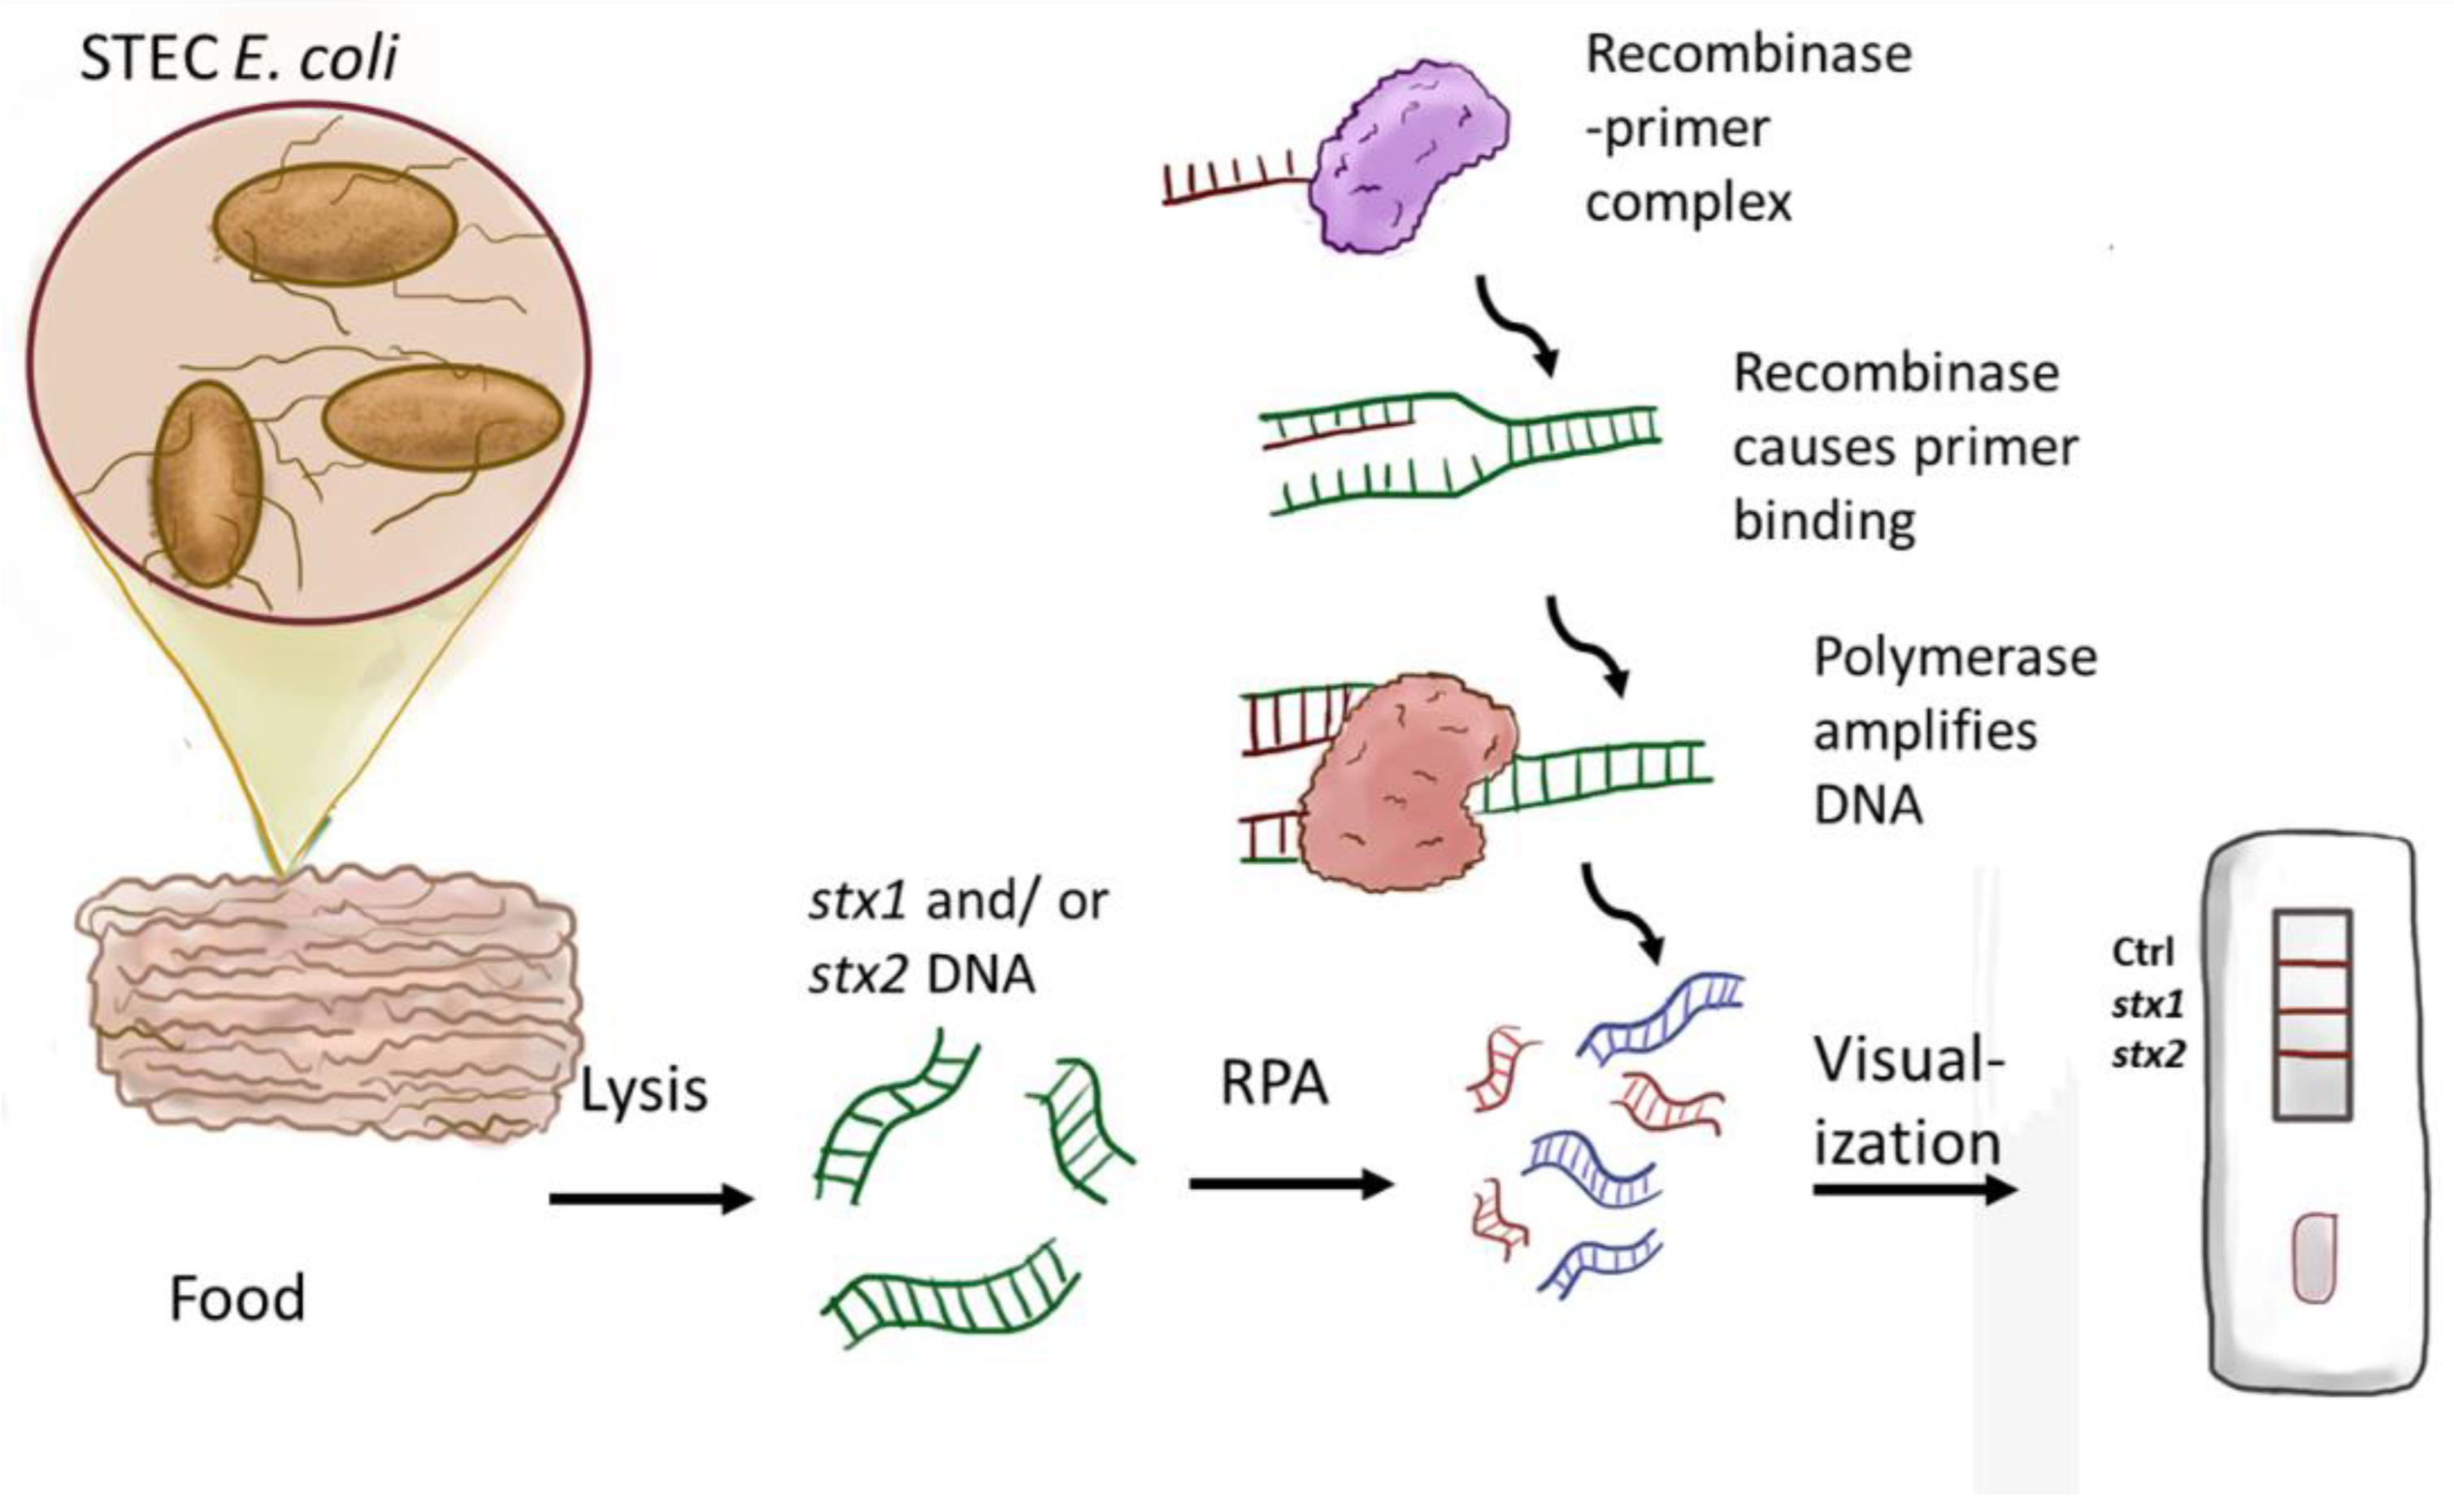
Isothermal Amplification and Lateral Flow Nucleic Acid Test for the Detection of Shiga Toxin-Producing Bacteria for Food Monitoring

1
Department of Biochemistry and Molecular Biology, Miller School of Medicine, University of Miami, Miami, FL 33136, USA
2
Dr. John T. MacDonald Foundation Biomedical Nanotechnology Institute, Miller School of Medicine, University of Miami, Miami, FL 33136, USA
3
Clinical and Translational Science Institute, Miller School of Medicine, University of Miami, Miami, FL 33136, USA
*
Author to whom correspondence should be addressed.
Submission received: 29 April 2022 / Revised: 28 May 2022 / Accepted: 31 May 2022 / Published: 2 June 2022
(This article belongs to the Special Issue State of the Art in Nucleic Acid Detection)

Abstract

:
Foodborne bacteria have persisted as a significant threat to public health and to the food and agriculture industry. Due to the widespread impact of these pathogens, there has been a push for the development of strategies that can rapidly detect foodborne bacteria on-site. Shiga toxin-producing E. coli strains (such as E. coli O157:H7, E. coli O121, and E. coli O26) from contaminated food have been a major concern. They carry genes stx1 and/or stx2 that produce two toxins, Shiga toxin 1 and Shiga toxin 2, which are virulent proteins. In this work, we demonstrate the development of a rapid test based on an isothermal recombinase polymerase amplification reaction for two Shiga toxin genes in a single reaction. Results of the amplification reaction are visualized simultaneously for both Shiga toxins on a single lateral flow paper strip. This strategy targets the DNA encoding Shiga toxin 1 and 2, allowing for broad detection of any Shiga toxin-producing bacterial species. From sample to answer, this method can achieve results in approximately 35 min with a detection limit of 10 CFU/mL. This strategy is sensitive and selective, detecting only Shiga toxin-producing bacteria. There was no interference observed from non-pathogenic or pathogenic non-Shiga toxin-producing bacteria. A detection limit of 10 CFU/mL for Shiga toxin-producing E. coli was also obtained in a food matrix. This strategy is advantageous as it allows for timely identification of Shiga toxin-related contamination for quick initial food contamination assessments.

1. Introduction

Food contamination has persisted as a global problem that has worsened in recent years. These contamination events have a significant impact on not just public health but also on the food and agriculture industry [1,2]. Several bacterial species are implicated in foodborne illness with a range of frequency and severity [3]. One particular subset of bacteria implicated in food contamination and foodborne illnesses is known as Shiga toxin-producing E. coli (STEC). These bacteria are hallmarked by their ability to produce Shiga toxin, a virulent protein [4]. STEC strains produce two different Shiga toxins, Shiga toxin 1 and/or Shiga toxin 2 [5]. These two toxins are structurally similar and have the same mechanism of pathogenicity but are antigenically separate from each other.
Shiga toxins are part of a group of AB5 protein toxins that work through the blockage of protein synthesis in eukaryotic cells. The A subunit of the toxin is responsible for the toxin’s activity, while the B subunit allows for the toxin to bind to the globotriaosylceramide (Gb3) receptors located on the membranes of several types of mammalian cells [6]. Shiga toxins are not native to E. coli, and the DNA encoding the toxins are instead part of lambdoid prophages that had infected these E. coli strains previously [7]. These prophages infect the E. coli, and then the phage DNA is incorporated into the bacterial chromosome. Within these prophages and in the subsequent bacterial chromosome, the stx sequences are downstream of a tight promoter and, as such, are not expressed under normal conditions. For toxin production to occur, the phage must be induced via the triggering of the bacterial SOS signal (stress conditions), dependent on the RecA protein of the host [8]. After this induction, the prophage DNA is excised from the host DNA and replicated separately [9]. During this replication, the phage proteins and Shiga toxins are produced by the bacterial host, and then at the end of the induction process, cells are lysed. This lytic release of Shiga toxins often leads to complications such as Hemolytic Uremic Syndrome (HUS) [10]. This release of toxins and phage by STEC can also cause the normal intestinal flora to pick up the stx genes and, as a result, produce additional Shiga toxins, intensifying the infection [11].
There are over a hundred STEC strains of bacteria, and these strains can possess stx1, stx2, or both stx genes [12]. Therefore, the simultaneous detection of both stx genes is a better strategy to monitor the presence of any STEC bacteria without having to perform individual-strain-specific gene detection. The majority of the literature reports are targeted at the detection of E. coli O157:H7 as it is the most common STEC strain implicated in food contamination in the USA [13]. Not many publications have focused on non-O157:H7 STEC strains, even though these strains pose an equal health threat as the O157:H7 STEC strain and are also frequently implicated in food outbreaks [14]. In general, current bacterial detection methods are often time-consuming, expensive, or require personnel or laboratory space to conduct the assays [15]. With these types of methods, results can take anywhere from a few days to weeks. This leaves ample opportunity for contamination to go unnoticed. Therefore, it is of importance to have rapid detection methods, especially those that can quickly provide an idea of any STEC contamination. There have been many recent advances in the on-site detection of pathogenic foodborne bacteria overall, including multiplexed assays [3,16,17,18]. However, challenges still remain with regards to the complexity and cost of assay without compromising the required sensitivity.
Here we designed a strategy to detect the two stx genes in a single reaction to be able to determine the presence of any STEC bacteria. We employ simple chemical lysis of a sample followed by isothermal DNA amplification for both genes and a lateral flow assay-based visualization of the two stx genes, stx1 and stx2. One promising isothermal amplification technique for on-site applications is recombinase polymerase amplification (RPA), which is utilized in this study. This method works at a temperature of 39 °C, and the entire amplification reaction can be performed in only 20 min. RPA products are then visualized on a lateral flow assay strip. For that, primers corresponding to two genes are labeled with biotin or digoxin that allow immobilization of the amplification product on the strip and also interact with a visual reporter (gold nanoparticles) [19,20]. These assay strips are useful for on-site detection methods as they are easy to use and easy to interpret. More specifically, these lateral flow strips are able to perform dual gene detection on a single strip. This cuts down on the number of tests used to detect two different genes. This saves time and resources, allowing for a greater number of samples to be tested without sacrificing cost or time.
The strategy described in this study aims to provide a broad initial screening tool for foodborne contamination via the detection of stx genes in a manner that is rapid, inexpensive, and simple to run. This is advantageous as there is no need for any significant equipment. Additionally, the inexpensive and rapid nature of this strategy allows for several tests to be run at any given time with quick results. This can help facilitate prescreening of samples for possible contamination prior to any further or more rigorous testing using culture or other laboratory methods. Furthermore, the ability to detect more than one target allows for detection of all STEC bacteria that produce Shiga toxins in a single test strip without the need for individual tests for each strain. A full depiction of this strategy can be seen in Figure 1.

2. Materials and Methods

2.1. Materials

All bacterial strains used in this manuscript have been purchased from American Type Culture Collection (ATCC) (Manassas, VA, USA). Oligos were purchased from Sigma (St. Louis, MO, USA). Milenia Hybridetect 2T Lateral Flow paper strips were purchased from Milenia Biotec (Gießen, Germany). TwistDx RPA kits were obtained from TwistDx (Cambridge, UK). Herring Sperm DNA was obtained from New England Biosciences (Ipswich, MA, USA). Triton-X 100 and RT-PCR grade water were obtained from ThermoFisher (Waltham, MA, USA). Sodium hydroxide and other buffers and salts were obtained from VWR (Radnor, VA, USA). Ground chicken was procured from a local chain supermarket.

2.2. Bacterial Lysis and DNA Collection in Media

The protocol followed was previously established in our earlier published work [21]. Briefly, 1.0 mL of culture at dilutions ranging from 106–1 CFU/mL was removed and centrifuged for 5 min at 4000× g. Supernatant was aspirated, and the pellet was resuspended in 100 µL of lysis buffer (50 mM NaOH and 5% Triton-X 100 (TX-100)). This suspension was vortexed and then allowed to incubate for 10 min at room temperature. Samples were then either immediately used or stored at −20 °C.

2.3. Shiga Toxin Gene Amplification Using RPA

The recombinase polymerase amplification reaction components are first added to a PCR tube. These components include 29.5 µL rehydration buffer, 2.4 µL of forward primers for both stx1 and stx2, 2.4 µL of reverse primers for both stx1 and stx2 (Table 1), and 5.4 µL of water. Primers are added to the sides of the tube to prevent interactions from reducing potential background. A 2.0 µL of sample was then transferred to the wall of the reaction tube. These tubes were then centrifuged and transferred to the reaction tubes containing the manufacturer-provided lyophilized reaction. A total of 2.55 µL of magnesium acetate (MgOAc) was added to the caps, and the tubes were then centrifuged before immediately incubating for 20 min at 39 °C. Amplification reaction products were immediately visualized on lateral flow strips before being stored at −20 °C.

2.4. Lateral Flow Assay

Milenia Hybridetect 2T lateral flow strips were purchased from Milenia Biotek (Gießen, Germany). Lateral flow strips and buffers were first allowed to acclimate to room temperature prior to use. A total of 100 µL of manufacturer-supplied buffer was pipetted into a 96-well plate. Samples were diluted 1:50, and then 10 µL of this dilution was pipetted onto the strip, and then strips were allowed to incubate in the running buffer for 5–10 min before removing for visualization. Lateral flow assays are visualized and interpreted with the naked eye with no need for extensive equipment. This is because the gold-conjugated anti-FAM antibodies embedded in the test strips recognize the FAM label present on the forward primers and becomes incorporated in the amplification product. This is what generates the visual color change in the control and test lines. Amplification products are captured on the test lines via interactions with either the biotinylated primer or the digoxigenin-labeled primer. A positive result is represented by either two lines if only one stx gene is present or three lines if both stx genes are present. A negative result is represented by a single line at the top of the strip. This topmost line is used as a means for quality control and assay validity. In this case, stx2 amplification product is represented by the bottom test band, and stx1 amplification product is represented by the middle band.

2.5. Solid Food Sample Handling and Spiked Sample Studies

This method was established in a prior study in our laboratory [21]. Ground chicken was purchased from a local chain supermarket and homogenized into a 10 mL 10% w/v suspension using 1x PBS and a mortar and pestle. Into this suspension, 100 µL of bacterial culture per mL of liquid volume was added. Total concentrations ranged from 106 to 10 CFU/mL. Samples were then incubated for 10 min with 1.00 mL of lysis buffer (50 mM NaOH and 5% TX-100). Lysate was directly used for RPA. RPA samples were then visualized on a lateral flow strip as described in earlier methods.

3. Results

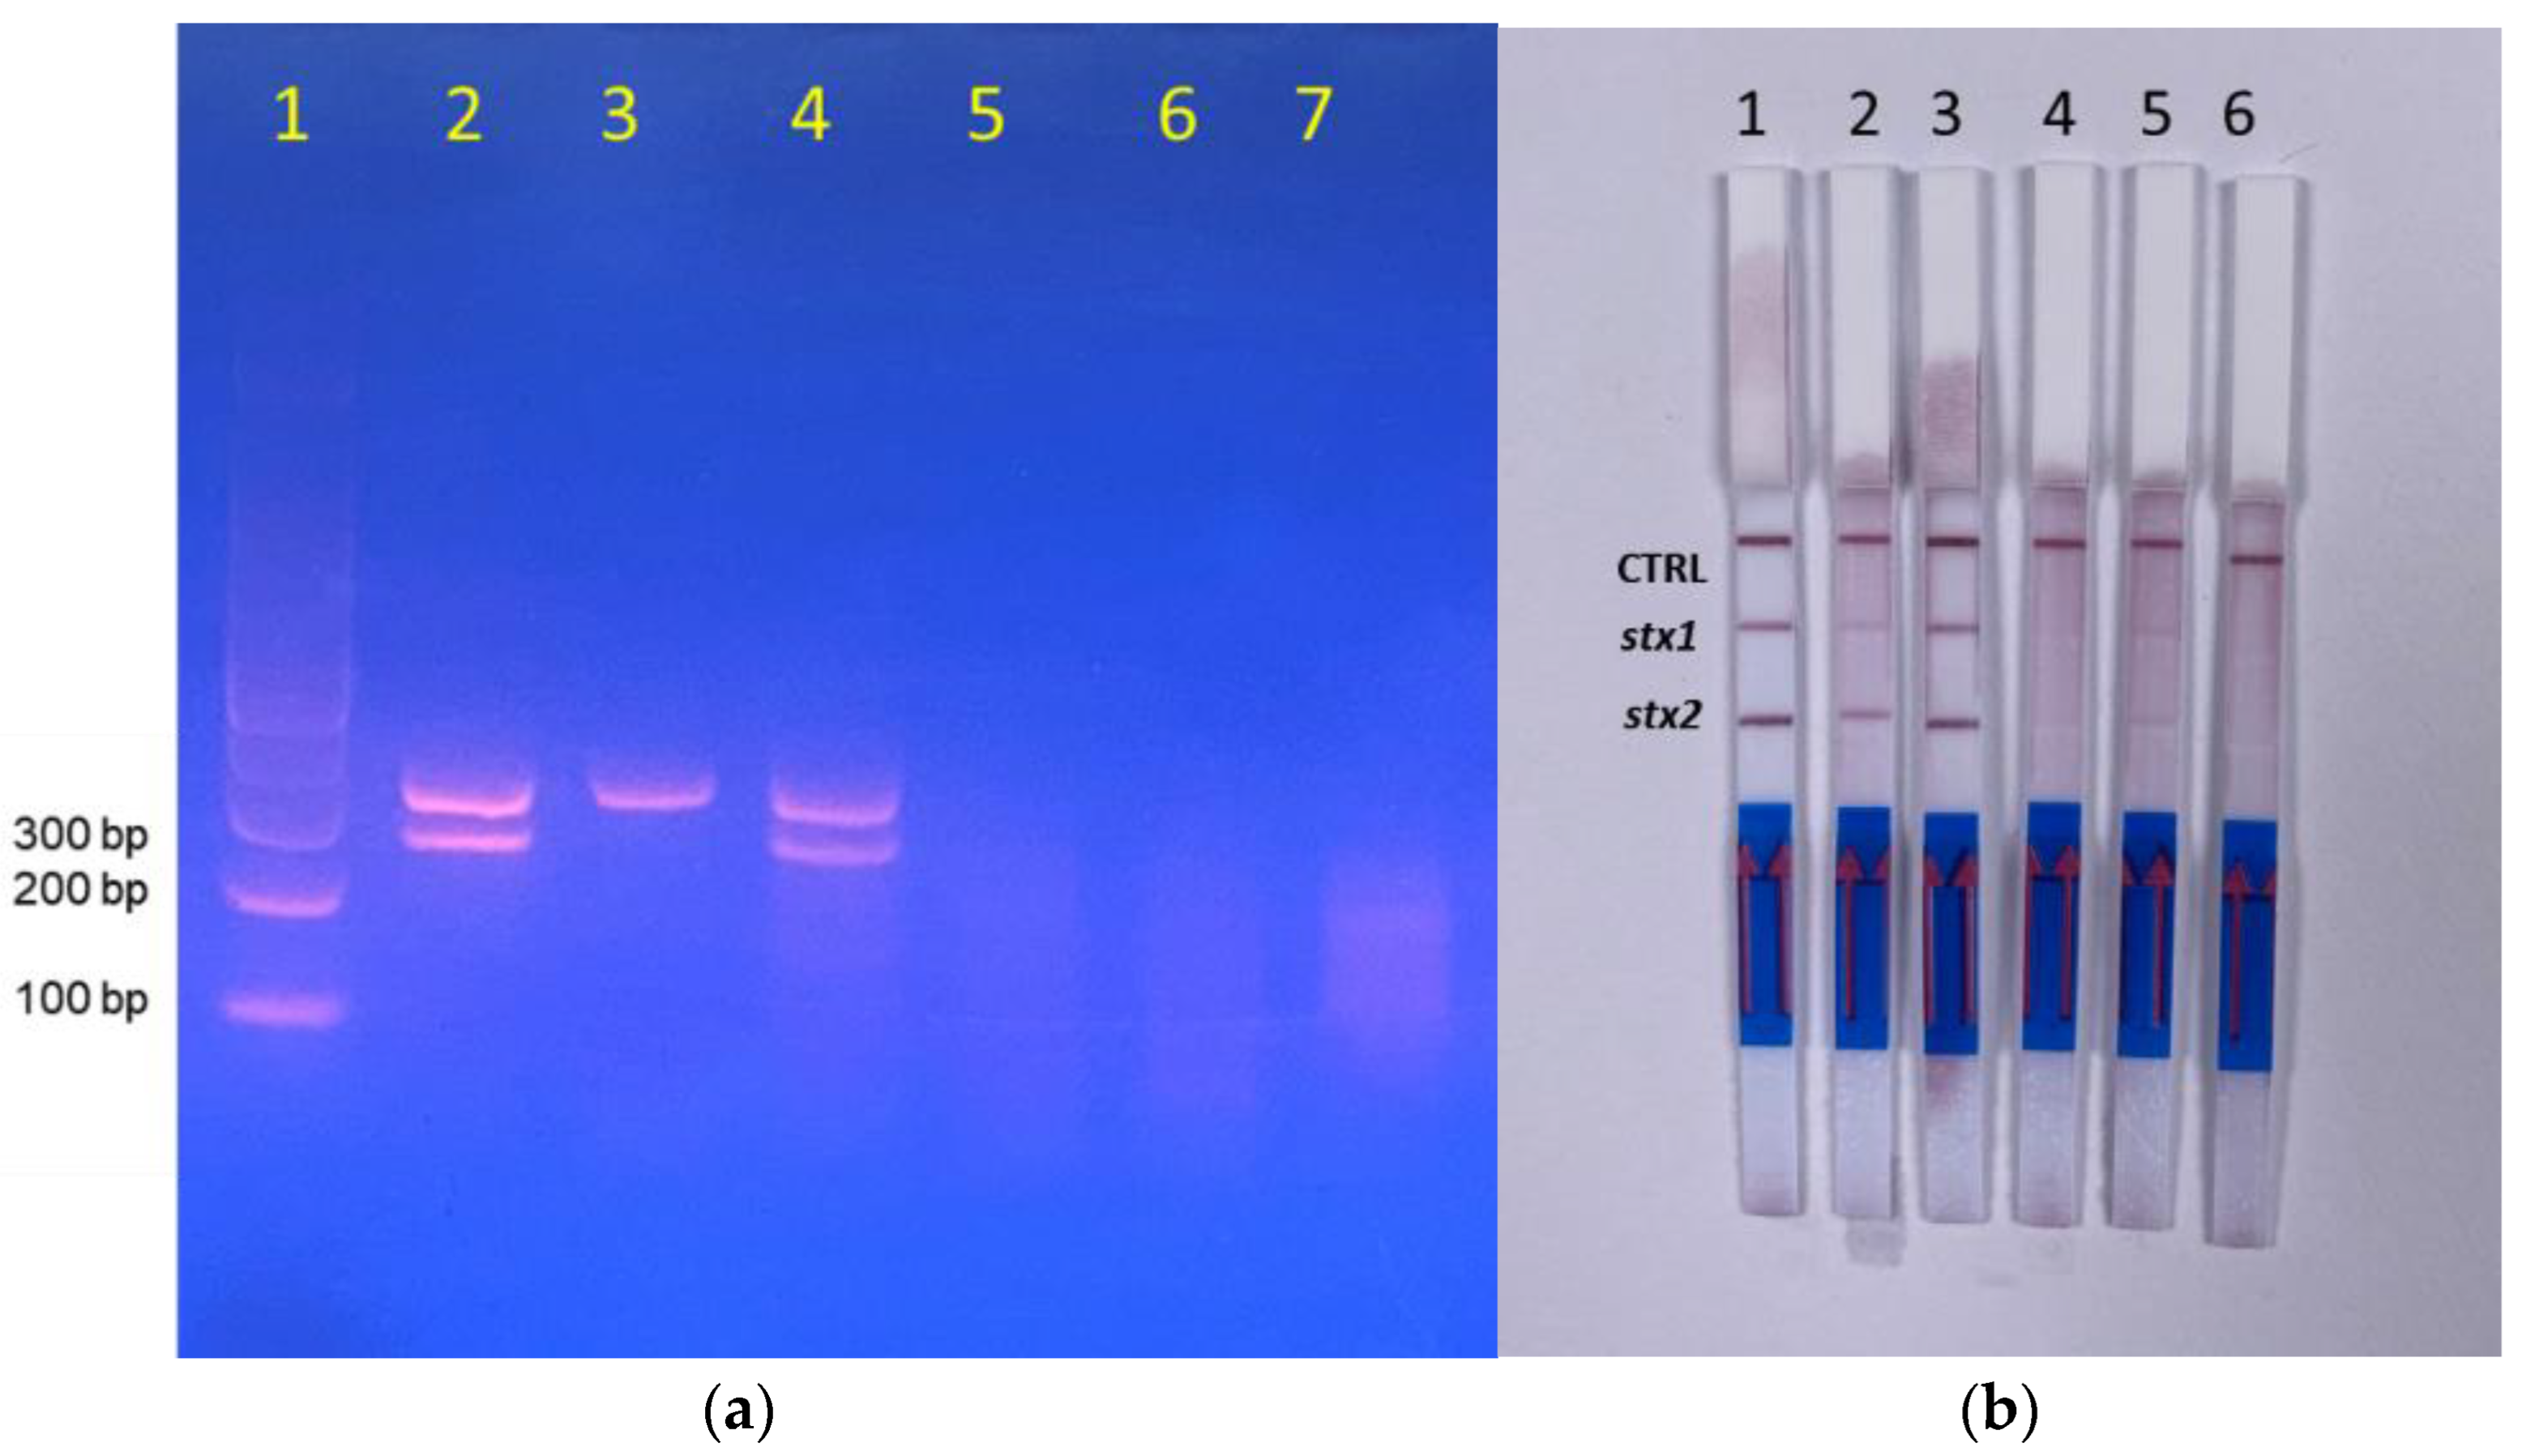
3.1. RPA Optimization and Primer Selection
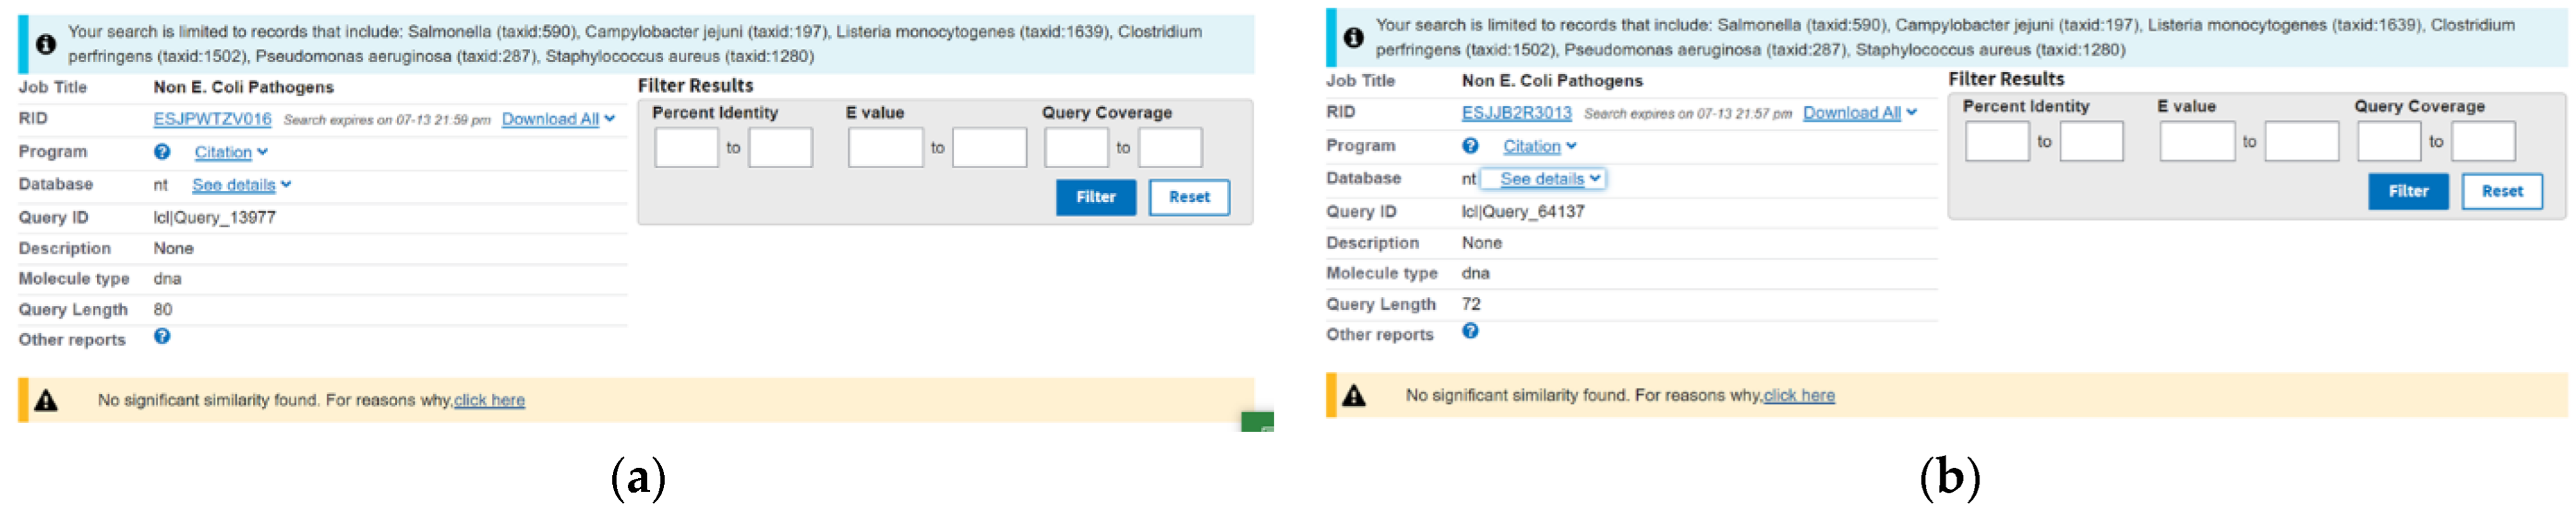
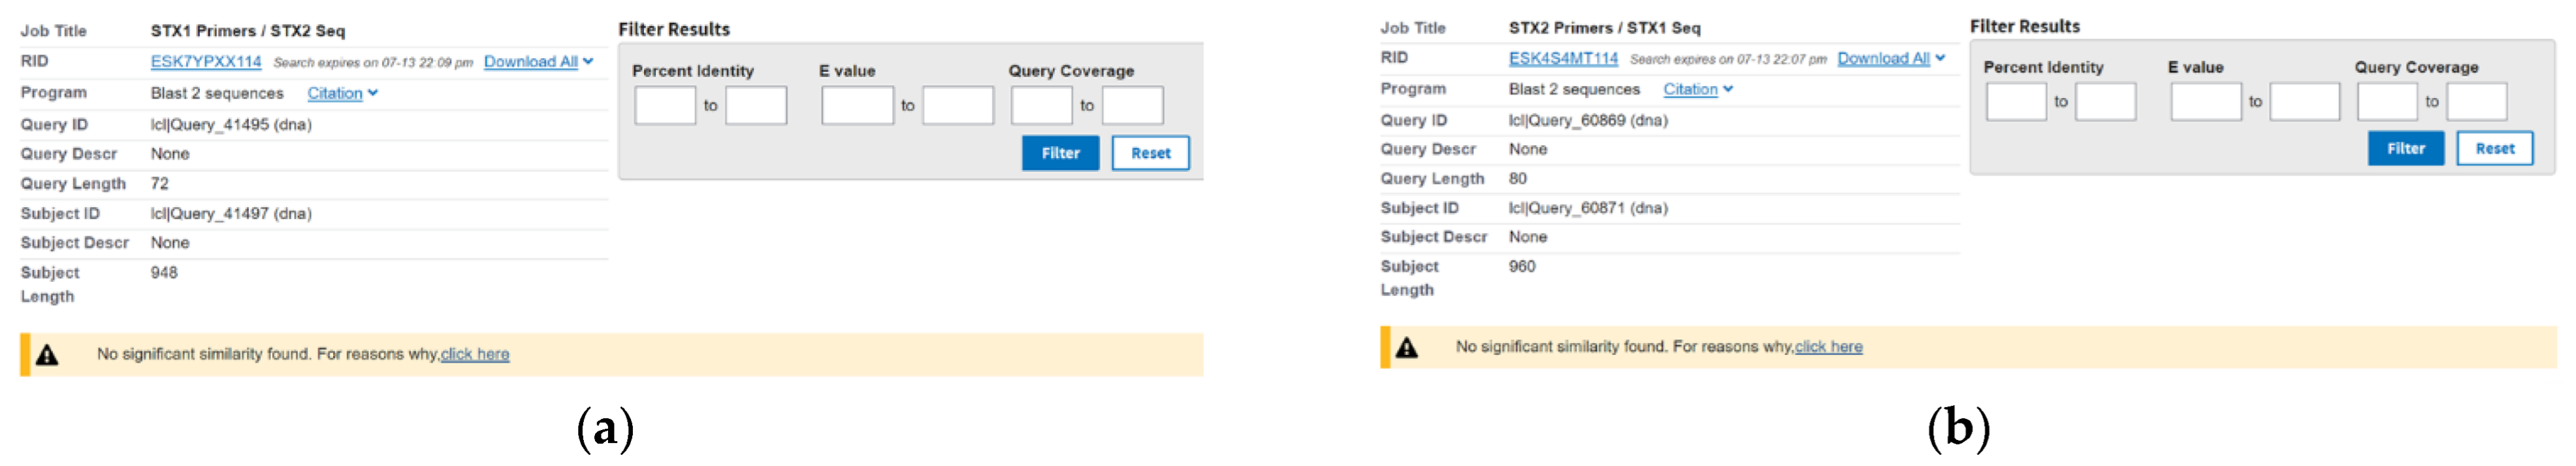
Primers were designed against the open reading frames for the Shiga toxin 1 gene (stx1) and Shiga toxin 2 gene (stx2). Shiga toxin gene sequences were compared across different bacterial strains to confirm their overall conservation and similarity and to check for any potential mismatch regions. For both primer sets, primers were designed for the A subunits of the toxins since its responsible for the toxin activity. Primers were designed by scanning the open reading frame and generating multiple 30 base pair sequences. Each sequence was verified as unique via Blast and compared for optimal amplification utilizing genomic DNA of E. coli O157:H7 (produces both Shiga toxin 1 and Shiga toxin 2), E. coli O121 (only produces Shiga toxin 2), and E. coli O26 (produces both Shiga toxin 1 and Shiga toxin 2) (ATCC). The finalized primer pairings for each stx gene were then used to generate two products corresponding to stx1 and stx2 from bacterial lysates prepared using the following strains: E. coli O157:H7, E. coli O121, and E. coli O26. Lysates from P. aeruginosa (dissimilar pathogen) and E. coli O6 (non-pathogenic E. coli strain) were used as a non-specific control. The negative control consisted of a lysis buffer sample. Amplification was performed in non-specific and negative control samples using the same primer set and conditions of RPA that were used for Shiga toxin gene amplification. RPA was chosen as our amplification technique for its relatively quick run time and its ability to work near room temperature. This method relies on the use of a recombinase enzyme to allow for amplification to occur [22]. This recombinase creates a complex with the primers that then searches for the sequence homologous to the primers within a sample. This strand invasion allows for the DNA to be opened. The open DNA is stabilized by single-strand binding proteins, and then a DNA polymerase is able to elongate the sequence. This process is exponential and can generate a lot of the product from a small amount of target [23]. Additionally, RPA is resilient to inhibitors, capable of amplifying even in the presence of common PCR inhibitors [24]. This makes RPA a good method for performing amplification with minimal sample preparation. The product of stx1 amplification is 220 bp in length, and the product for stx2 amplification is 280 bp in length. The optimized primer sequences used are listed in Table 1 in the methods section described earlier. The products obtained corresponding to stx1 and stx2 amplification for each E. coli strain carrying the Shiga toxin gene were verified using DNA sequencing. An agarose gel depiction of these products can be seen in Figure 2. We expected bands for both stx1 and stx2 from strain E. coli O157: H7 (Lane 2) and E. coli O26 (Lane 4), only one product corresponding to stx2 from E. coli O121 (Lane 3), and no bands from P. aeruginosa, non-pathogenic E. coli O6, and negative buffer control Lanes 5, 6, 7, respectively.

3.2. Specificity

It is imperative in DNA detection to ensure specificity and that the method only detects the intended target gene. To assess the specificity of our detection strategy, we evaluated the specificity of the primers designed first in silico against common foodborne pathogens (Figure 3). Blast results indicated no significant similarity against the major foodborne pathogens. This type of in silico screening is an accepted method by the FDA for large pathogen screening, especially when it is not feasible to perform screening against all bacterial strains in a laboratory setting [25,26]. Additionally, we performed a Blast search for each primer set against the other Shiga toxin, meaning stx1 primers against stx2 and vice versa (Figure 4). Both primer pairs did not show significant similarity to the other Shiga toxin gene, indicating no significant cross-reactivity between the primers and the other Shiga toxin. Then, experimentally, we assessed our primers’ specificity with a dissimilar pathogen (Pseudomonas aeruginosa) and a non-pathogenic E. coli variant (E. coli O6). Since food could be contaminated with naturally occurring non-pathogenic strains, we needed to make sure that we would not detect those strains. For this purpose, samples of 106 CFU/mL of either E. coli O121, E. coli O157:H7, E. coli O26, P. aeruginosa, and E. coli O6 were lysed, and then RPA was performed. Results were visualized in the lateral flow assay as well as 2% agarose gel. As seen in Figure 2, our assay did not show any amplification product bands on the gel and paper strip corresponding to non-pathogenic E. coli or a dissimilar pathogen. Only the Shiga toxin-producing E. coli species produced positive results on agarose gel and paper strips. Our in silico and experimental results together indicate that there is no cross-reactivity and that our method is specific.

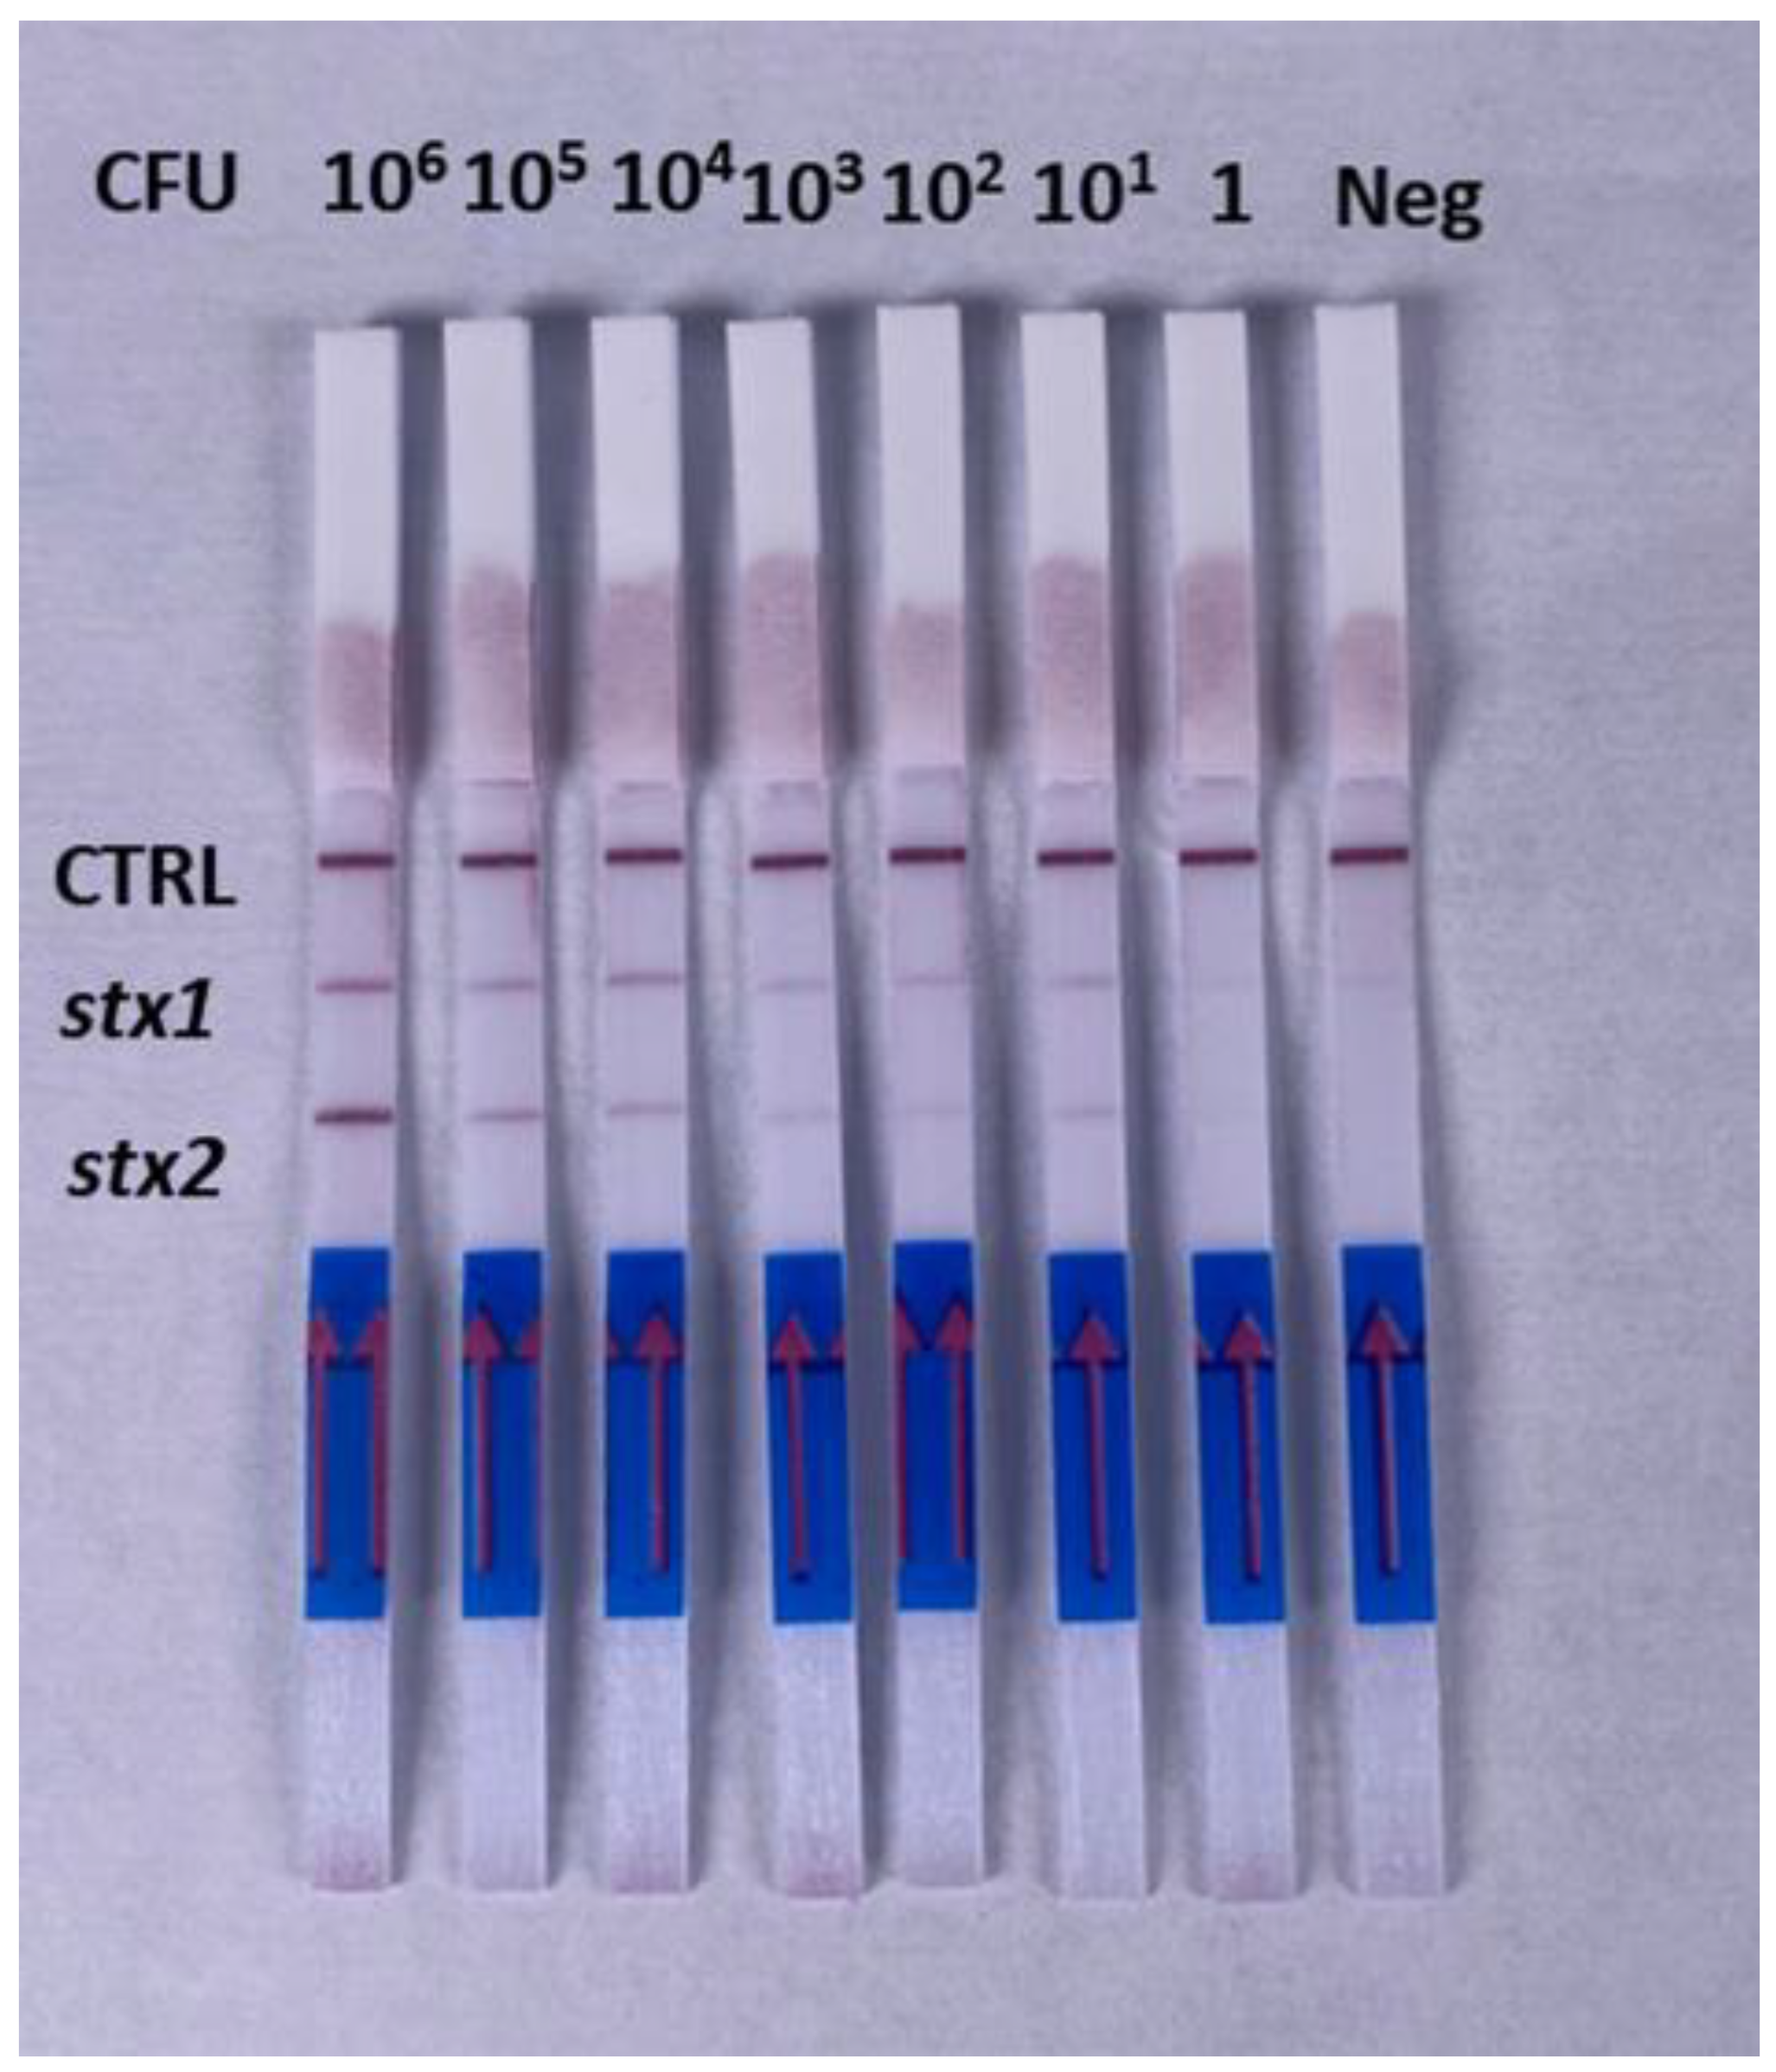
3.3. Evaluation of Sensitivity in Media

The infectious dose for STEC E. coli is as low as 10 cells depending upon the strain [27]. When considering this, the high sensitivity of the assay is important to prevent the potential for false negative results, which can be rather problematic in food safety monitoring. False negatives are still a challenge, with a percentage of culture analysis results yielding false negative results [28,29]. In order to test the working range of our assay in a standard condition, we lysed bacterial samples of E. coli O157:H7 at concentrations ranging from 106 to 1 CFU/mL. DNA within the lysate was amplified using RPA as described, and results were visualized on lateral flow strips shown in Figure 5. As seen in the figure, our detection limit was approximately 10 CFU/mL, which is relevant considering the infectious dose specifically for E. coli O157:H7 ranges from 10 to 100 cells [30]. This detection limit is also significant as it was obtained without any need for enrichment post-sampling, which drastically reduces the run time of the assay. Moreover, it only took approximately 35 min from the sample to the result, which is reasonable for on-site monitoring applications. Bands were additionally compared for the quantitative difference between the sample test lines and the control strip test lines. As expected, there was a quantitative difference between sample test lines and control test lines, as seen in Figure S2. Experimental results were replicated in three separate experiments (from separate bacterial cultures on different days) for reproducibility. Replicate data can be seen in Figure S1.

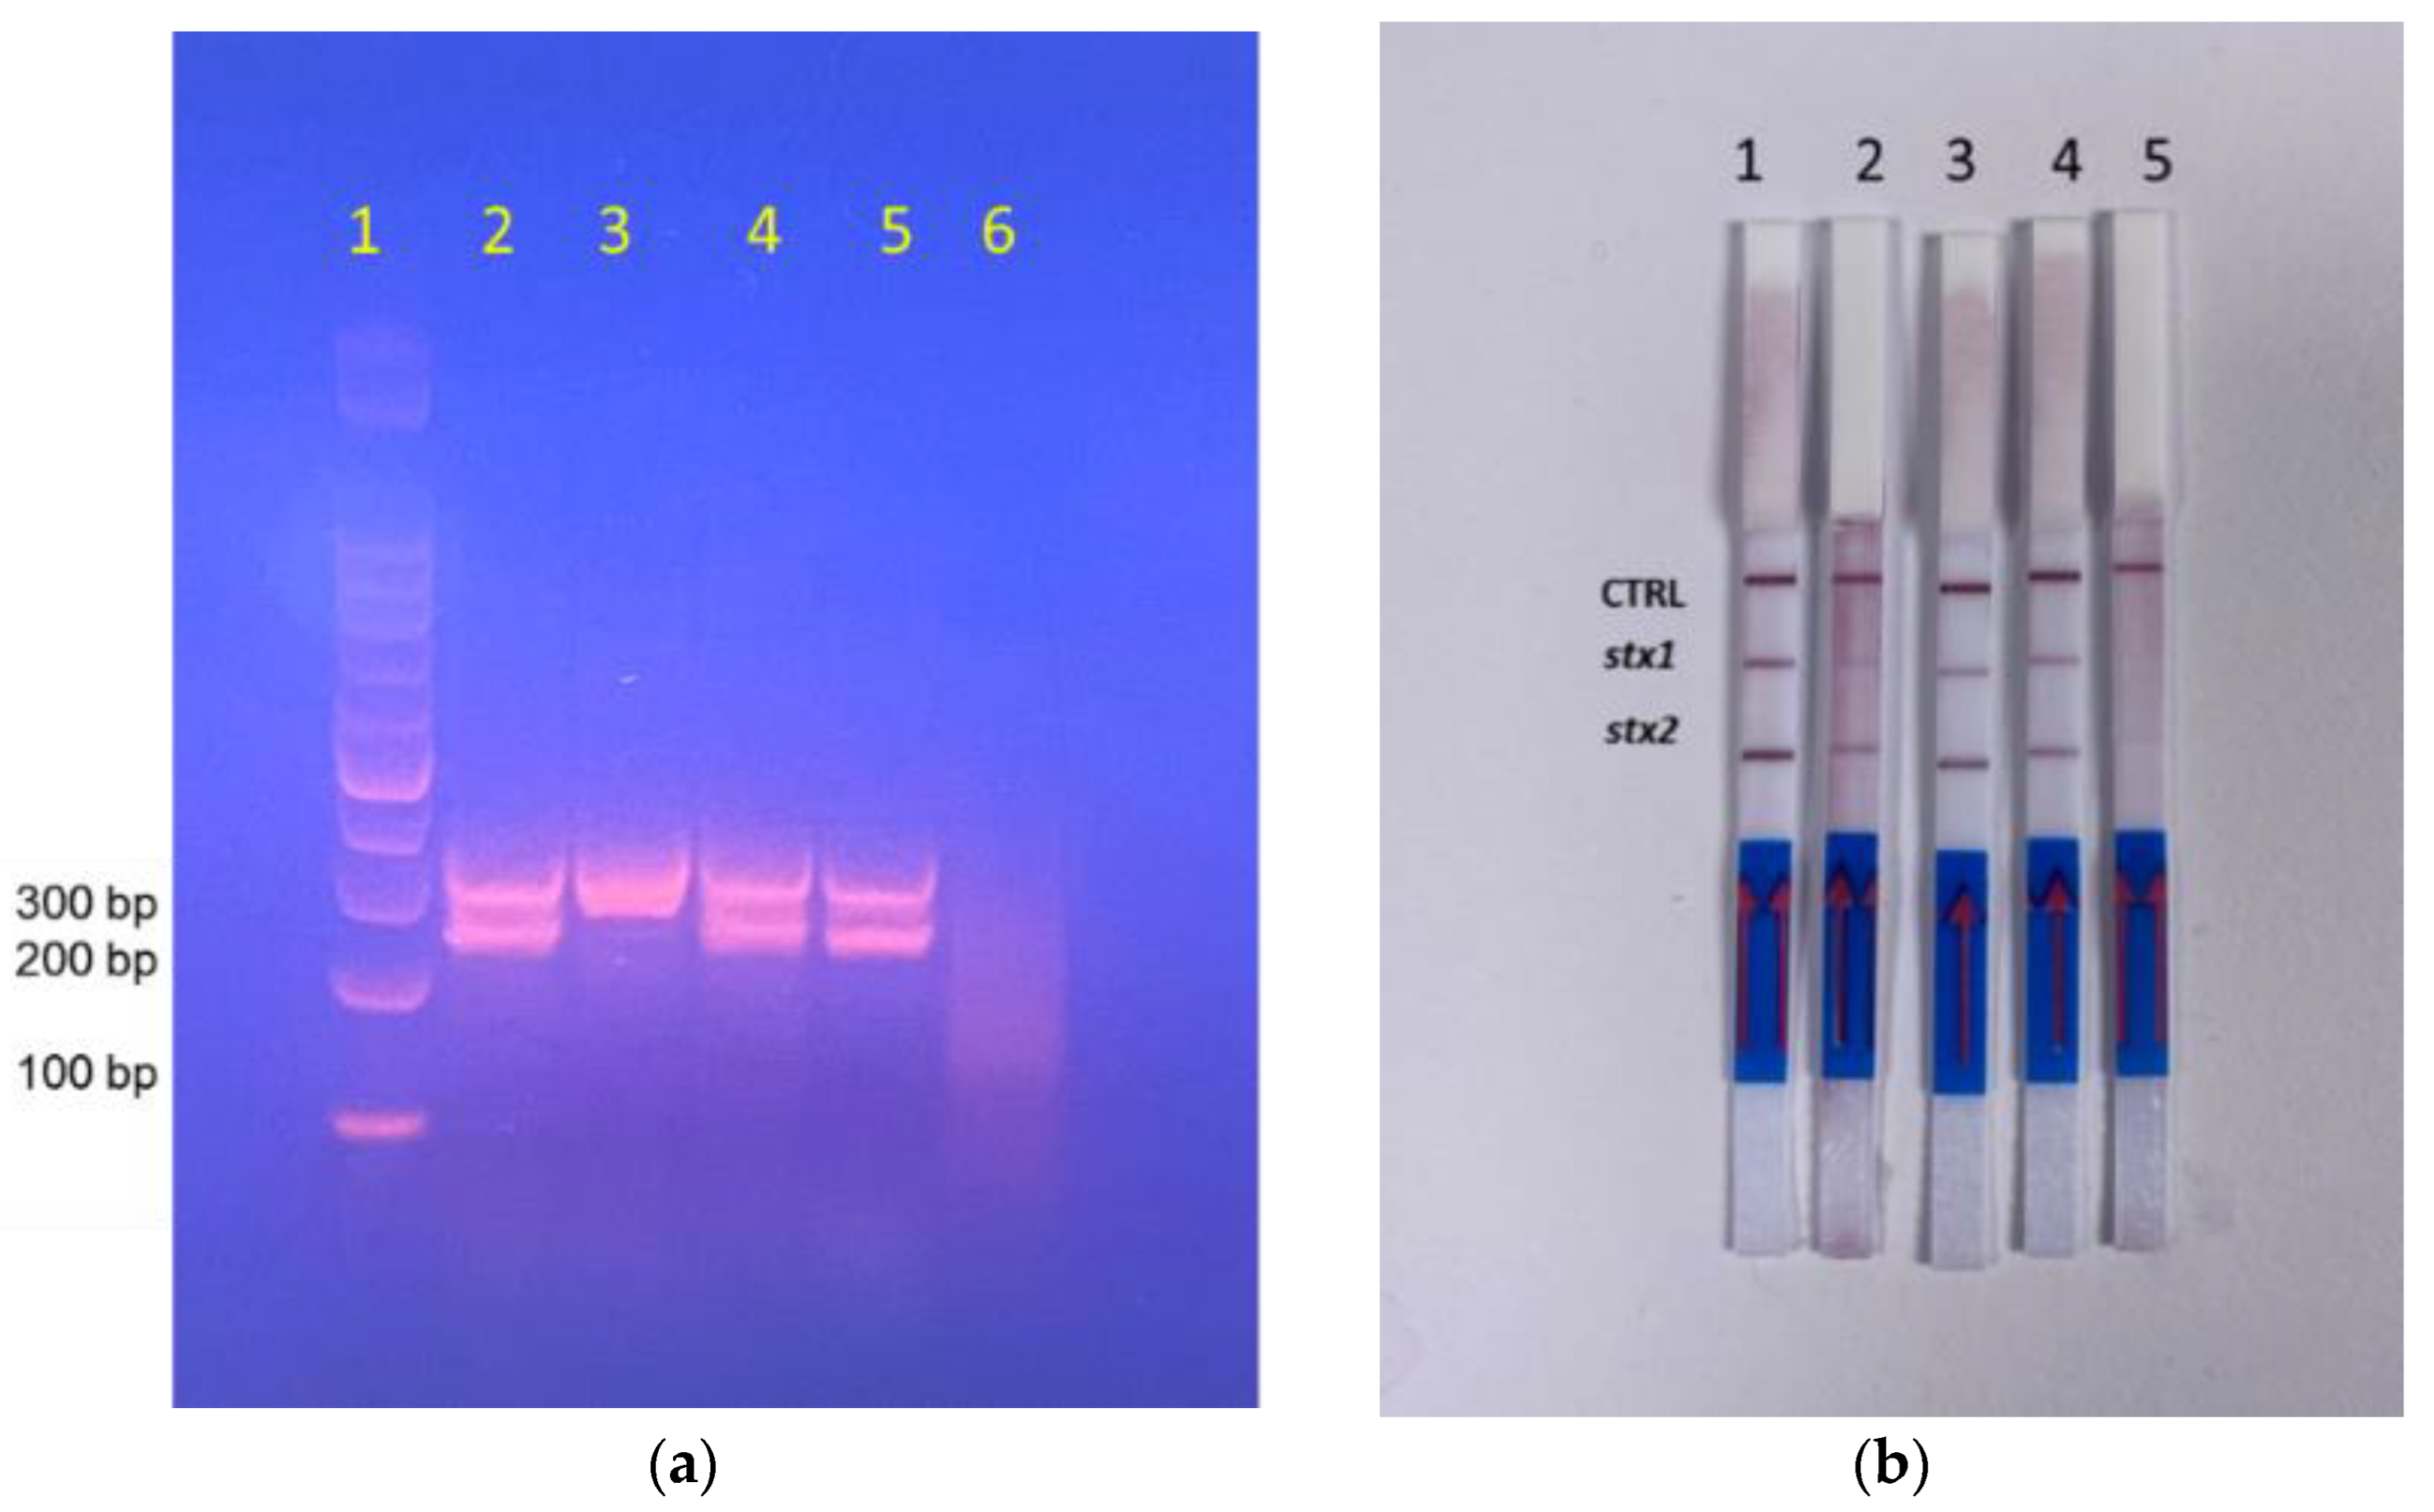
3.4. Evaluation of Sensitivity in Spiked Food Samples

To demonstrate applicability in a real-world setting, we first aimed to demonstrate the detection of the stx1 and stx2 genes in a food matrix that is commonly implicated in STEC contamination. Many foods have been implicated in these outbreaks ranging from leafy vegetables, meat products, unpasteurized dairy, and even flour [31]. Out of these, we decided to use ground chicken as a representative food matrix. This decision was based on the knowledge that STEC E. coli has been identified in chicken samples and that poultry has been known to harbor STEC bacteria [32,33,34]. Since our media experiments yielded an LOD of 10 CFU/mL, we decided to test within the range from 106 to 10 CFU/mL. E. coli O157:H7 was spiked into a 10% w/v solution of ground chicken in sterile water. This solution was prepared using crude homogenization with a mortar and pestle. This method is simplistic and good for on-site purposes since it is inexpensive and easy to perform. These spiked samples are then lysed, and the lysate is directly used for RPA before being visualized on a lateral flow strip. Our data indicate that we are able to detect as low as 10 CFU/mL in ground chicken samples, as seen in Figure 6. Bands were compared for the quantitative difference between the sample test lines and the control strip test lines. As expected, there was a quantitative difference between sample test lines and control test lines, as seen in Figure S4. Experimental results were replicated in three separate experiments (from separate bacterial cultures on different days) for reproducibility. Replicate data can be seen in Figure S3.

3.5. Evaluation of a Mixed Sample

While it would be rare, it is possible that there can be multiple Shiga toxin-producing bacteria present within a single sample. Additionally, it is also important to ensure that Shiga toxin can be detected from several different bacterial strains. To test and confirm that we can detect both Shiga toxins from a mix of bacterial species, we combined E. coli O157:H7, E. coli O121, and E. coli O26 at concentrations of 102/mL of each strain. We chose 102 CFU/mL as our final mixed sample concentration as it is a concentration that is within the range of CFU levels frequently seen in contaminated samples from various food outbreaks [35]. E. coli O157:H7 and E. coli O26 carry both stx1 and stx2 genes, whereas E. coli O121 only carries the stx2 gene. As seen in Figure 7, we are able to detect both toxin genes separately in three different bacterial strains and also in a sample containing all three strains. This indicates that we can detect Shiga toxin from multiple bacterial strains both separately and when presented together.

4. Discussion

In this study, we present a dual DNA detection strategy for broad detection of Shiga toxin-producing bacteria. This is beneficial since there are hundreds of strains that produce Shiga toxins encoded by the genes stx1 and stx2. The detection of both toxins allows for contamination to be identified without the need for several strain-specific tests. The method developed by us utilizes simple chemical lysis followed by recombinase polymerase amplification with visual colorimetric detection on a lateral flow assay platform. This simplistic method and rapid amplification are good for on-site use due to the lack of overall complexity. On-site use is crucial in food monitoring to catch contamination ideally before the product reaches the hands of the consumer. Additionally, the inexpensive and rapid nature of this strategy would allow the user to perform multiple tests across several food samplings. This is significant because representative and proper sampling is imperative to the reliability of food-safety analysis [36].
Our detection strategy was able to distinguish between the two Shiga toxins and detect the toxin genes in several Shiga toxin-producing bacteria. Furthermore, we were able to detect as low as 10 CFU/mL of bacteria in media and 10 CFU/mL in spiked food samples. These limits of detection are within the range of the infectious dose of STEC bacteria. Additionally, this is within the range of many existing methods that target the Shiga toxin genes. (See Table 2). Our method is quicker than many of these highlighted existing methods. Furthermore, many of these methods were not designed for on-site applications, while ours is able to be readily applied for on-site analysis with considerably less equipment. Not all on-site applications reported provide the required low detection limit as demonstrated by our method since reducing the complexity of the method can compromise the detection sensitivity. Additionally, several commercial methods currently exist for the detection of STEC, ranging from nucleic acid-based techniques to immunoassays [37,38,39]. Our described strategy is similarly able to detect both toxins in a manner that is specific. While the commercial kits certainly have good sensitivities, our strategy offers some benefits. For example, our strategy did not require an incubation or enrichment period. Additionally, many commercial kits are not all feasible to be used extensively in resource-poor areas. Similarly, several commercial assays are not designed with on-site use in mind. The simplistic lysis method and one-step isothermal amplification using the RPA technique are useful for on-site detection. Similarly, our strategy from sample to answer can be completed in approximately 35 min, which is reasonable for on-site applications. This strategy requires minimal equipment that can be readily available in food and agriculture sites. There was no need for sample enrichment or any intensive extraction technique, which allowed us to accomplish a fairly short sample to answer timeframe Additionally, the inexpensiveness of paper-based detection with visual detection further enhances the potential use as a broad screening tool for a wide range of STEC pathogenic bacteria.
Ideally, this strategy would be used for a quick early determination of contamination if there is a suspicion of food contamination. We envision that this type of testing could potentially find usage in the food distribution pathway from the farms to the factories or even grocery stores. This method can be utilized to detect other pathogens in food by switching the primers to detect different targets. The ability to detect more than one pathogen simultaneously allows us to have the capability to screen more pathogenic targets in an on-site manner, which is crucial for contamination monitoring.

Supplementary Materials

The following supporting information can be downloaded at: https://0-www-mdpi-com.brum.beds.ac.uk/article/10.3390/chemosensors10060210/s1, Figure S1: Replicate images for Figure 5. These results were obtained from different bacterial lysates on different days, Figure S2: Statistical analysis for Figure 5. Test line measurements were obtained for A: stx1 test lane and B: stx2 test lane using image J and analyzed for significance against the control bands using Prism software. Each intensity measurement was taken 3 times for each concentration, Figure 3: Replicate images for Figure 6. These results were obtained from different bacterial lysates on different days, Figure S4: Statistical analysis for Figure 6. Test line measurements were obtained for A: stx1 test lane and B: stx2 test lane using imageJ and analyzed for significance against the control bands using Prism software. Each intensity measurement was taken 3 times for each concentration.

Author Contributions

Conceptualization, S.D. and S.K.D.; methodology, S.P.; software, E.D.; validation, S.P.; formal analysis, S.P.; investigation, S.P.; resources, S.D. and S.K.D.; data curation, S.P.; writing—original draft preparation, S.P.; writing—review and editing, E.D., S.K.D. and S.D.; supervision, S.K.D. and S.D.; project administration, S.K.D.; funding acquisition, S.K.D. and S.D. All authors have read and agreed to the published version of the manuscript.

Funding

This research was funded by NIGMS, grant numbers R01GM114321 and R01GM127706, and the National Science Foundation, grant number CBET-1841419. S.D. thanks the Miller School of Medicine of the University of Miami for the Lucille P. Markey in Biochemistry and Molecular Biology.

Institutional Review Board Statement

Not applicable.

Informed Consent Statement

Not applicable.

Data Availability Statement

Not applicable.

Conflicts of Interest

The authors declare no conflict of interest.

References

  1. Scharff, R.L. Economic Burden from Health Losses due to Foodborne Illness in the United States. J. Food Prot. 2012, 75, 123–131. [Google Scholar] [CrossRef] [PubMed]
  2. Bartsch, S.M.; Asti, L.; Nyathi, S.; Spiker, M.L.; Lee, B.Y. Estimated Cost to a Restaurant of a Foodborne Illness Outbreak. Public Health Rep. 2018, 133, 274–286. [Google Scholar] [CrossRef] [PubMed] [Green Version]
  3. Petrucci, S.; Costa, C.; Broyles, D.; Dikici, E.; Daunert, S.; Deo, S. On-site detection of food and waterborne bacteria—Current technologies, challenges, and future directions. Trends Food Sci. Technol. 2021, 115, 409–421. [Google Scholar] [CrossRef] [PubMed]
  4. Farrokh, C.; Jordan, K.; Auvray, F.; Glass, K.; Oppegaard, H.; Raynaud, S.; Thevenot, D.; Condron, R.; de Reu, K.; Govaris, A.; et al. Review of Shiga toxin-producing Escherichia coli (STEC) and their significance in dairy production. Int. J. Food Microbiol. 2013, 162, 190–212. [Google Scholar] [CrossRef] [PubMed]
  5. Scheutz, F.; Teel, L.D.; Beutin, L.; Piérard, D.; Buvens, G.; Karch, H.; Mellmann, A.; Caprioli, A.; Tozzoli, R.; Morabito, S.; et al. Multicenter evaluation of a sequence-based protocol for subtyping Shiga toxins and standardizing Stx nomenclature. J. Clin. Microbiol. 2012, 50, 2951–2963. [Google Scholar] [CrossRef] [PubMed] [Green Version]
  6. Melton-Celsa, A.R. Shiga Toxin (Stx) Classification, Structure, and Function. Microbiol. Spectr. 2014, 2, 2–4. [Google Scholar] [CrossRef] [Green Version]
  7. Mauro, S.A.; Koudelka, G.B. Shiga toxin: Expression, distribution, and its role in the environment. Toxins 2011, 3, 608–625. [Google Scholar] [CrossRef]
  8. Los, J.; Los, M.; Wegrzyn, A.; Wegrzyn, G. Altruism of Shiga toxin-producing Escherichia coli: Recent hypothesis versus experimental results. Front. Cell. Infect. Microbiol. 2013, 2, 166. [Google Scholar] [CrossRef] [Green Version]
  9. Rodríguez-Rubio, L.; Haarmann, N.; Schwidder, M.; Muniesa, M.; Schmidt, H. Bacteriophages of Shiga Toxin-Producing Escherichia coli and Their Contribution to Pathogenicity. Pathogens 2021, 10, 404. [Google Scholar] [CrossRef]
  10. Mcgannon, C.M.; Fuller, C.A.; Weiss, A.A. Different classes of antibiotics differentially influence Shiga toxin production. Antimicrob. Agents Chemother. 2010, 54, 3790–3798. [Google Scholar] [CrossRef] [Green Version]
  11. Chan, Y.S.; Ng, T.B. Shiga toxins: From structure and mechanism to applications. Appl. Microbiol. Biotechnol. 2016, 100, 1597–1610. [Google Scholar] [CrossRef] [PubMed]
  12. Tahamtan, Y.; Hayati, M.; Namavari, M. Prevalence and distribution of the Stx, Stx genes in Shiga toxin producing E. coli (STEC) isolates from cattle. Iran. J. Microbiol. 2010, 2, 8–13. [Google Scholar] [PubMed]
  13. Zhang, P.; Essendoubi, S.; Keenliside, J.; Reuter, T.; Stanford, K.; King, R.; Lu, P.; Yang, X. Genomic analysis of Shiga toxin-producing Escherichia coli O157:H7 from cattle and pork-production related environments. NPJ Sci. Food 2021, 5, 21. [Google Scholar] [CrossRef] [PubMed]
  14. Valilis, E.; Ramsey, A.; Sidiq, S.; Dupont, H.L. Non-O157 Shiga toxin-producing Escherichia coli—A poorly appreciated enteric pathogen: Systematic review. Int. J. Infect. Dis. 2018, 76, 82–87. [Google Scholar] [CrossRef] [Green Version]
  15. Deisingh, A.K.; Thompson, M. Strategies for the detection of Escherichia coli O157:H7 in foods. J. Appl. Microbiol. 2004, 96, 419–429. [Google Scholar] [CrossRef] [Green Version]
  16. Han, X.; Liu, Y.; Yin, J.; Yue, M.; Mu, Y. Microfluidic devices for multiplexed detection of foodborne pathogens. Food Res. Int. 2021, 143, 110246. [Google Scholar] [CrossRef]
  17. Sohrabi, H.; Majidi, M.R.; Khaki, P.; Jahanban-Esfahlan, A.; De La Guardia, M.; Mokhtarzadeh, A. State of the art: Lateral flow assays toward the point-of-care foodborne pathogenic bacteria detection in food samples. Compr. Rev. Food Sci. Food Saf. 2022, 21, 1868–1912. [Google Scholar] [CrossRef]
  18. Shin, J.H.; Hong, J.; Go, H.; Park, J.; Kong, M.; Ryu, S.; Kim, K.-P.; Roh, E.; Park, J.-K. Multiplexed detection of foodborne pathogens from contaminated lettuces using a handheld multistep lateral flow assay device. J. Agric. Food Chem. 2018, 66, 290–297. [Google Scholar] [CrossRef]
  19. Lin, L.; Zheng, Y.; Huang, H.; Zhuang, F.; Chen, H.; Zha, G.; Yang, P.; Wang, Z.; Kong, M.; Wei, H.; et al. A visual method to detect meat adulteration by recombinase polymerase amplification combined with lateral flow dipstick. Food Chem. 2021, 354, 129526. [Google Scholar] [CrossRef]
  20. Lalremruata, A.; Nguyen, T.T.; Mccall, M.B.B.; Mombo-Ngoma, G.; Agnandji, S.T.; Adegnika, A.A.; Lell, B.; Ramharter, M.; Hoffman, S.L.; Kremsner, P.G.; et al. Recombinase Polymerase Amplification and Lateral Flow Assay for Ultrasensitive Detection of Low-Density Plasmodium Falciparum Infection from Controlled Human Malaria Infection Studies and Naturally Acquired Infections. J. Clin. Microbiol. 2020, 58, e01879-19. [Google Scholar] [CrossRef]
  21. Petrucci, S.; Costa, C.; Broyles, D.; Kaur, A.; Dikici, E.; Daunert, S.; Deo, S.K. Monitoring Pathogenic Viable E. coli O157:H7 in Food Matrices Based on the Detection of RNA Using Isothermal Amplification and a Paper-Based Platform. Anal. Chem. 2022, 94, 2485–2492. [Google Scholar] [CrossRef] [PubMed]
  22. Li, J.; Macdonald, J.; von Stetten, F. Review: A comprehensive summary of a decade development of the recombinase polymerase amplification. Analyst 2019, 144, 31–67. [Google Scholar] [CrossRef] [PubMed] [Green Version]
  23. Piepenburg, O.; Williams, C.H.; Stemple, D.L.; Armes, N.A. DNA Detection Using Recombination Proteins. PLoS Biol. 2006, 4, e204. [Google Scholar] [CrossRef]
  24. Lobato, I.M.; O’Sullivan, C.K. Recombinase polymerase amplification: Basics, applications and recent advances. Trends Anal. Chem. TRAC 2018, 98, 19–35. [Google Scholar] [CrossRef] [PubMed]
  25. Park, M.; Won, J.; Choi, B.Y.; Lee, C.J. Optimization of primer sets and detection protocols for SARS-CoV-2 of coronavirus disease 2019 (COVID-19) using PCR and real-time PCR. Exp. Mol. Med. 2020, 52, 963–977. [Google Scholar] [CrossRef] [PubMed]
  26. Barra, G.B.; Rita, T.H.S.; Mesquita, P.G.; Jacomo, R.H.; Nery, L.F.A. Analytical Sensitivity and Specificity of Two RT-qPCR Protocols for SARS-CoV-2 Detection Performed in an Automated Workflow. Genes 2020, 11, 1183. [Google Scholar] [CrossRef] [PubMed]
  27. Etcheverría, A.I.; Padola, N.L. Shiga toxin-producing Escherichia coli: Factors involved in virulence and cattle colonization. Virulence 2013, 4, 366–372. [Google Scholar] [CrossRef] [Green Version]
  28. Edson, D.C.; Empson, S.; Massey, L.D. Pathogen detection in food microbiology laboratories: An analysis of qualitative proficiency test data, 1999–2007. J. Food Saf. 2009, 29, 521–530. [Google Scholar] [CrossRef]
  29. Massih, M.A.; Planchon, V.; Polet, M.; Dierick, K.; Mahillon, J. Analytical performances of food microbiology laboratories—Critical analysis of 7 years of proficiency testing results. J. Appl. Microbiol. 2016, 120, 346–354. [Google Scholar] [CrossRef] [Green Version]
  30. Rahal, E.; Kazzi, N.; Nassar, F.; Matar, G. Escherichia coli O157:H7—Clinical aspects and novel treatment approaches. Front. Cell. Infect. Microbiol. 2012, 2, 138. [Google Scholar] [CrossRef] [Green Version]
  31. Gyles, C.L. Shiga toxin-producing Escherichia coli: An overview1. J. Anim. Sci. 2007, 85, e45–e62. [Google Scholar] [CrossRef]
  32. Momtaz, H.; Jamshidi, A. Shiga toxin-producing Escherichia coli isolated from chicken meat in Iran: Serogroups, virulence factors, and antimicrobial resistance properties. Poult. Sci. 2013, 92, 1305–1313. [Google Scholar] [CrossRef] [PubMed]
  33. Zarei, O.; Shokoohizadeh, L.; Hossainpour, H.; Alikhani, M.Y. The prevalence of Shiga toxin-producing Escherichia coli and enteropathogenic Escherichia coli isolated from raw chicken meat samples. Int. J. Microbiol. 2021, 2021, 3333240. [Google Scholar] [CrossRef]
  34. Doane, C.A.; Pangloli, P.; Richards, H.A.; Mount, J.R.; Golden, D.A.; Draughon, F.A. Occurrence of Escherichia coli O157:H7 in diverse farm environments. J. Food Prot. 2007, 70, 6–10. [Google Scholar] [CrossRef] [PubMed]
  35. Armstrong, G.L.; Hollingsworth, J.; Morris, J.G., Jr. Emerging foodborne pathogens: Escherichia coli O157:H7 as a model of entry of a new pathogen into the food supply of the developed world. Epidemiol. Rev. 1996, 18, 29–51. [Google Scholar] [CrossRef] [PubMed]
  36. Kuiper, H.A.; Paoletti, C. Food And Feed Safety Assessment: The Importance of Proper Sampling. J. AOAC Int. 2019, 98, 252–258. [Google Scholar] [CrossRef] [PubMed]
  37. Faulds, N.; Evans, K.; Williams, J.; Leonte, A.-M.; Crabtree, D.; Church, K.; Leak, D.; Sohier, D.; Palomäki, J.-P.; Heikkinen, P.; et al. Validation of the Thermo Scientific Suretect™ Escherichia coli O157:H7 And STEC Screening PCR Assay and Suretect™ Escherichia coli STEC Identification PCR Assay for the Detection of Escherichia coli O157:H7 and the Escherichia Coli STEC Serotypes (O26, O45, O103, O111, O121, O145) From Fresh Raw Spinach, Fresh Baby Leaves, Fresh Cut Tomatoes, Frozen Raw Beef, Raw Beef Trim, and Beef Carcass Sponges: AOAC Performance Tested MethodSM 012102. J. AOAC Int. 2022, 105, 521–548. [Google Scholar] [CrossRef]
  38. Berenger, B.M.; Chui, L.; Ferrato, C.; Lloyd, T.; Li, V.; Pillai, D.R. Performance of four commercial real-time PCR assays for the detection of bacterial enteric pathogens in clinical samples. Int. J. Infect. Dis. 2022, 114, 195–201. [Google Scholar] [CrossRef]
  39. Parma, Y.R.; Chacana, P.A.; Lucchesi, P.M.A.; Rogé, A.; Granobles Velandia, C.V.; Krüger, A.; Parma, A.E.; Fernández-Miyakawa, M.E. Detection of Shiga toxin-producing Escherichia coli by sandwich enzyme-linked immunosorbent assay using chicken egg yolk IgY antibodies. Front. Cell. Infect. Microbiol. 2012, 2, 84. [Google Scholar] [CrossRef] [Green Version]
  40. Zhang, W.; Bielaszewska, M.; Pulz, M.; Becker, K.; Friedrich, A.W.; Karch, H.; Kuczius, T. New Immuno-PCR Assay for Detection of Low Concentrations of Shiga Toxin 2 and Its Variants. J. Clin. Microbiol. 2008, 46, 1292–1297. [Google Scholar] [CrossRef] [Green Version]
  41. Reischl, U.; Youssef, M.T.; Kilwinski, J.; Lehn, N.; Zhang, W.L.; Karch, H.; Strockbine, N.A. Real-time fluorescence PCR assays for detection and characterization of Shiga toxin, intimin, and enterohemolysin genes from Shiga toxin-producing Escherichia coli. J. Clin. Microbiol. 2002, 40, 2555–2565. [Google Scholar] [CrossRef] [PubMed] [Green Version]
  42. Murinda, S.E.; Ibekwe, A.M.; Zulkaffly, S.; Cruz, A.; Park, S.; Razak, N.; Paudzai, F.M.; Samad, A.L.; Baquir, K.; Muthaiyah, K.; et al. Real-time isothermal detection of Shiga toxin-producing Escherichia coli using recombinase polymerase amplification. Foodborne Pathog. Dis. 2014, 11, 529–536. [Google Scholar] [CrossRef] [PubMed]
  43. Verstraete, K.; Van Coillie, E.; Werbrouck, H.; Van Weyenberg, S.; Herman, L.; Del-Favero, J.; De Rijk, P.; De Zutter, L.; Joris, M.-A.; Heyndrickx, M.; et al. A qPCR assay to detect and quantify Shiga toxin-producing E. coli (STEC) in cattle and on farms: A potential predictive tool for STEC culture-positive farms. Toxins 2014, 6, 1201–1221. [Google Scholar] [CrossRef] [PubMed]
  44. Jinneman, K.C.; Yoshitomi, K.J.; Weagant, S.D. Multiplex real-time PCR method to identify Shiga toxin genes stx1 and stx2 and Escherichia coli O157:H7/H serotype. Appl. Environ. Microbiol. 2003, 69, 6327–6333. [Google Scholar] [CrossRef] [Green Version]
  45. Shan, S.; Huang, Y.; Huang, Z.; Long, Z.; Liu, C.; Zhao, X.; Xing, K.; Xiao, X.; Liu, J.; Huang, Y.; et al. Detection of stx1 and stx2 and subtyping of Shiga toxin-producing Escherichia coli using asymmetric PCR combined with lateral flow immunoassay. Food Control 2021, 126, 108051. [Google Scholar] [CrossRef]
  46. Singh, P.; Liu, Y.; Bosilevac, J.M.; Mustapha, A. Detection of Shiga toxin-producing Escherichia coli, stx1, stx2 and Salmonella by two high resolution melt curve multiplex real-time PCR. Food Control 2019, 96, 251–259. [Google Scholar] [CrossRef]
  47. Capobianco, J.A.; Clark, M.; Cariou, A.; Leveau, A.; Pierre, S.; Fratamico, P.; Strobaugh, T.P.; Armstrong, C.M. Detection of Shiga toxin-producing Escherichia coli (STEC) in beef products using droplet digital PCR. Int. J. Food Microbiol. 2020, 319, 108499. [Google Scholar] [CrossRef]
  48. De Boer, E.; Beumer, R.R. Methodology for detection and typing of foodborne microorganisms. Int. J. Food Microbiol. 1999, 50, 119–130. [Google Scholar] [CrossRef]
  49. Ching, K.H.; He, X.; Stanker, L.H.; Lin, A.V.; Mcgarvey, J.A.; Hnasko, R. Detection of Shiga toxins by lateral flow assay. Toxins 2015, 7, 1163–1173. [Google Scholar] [CrossRef] [Green Version]
  50. Wang, J.; Katani, R.; Li, L.; Hegde, N.; Roberts, E.L.; Kapur, V.; Debroy, C. Rapid Detection of Escherichia coli o157 and Shiga Toxins by Lateral Flow Immunoassays. Toxins 2016, 8, 92. [Google Scholar] [CrossRef] [Green Version]
  51. Boone, J.T.; Campbell, D.E.; Dandro, A.S.; Chen, L.; Herbein, J.F. A Rapid Immunoassay for Detection of Shiga Toxin-Producing Escherichia coli Directly from Human Fecal Samples and Its Performance in Detection of Toxin Subtypes. J. Clin. Microbiol. 2016, 54, 3056–3063. [Google Scholar] [CrossRef] [PubMed] [Green Version]
Figure 1. Schematic representation of the work performed in this study. Briefly, E. coli is lysed within a sample and then the stx DNA is amplified with RPA before being visualized on a lateral flow assay strip.
Chemosensors 10 00210 g001
Figure 2. (a) Agarose gel visualization of amplified DNA, Lane 1: 100 bp ladder, Lane 2: E. coli O157: H7, Lane 3: E. coli O121, Lane 4: E. coli O26, Lane 5: P. aeruginosa, Lane 6: E. coli O6, Lane 7: Negative control (b) Lateral flow assay visualization of the same RPA products at concentrations of 106 CFU/mL. 1: E. coli O157:H7, 2: E. coli O121, 3: E. coli O26, 4: P. aeruginosa, 5: E. coli O6, 6: Negative control.
Chemosensors 10 00210 g002
Figure 3. Blast search results of our primers for (a) stx1 and (b) stx2 against the following organisms: Salmonella enterica, Listeria monocytogenes¸ Campylobacter jejuni, Clostridium perfringens, Staphylococcus aureus. These pathogens were selected based on their implication in food outbreaks. Results searched for highly similar sequences (megablast). These results were obtained from https://blast.ncbi.nlm.nih.gov/Blast.cgi (accessed on 14 July 2021).
Chemosensors 10 00210 g003
Figure 4. Primer sets were compared to their opposing toxin for cross-reactivity. (a) Shiga toxin 1 primers blasted against the sequence for Shiga toxin 2. (b) Shiga toxin 2 primers blasted against the sequence for Shiga toxin 1. These results were obtained by searching for highly similar sequences (megablast.) Results were obtained from https://blast.ncbi.nlm.nih.gov/Blast.cgi (accessed on 14 July 2021).
Chemosensors 10 00210 g004
Figure 5. LOD determination in media. Genomic DNA of E. coli O157:H7 was harvested from varying concentrations of bacteria ranging from 106 to 1 CFU/mL with a negative control as lysis buffer. Results were repeated in at least three separate experiments with a representative set being shown.
Chemosensors 10 00210 g005
Figure 6. LOD determination in spiked chicken samples. Strips 1 to 7 show varying spiked concentrations ranging from 106 to 10 E. coli O157:H7 with a negative control in strip 7. Results were repeated in three separate experiments with one representative experiment being highlighted.
Chemosensors 10 00210 g006
Figure 7. (a) 2% agarose gel visualization of the following: 1. DNA marker, 2: 106 E. coli O157:H7, 3: 106 E. coli O26, 4: 106 E. coli O121, 5: all three strains mixed at a concentration of 104 CFU/mL, 6: negative control.; (b) Lateral flow assay visualization of the same RPA products. 1: E. coli O157:H7, 2: E. coli O121, 3: E. coli O26, 4: Mixed sample, 5: Negative control. These experiments were repeated at minimum of 3 separate times on different days to ensure reproducibility. A representative image is shown.
Chemosensors 10 00210 g007
Table 1. Primer sequences used in this study.
Primer NamePrimer Sequence
stx1 F5′-FAM-TTTTATCGCTTTGCTGATTTTTCACATGTT-3′
stx1 R5′-DIG-CAAACCGTAACATCGCTCTTGCCACAGACT-3′
stx2 F5′-FAM-CAGAGATATCGACCCCTCTTGAACATATAT-3′
stx2 R5′-Biotin-GTATAACTGCTGTCCGTTGTCATGGAAACC-3′
Table 2. Literature examples of different detection strategies for STEC bacteria, focused predominantly on the detection of either the direct Shiga toxins or the stx1 and stx2 genes.
MethodologyAssay Run TimeLimit of DetectionReference
Immuno-PCRNot stated10 pg/mL purified toxin [40]
Real-time PCR~1 h5 × 103 CFU/mL[41]
Real-time RPA5–10 min~5–50 CFU/mL[42]
qPCRNot stated<2.7–3.7 log copies g−1 feces [43]
Multiplex Real-Time PCRNot stated6 CFU/mL[44]
Asymmetric PCR and LFANot statedNot stated but 10 × PCR[45]
Multiplex melting curve PCR>6 h (because of enrichment step)1 CFU/mL with enrichment of 6 h [46]
Droplet digital PCRNot statedNot stated [47]
Culture-Based1–3 days1 cell[48]
LFA-immunoassay<10 min0.1 ng/mL toxin[49]
LFA-immunoassay~3 h105[50]
Immunoassay<30 min3.3 × 101 CFU/g to 1.3 × 10³ CFU/g when induced with antibiotic[51]
Publisher’s Note: MDPI stays neutral with regard to jurisdictional claims in published maps and institutional affiliations.

