Article

Optical Chemical Sensor Based on Fast-Protein Liquid Chromatography for Regular Peritoneal Protein Loss Assessment in End-Stage Renal Disease Patients on Continuous Ambulatory Peritoneal Dialysis

1
AS Ldiamon, 50411 Tartu, Estonia
2
Jeko Disain OÜ, 51014 Tartu, Estonia
3
Department of Photonics, Saint Petersburg Electrotechnical University “LETI”, 197022 Saint Petersburg, Russia
4
Saint Petersburg City Mariinsky Hospital, 199004 Saint Petersburg, Russia
5
Federal State Budgetary Scientific Institution “Institute of Experimental Medicine” (FSBSI “IEM”), 197376 Saint Petersburg, Russia
6
Department of Engineering, University of Applied Sciences Brandenburg, 14770 Brandenburg an der Havel, Germany
*
Author to whom correspondence should be addressed.
Submission received: 13 May 2022 / Revised: 11 June 2022 / Accepted: 15 June 2022 / Published: 17 June 2022
(This article belongs to the Section Optical Chemical Sensors)

Abstract

:
Point-of-care testing (POCT) devices are becoming increasingly popular in the medical community as an alternative to conventional laboratory testing, especially for home treatments or other forms of outpatient care. Multiple-use chemical sensors with minimal requirements for disposables are among the most practical and cost-effective POC diagnostic instruments, especially in managing chronic conditions. An affordable, simple, and easy-to-use optical sensor based on fast protein liquid chromatography with direct UV absorption detection was developed for the rapid determination of the total protein concentration in effluent peritoneal dialysate and for the assessment of protein losses in end-stage renal disease (ESRD) patients on constant ambulatory peritoneal dialysis (CAPD). The sensor employs non-disposable PD-10 desalting columns for the separation of molecules with different molecular weights and a deep UV LED (maximum at 285 nm) as a light source for optical detection. The analytic procedure is relatively simple, takes 10–15 min, and potentially can be performed by patients themselves or nursing staff without laboratory training. Preliminary clinical trials on a group of 23 patients on CAPD revealed a good concordance between the protein concentrations in dialysate samples measured with the sensor and an automated biochemical analyzer; the mean relative error was about 10%, which is comparable with routine clinical laboratory methods.

1. Introduction

Point-of-care testing (POCT), otherwise referred to as “near-patient” or “bedside”, is medical diagnostic testing that is performed at the place and time of patient care [1]. Various POCT diagnostic instruments, e.g., mobile X-ray [2,3,4] and ultrasound [5] imaging systems, cardiac monitors [6], and pulse oximeters [7], are well-established and have been used for decades. In the context of clinical biochemical diagnostics, POCT means any laboratory test performed in patient care areas, either in a hospital or at home [8]. POCT biochemical diagnostic devices are extremely diverse and include hand-held analyzers, wearable [9,10] or smartphone-based sensors [11], single-use testing systems, paper-based microfluidics [12], or even bench-top analyzers [7], and they can be primarily intended for hospital or home use. The main distinctive feature of POCT devices is that they can be operated by personnel without special laboratory training, e.g., hospital or ambulatory nursing staff, paramedics, and patients, or their caregivers. As a result, this technology is increasingly popular in the medical community as a viable and convenient alternative to conventional laboratory testing, especially, but not exclusively, for the home treatment of chronically ill patients, and in emergency medicine, general practitioners’ offices, and various forms of outpatient care [13,14]. POCT instruments are indispensable for maintaining diabetes patients [9,10], primary diagnostics of infectious diseases [15,16,17], acute myocardial infarction [18], and other chronic and urgent conditions.
POCT devices provide faster access to important diagnostic information and, in the case of home-use instruments, this information can be automatically transferred to a clinician in real-time, thus enabling the remote monitoring of a patient’s condition, eliminating unnecessary hospital visits, reducing the necessity for nursing staff, and, eventually, improving treatment outcomes [13,14,19]. Despite the widespread implementation of single-use testing systems, multiple-use devices with minimal requirements for disposable materials and chemical reagents are in great demand and can cut medical costs and further advance the POCT diagnostic paradigm in clinical practice. This problem is particularly obvious in maintaining chronic or terminal medical conditions when regular testing (often multiple times a day) and life-supporting treatments are needed for years or even decades. There is a recent trend in POCT technology for developing lab-on-chip microfluidic platforms [20,21,22], but traditional chemical sensors still hold their positions in the field of biochemical diagnostics [23,24].
Chronic kidney disease (CKD) is a long-term and often slowly developing medical condition accompanied by gradually deteriorating renal function, which in some patients, especially but not exclusively older people, could lead to complete kidney failure or end-stage renal disease (ESRD). About 10% of the adult population in developed countries with a relatively high life expectancy are experiencing some symptoms of CKD with declining kidney function, which makes it one of the leading causes of morbidity and mortality among all non-infectious deceases [25]. Untreated ESRD inevitably progresses to uremia (clinical syndrome associated with an accumulation of endogenic toxic substances in the blood and other biological fluids) with potentially fatal outcomes unless patients constantly receive renal replacement therapy (RRT) in the form of chronic dialysis or kidney transplantation, which helps to eliminate toxic substances from the human body and partially substitutes natural kidney function. In 2017 more than 2.5 million people globally were treated with RRT and the global demand for this kind of therapy is steadily growing. Moreover, a much higher number of diagnosed or undiagnosed ESRD patients did not have access to RRT due to socioeconomic conditions and subsequently died from the complications of uremia [25,26].
Although kidney transplantation is the most preferable and effective RRT modality, chronic dialysis is still dominant in most parts of the world even among individuals eligible for transplant [26]. The overwhelming majority of ESRD patients receive in-center hemodialysis (HD) or hemodiafiltration (HDF), whereas about 10% are treated by at-home peritoneal dialysis (PD) based on their HD intolerance, limited mobility, young age (pediatric patients), residence in rural areas far from dialysis centers, or personal preference [27,28]. At-home HD treatments are still available for only a small number of ESRD patients, mostly in high-income countries [29].
PD is a method of RRT that relies on the human peritoneum as a natural osmotic semipermeable membrane for the removal of metabolic wastes. Contrary to HD, which requires sophisticated dialysis machines (artificial kidneys) operated by qualified medical and technical staff, PD can be performed at home by a patient or his/her caregivers. During PD, a ready-to-use sterile dialysis solution (peritoneal dialysate) with a balanced electrolyte composition is introduced into the abdominal cavity via an implanted peritoneal catheter and is retained inside the abdomen for 4 to 8 h. To induce ultrafiltration, the peritoneal dialysate also contains an osmotic agent, e.g., dextrose or amino acids. Due to the transmembrane concentration gradient’s low- and middle-molecular-weight metabolic waste (urea, uric acid, creatinine, phosphates, advanced glycation products, oligopeptides, etc.), some proteins and excess water are eliminated from blood and other biological fluids into the peritoneal dialysate via the peritoneal membrane. The dialysate is manually drained and refilled 4-6 times a day in patients receiving continuous ambulatory peritoneal dialysis (CAPD) or continuously replaced at night using a special device (PD cycler machine) in patients treated with automated peritoneal dialysis (APD) [30,31].
The efficacy and safety of CAPD or APD are regularly assessed by biochemical analysis of blood plasma and effluent dialysate. The concentrations of the main uremic markers (substances that are retained in uremic patients and are artificially eliminated by dialysis), i.e., urea, creatinine, uric acid, phosphates, and total protein, are determined in the plasma and dialysate samples [31,32,33]. Usually, this diagnostic procedure is carried out during a planned hospital visit once every three months; the urea-based kt/V dialysis index characterizing the dose of the dialysis is calculated and, if necessary, a peritoneal equilibration test is conducted [34]. To provide a faster and more regular determination of the dose for dialysis, POCT devices for the rapid measurement of urea and creatinine plasma levels in patients on dialysis are also actively being developed [35,36].
Unlike synthetic HD membranes with calibrated pores, the peritoneum is also partially permeable for larger molecules, mainly proteins. For this reason, protein loss is an inevitable side-effect of PD therapy; it should be constantly monitored and compensated for by diet correction to avoid treatment complications. Protein loss poorly correlates with the clearance of low-molecular-weight uremic markers and strongly depends on multiple factors, including the individual features of the peritoneal membrane, intraabdominal inflammation, overall duration of PD treatment, etc. [33,34]. Abnormally high protein losses could lead to malnutrition [37], which has to be corrected by increased protein intake, and, according to some reports, could be associated with an elevated risk of the most severe PD complication—dialysis peritonitis [38,39,40,41,42]. The early diagnosis or even prediction of this dangerous condition is extremely important; highly specialized POCT sensors for detecting the specific immune biomarkers of dialysis peritonitis were recently created. However, for various technical and financial reasons, these sensors have not been widely implemented into clinical practice and a more traditional approach based on the characteristic clinical picture and positive effluent dialysate microbial culture is still commonly used [43,44]. As a result, the regular monitoring of PD protein losses, which may be an auxiliary clinical marker of a higher risk of peritonitis, is especially relevant.
For practical reasons protein determination in the effluent peritoneal dialysate is conducted in clinical laboratories using the same analytical methods, protocols, and automated biochemical analyzers as more conventional blood or urine samples: colorimetry, enzyme immunoassays, dry chemistry (test strips), turbidimetry, electrophoresis, etc. [45]. However, these techniques were not specifically validated or adapted for peritoneal dialysate, and except for test strips, which are specifically sensitive to albumins, optimized for urine, and often unreliable, require transporting the samples to a laboratory. For the regular, day-to-day monitoring of protein losses in CAPD patients, it would be more convenient to employ a specialized POCT instrument for use in ambulatory dialysis centers, the offices of general practitioners, or even at home.
The aim of this work is the development and validation of a compact, affordable, non-disposable diagnostic optical chemical sensor for the rapid determination of the total protein concentration in effluent peritoneal dialysate and for the assessment of peritoneal protein loss, which is based on fast protein liquid chromatography (FPLC) with ultraviolet (UV) optical absorption detection. The sensor is capable of operating in the framework of the “point-of-care” diagnostics paradigm and potentially enables the regular day-to-day monitoring of peritoneal protein losses, which could significantly improve treatment outcomes.

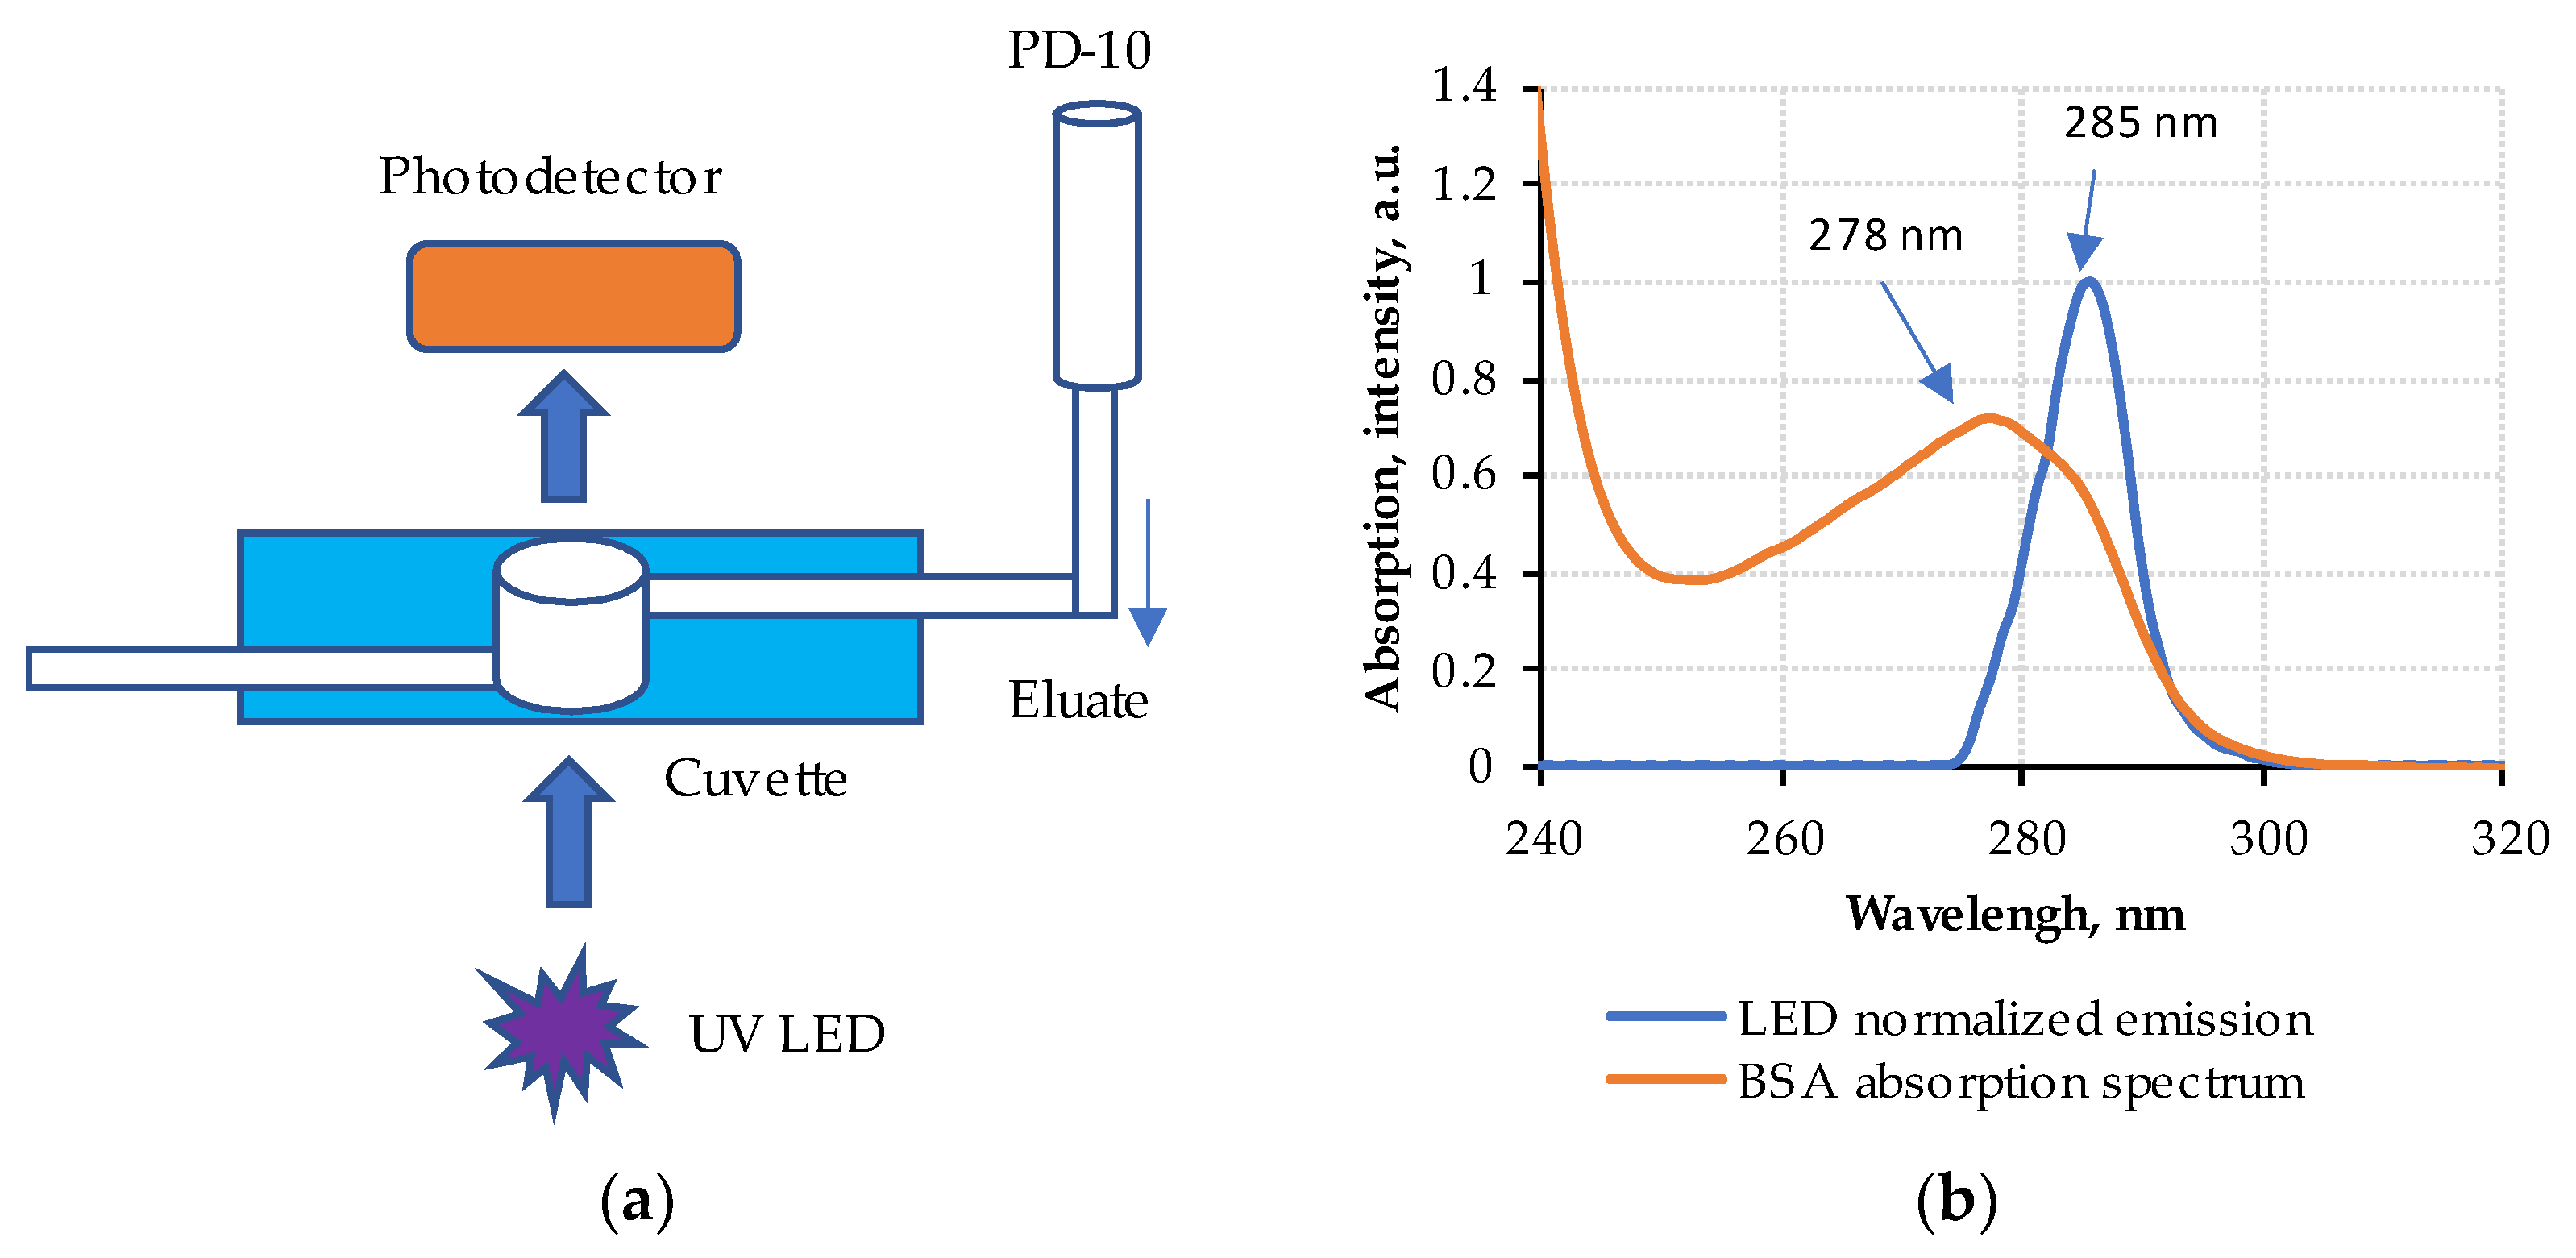
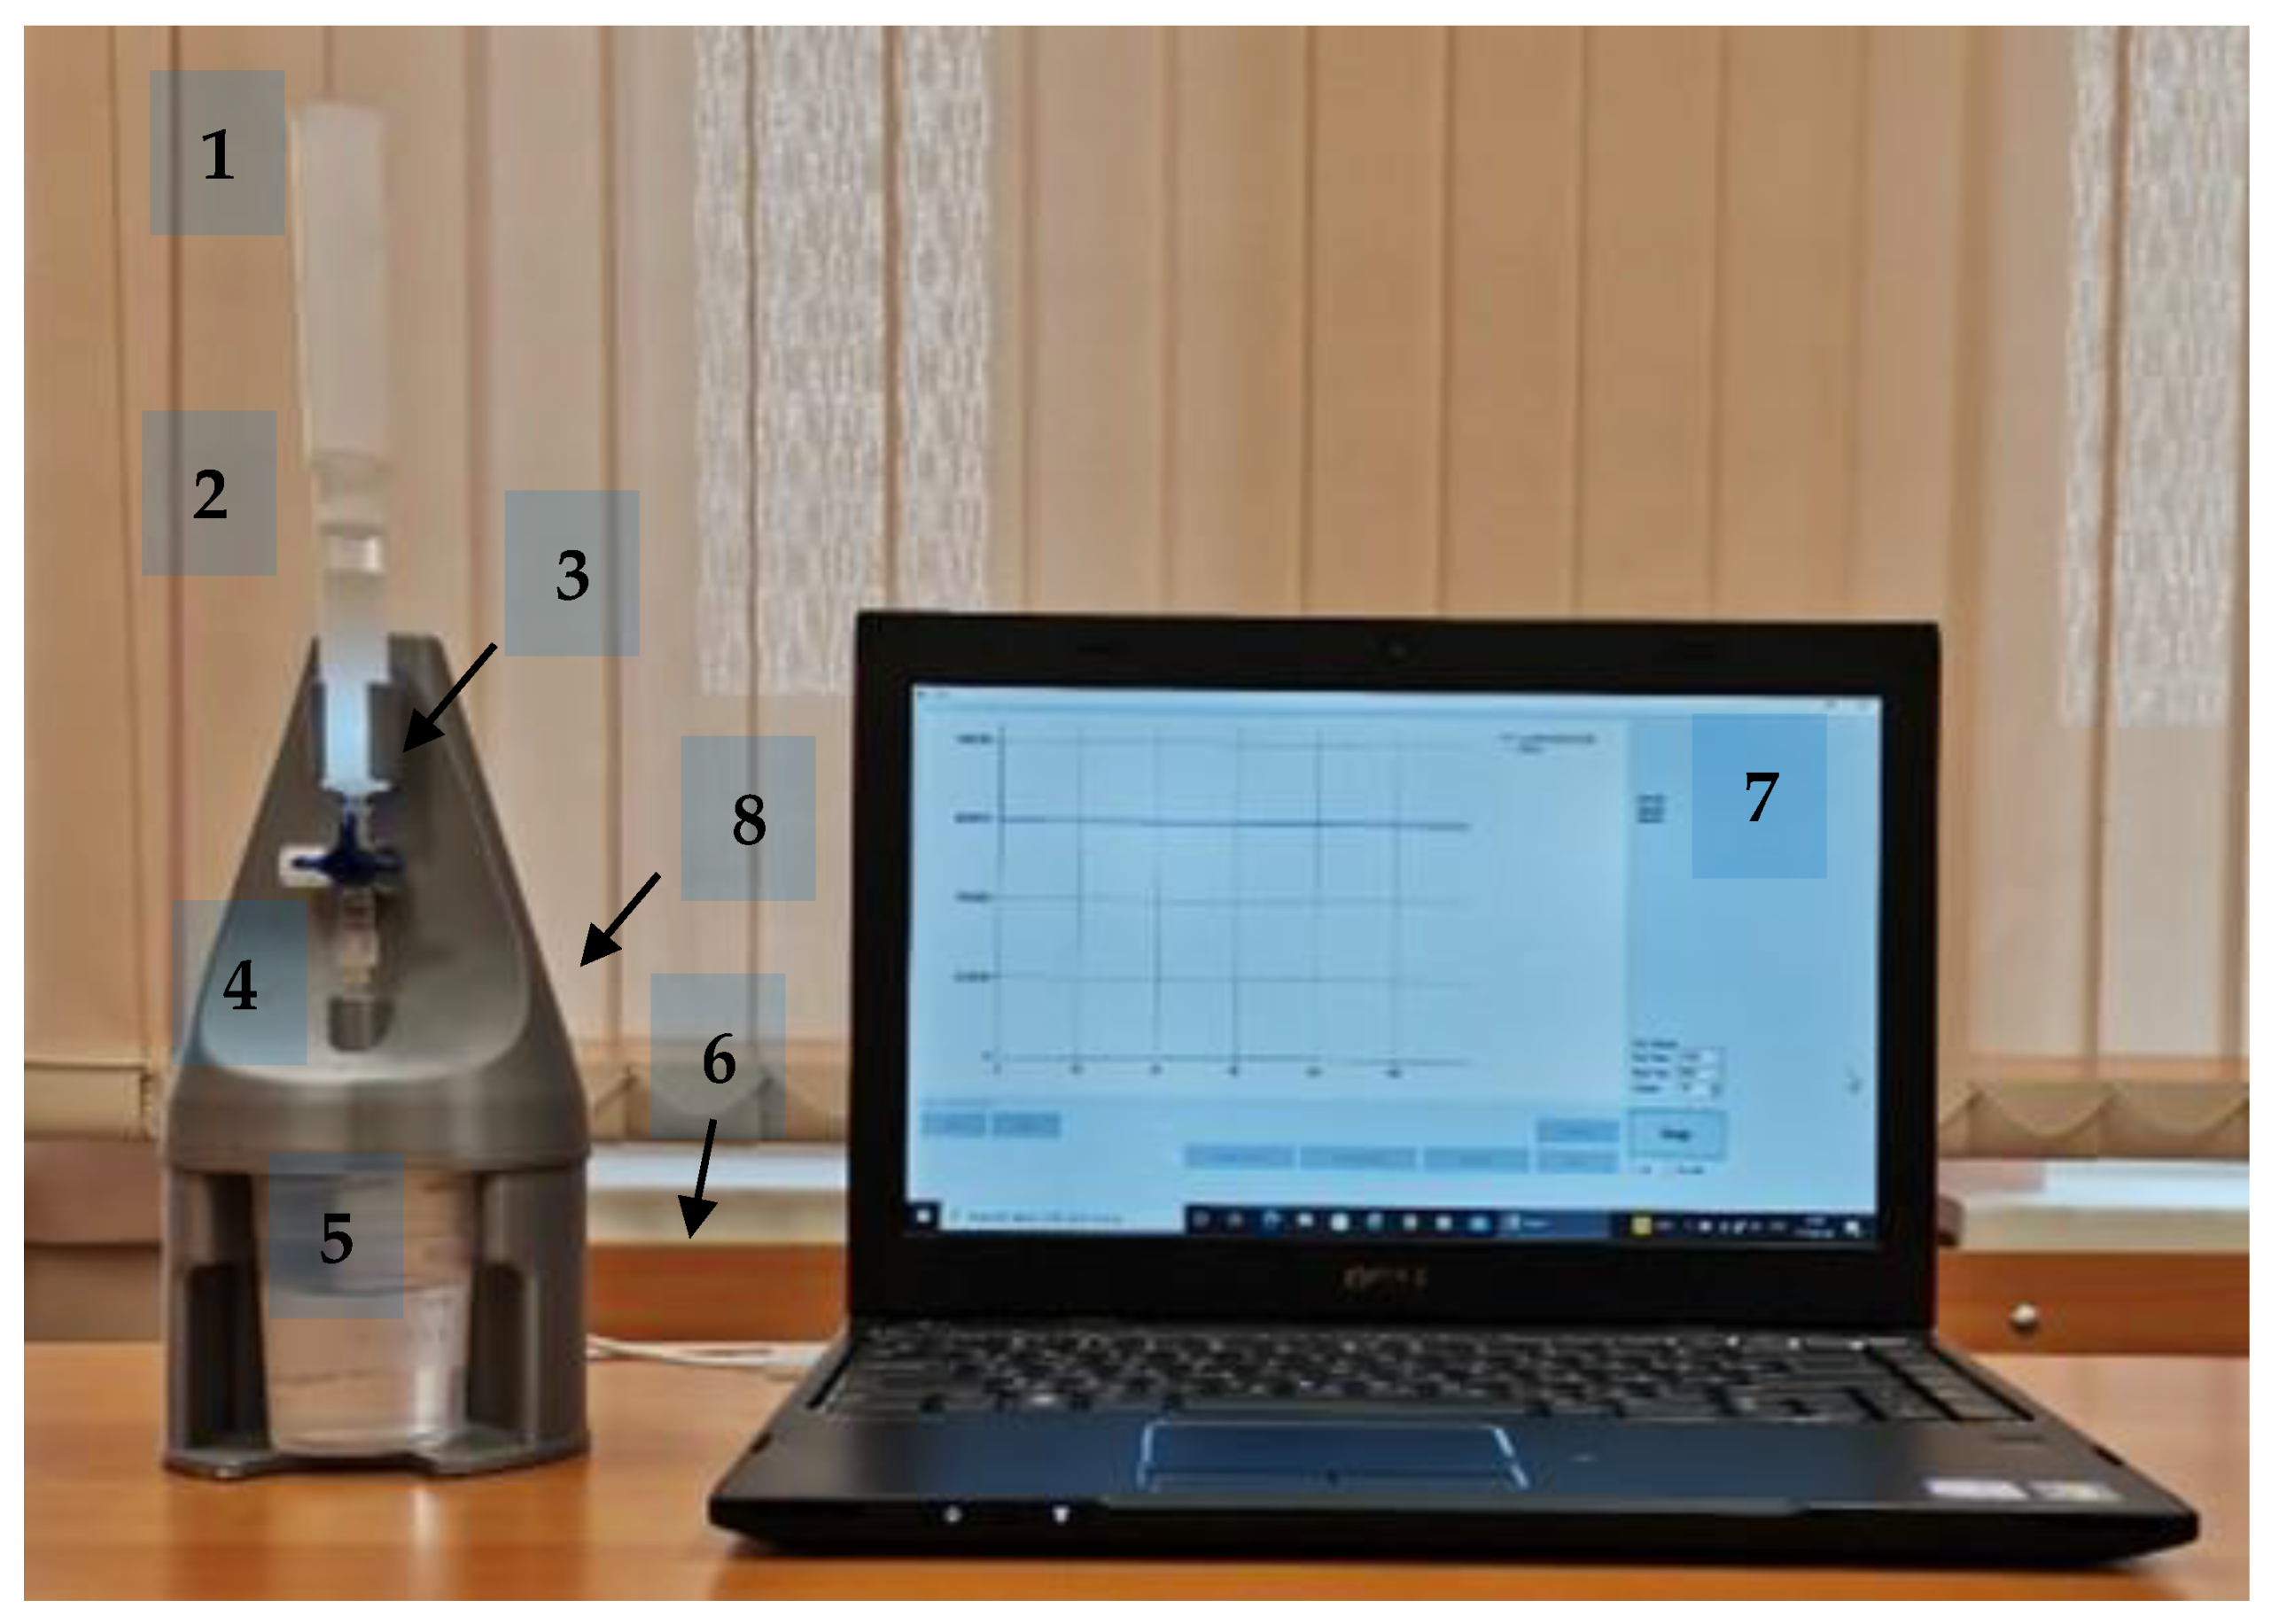
2. Materials and Methods

For the protein determination in effluent peritoneal dialysate, an optoelectronic chromatographic diagnostic sensor based on fast protein liquid chromatography (FPLC) with direct UV absorption detection was developed by Ldiamon AS (Tartu, Estonia). The sensor has a simple design and is built from relatively cheap components. Commercially available affordable reusable PD-10 desalting columns (Code No. 17-0851-01) from GE Healthcare® Bio-Sciences AB (Uppsala, Sweden) containing Sephadex G-25 Medium chromatographic gel are used for the group separation of protein macromolecules from low- and middle-molecular-weight substances in dialysate samples. The chromatographic optical detector installed inside the sensor consists of a deep UV LED with a built-in quartz collimating lens emitting at a wavelength of 285 nm as a light source and a visible-blind UV photodiode as a photodetector. Chromatograms are recorded by direct measurement of the UV absorption of the eluate flowing from the PD-10 column passing through the quartz cuvette (see Figure 1a). Earlier, a similar system for the diagnosis of proteinuria was proposed and tested by the authors on urine samples [46].
The working wavelength of the chromatographic detector was chosen according to the characteristic absorption spectra of plasma proteins (mainly albumin) in the spectral range from 250 nm to 290 nm [47]; the absorption spectrum of the bovine serum albumin (BSA) water solution (concentration 2 g/L, cuvette thickness 10 mm) and the normalized spectrum of the UV LED emission measured with the AvaSpec-2048 spectrophotometer from Avantes B.V. (Apeldoorn, the Netherlands) are presented in Figure 1b. The solution was prepared from 99% pure BSA powder (Lot No. 60154016) from DIA-M (Moscow, Russia). The UV LED has a relatively narrow emission spectrum with FWHM of about 10 nm, which completely fits inside the 278 nm protein absorption band, so additional spectral filters are not required [48].
The sensor consists of the following basic components (Figure 2): 1 is the LabMate buffer reservoir (Code No. 18-3216-03) from GE Healthcare® Bio-Sciences AB (Uppsala, Sweden); 2 is the chromatographic column PD-10; 3 is the three-way valve for changing liquid flow direction; 4 is the photometric unit for detecting the optical absorption of the eluate at 285 nm; 5 is the drain vessel; 6 is the USB interface cable; 7 is the laptop with the Windows® operating system and the sensor-dedicated software installed; 8 is the liquid flow rate adjustment screws (flow rate about 2 mL/min when the buffer reservoir is full, and about 1 mL/min when the reservoir is almost empty needs be maintained). The three-way valve can be set to three positions: (a) the column is locked (standby mode), (b) the column is connected to the flowthrough cuvette (chromatogram-recording or column-regeneration mode), and (c) the cuvette connected to the service port for manual cleansing or air bubble removal (a Luer-Lock syringe filled with a buffer solution must be connected to the service port).
Using a 10 mL Luer-Lock syringe and a filter holder (Code No. 4617100V) from B.Braun AG (Melsungen, Germany), dialysate samples were passed through a disposable Whatman® GF/B hydrophilic glass microfiber filter with a diameter of 24 mm and a pore size of 1.0 μm (Product No. Z242195) from Merck KGaA (Darmstadt, Germany) to remove suspended microparticles with a size of 0.02–1.00 µm and avoid column contamination. Dialysate prefiltration is not mandatory unless samples are visually turbid but could sufficiently prolong a lifetime of PD-10 columns; if necessary, cheaper generic filters could be used instead of Whatman® products.
The analytical method is based on the principle of FPLC—the separation of protein macromolecules from small and middle molecules due to the differences in their equilibrium distribution between two immiscible phases in a chromatographic column—both mobile (buffer solution) and stationary (gel filtration resin Sephadex ™ G-25), with simultaneous detection of the eluate UV absorption at a wavelength of 285 nm [46,49]. The chromatography technique of PD-10 columns is gel filtration: molecules in effluent peritoneal dialysate samples are separated based on size. Protein macromolecules larger than pores in the Sephadex gel matrix are quickly eluted with the void volume of buffer outside the matrix, whereas smaller molecules penetrate the pores and are eluted later just before the total volume of the buffer has passed through the column [46,50]. The buffer solution transfers via the column only by gravity force (so-called gravity protocol is used for separation); the exclusion limit of the PD-10 column is M = 5000 Da, so both light and heavy proteins (albumin, immunoglobulins, β2-microclubulins, etc.) are separated into a single protein pool [51].
Optical absorption of almost all proteins in the UV region originates from aromatic amino acid residues: tryptophan, tyrosine, and phenylalanine. As a result, protein absorption spectra are very similar having the same characteristic absorption maximum around a wavelength of 280 nm but a relatively high level of variability in specific absorption coefficients, depending on the tryptophan content [47]. It is reasonable to propose that the sensor can determine the total protein concentration in biological fluids, but for each type of sample, separate calibration should be performed because of the possibly different protein compositions. The most abundant protein in the peritoneal dialysate is albumin [52], and BSA solutions were used as the most convenient and affordable medium for calibration in the current research (Section 3.1). Undoubtedly, calibration using several different proteins, e.g., albumin and immunoglobulins, is preferable and would be performed in the future. Because columns from different batches may have minor variations in characteristics, it is recommended to recalibrate the sensor after installing brand-new columns or prolonged storage without use.
The obvious advantage of the FPLC technique is that it does not require any expensive reagents or disposables, only a conventional TRIS buffer, which can be easily prepared from cheap and easily available chemicals. Buffer solution contains 10 mM of tris(hydroxymethyl)aminomethane (TRIS), 150 mM of NaCl, and 2 mM of ethylenediaminetetraacetic acid disodium salt (EDTA-Na2). TRIS (Product No. GE17-1321-01) and EDTA (Product No. ED) were purchased from Merck KGaA (Darmstadt, Germany), and sodium chloride (Product code 130314L) was obtained from LenReaktiv (Saint Petersburg, Russia). Before starting the analytic procedures, the column must be regenerated with 25 mL of buffer solution (full LabMate buffer reservoir). In the case of a completely new column or a column that has not been used for a long time, several (up to four) cycles of regeneration are required to eliminate any residual UV-absorbing substances from the gel. Several hundred samples can be analyzed using a single chromatographic column; after each series of samples, it is necessary to decontaminate the gel with an alkaline buffer (0.2 M NaOH in working buffer). The problems related to multiple uses of the columns are discussed in more detail in Section 3.3.
When the buffer solution is completely drained from the column after regeneration, a small sample of previously filtered peritoneal dialysate must be put directly on the gel surface inside the column using a micropipette. The volume of the sample can be varied from 100 μL to 2.5 mL; it was proven in our research that 0.5 mL is optimal for effluent peritoneal dialysate. In 30–60 s when the sample is fully absorbed by the gel, an additional 25 mL of buffer solution must be introduced into the buffer reservoir and the recording of a chromatogram must be initiated in the sensor software. Over the next 10–15 min, optical transmission of the eluate T(t) at a wavelength of 285 nm is continuously detected with the photometric unit (Figure 2) with a time interval of 1 s. For subsequent processing of the obtained chromatographic data, optical transmission should be recalculated into absorption in accordance with the Bouguer–Lambert–Beer law, the light intensity at the starting point when pure buffer solution is flowing through the cuvette is used as a reference [47]:
A ( t ) = l o g ( I 0 I ( t ) ) ,
where I(t) is the signal on the photodetector, which is proportional to the intensity of UV light transmitted by the cuvette with the eluate; and I0(t) is the reference signal, which is proportional to the intensity of UV light transmitted by the cuvette with pure buffer.
There are multiple approaches to the mathematical representation of chromatographic peaks [53]. In the case of peritoneal dialysate and PD-10 columns, the peaks were clearly asymmetrical and the best fit was achieved when chromatograms A(t) were approximated by a series of bi-Gaussian functions [54]:
A ( t ) = n = 0 N f ( t , t 0 n , σ 1 n , σ 2 n ) , f ( t , t 0 n , σ 1 n , σ 2 n ) = { A 0 n exp ( ( t t 0 n ) 2 2 ( σ 1 n ) 2 ) ,     t < t 0 n A 0 n exp ( ( t t 0 n ) 2 2 ( σ 2 n ) 2 ) ,     t t 0 n
where A 0 n is the amplitude of the nth peak; t 0 n is the elution time for the nth peak; σ 1 n is the width of the left half of the nth peak; σ 2 n is the width of the right half of the nth peak; and N is the number of peaks.
The approximation was carried out by the Levenberg–Marquardt algorithm in Mathcad software. This technique allows for decomposing A(t) curves into separate peaks and estimating peaks’ areas, which are expected to be directly proportional to the concentration of peritoneal dialysate components including total protein, even when peaks are broad and significantly overlapped. It was proven empirically that the area of the right half-peak Sr found from the corresponding bi-Gaussian function gives the most accurate information about protein concentration:
S r = t 0 n A 0 n exp ( ( t t 0 n ) 2 2 ( σ 2 n ) 2 ) d t

3. Results

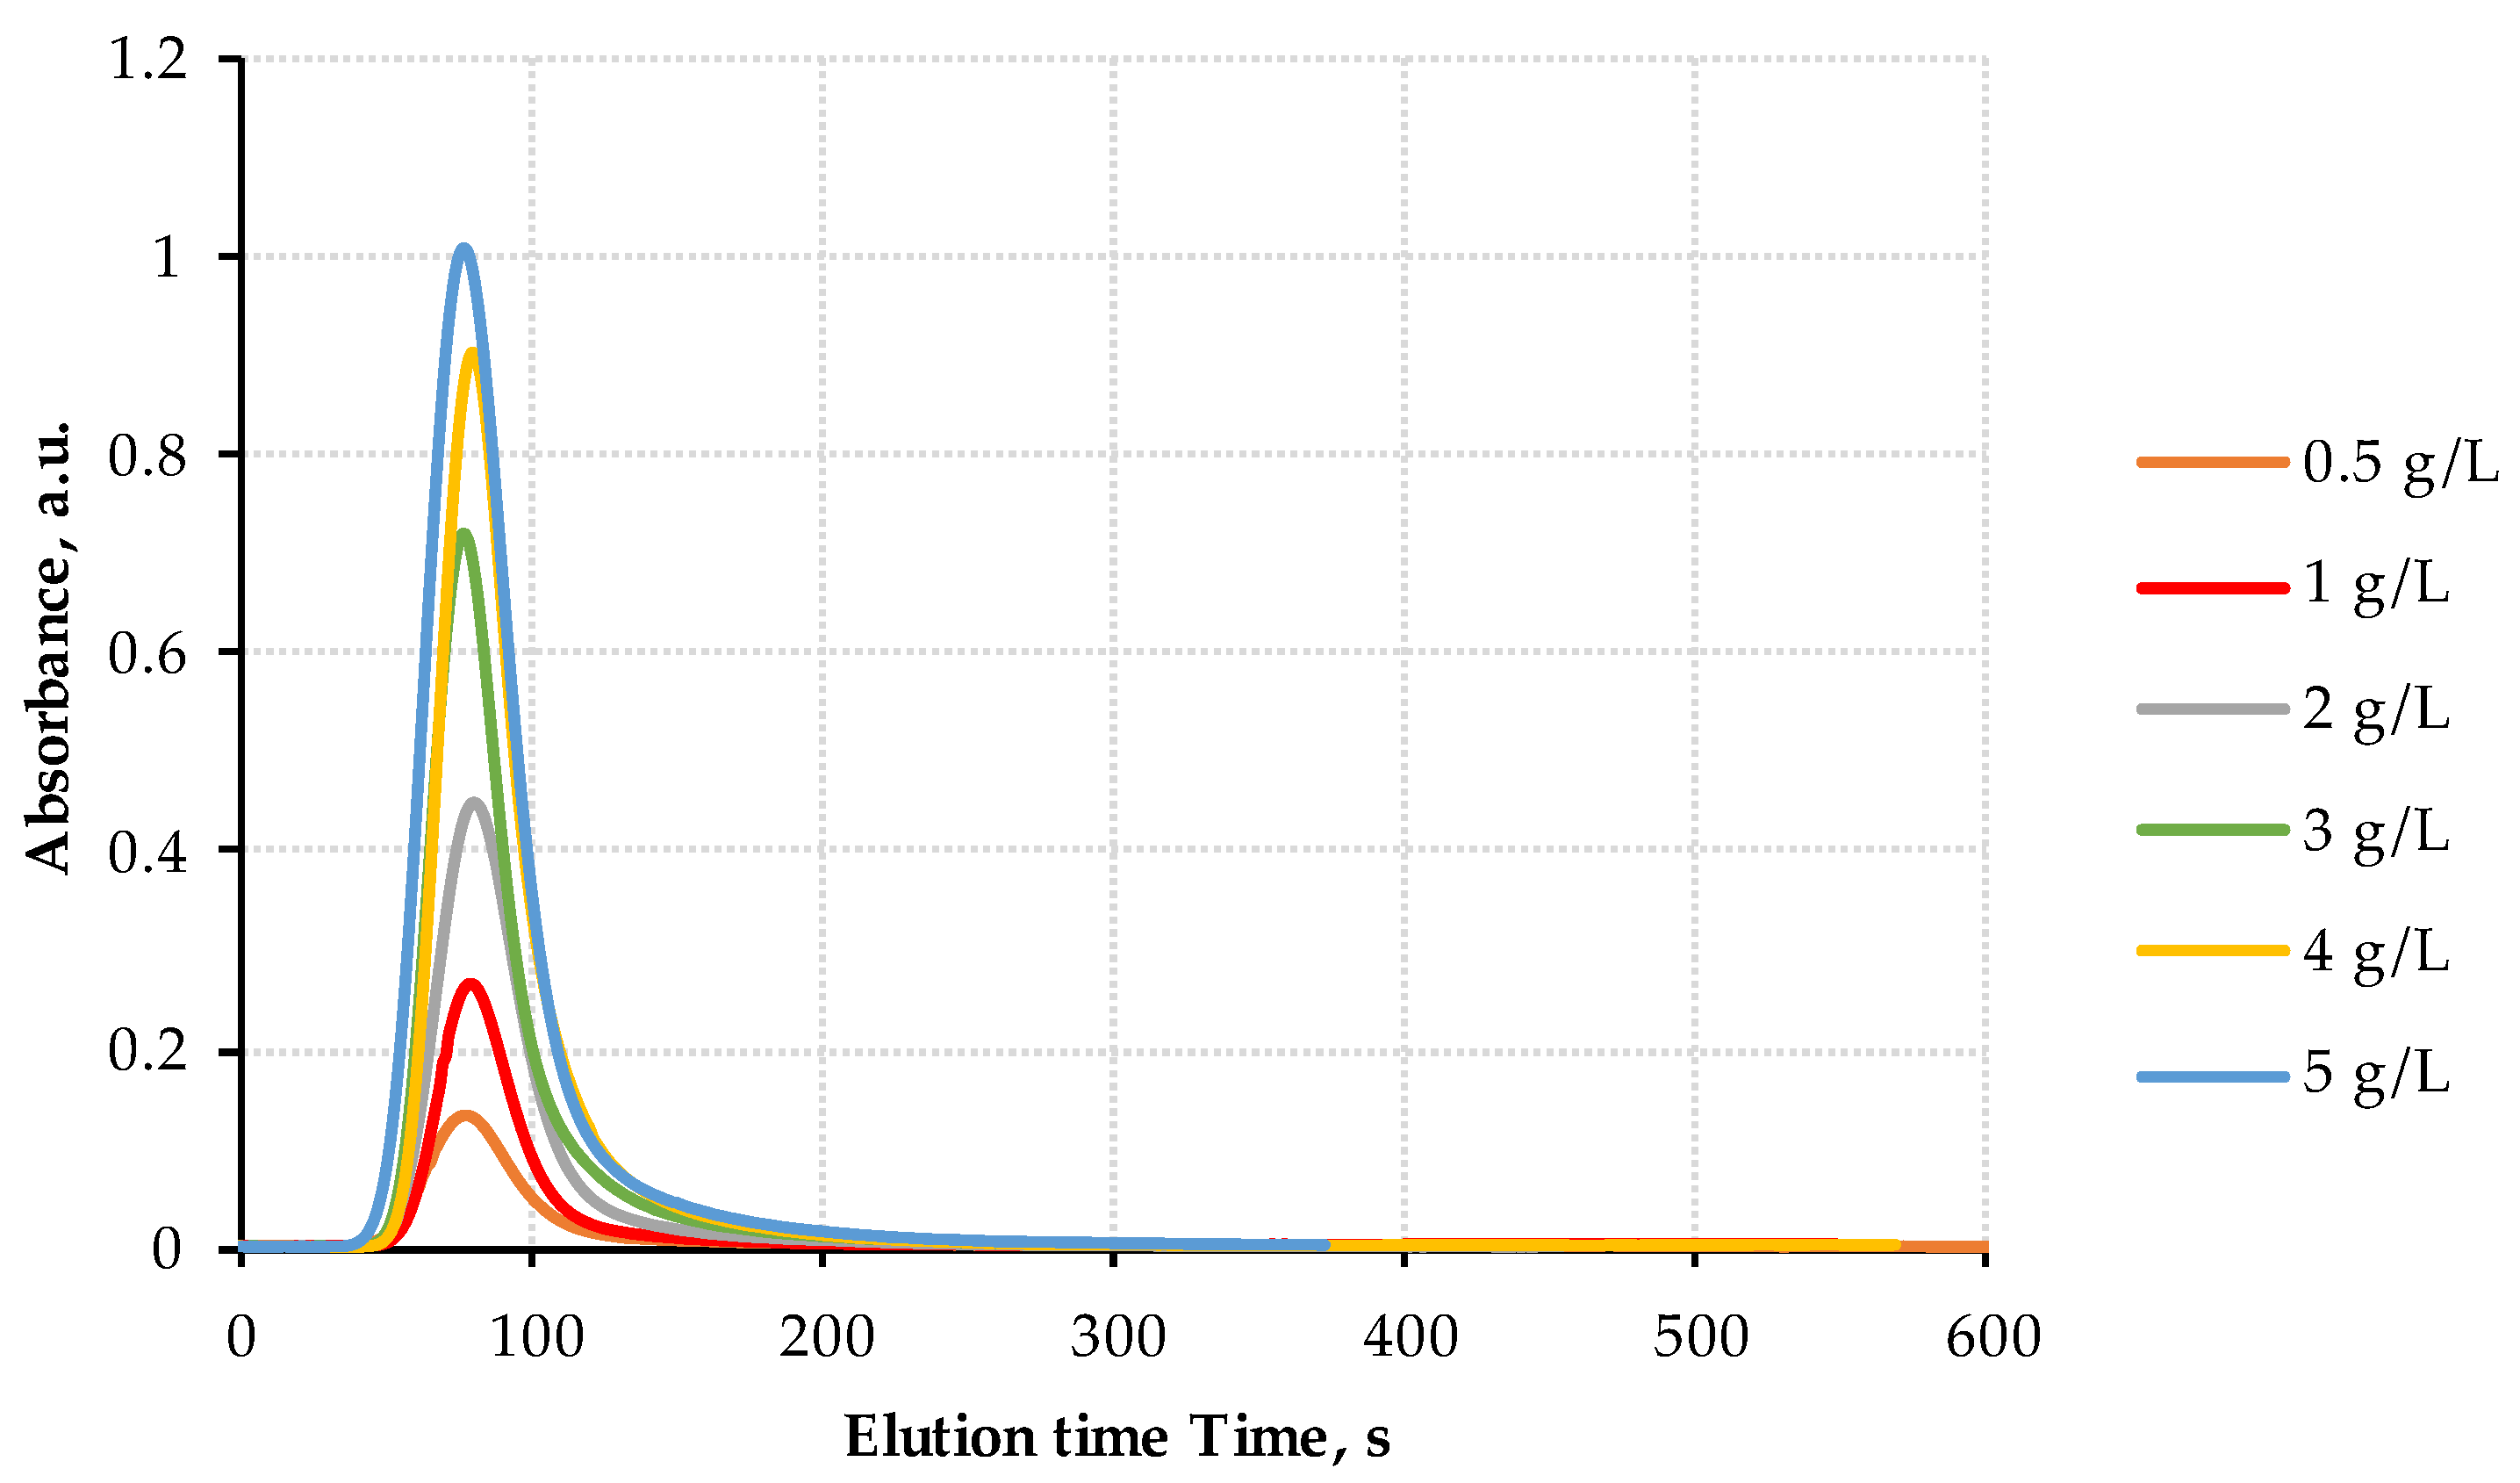
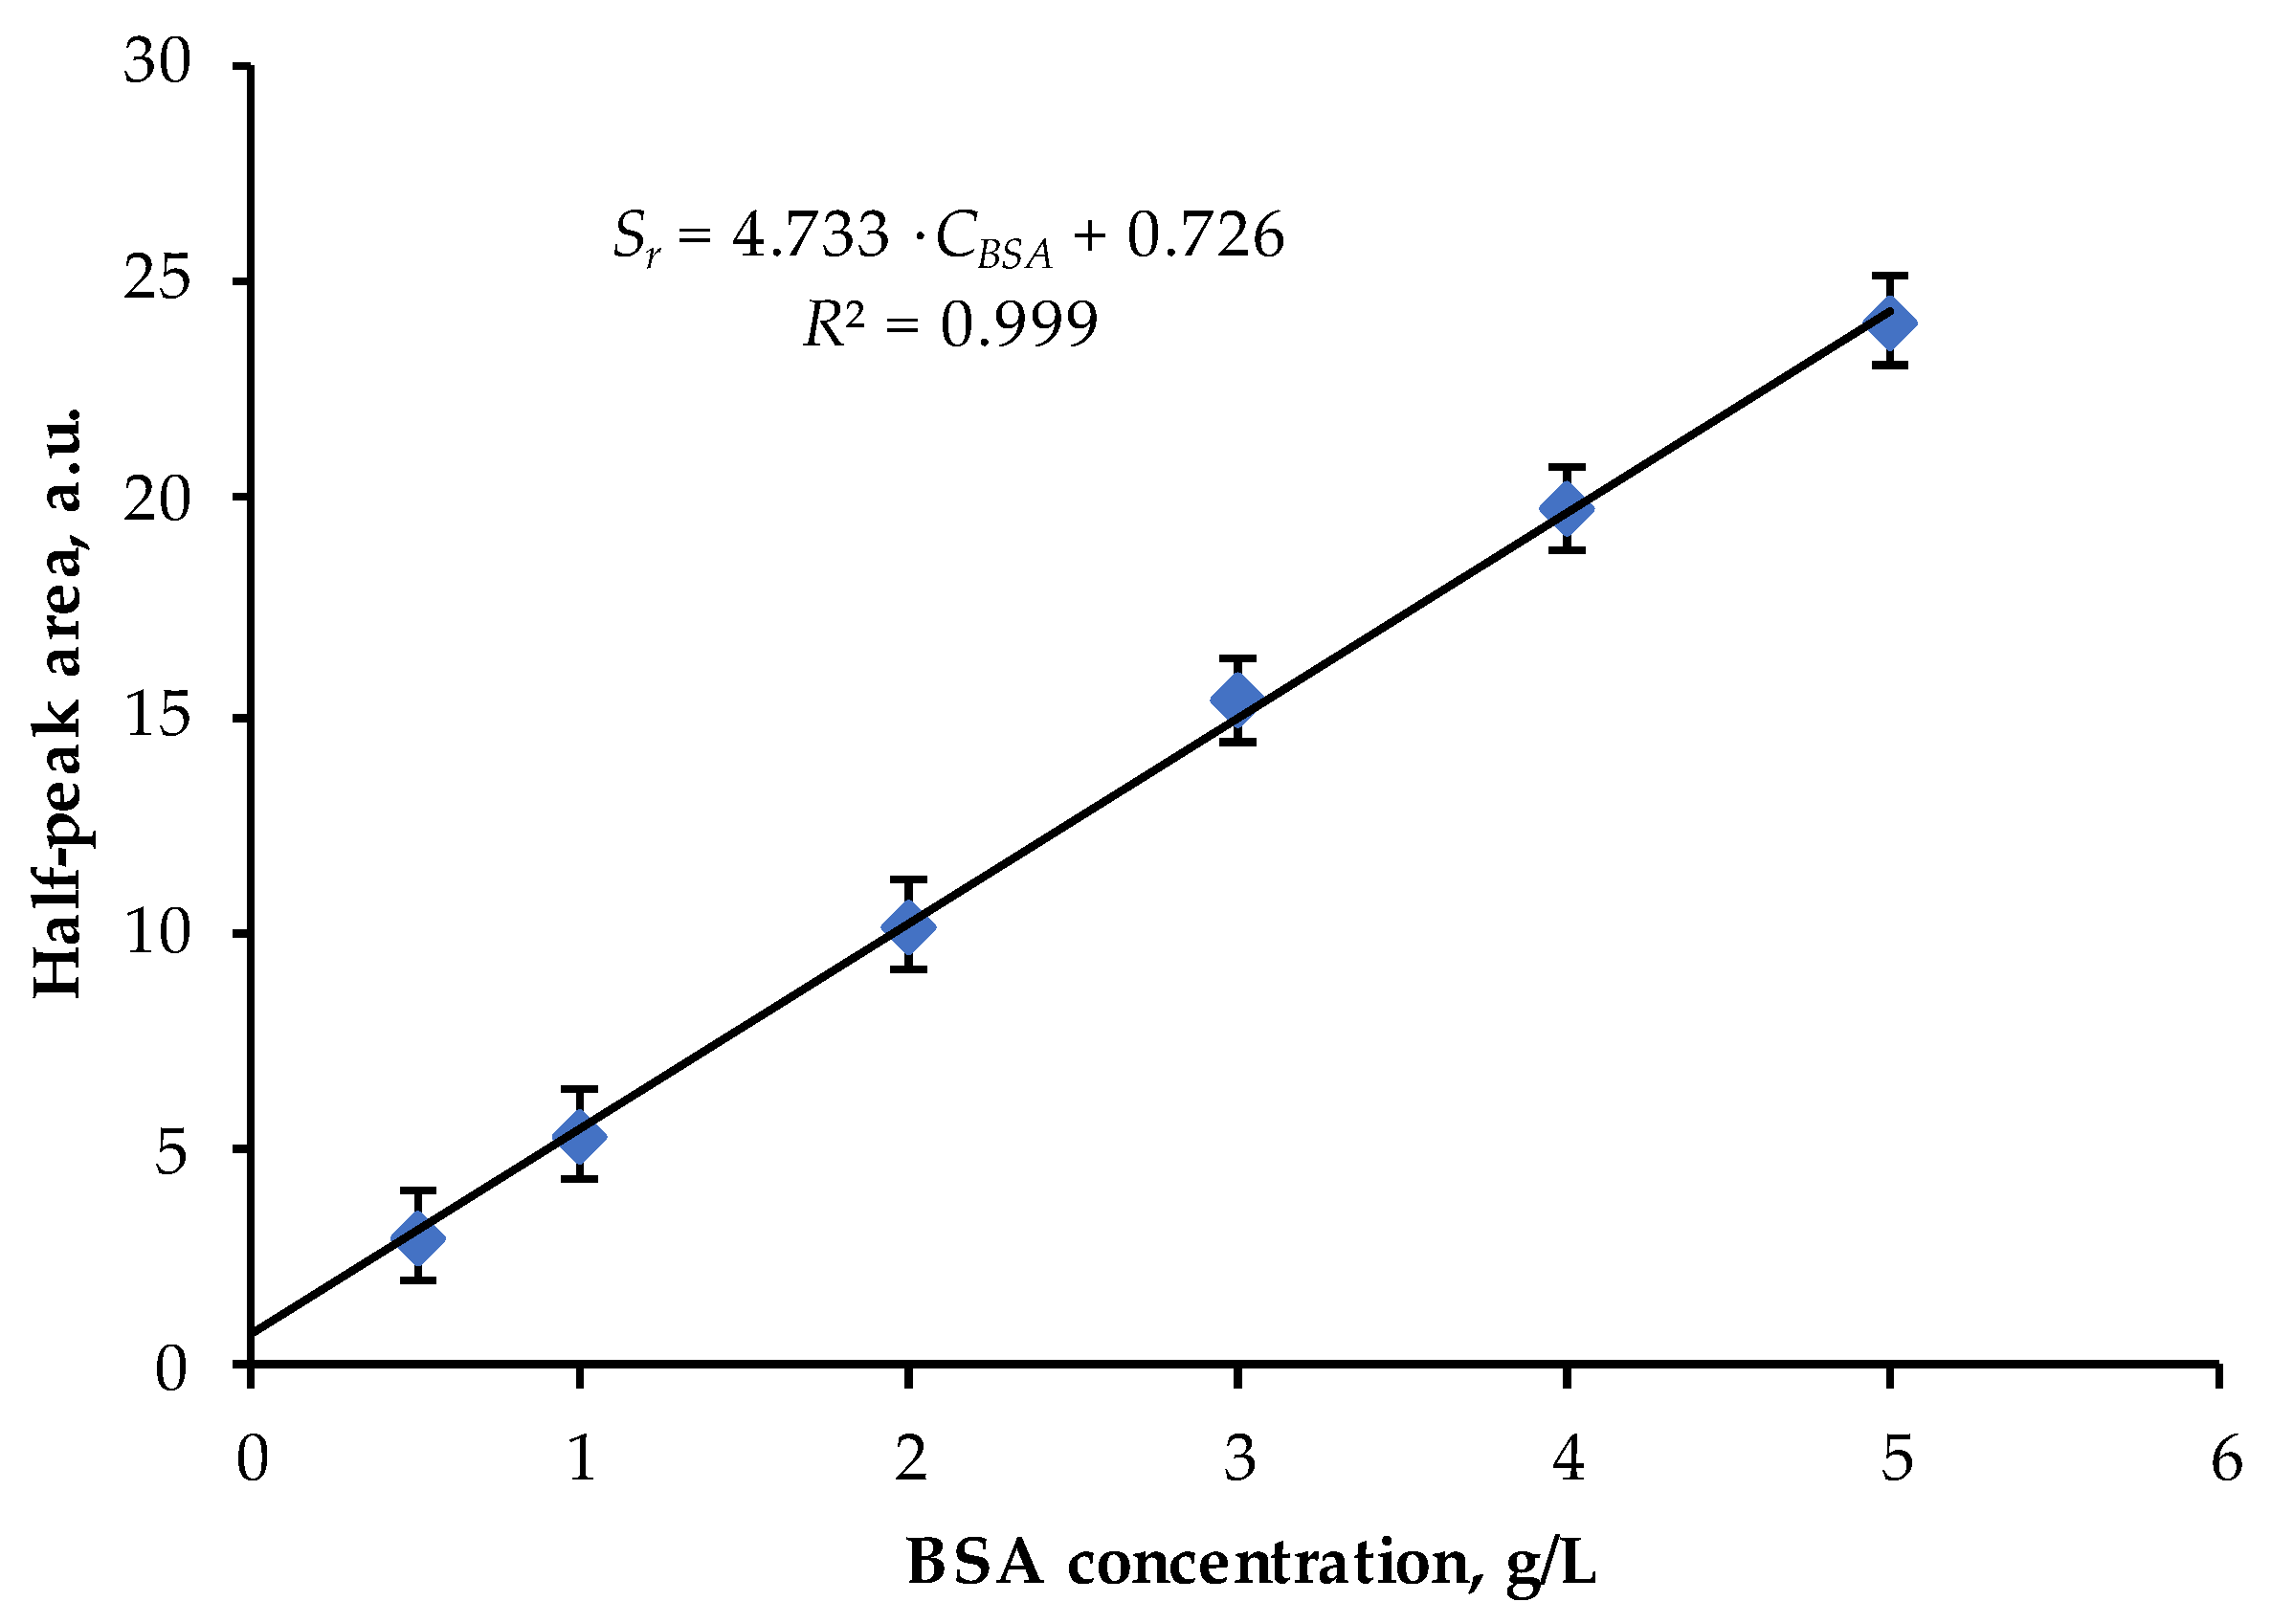
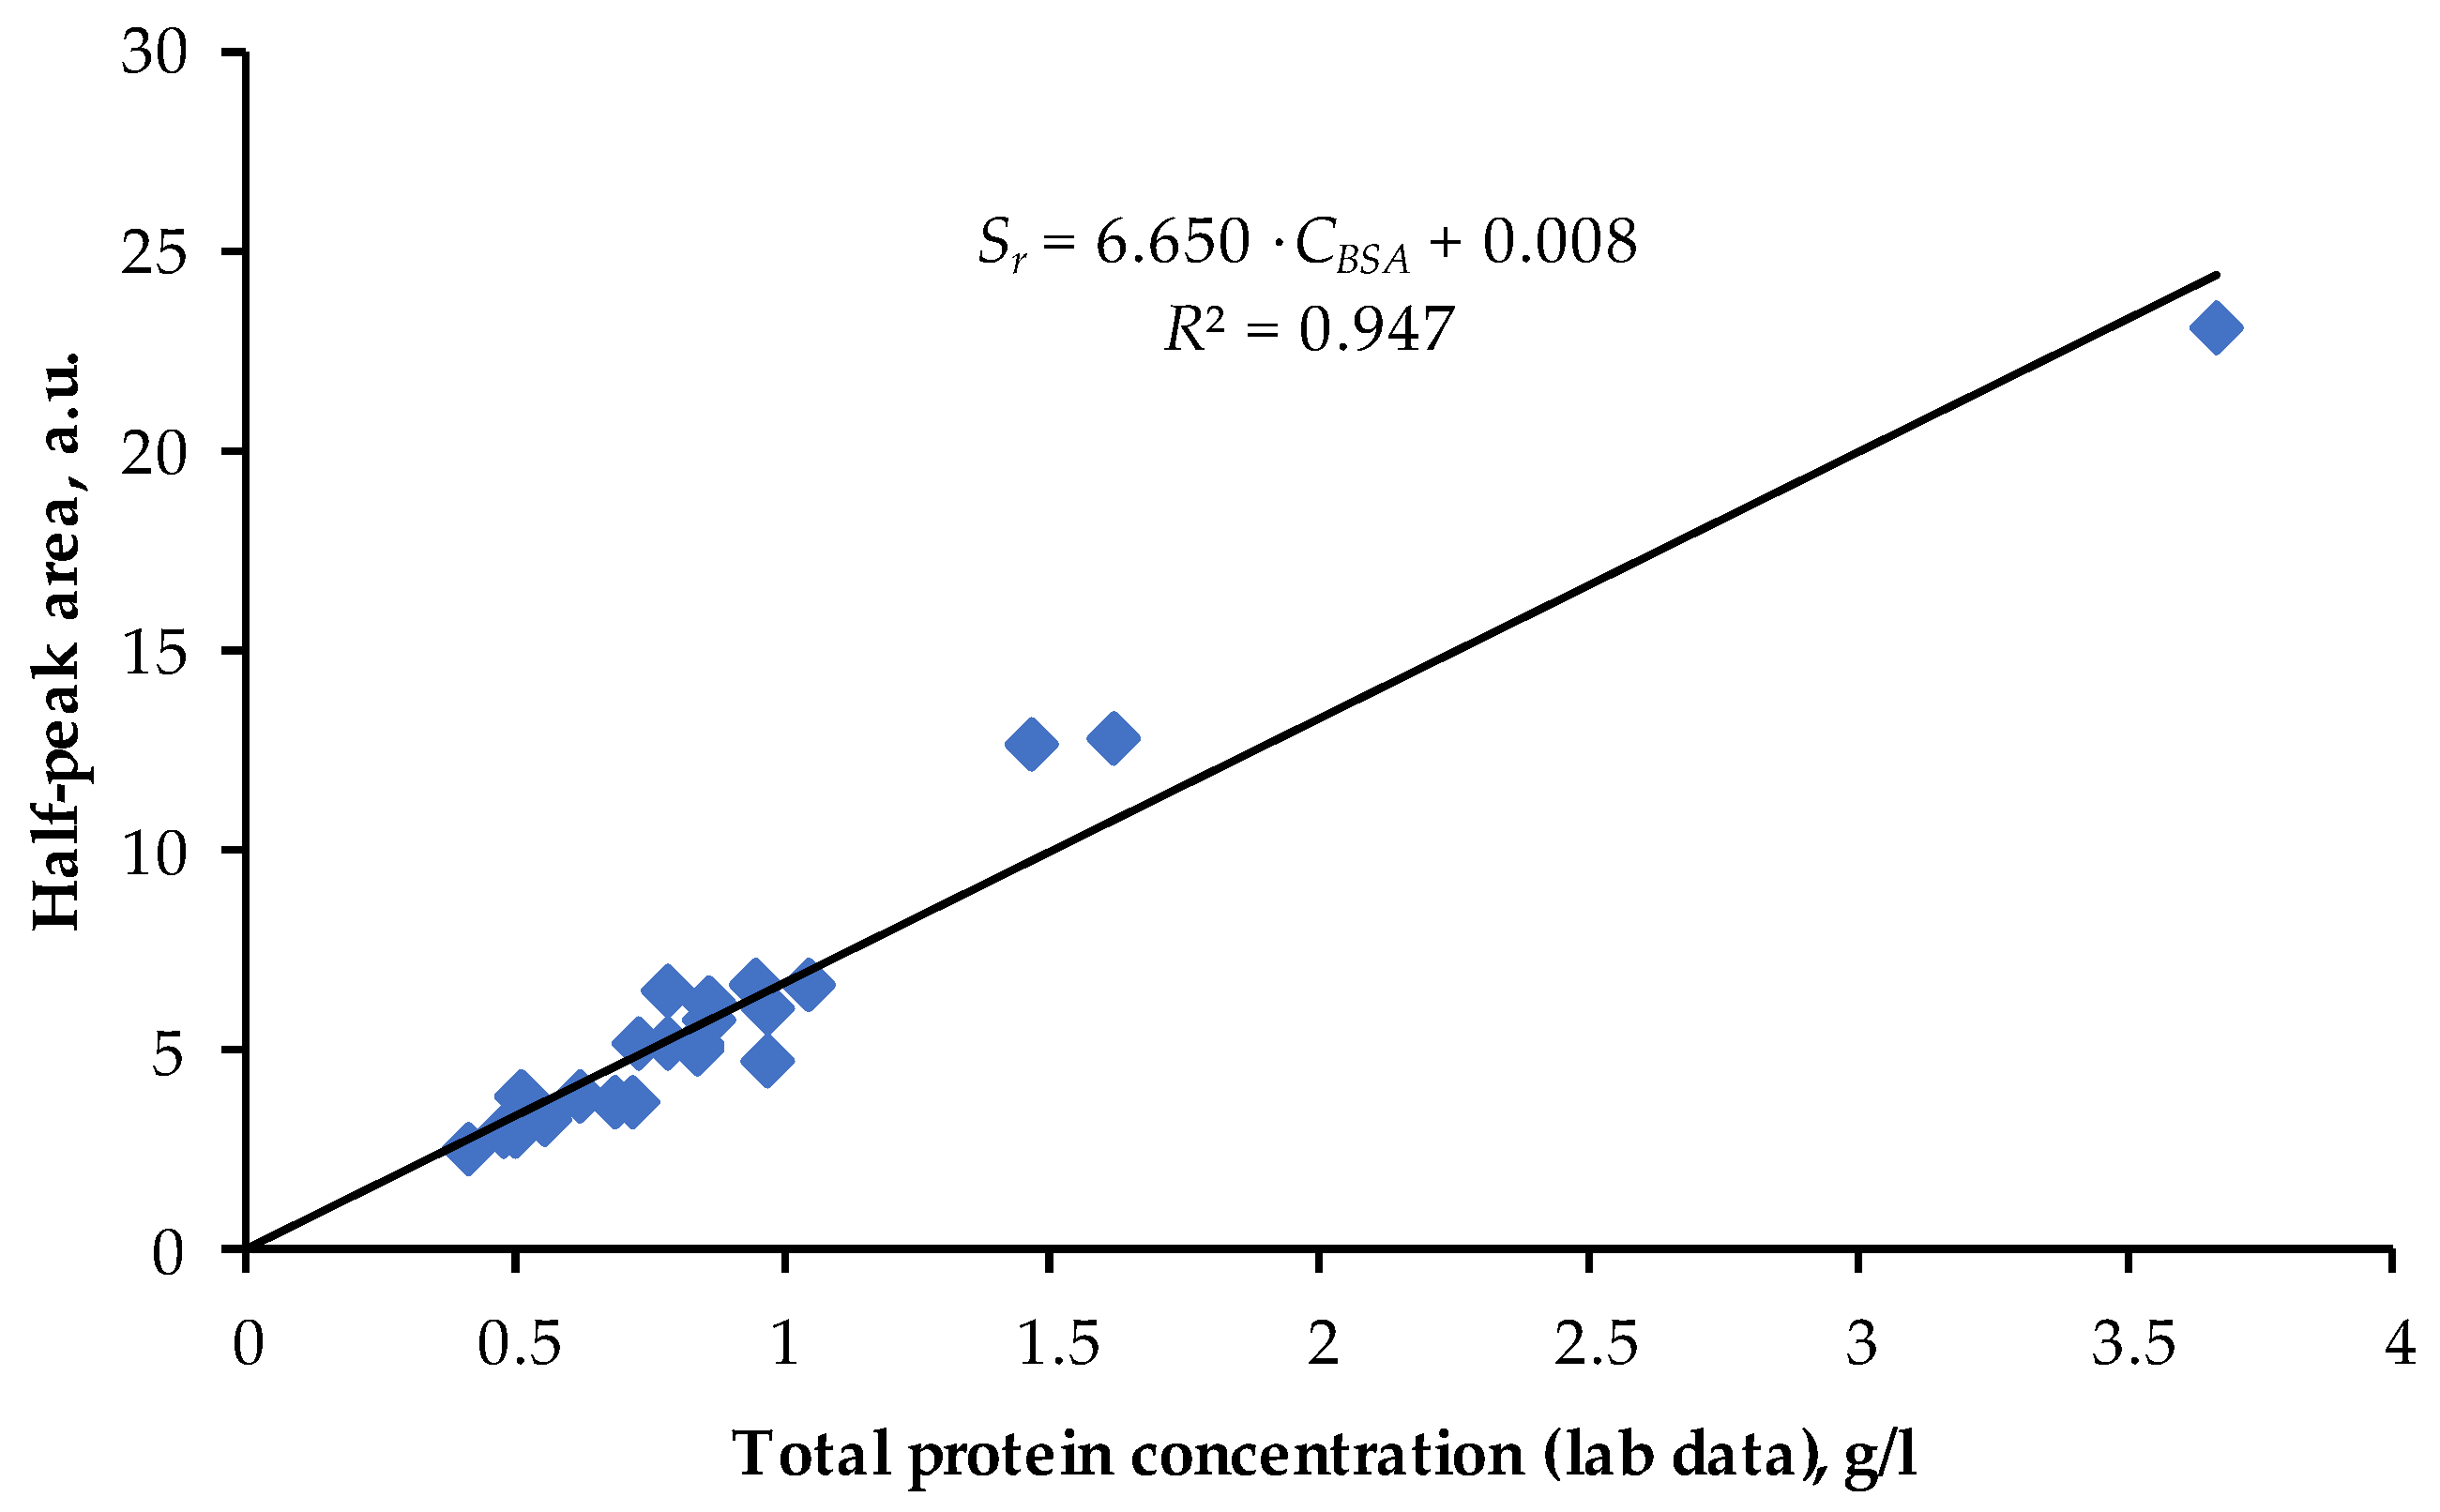
3.1. Calibration with BSA Solutions

The sensor was calibrated using a set of BSA solutions in a TRIS buffer with concentrations of 0.5, 1, 2, 3, 4, and 5 g/L. The chromatograms were measured following the technique considered in Section 2 and were converted to optical absorption A(t) according to the Bouguer–Lambert–Beer law (1). The column was regenerated with buffer solution before analyzing each BSA sample; the calibration was repeated three times. The chromatograms of BSA model solutions are shown in Figure 3; a single absorption peak with a short elution time of about 80 s inherent for proteins is evident in all the BSA chromatograms.
The chromatograms were approximated by a single bi-Gaussian function according to Equation (2); the areas of the right half-peaks Sr in the approximated curves were calculated by numerical integration according to Equation (3), and a regression line S r ( C B S A ) = G + H · C B S A against concentrations of BSA solutions CBSA was plotted (Figure 4).
The dependence S r ( C B S A ) is very close to a linear function and the Pearson correlation coefficient is R 2 = 0.999 . These data confirm that the proposed technique and the optical sensor could be used for quantitative protein determination in liquid samples.

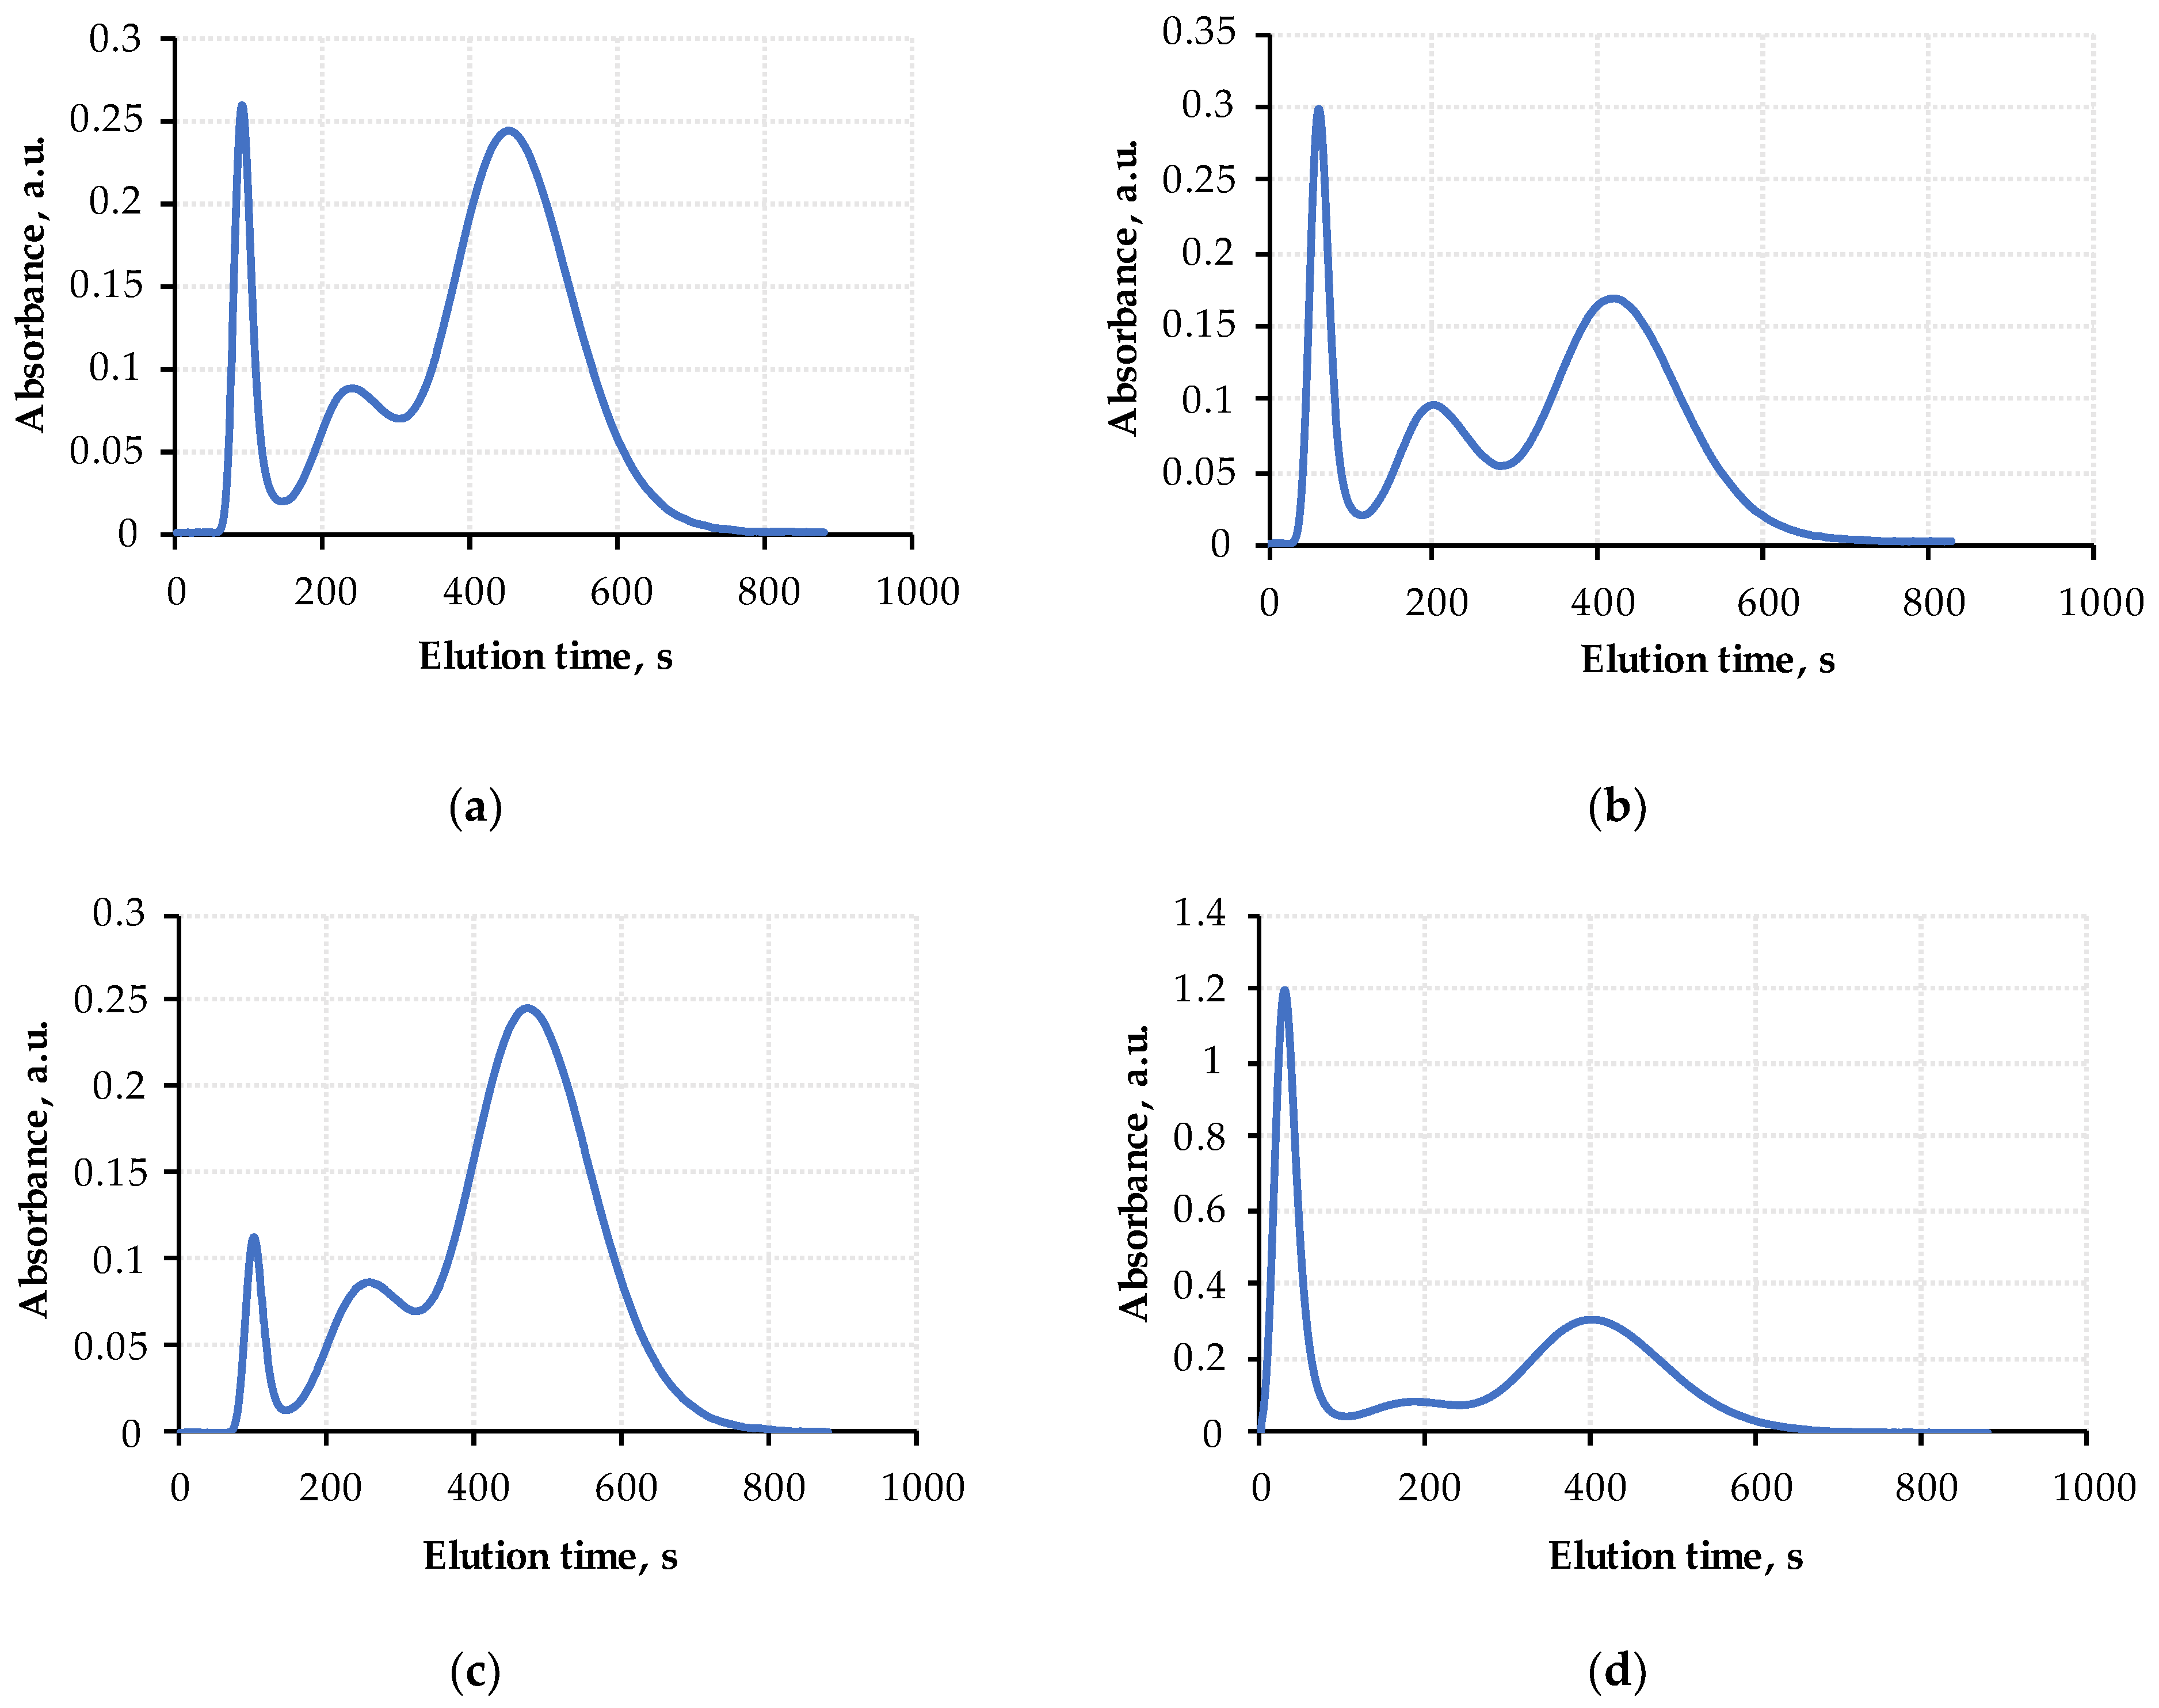
3.2. Effluent Peritoneal Dialysate Analysis

The dialysis department of the Mariinsky City Hospital (Saint Peterburg, Russia) provided the residual samples of peritoneal dialysate obtained from 23 ESRD patients of different sexes and ages receiving treatment with CAPD. The study was coordinated and approved by the Institute of Experimental Medicine (Saint Peterburg, Russia); permission from the Institute Ethics Committee confirming that it meets ethical standards was obtained, and patients’ personal information was not disclosed by the hospital. Samples were taken during one of the regular (once every three months) hospital visits immediately after morning peritoneal exchanges from bags with drained dialysate and were sent to the clinical biochemical laboratory for determination of total protein and urea concentrations by calorimetric photometric methods using the Abbott Architect c8000 biochemical analyzer. All manipulations with patients were part of routine therapeutic and diagnostic procedures associated with CAPD. The residual dialysate samples left in the test tubes in the biochemical laboratory were analyzed with a sensor using the FPLC technique.
It was found that the chromatograms for all patients have a similar structure with three distinct peaks with different amplitudes and widths, whereas the ratios of the peak amplitudes vary significantly among patients. The chromatograms of samples taken from four patients are presented in Figure 5 to illustrate these variations. It is seen from the curves in Figure 3 and Figure 5 that the position (elution time) and width of the first narrow peak in the dialysate chromatograms are almost identical to the position of the BSA peak in the chromatograms of the calibrating BSA solutions. This peak could be safely associated with various proteins in peritoneal dialysate, taking into account that 60–70% of them are represented by albumin from plasma [55,56]. The second (middle) peak is apparently associated with medium-molecular-weight substances (500–5000 Da), including heterogeneous groups of compounds such as AGE products [46,57], and the third broadband peak is related to low-molecular-weight (less than 500 Da) uremic markers, mostly uric acid, and other purines and pyrimidines with an extremely strong UV absorption [58].

3.3. PD-10 Columns’ Regeneration and Life-Time

According to the manual in [51], PD-10 columns are disposable, but in the scientific community, the stability of PD-10 columns is still being discussed [59], though it is commonly agreed that the reuse of these columns is possible. Earlier, the authors used the PD-10 columns for proteinuria measurements [46]. Then, in 2015, about 200 measurements were taken with the same column. After this, the column was in storage for 6.5 years. We have now reused this column to measure the chromatograms of a urine sample from an individual with microproteinuria and compared the results with measurements taken using a brand-new column; the concentration of protein in the sample according to the biochemical laboratory was 0.09 g/L (Figure 6).
It can be seen that there is practically no difference in the protein peak shape (Figure 6b). The peak measured with the used column is 0.005 units higher than that obtained with the new one. There are three possible reasons for this minor peculiarity: a higher background (pedestal) of the old column (blue line); the different production lots of the manufacturer, and the fact that the old column was stored for 6.5 years filled with a TRIS buffer and not with the liquid 0.15% Kathon CG/ICP Biocide, which is indicated in the column passport. All three reasons are not of critical significance since each column must be (re)calibrated after installation or prolonged storage without use.
The shift observed in the position of the second peak (which belongs to AGE) does not have much significance in the given case cantered at the protein peak. Furthermore, the integral absorption in the range 50–330 s is equal in both chromatograms, i.e., 158.86 and 156.01 a.u. for the old and new columns, respectively. Therefore, we see that PD-10 columns can be successfully used multiple times for testing biological fluid samples, and the very long-term or intermediate storage of the column is possible.

3.4. Chromatograms’ Approximation and Analysis

All three peaks in the dialysate chromatograms are broad and partially overlap each other; more specifically, the second peak associated with the middle-molecular-weight component pool overlaps the protein peak, which could introduce additional inaccuracies for protein determination, especially in samples with low protein content (Figure 5c).
To decompose the chromatograms and separate the peaks, they were approximated by the sum of three split-Gaussian functions according to Equation (2), and the areas of the right half of the first peak related to proteins were calculated according to Equation (3) for all 23 samples. The regression line S r ( C T P ) = G + H · C T P against total protein concentrations C T P found by biochemical analysis was plotted (Figure 7).
The graph reveals a good concordance of the FPLC data from the sensor with the protein concentrations measured by the conventional biochemical method; the Pearson correlation coefficient between the FPLC and laboratory results is R2 = 0.947. The angular coefficient of the linear regression for the dialysate H = 6.65 is higher than the angular coefficient for the BSA solutions H = 4.73, possibly because the dialysate contains not only albumin but also immunoglobulins and other proteins with higher tryptophan content and stronger UV absorption [47,56].
Using the angular and free coefficients of the linear regression S r ( C T P ) = G + H · C T P , the predicted values of total protein concentrations C T P were estimated from the areas of the first peak of the chromatograms S r   for the same set of data (23 patients). The results are presented in Table 1; the mean relative error of determination was below 10%, but for five samples the error exceeded 20%. There are two possible explanations for these discrepancies—errors in the clinical laboratory or the presence of some non-protein high molecular mass UV-absorbing substance in the samples, because the sensor cannot distinguish different UV-absorbing substances from a molecular mass higher than the exclusion limit of the column. The most probable candidates are cell-free nuclear acids, which strongly absorb UV radiation in the wavelength range of 230–290 nm (the maximum in the absorption spectra is 260–265 nm) and were detected earlier in the peritoneal dialysate [60,61], or some protein-bound small-molecular-weight uremic toxins; solving this problem requires additional extensive research.

4. Discussion

The results obtained during the preliminary clinical trials on the residual samples of effluent peritoneal dialysate revealed that the low-cost optical chemical sensor based on the FPLC technique designed and developed by the authors can rapidly (10–15 min) determine the total protein concentration in dialysate with an average inaccuracy of 10–15%, which is comparable to routine methods used in hospitals’ biochemical laboratories and is acceptable for a simplified POCT device. The results for several samples presented slightly higher errors of determination, possibly resulting from interference from cell-free nucleic acids or protein-bound small-molecular-weight uremic toxins in the effluent dialysate.
It was proven that the first peak in the chromatograms is associated with proteins and the area of this peak is linearly dependent on the total protein concentration determined using the conventional technique with the Abbott Architect c8000 biochemical analyzer; the Pearson correlation coefficient between the right half-peak area and the total protein concentration was found to be R2 = 0.947. An approximation of the chromatograms by a series of split-Gaussian functions allowed for the decomposition of the curves, the separation of the overlapping peaks, and the elimination of their interference, which is especially important for the samples with the low protein content and high content of middle-molecular-weight substances associated with the second peak.
The interpretation of the second and the third peaks in the chromatograms was based on the authors’ earlier research in the field of HD and PD effluent dialysate UV-absorption spectroscopy and optical dialysis monitoring [62,63,64]. According to the extensive experimental data, the most significant contribution in the UV absorption at 280 nm is made by uric acid, which is relatively abundant in blood plasma (and as a result in effluent dialysate) and is extremely optically active in the UV region with an absorption maximum of around 290 nm [63]. For these reasons, uric acid and, to a lesser degree, other purine and pyrimidine substances are probably responsible for the third peak related to small molecular mass substances. Our conclusions are also supported by HPLC data [65].
The interpretation of the second peak is not so obvious. Our proposition about the AGE products is based on preliminary experiments with the fluorescent spectra of the various chromatographic fractions of hemodialysate and AGE products observed during HD [66,67,68,69]; however, additional comprehensive research is needed to fully support this suggestion. The clinical significance of the second and the third peaks in the chromatograms is yet to be investigated; the second peak is of special interest because AGE products are responsible for cardiovascular complications and other pathological conditions in PD patients [70,71,72].
The sensor can potentially be operated outside laboratories by previously trained nursing staff in ambulatory dialysis centers as a POCT device for hospital use. The implementation of the instrument for home use by patients or their immediate caregivers requires serious modifications including a higher degree of automation, better bubble control, simpler sample preparation and dosage, and an autonomous microprocessor control unit with an LCD (instead of a laptop setup) and wireless connectivity. When these problems are overcome, FPLC technology could allow for regular and accurate protein loss assessments in CAPD patients without the need for extra hospital visits, which could also help to predict complications such as malnutrition and dialysis peritonitis and pre-emptively correct them by changing the treatment regime or diet. It should be noted that CAPD patients are specially and extensively trained to independently perform peritoneal exchanges, monitor the state of the peritoneal catheter, and detect the first signs of complications. Only individuals who have the mental and physical capacity to perform these tasks are eligible for the treatment. In this context, it is plausible to suggest that they could also be trained to operate the FPLC sensor.
The current version of the instrument is not equipped with any wireless interface or software that can integrate with medical information systems. This issue constitutes one of the main directions for future development; similar to many POCT devices, this technology can be effectively combined with IoT [73,74,75]. Such an approach provides a higher degree of automation, faster exchange of diagnostic information with the information systems of hospitals or ambulatory dialysis centers, and faster medical intervention in case of any complications. Also, the FPLS sensors can be combined into a single IoT dialysis patient system [76] with other sensors intended for monitoring the condition of dialysis patients such as bioimpedance sensors [77,78], glucose-level monitoring systems, cardiac monitoring systems, etc.
Preliminary cost estimates revealed that using the FPLC technique could be significantly cheaper than conventional protein determinations with automated biochemical analyzers in clinical laboratories. The price of one PD-10 column is approximately EUR 10. If we take as a fact that it can be used 100 times, its depreciation will be EUR 0.1 per measurement. Together with consumable liquids, filters, and syringes, this will raise expenditure to approximately EUR 0.2–0.3 per analysis. In the laboratory of the Tartu University Clinic, one protein test now costs EUR 1.81 [79]. The cost of our FPLC sensor is EUR 900; it is durable and does not require any serious maintenance except cleaning.

5. Concluding Remarks

It was demonstrated that sensing technology based on fast-protein liquid chromatography has great potential for developing low-cost, multiple-use, optical sensors for determining protein concentrations in biological fluids in the framework of point-of-care testing systems. It was shown in the clinical trial involving effluent peritoneal dialysate samples that the errors in the measurements are comparable to routine methods and are acceptable for POCT devices. Since the FPLC instruments rely on reusable, affordable chromatographic columns and utilize only minimal amounts of very cheap chemicals, they may significantly reduce medical costs, especially for patients with severe chronic conditions requiring frequent testing. After overcoming several technical and methodological problems, FPLC sensors could be implemented in clinical practice for both home and hospital use.

Author Contributions

Conceptualization, G.K., A.F. and O.S.; methodology, A.K., V.K., A.S. and G.K.; investigation, N.R., O.S., N.O. and D.L.; resources, R.G.; writing—original draft preparation, G.K., and O.S.; writing—review and editing, N.M., A.K., A.D. and S.H. All authors have read and agreed to the published version of the manuscript.

Funding

The work was supported by DFG (Deutsche Forschungsgemeinschaft), project number 315440263.

Institutional Review Board Statement

The study was conducted according to the guidelines of the Declaration of Helsinki, and approved by the Ethics Committee of the Institute of Experimental Medicine (protocol #2/22 from 06.04.22).

Informed Consent Statement

Patient consent was waived according to the Decision of the Council of the Eurasian Economic Commission No. 29 of February 12, 2016 "On Rules for Clinical and Clinical Laboratory Trials (Studies) of Medical Products". The document states that written informed consent is not required when residual laboratory samples are used exclusively for in-vitro research and testing of clinical laboratory equipment. Patients’ personal data or medical history were not disclosed by the hospital.

Data Availability Statement

Data available on request due to the Hospital ethical policy.

Acknowledgments

The authors express their gratitude to the Saint Petersburg City Mariinsky hospital doctors and nursing staff for their assistance in obtaining residual peritoneal dialysate samples and valuable comments.

Conflicts of Interest

The authors declare no conflict of interest.

References

  1. Lewandrowski, K. Point-of-Care Testing: An Overview and a Look to the Future (Circa 2009, United States). Clin. Lab. Med. 2009, 29, 421–432. [Google Scholar] [CrossRef] [PubMed]
  2. Wick, J.Y. Small Miracles: Point-of-Care Testing. Consult. Pharm. 2010, 25, 416–431. [Google Scholar] [CrossRef]
  3. Pezzuto, F.; Scarano, A.; Marini, C.; Rossi, G.; Stocchi, R.; Cerbo, A.D.; Cerbo, A.D. Assessing the Reliability of Commercially Available Point of Care in Various Clinical Fields. Open Public Health J. 2019, 12, 342–368. [Google Scholar] [CrossRef]
  4. Toppenberg, M.D.; Christiansen, T.E.M.; Rasmussen, F.; Nielsen, C.P.; Damsgaard, E.M. Mobile X-ray outside the hospital: A scoping review. BMC Health Serv. Res. 2020, 20, 767. [Google Scholar] [CrossRef] [PubMed]
  5. Lee, L.; DeCara, J.M. Point-of-Care Ultrasound. Curr. Cardiol. Rep. 2020, 22, 149. [Google Scholar] [CrossRef]
  6. Siontis, K.C.; Noseworthy, P.A.; Attia, Z.I.; Friedman, P.A. Artificial intelligence-enhanced electrocardiography in cardiovascular disease management. Nat. Rev. Cardiol. 2021, 18, 465–478. [Google Scholar] [CrossRef]
  7. Rajsic, S.; Breitkopf, R.; Bachler, M.; Treml, B. Diagnostic Modalities in Critical Care: Point-of-Care Approach. Diagnostics 2021, 11, 2202. [Google Scholar] [CrossRef] [PubMed]
  8. Yager, P.; Domingo, G.J.; Gerdes, J. Point-of-Care Diagnostics for Global Health. Annu. Rev. Biomed. Eng. 2008, 10, 107–144. [Google Scholar] [CrossRef]
  9. Mondal, S.; Zehra, N.; Choudhury, A.; Iyer, P.K. Wearable Sensing Devices for Point of Care Diagnostics. ACS Appl. Bio Mater. 2020, 4, 47–70. [Google Scholar] [CrossRef]
  10. Zhang, S.; Zeng, J.; Wang, C.; Feng, L.; Song, Z.; Zhao, W.; Wang, Q.; Liu, C. The Application of Wearable Glucose Sensors in Point-of-Care Testing. Front. Bioeng. Biotechnol. 2021, 9, 774210. [Google Scholar] [CrossRef]
  11. Steinhubl, S.R.; Muse, E.D.; Topol, E.J. The emerging field of mobile health. Sci. Transl. Med. 2015, 7, 283rv3. [Google Scholar] [CrossRef] [Green Version]
  12. Yetisen, A.K.; Akram, M.S.; Lowe, C.R. Paper-based microfluidic point-of-care diagnostic devices. Lab Chip 2013, 13, 2210–2251. [Google Scholar] [CrossRef] [PubMed]
  13. Viderman, D.; Seri, E.; Aubakirova, M.; Abdildin, Y.; Badenes, R.; Bilotta, F. Remote Monitoring of Chronic Critically Ill Patients after Hospital Discharge: A Systematic Review. J. Clin. Med. 2022, 11, 1010. [Google Scholar] [CrossRef]
  14. Goble, J.A.; Rocafort, P.T. Point-of-Care Testing: Future of Chronic Disease State Management? J. Pharm. Pract. 2016, 30, 229–237. [Google Scholar] [CrossRef]
  15. Udugama, B.; Kadhiresan, P.; Kozlowski, H.N.; Malekjahani, A.; Osborne, M.; Li, V.Y.C.; Chan, W.C.W. Diagnosing COVID-19: The Disease and Tools for Detection. ACS Nano 2020, 14, 3822–3835. [Google Scholar] [CrossRef] [Green Version]
  16. Drain, P.K.; Hyle, E.P.; Noubary, F.; Freedberg, K.A.; Wilson, D.; Bishai, W.R.; Rodriguez, W.; Bassett, I.V. Diagnostic point-of-care tests in resource-limited settings. Lancet Infect. Dis. 2014, 14, 239–249. [Google Scholar] [CrossRef] [Green Version]
  17. Wang, X.; Hong, X.-Z.; Li, Y.-W.; Li, Y.; Wang, J.; Chen, P.; Liu, B.-F. Microfluidics-based strategies for molecular diagnostics of infectious diseases. Mil. Med. Res. 2022, 9, 11. [Google Scholar] [CrossRef]
  18. Yang, Z.; Zhou, D.M. Cardiac markers and their point-of-care testing for diagnosis of acute myocardial infarction. Clin. Biochem. 2006, 39, 771–780. [Google Scholar] [CrossRef]
  19. Lingervelder, D.; Koffijberg, H.; Kusters, R.; IJzerman, M.J. Point-of-care testing in primary care: A systematic review on implementation aspects addressed in test evaluations. Int. J. Clin. Pract. 2019, 73, e13392. [Google Scholar] [CrossRef] [Green Version]
  20. Mejía-Salazar, J.R.; Rodrigues Cruz, K.; Materón Vásques, E.M.; Novais de Oliveira, O. Microfluidic Point-of-Care Devices: New Trends and Future Prospects for eHealth Diagnostics. Sensors 2020, 20, 1951. [Google Scholar] [CrossRef] [Green Version]
  21. Nasseri, B.; Soleimani, N.; Rabiee, N.; Kalbasi, A.; Karimi, M.; Hamblin, M.R. Point-of-care microfluidic devices for pathogen detection. Biosens. Bioelectron. 2018, 117, 112–128. [Google Scholar] [CrossRef] [PubMed]
  22. Arshavsky-Graham, S.; Segal, E. Lab-on-a-Chip Devices for Point-of-Care Medical Diagnostics. In Advances in Biochemical Engineering/Biotechnology; Scheper, T., Ulber, R., Eds.; Springer: Berlin/Heidelberg, Germany, 2020; pp. 1–19. [Google Scholar] [CrossRef]
  23. Haleem, A.; Javaid, M.; Singh, R.P.; Suman, R.; Rab, S. Biosensors applications in medical field: A brief review. Sens. Int. 2021, 2, 100100. [Google Scholar] [CrossRef]
  24. Xie, X.; Citterio, D.; Chumbimuni-Torres, K.; Xue, M.; Wang, X. Editorial: Chemical Sensors for Biomedical Use. Front. Chem. 2021, 9, 685563. [Google Scholar] [CrossRef] [PubMed]
  25. Bikbov, B.; Purcell, C.A.; Levey, A.S.; Smith, M.; Abdoli, A.; Abebe, M.; Adebayo, O.M.; Afarideh, M.; Agarwal, S.A.; Agudelo-Botero, M.; et al. Global, regional, and national burden of chronic kidney disease, 1990–2017: A systematic analysis for the Global Burden of Disease Study 2017. Lancet 2020, 395, 709–733. [Google Scholar] [CrossRef] [Green Version]
  26. Thurlow, J.S.; Joshi, M.; Yan, G.; Norris, K.C.; Agodoa, L.Y.; Yuan, C.M.; Nee, R. Global Epidemiology of End-Stage Kidney Disease and Disparities in Kidney Replacement Therapy. Am. J. Nephrol. 2021, 52, 98–107. [Google Scholar] [CrossRef]
  27. Li, P.K.-T.; Chow, K.M.; Van de Luijtgaarden, M.W.M.; Johnson, D.W.; Jager, K.J.; Mehrotra, R.; Naicker, S.; Pecoits-Filho, R.; Yu, X.Q.; Lameire, N. Changes in the worldwide epidemiology of peritoneal dialysis. Nat. Rev. Nephrol. 2017, 13, 90–103. [Google Scholar] [CrossRef]
  28. Mehrotra, R.; Devuyst, O.; Davies, S.J.; Johnson, D.W. The Current State of Peritoneal Dialysis. J. Am. Soc. Nephrol. 2016, 27, 3238–3252. [Google Scholar] [CrossRef] [Green Version]
  29. Walker, R.C.; Howard, K.; Morton, R.L. Home hemodialysis: A comprehensive review of patient-centered and economic considerations. Clinicoecon. Outcomes Res. 2017, 9, 149–161. [Google Scholar] [CrossRef] [Green Version]
  30. Hörl, W.H.; Koch, K.-M.; Lindsay, R.M.; Ronco, C.; Winchester, J.F. Replacement of Renal Function by Dialysis, 5th ed.; Kluwer Academic Publishers: Amsterdam, The Netherlands, 2004; pp. 73–95. ISBN 1-4020-0083-9. [Google Scholar]
  31. Nissenson, A.; Fine, R. Handbook of Dialysis Therapy, 5th ed.; Elsevier: Amsterdam, The Netherlands, 2016; pp. 3–486. ISBN 978-0-323-39154-2. [Google Scholar]
  32. Grunert, T.; Herzog, R.; Wiesenhofer, F.M.; Vychytil, A.; Ehling-Schulz, M.; Kratochwill, K. Vibrational Spectroscopy of Peritoneal Dialysis Effluent for Rapid Assessment of Patient Characteristics. Biomolecules 2020, 10, 965. [Google Scholar] [CrossRef]
  33. Wang, Z.; Jiang, H.; Chen, X.; Song, X.; Xu, F.; Chen, F.; Mao, Z.; Gao, S.; Chen, W. A rapid and sensitive method for simultaneous determination of eight protein-bound uremic toxins in human serum by UHPLC-MS/MS: Application in assessing peritoneal dialysis. J. Pharm. Biomed. Anal. 2020, 186, 113312. [Google Scholar] [CrossRef]
  34. Teitelbaum, I.; Glickman, J.; Neu, A.; Neumann, J.; Rivara, M.B.; Shen, J.; Wallace, E.; Watnick, S.; Mehrotra, R. KDOQI US Commentary on the 2020 ISPD Practice Recommendations for Prescribing High-Quality Goal-Directed Peritoneal Dialysis. Am. J. Kidney Dis. 2021, 77, 157–171. [Google Scholar] [CrossRef]
  35. Bargnoux, A.-S.; Kuster, N.; Sutra, T.; Laroche, L.; Rodriguez, A.; Morena, M.; Chenine, L.; Chalabi, L.; Dupuy, A.-M.; Badiou, S.; et al. Evaluation of a new point-of-care testing for creatinine and urea measurement. Scand. J. Clin. Lab. Investig. 2021, 81, 290–297. [Google Scholar] [CrossRef] [PubMed]
  36. Nataatmadja, M.; Fung, A.W.S.; Jacobson, B.; Ferera, J.; Bernstein, E.; Komenda, P.; Mattman, A.; Seccombe, D.; Levin, A. Performance of StatSensor Point-of-Care Device for Measuring Creatinine in Patients with Chronic Kidney Disease and Postkidney Transplantation. Can. J. Kidney Health Dis. 2020, 7, 2054358120970716. [Google Scholar] [CrossRef] [PubMed]
  37. Fan, J.; Ye, H.; Zhang, X.; Cao, P.; Guo, Q.; Mao, H.; Yu, X.; Yang, X. Association of Lean Body Mass Index and Peritoneal Protein Clearance in Peritoneal Dialysis Patients. Kidney Blood Press. Res. 2019, 44, 94–102. [Google Scholar] [CrossRef] [PubMed]
  38. Asano, M.; Ishii, T.; Hirayama, A.; Mizuno, M.; Suzuki, Y.; Sakata, F.; Akiyama, S.; Maruyama, S.; Soga, T.; Kinashi, H.; et al. Differences in peritoneal solute transport rates in peritoneal dialysis. Clin. Exp. Nephrol. 2018, 23, 122–134. [Google Scholar] [CrossRef] [PubMed]
  39. Chang, T.I.; Kang, E.W.; Lee, Y.K.; Shin, S.K. Higher Peritoneal Protein Clearance as a Risk Factor for Cardiovascular Disease in Peritoneal Dialysis Patient. PLoS ONE 2013, 8, e56223. [Google Scholar] [CrossRef] [Green Version]
  40. Guedes, A.M. Peritoneal Protein Loss, Leakage or Clearance in Peritoneal Dialysis, Where Do We Stand? Perit. Dial. Int. 2019, 39, 201–209. [Google Scholar] [CrossRef]
  41. Lu, W.; Pang, W.-F.; Jin, L.; Li, H.; Chow, K.M.; Kwan, B.C.-H.; Leung, C.B.; Li, P.K.-T.; Szeto, C.C. Peritoneal protein clearance predicts mortality in peritoneal dialysis patients. Clin. Exp. Nephrol. 2018, 23, 551–560. [Google Scholar] [CrossRef]
  42. Dong, J.; Chen, Y.; Luo, S.; Xu, R.; Xu, Y. Peritoneal Protein Leakage, Systemic Inflammation, and Peritonitis Risk in Patients on Peritoneal Dialysis. Perit. Dial. Int. 2013, 33, 273–279. [Google Scholar] [CrossRef] [Green Version]
  43. Fung, W.W.-S.; Li, P.K.-T. Recent advances in novel diagnostic testing for peritoneal dialysis-related peritonitis. Kidney Res. Clin. Pract. 2022, 41, 156–164. [Google Scholar] [CrossRef]
  44. Goodlad, C.; George, S.; Sandoval, S.; Mepham, S.; Parekh, G.; Eberl, M.; Topley, N.; Davenport, A. Measurement of innate immune response biomarkers in peritoneal dialysis effluent using a rapid diagnostic point-of-care device as a diagnostic indicator of peritonitis. Kidney Int. 2020, 97, 1253–1259. [Google Scholar] [CrossRef] [PubMed]
  45. Dube, J.; Girouard, J.; Leclerc, P.; Douville, P. Problems with the estimation of urine protein by automated assays. Clin. Biochem. 2005, 38, 479–485. [Google Scholar] [CrossRef] [PubMed]
  46. Sünter, A.; Frorip, A.; Korsakov, V.; Kurruk, R.; Kuznetsov, A.; Ots-Rosenberg, M. Optical method for screening and a new proteinuria focus group. J. Biomed. Photonics Eng. 2015, 1, 236–247. [Google Scholar] [CrossRef] [Green Version]
  47. Konoplev, G.; Agafonova, D.; Bakhchova, L.; Mukhin, N.; Kurachkina, M.; Schmidt, M.-P.; Verlov, N.; Sidorov, A.; Oseev, A.; Stepanova, O.; et al. Label-Free Physical Techniques and Methodologies for Proteins Detection in Microfluidic Biosensor Structures. Biomedicines 2022, 10, 207. [Google Scholar] [CrossRef] [PubMed]
  48. Sünter, A.; Kuznetsov, A.; Frorip, A.; Korsakov, V.; Rosenberg, M. Optical methods, devise and statistics of determination of albumin and/or protein concentration in human urine. In Proceedings of the Saratov Fall Meeting 2015, Biophotonics Internet Invited Lecture, Saratov, Russia, 30 September 2015. [Google Scholar]
  49. Walls, D.; Loughran, S.T. Protein Chromatography: Methods and Protocols, 2011st ed.; Humana Press: Totowa, NJ, USA, 2011; p. 681. ISBN 9781607619123. [Google Scholar]
  50. Determann, H. Gel Chromatography, Gel Filtration, Gel Permeation, Molecular Sieves: A Laboratory Hand Book, 2nd ed.; Springer: New York, NY, USA, 1969; p. 208. ISBN 978-3642950841. [Google Scholar]
  51. GE Healthcare. Instructions 52-1308-00 BB. Available online: http://wwwuser.gwdg.de/~jgrossh/protocols/protein-purification/PD10.pdf (accessed on 18 March 2022).
  52. Bonomini, M.; Borras, F.E.; Troya-Saborido, M.; Carreras-Planella, L.; Di Liberato, L.; Arduini, A. Proteomic Research in Peritoneal Dialysis. Int. J. Mol. Sci. 2020, 21, 5489. [Google Scholar] [CrossRef] [PubMed]
  53. Di Marco, V.B.; Bombi, G.G. Mathematical functions for the representation of chromatographic peaks. J. Chromatogr. A 2001, 931, 1–30. [Google Scholar] [CrossRef]
  54. Buys, T.S.; De Clerk, K. Bi-Gaussian fitting of skewed peaks. Anal. Chem. 1972, 44, 1273–1275. [Google Scholar] [CrossRef]
  55. Lin, W.-T.; Tsai, C.-C.; Chen, C.-Y.; Lee, W.-J.; Su, C.-C.; Wu, Y.-J. Proteomic Analysis of Peritoneal Dialysate Fluid in Patients with Dialysis-Related Peritonitis. Ren. Fail. 2008, 30, 772–777. [Google Scholar] [CrossRef] [Green Version]
  56. Sritippayawan, S.; Chiangjong, W.; Semangoen, T.; Aiyasanon, N.; Jaetanawanitch, P.; Sinchaikul, S.; Chen, S.-T.; Vasuvattakul, S.; Thongboonkerd, V. Proteomic Analysis of Peritoneal Dialysate Fluid in Patients with Different Types of Peritoneal Membranes. J. Proteome Res. 2007, 6, 4356–4362. [Google Scholar] [CrossRef] [Green Version]
  57. Park, M.S.; Lee, H.A.; Chu, W.S.; Yang, D.H.; Hwang, S.D. Peritoneal accumulation of AGE and peritoneal membrane permeability. Peritoneal Dial. Int. J. Int. Soc. Perit. Dial. 2000, 20, 452–460. [Google Scholar] [CrossRef]
  58. Zuo, Y.; Wang, C.; Zhou, J.; Sachdeva, A.; Ruelos, V.C. Simultaneous Determination of Creatinine and Uric Acid in Human Urine by High-Performance Liquid Chromatography. Anal. Sci. 2008, 24, 1589–1592. [Google Scholar] [CrossRef] [PubMed] [Green Version]
  59. ResearchGate. Available online: https://www.researchgate.net/post/How_many_times_can_I_use_a_PD10_column (accessed on 18 March 2022).
  60. Xie, X.; Wang, J.; Xiang, S.; Chen, Z.; Zhang, X.; Chen, J. Dialysate cell-free mitochondrial DNA fragments as a marker of intraperitoneal inflammation and peritoneal solute transport rate in peritoneal dialysis. BMC Nephrol. 2019, 20, 128. [Google Scholar] [CrossRef] [PubMed] [Green Version]
  61. Korabecna, M.; Pazourkova, E.; Horinek, A.; Rocinova, K.; Tesar, V. Cell-free nucleic acids as biomarkers in dialyzed patients. J. Nephrol. 2013, 26, 1001–1008. [Google Scholar] [CrossRef] [PubMed]
  62. Vasilevskii, A.M.; Konoplev, G.A. Using UV spectrophotometry to analyze peritoneal dialysate. J. Opt. Technol. 2004, 71, 180–182. [Google Scholar] [CrossRef]
  63. Vasilevsky, A.M.; Konoplyov, G.A. Peculiar character of dialyzate ultraviolet extinction spectra as an indicator of nucleic acid metabolism in humans. J. Biomed. Opt. 2005, 10, 044026. [Google Scholar] [CrossRef]
  64. Vasilevsky, A.M.; Gerasimchuk, R.P.; Zemchenkov, A.Y.; Konoplev, G.A.; Rubinsky, A.V.; Stepanova, O.S.; Frorip, A.A. Dual-Wavelength Optoelectronic Sensor for Monitoring Uric Acid Concentration in Dialysate. Biomed. Eng. 2015, 49, 125–128. [Google Scholar] [CrossRef]
  65. Lauri, K.; Tanner, R.; Jerotskaja, J.; Luman, M.; Fridolin, I. HPLC Study of Uremic Fluids Related to Optical Dialysis Adequacy Monitoring. Int. J. Artif. Organs 2010, 33, 96–104. [Google Scholar] [CrossRef]
  66. Kuznetsov, A.; Frorip, A.; Gerasimchuk, R.; Konoplev, G.A.; Rosenberg, M.; Sinijärv, H.; Sünter, A.; Vasilevcsky, A.; Zemchenkov, A. Multimode monitoring of AGE excretion in hemodialysis. Nephrol. Dial. Transplant. 2016, 1, 1500–1501. [Google Scholar] [CrossRef]
  67. Zemchenkov, G.A.; Konoplev, G.A.; Korsakov, V.; Kuznetsov, A.I.; Roshchina, N.V.; Stepanova, O.S.; Frorip, A. An Optoelectronic Spectral Sensor for Monitoring the Elimination of Uremic Markers with Low and Middle Molecular Weight during Hemodialysis Therapy. Biomed. Eng. 2022, 56, 18–23. [Google Scholar] [CrossRef]
  68. Steenbeke, M.; De Bruyne, S.; Van Aken, E.; Glorieux, G.; Van Biesen, W.; Himpe, J.; De Meester, G.; Speeckaert, M.; Delanghe, J. UV Fluorescence-Based Determination of Urinary Advanced Glycation End Products in Patients with Chronic Kidney Disease. Diagnostics 2020, 10, 34. [Google Scholar] [CrossRef] [Green Version]
  69. Henle, T.; Deppisch, R.; Beck, W.; Hergesell, O.; Hänsch, G.M.; Ritz, E. Advanced glycated end-products (AGE) during haemodialysis treatment: Discrepant results with different methodologies reflecting the heterogeneity of AGE compounds. Nephrol. Dial. Transplant. 1999, 14, 1968–1975. [Google Scholar] [CrossRef] [PubMed] [Green Version]
  70. Papanastasiou, P.; Grass, L.; Rodela, H.; Patrikarea, A.; Oreopoulos, D.; Diamandis, E.P. Immunological quantification of advanced glycosylation end-products in the serum of patients on hemodialysis or CAPD. Kidney Int. 1994, 46, 216–222. [Google Scholar] [CrossRef] [PubMed] [Green Version]
  71. Stinghen, A.E.M.; Massy, Z.A.; Vlassara, H.; Striker, G.E.; Boullier, A. Uremic Toxicity of Advanced Glycation End Products in CKD. J. Am. Soc. Nephrol. 2015, 27, 354–370. [Google Scholar] [CrossRef] [PubMed] [Green Version]
  72. Jiang, J.; Zhang, Y.; Chen, J.; Yang, X.; Mei, C.; Xiong, F.; Shi, W.; Zhou, W.; Liu, X.; Sun, S.; et al. Serum and Tissue Levels of Advanced Glycation End Products and Risk of Mortality in Patients on Maintenance Hemodialysis. Am. J. Nephrol. 2021, 52, 8–16. [Google Scholar] [CrossRef]
  73. Chitra, S.; Jayalakshmi, V. A Review of Healthcare Applications on Internet of Things. In Computer Networks, Big Data and IoT, 1st ed.; Pandian, A.P., Fernando, X., Islam, S.M.S., Eds.; Springer: Singapore, 2021; Volume 3, pp. 227–237. [Google Scholar] [CrossRef]
  74. Shetty, V.; Yamaguchi, M. Point-of-care Testing in the Time of P5 Medicine: A Preface. Sens. Mater. 2016, 28, 1141–1148. [Google Scholar] [CrossRef] [Green Version]
  75. Kishnani, V.; Park, S.; Nakate, U.T.; Mondal, K.; Gupta, A. Nano-functionalized paper-based IoT enabled devices for point-of-care testing: A review. Biomed. Microdevices 2022, 24, 2. [Google Scholar] [CrossRef]
  76. Zainol, M.F.; Mohamed Farook, R.S.; Hassan, R.; Abdul Halim, A.H.; Abdul Rejab, M.R.; Husin, Z. A New IoT Patient Monitoring System for Hemodialysis Treatment. In Proceedings of the 2019 IEEE Conference on Open Systems (ICOS), Pulau Pinang, Malaysia, 19–21 November 2019. [Google Scholar] [CrossRef]
  77. Nitin Prabhu, S.; Gooneratne, C.P.; Hoang, K.-A.; Mukhopadhyay, S.C. IoT-Associated Impedimetric Biosensing for Point-of-Care Monitoring of Kidney Health. IEEE Sens. J. 2021, 21, 14320–14329. [Google Scholar] [CrossRef]
  78. Ng, J.K.-C.; Li, P.K.-T. Fluid management and bioimpedance study in peritoneal dialysis. Curr. Opin. Nephrol. Hypertens. 2019, 28, 58–64. [Google Scholar] [CrossRef]
  79. Eesti Haigekassa Tervishoiuteenuste Loetelu—Riigi Teataja. Available online: https://www.riigiteataja.ee/akt/123032021022 (accessed on 18 March 2022).
Figure 1. The general principle of the sensor operation: (a) Schematic diagram of the sensor; (b) BSA absorption and UV LED emission spectra.
Chemosensors 10 00232 g001
Figure 2. Optical chemical sensor for protein determination in effluent peritoneal dialysate (1 is the LabMate buffer reservoir; 2 is the PD-10 column; 3 is the three-way valve; 4 is the photometric unit; 5 is the drain vessel; 6 is the USB interface cable; 7 is the laptop; 8 is the liquid flow rate adjustment screws).
Chemosensors 10 00232 g002
Figure 3. Chromatograms of BSA model solutions.
Chemosensors 10 00232 g003
Figure 4. Dependence of the protein half-peak area on the BSA concentration.
Chemosensors 10 00232 g004
Figure 5. Chromatogram of peritoneal dialysate samples with varying total protein contents taken from four CAPD patients: (a) Average protein and uric acid; (b) Average protein, low uric acid; (c) Low protein, average uric acid; (d) Abnormally high protein, average uric acid.
Chemosensors 10 00232 g005
Figure 6. Human urine sample chromatograms (a) measured with a used (more than 200 samples) and brand-new PD-10 column; (b) Coincidence of urine protein peaks in the measurements with a used (left-side vertical axis) and brand-new (right-side vertical axis) column.
Chemosensors 10 00232 g006
Figure 7. Dependence of the first peak half-area in the chromatograms of peritoneal dialysate samples from the protein concentration measured by laboratory biochemical analysis.
Chemosensors 10 00232 g007
Table 1. Comparison of laboratory data with FPLC results.
Patient #Protein Concentration
(Lab Data), g/L
First Peak Area, a.u.Protein Concentration
(FPLC Data), g/L
Relative Error, %
10.412.540.422.8
20.483.030.491.7
30.53.000.483.2
40.514.010.6221.5
50.553.260.525.7
60.624.100.620.7
70.693.730.5815.7
80.723.690.5820.0
90.735.220.787.0
100.795.240.780.8
110.796.590.9722.2
120.845.030.769.7
130.845.230.786.8
140.855.350.806.1
150.865.780.860.4
160.866.200.916.2
170.956.600.971.8
180.974.670.7126.7
190.976.060.897.8
201.056.760.995.9
211.4613.081.8425.8
221.6213.021.8312.9
233.6725.883.553.2
Publisher’s Note: MDPI stays neutral with regard to jurisdictional claims in published maps and institutional affiliations.

