Article

Signal-On and Highly Sensitive Electrochemiluminescence Biosensor for Hydrogen Sulfide in Joint Fluid Based on Silver-Ion-Mediated Base Pairs and Hybridization Chain Reaction

1
Central Laboratory, Affiliated Hospital of Putian University, Putian University, Putian 351100, China
2
Ministry of Education Key Laboratory for Analytical Science of Food Safety and Biology, Department of Chemistry, Fuzhou University, Fuzhou 350116, China
3
Central Laboratory, Fujian Key Laboratory of Precision Medicine for Cancer, Key Laboratory of Radiation Biology of Fujian Higher Education Institutions, The First Affiliated Hospital of Fujian Medical University, Fuzhou 350005, China
*
Author to whom correspondence should be addressed.
These authors contributed equally to this work.
Submission received: 23 May 2022 / Revised: 23 June 2022 / Accepted: 25 June 2022 / Published: 28 June 2022
(This article belongs to the Special Issue Feature Papers on Luminescent Sensing)

Abstract

:
Hydrogen sulfide (H2S) in joint fluid acts as a signal molecule to regulate joint inflammation. Direct detection of H2S in joint fluid is of great significance for the diagnosis and treatment of arthritis. However, due to the low volume of joint fluid and low H2S concentration, existing methods face the problem of the insufficient limit of detection. In this study, a highly sensitive biosensor was proposed by designing a primer probe and combining it with hybrid chain reaction (HCR) under the strong interaction between metal ions and H2S to achieve H2S detection. The primer probe containing multiple cytosine (C) sequences was fixed on a gold electrode, and the C–Ag–C hairpin structure was formed under the action of Ag+. In the presence of H2S, it can combine with Ag+ in the hairpin structure to form Ag2S, which leads to the opening of the hairpin structure and triggers the hybridization chain reaction (HCR) with another two hairpin structures (H1 and H2). A large number of double-stranded nucleic acid structures can be obtained on the electrode surface. Finally, Ru(phen)32+ can be embedded into the double chain structure to generate the electrochemiluminescence (ECL) signal. The linear response of the H2S biosensor ranged from 0.1000 to 1500 nM, and the limit of detection concentration of H2S was 0.0398 nM. The developed biosensor was successfully used to determine H2S in joint fluid.

1. Introduction

Arthritis is a common inflammatory disease of human joints and the surrounding soft tissues, and its incidence is mainly in middle-aged and older adults. The main clinical manifestations of arthritis are pain, deformity, and joint dysfunction, which seriously reduce the life quality of patients and bring a heavy psychological burden [1,2]. The researchers investigated that hydrogen sulfide (H2S) acts as an endogenous mediator of inflammation in the joint fluid, protecting chondrocytes from oxidative stress [3]. In chondrocytes, H2S was induced by regulating cysteine-β-synthase and cysteine-γ-lyase, which significantly inhibited chondrocyte oxidative stress-induced cell death [4,5]. Many instrumental methods, such as the electrochemical method [6,7], colorimetric method [8,9], fluorescence spectroscopy [10,11], electrochemiluminescence (ECL) method [12], and surface-enhanced Raman scattering [13], were applied for H2S determination in different samples. Among these methods, most of them were aimed at the detection of total sulfur ion in biological samples, and the limit of detection of H2S was generally at the micromolar level. However, H2S is a gaseous signal molecule that can freely shuttle between cell and joint tissue fluid, requiring higher sensitivity detection technology to capture and detect it [4,5,14]. Therefore, developing a highly sensitive and rapid H2S detection method is of great significance for understanding the pathogenesis of arthritis.
ECL is a kind of electrochemical conjunction with chemiluminescence detection technology, which has the advantages of high sensitivity and simple instrument. Therefore, ECL has become a commercially successful analytical technique and a versatile tool for H2S detection in many scenes. Zhu et al. [15] developed a spectral shift-based ECL chemosensor for H2S detection. This shift-based chemosensor can effectively avoid the interference of the ECL signal intensity fluctuations, enabling a highly reliable quantitative analysis in serum samples. Yu et al. [16] designed a 3D microfluidic paper-based ECL origami cytodevice with a hollow-channel sensing platform for H2S detection based on metal ion introducing graphene quantum dots. This sensing platform was successfully applied in real time to monitor H2S released from cancer cells. Hong et al. introduced an ECL probe to detect H2S based on a cyclometalated iridium(III) complex. In the presence of H2S, the probe structure can be changed and triggered, and the intrinsic ECL signal decreases significantly. However, due to lack of an ECL signal amplification strategy, the detection limit of the above detection methods was too high, which cannot meet the detection of H2S in joint fluid.
ECL biosensors based on ruthenium bipyridine and its derivatives combined with signal amplification have attracted extensive attention in nucleic acid detection, immunoassay, and molecular diagnosis in recent years. Li’s research group constructed a label-free ECL biosensor for lysozyme detection, which realized the highly sensitive detection of lysozyme by taking advantage of the particular binding between aptamer and lysozyme [17]. It is well known that Ru(phen)32+ has the characteristic of being quantitatively embedded in the grooves of dsDNA. Based on this characteristic and combined with the nucleic acid amplification method, our research group constructed a highly sensitive detection of food safety contaminants, gene fragments, and other targets, showing good specificity and sensitivity [18,19,20,21].
It has been reported that some metal ions can covalently combine with specific bases in oligonucleotides to form coordination structures mediated by metal ions. Ag+ can combine with cytosine (C) to form a stable coordination structure of C–Ag–C, and the binding force of this structure is stronger than the double helix structure of nucleic acid [22,23,24]. Based on this reaction, Ag+ was introduced to form a hairpin structure with a C-rich primer probe. In the presence of H2S, the hairpin structure primer can pull out Ag+ from the hairpin structure to form Ag2S, resulting in hairpin structure dissociation, and the hairpin primer turns back to a single-stranded DNA structure. Because the single-stranded DNA structure contains the initiating sequence of hybridization chain reaction (HCR), it can trigger the HCR reaction and generate a large number of double-stranded nucleic acids on the electrode surface. Conversely, when the sample does not contain H2S, the hairpin structure primer C–Ag–C cannot trigger HCR reaction and cannot produce the HCR amplification effect. At last, Ru(phen)32+ molecules can be quantitatively embedded into the grooves of double-stranded DNA as ECL probes to achieve highly sensitive ECL detection. Based on this, a sensitive ECL biosensor for H2S can be developed. The proposed biosensor was applied to detect H2S in joint fluid samples with satisfactory results.

2. Materials and Methods

2.1. Materials and Chemicals

Dichlorotris (1,10-phenanthroline) ruthenium(II) hydrate (Ru(phen)32+), K3Fe(CN)6, K4Fe(CN)6, tripropylamine (TPA), 6-mercaptohexanol (MCH), tris (2-carboxyethyl) phosphine (TCEP), Mg(NO3)2, KNO3, NaNO3, KCl, ascorbic acid (AA), uric acid (UA), dihydroxy phenyl acetic acid (DOPAC), and 5-hydroxytryptamine (5-HT) were purchased from Aladdin (Shanghai, China). Glutathione (GSH), cysteine (Cys), dopamine (DA), sepharose, 4S green plus nucleic acid stain, TAE buffer, and DNA marker (100–1200 bp) were purchased from Sangon Biotech Co., Ltd. (Shanghai, China). All reagents were of analytical reagent (AR) grade and directly used for the following experiments without further purification. Tris–HClO4 buffer (20 mM) was prepared by dissolving Mg(NO3)2 (1 mM), KNO3 (10 mM), and NaNO3 (100 mM) into ultrapure water, and the pH of the solution was adjusted to pH 7.4. Ultrapure water obtained from the Millipore water purification system (18.2 MOhm·cm−1, Millipore, Germany) was used in all experiments.
All patient samples were acquired during the diagnosis or treatment in the Affiliated Hospital of Putian University. The patient samples were processed under institutional guidelines and approved by the ethical committee for biomedical research of the Affiliated Hospital of Putian University. The joint fluid samples were collected from medical procedures performed at the Affiliated Hospital of Putian University and stored at −80 °C until use.
In this strategy, the designed oligonucleotides were synthesized by Sangon Biotech. Co., Ltd. (Shanghai, China) and used without further purification. The design of the hairpin oligonucleotide probe was rearranged from the literature [25]. The sequences from 5′ to 3′ are shown as follows:
Primer: 5′-SH-TTTTTCCATCCCTCCACCTGAGTGCCTCCACCCATCC-3′
H1: 5′-CTCCACCCATCCTGCTAGTGGGATGGGTGGAGGCAATCA-3′
H2: 5′-CACTAGCAGGATGGGTGGAGTGATTGCCTCCACCCATCC-3′

2.2. Instruments

The electrochemical measurements were recorded by an electrochemical workstation (CHI660D, Chenhua Instruments, Shanghai, China) with a classical three-electrode system. Then, a gold electrode (diameter: 2 mm, 99.99% (w/w) polycrystalline, Chenhua Instruments, Shanghai, China) was employed as the working electrode, a Ag/AgCl electrode saturated with 3 M KCl was served as the reference electrode, and a platinum wire was used as the counter electrode. The ECL intensity measurements were detected by a laboratory-assembled detection system, which contains electrochemical measurements and emission chemical luminescence detection. Electrochemical and emission chemical luminescence were recorded by an electrochemical workstation (CHI660D, Chenhua Instruments, Shanghai, China) and an ultraweak luminescence analyzer (BPCL, Institute of Biophysics, Chinese Academy of Science, Beijing, China), respectively. Additionally, the voltage of the PMT in the ultraweak luminescence analyzer was set at 850 V in the detection process. Cyclic voltammetry (CV) measurement and electrochemical impedance spectroscopy (EIS) measurements were performed in 0.5 M KNO3 solution containing 0.01 M [Fe(CN)6]3+/4+. ECL intensity detection was recorded in Tris–HClO4 buffer (20 mM, pH 7.4) containing a coreaction reagent, 0.02 M TPA.

2.3. Working Electrode Preparation Protocol

A 2 mm diameter gold electrode was polished with 1.0, 0.3, and 0.05 μm alumina slurry. Additionally, the gold electrode sequence was ultrasonically cleaned by ethanol, piranha lotion, and distilled water. Then, the gold electrode was immersed in 0.5 M H2SO4 solution, and the platinum wire was used as the reference electrode and counter electrode. CV was used to activate the electrode in the potential range of −0.2–1.0 V until the stable voltammetry peak was obtained. Additionally, the electrode was thoroughly rinsed with deionized water and dried with a high purity of N2 gas. The primer was mixed with Ag+ at a concentration ratio of 1:8 and annealed at 95 °C to form a C–Ag–C hairpin structure. Subsequently, the gold electrode was immersed in 1 μM of the hairpin structure’s primer and reacted for 2 h to make the primer self-assemble to the electrode surface by a Au–S bond, and then passivated with 1 mM MCH.

2.4. ECL Detection

An amount of 10 μL of Tris–HClO4 buffer was dropped on the primer-modified gold electrode, and the working electrode was placed in a tube containing 50 μL of various concentrations of H2S standards (using Na2S as the source) or joint fluid samples. H2S gas could be volatilized from the tube and enriched on the primer-modified gold electrode by headspace enrichment [26,27]. Then, HCR was carried out at 37 °C for 105 min when the electrode was soaked in the solution containing H1 and H2 and Tris–HClO4 buffer. Following this, the modified electrode was immersed in Ru(phen)32+ solution and incubated for 3 h at 4 °C. Then, the electrode was rinsed thoroughly with Tris–HClO4 buffer to reduce the nonspecific binding. Finally, the ECL signal was measured in the potential range of 0.6 to 1.5 V (vs. Ag/AgCl) in Tris–HClO4 buffer containing 0.02 M TPA, and the scan rate was 100 mV/s.

3. Results and Discussion

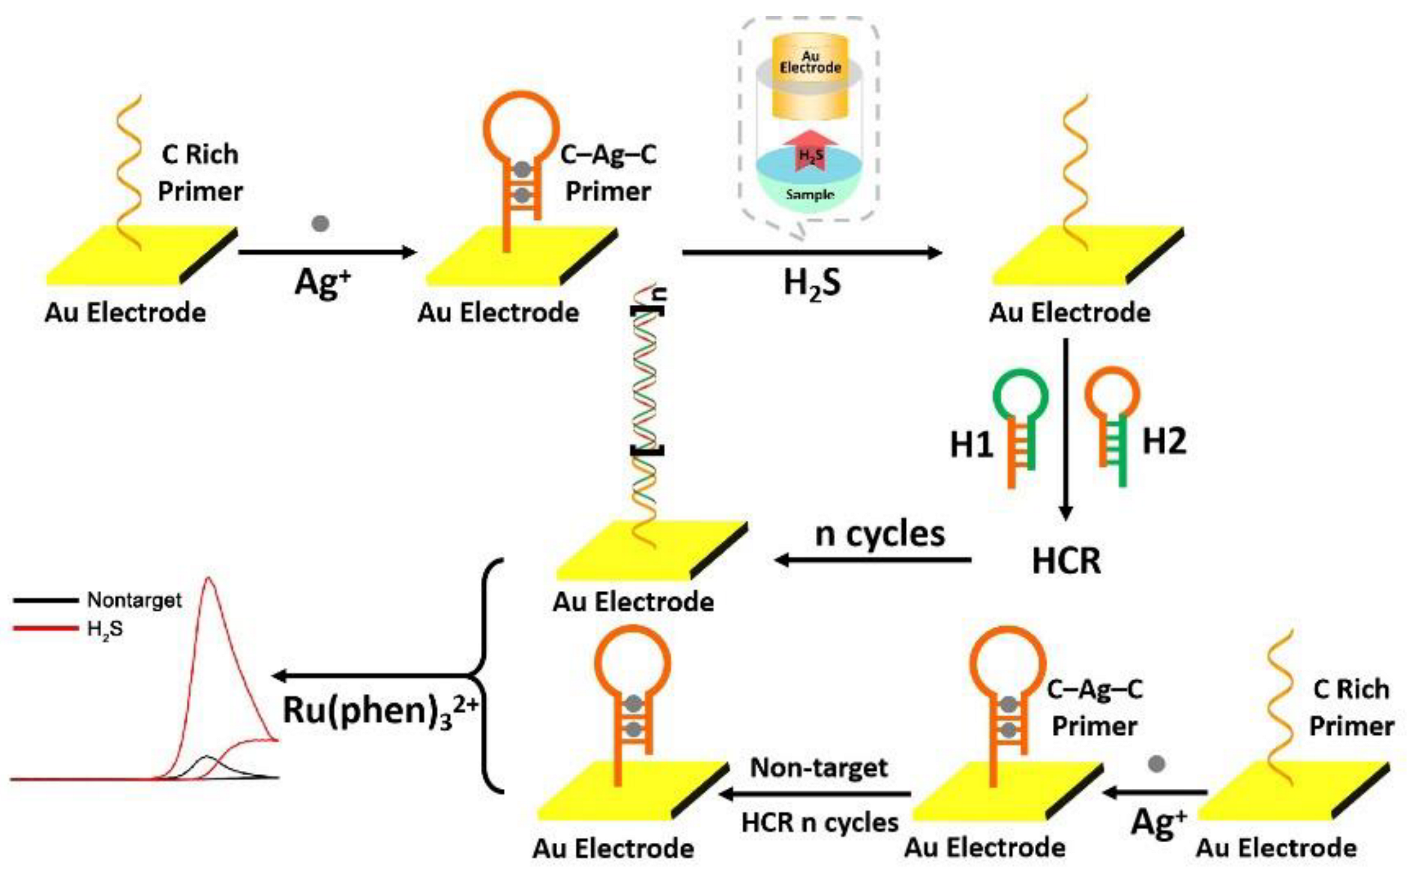
3.1. Principle of the Proposed ECL Biosensor for H2S Detection

In this strategy, a highly sensitive electrochemiluminescence biosensor was constructed through Ag+ combined with C-rich primer interaction and HCR amplification. The working principle is shown in Figure 1. In the presence of Ag+, a C-rich single-strand primer can form a C–Ag–C complex, and then the single-strand primer can form a hairpin structure. Subsequently, the hairpin structure primers are fixed on the surface of the gold electrode by a Au–S bond. Since H2S is both highly volatile and soluble in water, it can be volatile from the sample and enriched on the electrode. In the enrichment process, H2S forms Ag2S with Ag+, which competes with Ag+ from primers with a C–Ag–C hairpin structure, leading to the dissociation of the hairpin structure of the primer and the formation of a single-strand primer. The single-strand primer structure contains the initiating sequence required for the HCR amplification reaction, which is triggered when the H1 and H2 hairpin probes are added. That is, the initiator sequence in the single-strand primer triggers the opening of the H1 hairpin structure with a sticky end and hybridizes with part of it. The exposed sticky end of H1 further captures the H2 probe with a notch and hybridizes with part of it. The alternating hybridization of the H1 and H2 probes drives the chain reaction to form a DNA double-strand structure with a notch. Finally, a large number of DNA fragments with the double-stranded structures were generated on the electrode surface. Ru(Phen)32+ could be inserted as an ECL probe into the groove structure of dsDNA on the electrode surface, and a significantly enhanced ECL signal was detected. Because of the HCR amplification reaction, only a small amount of H2S can generate a large amount of double-stranded DNA on the electrode surface, which significantly improves the detection sensitivity.

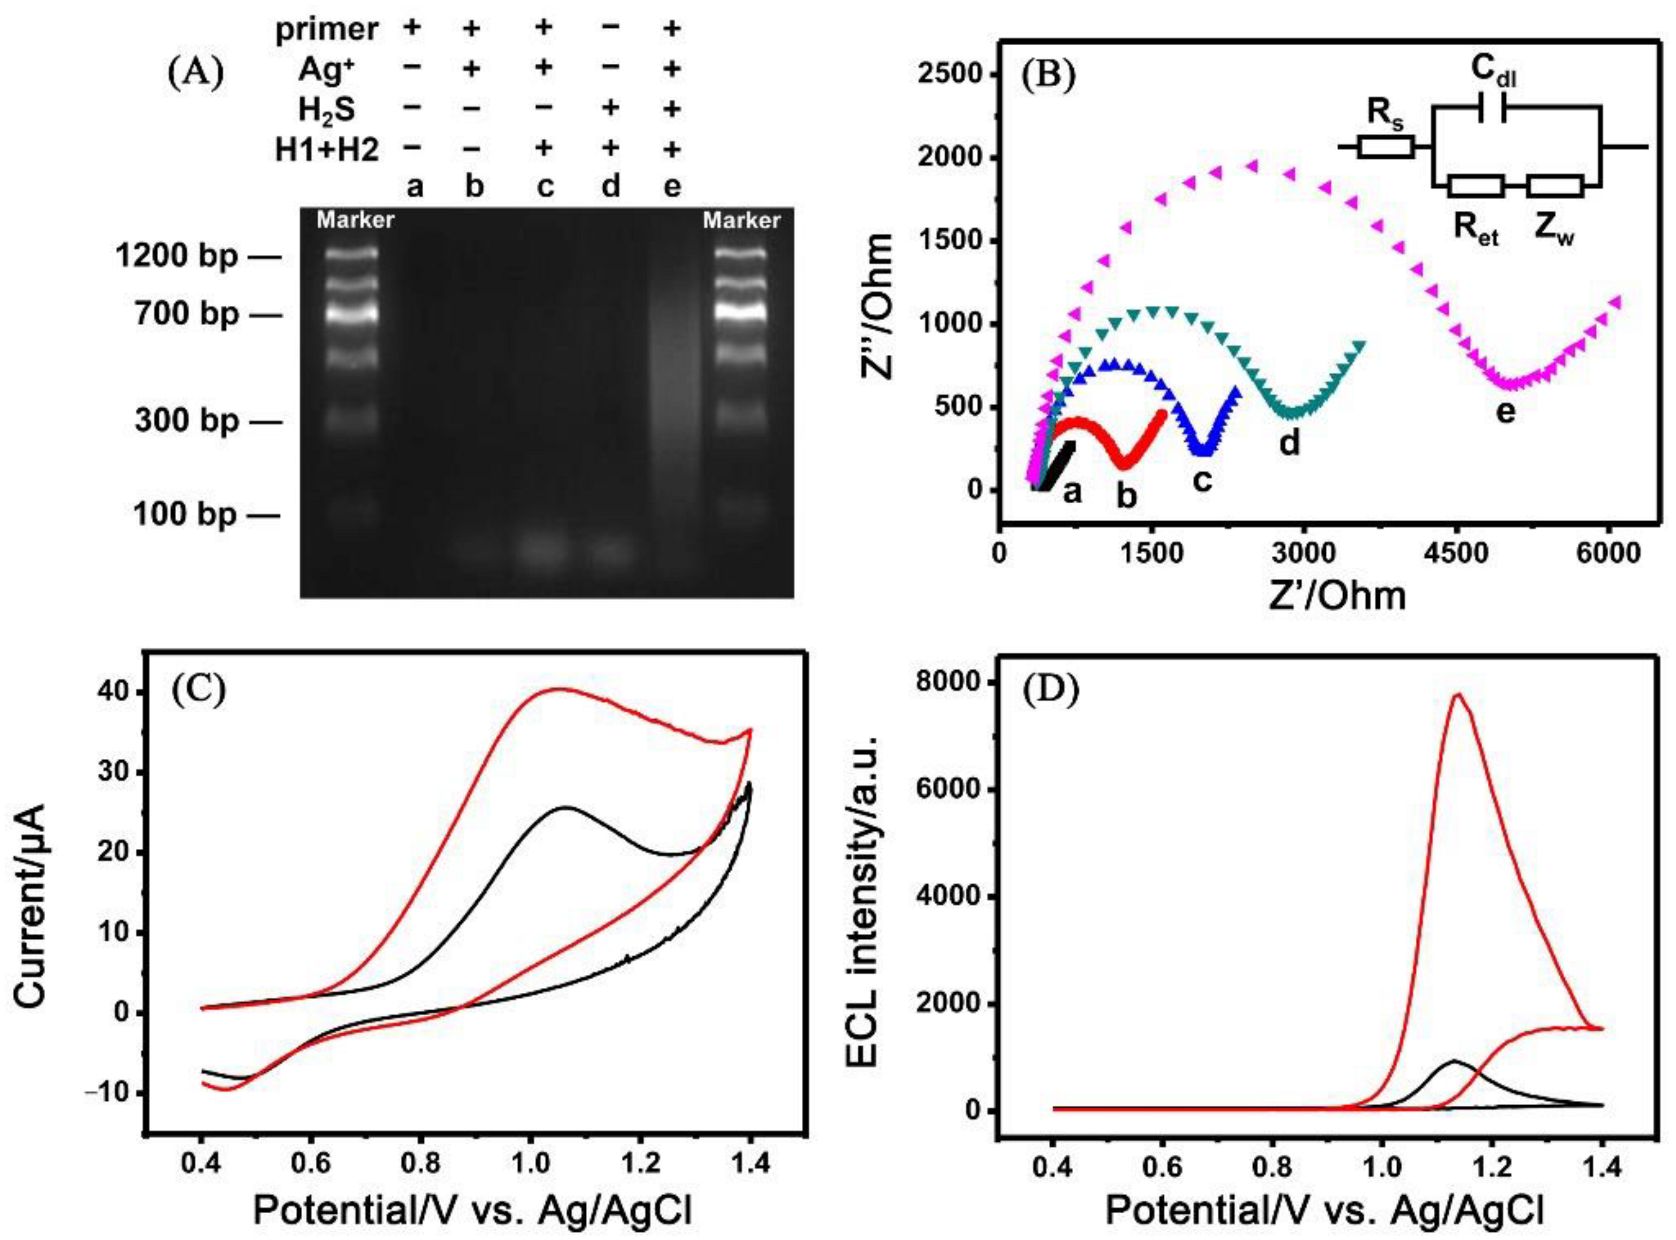
3.2. Characterization of the ECL Biosensor

In this strategy, HCR nucleic acid amplification technology was used to amplify the signal. In order to verify the feasibility of the HCR reaction system designed in this experiment, agarose gel electrophoresis was used to characterize the principle. As shown in Figure 2A, lanes a and b are the gel electrophoresis patterns of the primer before and after adding Ag+. It can be seen from the gel electrophoresis image that the primer was a single-strand primer, so there are no apparent bands in swim lane a. When Ag+ was added, a C-rich primer and Ag+ formed the C–Ag–C complementary and paired hairpin structure, and a conspicuous band appeared in lane b. Lane c was a mixture of H1 and H2 oligonucleotide probes. Since there was no initiating chain in the system, H1 and H2 existed stably in the solution without HCR reaction. In the absence of H2S, a single-strand primer and Ag+ formed a stable C–Ag–C complementary paired hairpin structure, which cannot expose the HCR promoter sequence, and it cannot generate the HCR amplification reaction (lane d). When H2S was present in the sample, Ag+ in the C–Ag–C primer formed Ag2S with H2S, exposing the single-strand primer to the initiating sequence of the HCR reaction and triggering HCR amplification, resulting in bright and long bands (lane e). These experimental results show that in the presence of H2S, the C–Ag–C structure can be dissociated, and the exposed initiator sequence can trigger HCR amplification to generate a long double-stranded DNA tandem structure.
Then, electrochemical impedance spectroscopy (EIS) was used further to verify the modification process of the electrode surface. [Fe(CN)6]3−/4− (in 0.1 M KNO3 electrolyte) was used as an electrochemical probe to characterize the EIS of the electrode with different assembling processes. In the Nyquist curve of the EIS spectrum, Z′ represents the real part and Z″ represents the imaginary part. The semicircle curve in the high-frequency region is controlled by charge transfer, and the diameter of the semicircle can equal the charge transfer resistance. In contrast, the straight line in the low-frequency region is controlled by diffusion. According to Randle’s equivalent circuit diagram, the Warburg impedance (Zw) was the diffusion resistance of electrolyte to the electrode surface. The electrolyte solution impedance (Rs) was the resistance between the reference electrode and the working electrode. The charge transfer impedance (Ret) was controlled by the electron transfer kinetics of [Fe(CN)6]3−/4− at the electrode interface. As shown in Figure 2B, curve a is the impedance diagram of the bare gold electrode, presenting a very small semicircle, indicating that the surface charge transfer of the bare gold electrode is almost free from resistance. When the hairpin structure primer was fixed to the electrode surface by a Au–S bond and combined with Ag+ to form the C–Ag–C structure, the semicircle diameter was significantly increased (curve b), and Rct was about 1200 Ω. This is due to the negative charge of the phosphoric acid skeleton of the primer, which generates electrostatic repulsion with [Fe(CN)6]3−/4− and hinders the charge transfer on the electrode surface. When MCH was added to plug the extra sites of the electrode, the diameter of the semicircle continued to increase (curve c), with an Rct of about 2000 Ω. MCH forms a molecular film on the surface of the electrode and prevents [Fe(CN)6]3−/4− charge transfer at the electrode interface. In the presence of H2S, the C–Ag–C structure dissociates, exposing the promoter sequence, triggering the HCR reaction, and generating a large number of double-stranded DNA fragments of different lengths on the electrode surface. A large amount of phosphoric acid skeleton greatly inhibits the charge transfer of [Fe(CN)6]3−/4− at the electrode interface. The Rct increases to about 5000 Ω (curve e). In the absence of H2S, the HCR reaction cannot be triggered, and the Rct value is only about 3000 Ω (curve d), which was caused by a small amount of residual H1 and H2 primers on the electrode surface. The above experimental results show that the sensor self-assembly process constructed in this strategy was consistent with the designed detection principle.
To further verify the feasibility of the ECL biosensor, we compared the cyclic voltammetry and corresponding ECL intensity after HCR reaction with H2S (red curve) and without H2S (black curve) (shown in Figure 2C,D). In the absence of H2S, the initiation sequence of the HCR reaction cannot be exposed, failing to trigger the HCR reaction, and only the very weak Ru(phen)32+ oxidation current and ECL signal can be detected. When the sample contained H2S, Ag+ and H2S formed Ag2S, exposing the HCR reaction initiation sequence, triggering the HCR reaction, and detecting a significantly increased Ru(phen)32+ oxidation current, and the ECL signal value increased eightfold. The experimental results show that H2S can trigger the HCR amplification reaction and generate a large number of double-stranded DNA fragments on the electrode surface. Ru(phen)32+ is embedded in the groove of the double-stranded DNA fragments as an ECL probe, resulting in a strong ECL signal. Therefore, ECL detection of H2S can be realized by designing a C-rich primer sequence and combining it with the HCR nucleic acid amplification method.

3.3. Optimization of Experimental Conditions

To obtain the best detection performance of the biosensor, some critical conditions of the experiment were optimized. In this experiment, TPA was used as ECL coreaction reagent. According to the results of previous research by our research group, we directly used a TPA concentration of 20 mM without further optimization [19,25]. Since the amount of Ag+ plays a vital role in a primer forming a C–Ag–C structure, the excess concentration of Ag+ in the system will affect the detection limit of the biosensor. As shown in Figure 3A, with the increase in Ag+ concentration, the intensity of the ECL signal gradually decreased and reached a plateau when the single-strand primer/Ag+ concentration ratio was 1:8. Therefore, a concentration ratio of 1:8 was chosen as the best proportion for further study.
Then, the enrichment time of H2S on the electrode was optimized (Figure 3B). In the presence of H2S, volatilization adsorbed on the electrode in a closed environment resulted in the dissociation of the C–Ag–C structure primer, exposing the initiator sequence to trigger the HCR reaction. With the gradual increase in H2S concentration, the ECL signal intensity gradually increased. At 30 min, the ECL signal reached a platform. Therefore, 30 min was chosen as the enrichment time of H2S.
The double-stranded DNA in the gold electrode surface after HCR reaction plays a vital role in signal amplification. Subsequently, the reaction time of HCR was investigated (Figure 3C). The intensity of ECL increased with the increase in HCR reaction time, and almost ceased to increase after 90 min, indicating the completion of the HCR reaction. Therefore, 90 min was selected as the reaction time of HCR in subsequent experiments.
Finally, the time of Ru(phen)32+ embedding double-stranded DNA on the gold electrode surface was optimized (Figure 3D). At 4 °C and in a dark environment, with the increase in Ru(phen)32+ incubation time, the strength of ECL gradually increased, reaching saturation when the incubation time was 3 h. Therefore, 3 h of Ru(phen)32+ intercalation time was finally selected as the optimum condition.

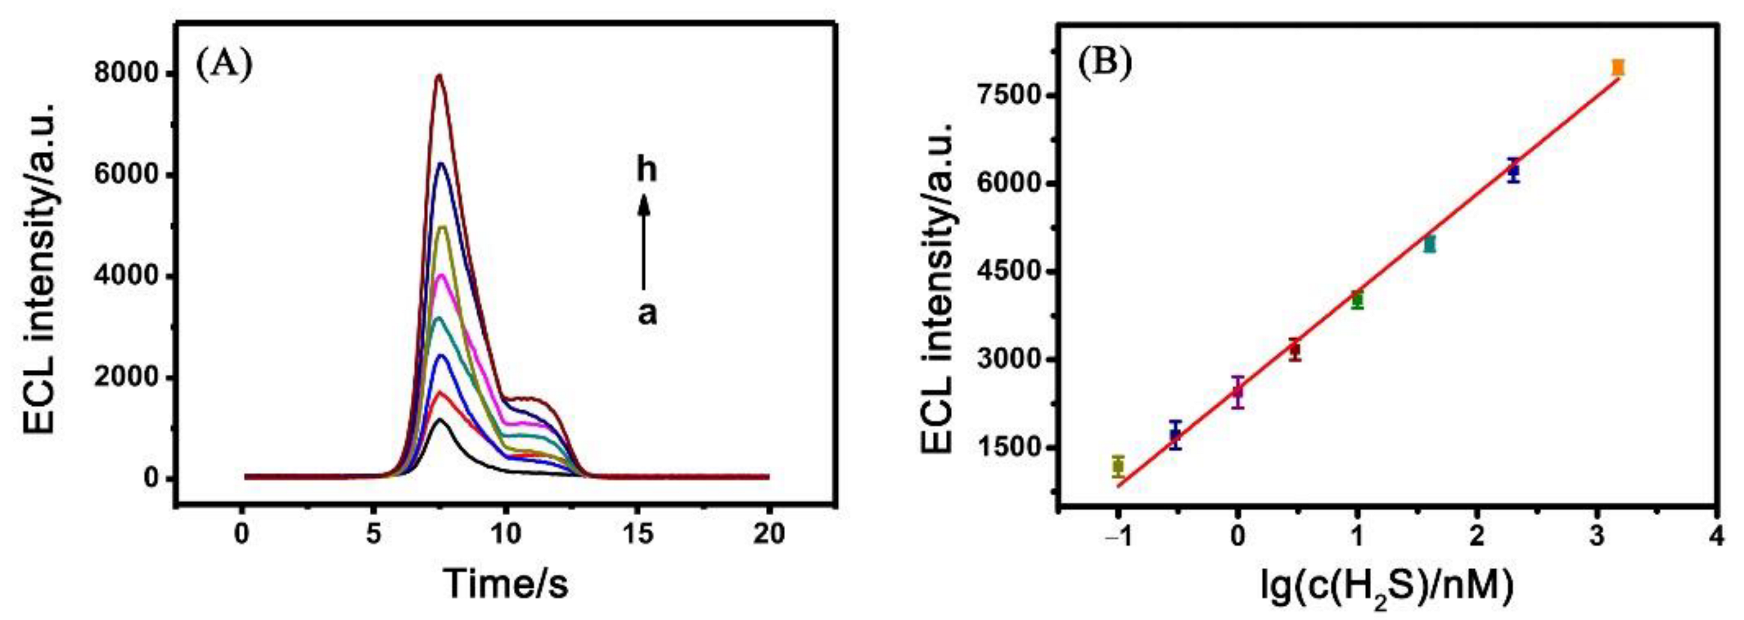
3.4. Analytical Performance of the Proposed ECL Biosensor

Under optimal conditions, the sensor constructed above is used for H2S detection. As shown in Figure 4, in the range of 0.100–1500 nM, the ECL signal intensity increases with the increase in H2S concentration, and the log value of the H2S concentration has a good linear relationship with ECL intensity. The linear regression equation of the response was:
Y = 1661.45 lgC (H2S)/nM + 2506.17  R2 = 0.9920
where Y is the intensity of the ECL signal, C is the concentration of H2S, and R2 is the linear correlation coefficient. The limit of detection was 0.0398 nM (S/N = 3). Compared with other H2S sensors, this developed sensor combined with a nucleic acid amplification strategy can detect H2S concentration at the nanomolar level with higher sensitivity. Additionally, the analytical performance is compared in Table 1.
To verify the specific response of the biosensor for H2S detection, some common physiologically active substances in joint fluid were selected as distractors to investigate their influence on the sensor signal. Amounts of 400 μM of AA, 20.0 μM of DA, 20.0 μM of UA, 50.0 μM of DOPAC, 50.0 μM of 5-HT, 200 μM of Cys, and 2.00 mM of GSH were used as interference substances. The experimental results show that the ECL signal intensity measured by the interfering substance is close to the blank value, and the HCR reaction can be specifically amplified only when the target is present (Figure 5). Due to the high volatility of H2S, H2S can achieve highly selective analysis and detection when the headspace enrichment strategy is adopted. Therefore, the biosensor has good selectivity for H2S.
In addition, the reproducibility of the ECL sensor was investigated by repeatability experiments. The relative standard deviation (RSD) of the ECL signal was 5.80% (n = 5) for the parallel determination of H2S at 40.0 nM by biosensors prepared with different gold electrodes. Experimental results show that the ECL biosensor has good reproducibility. The prepared ECL biosensor was stored at 4 °C for 1 week and then measured the ECL signal. Compared with the newly prepared ECL biosensor, the measured ECL signal decreased by less than 6.00%, indicating that the ECL biosensor has good stability.

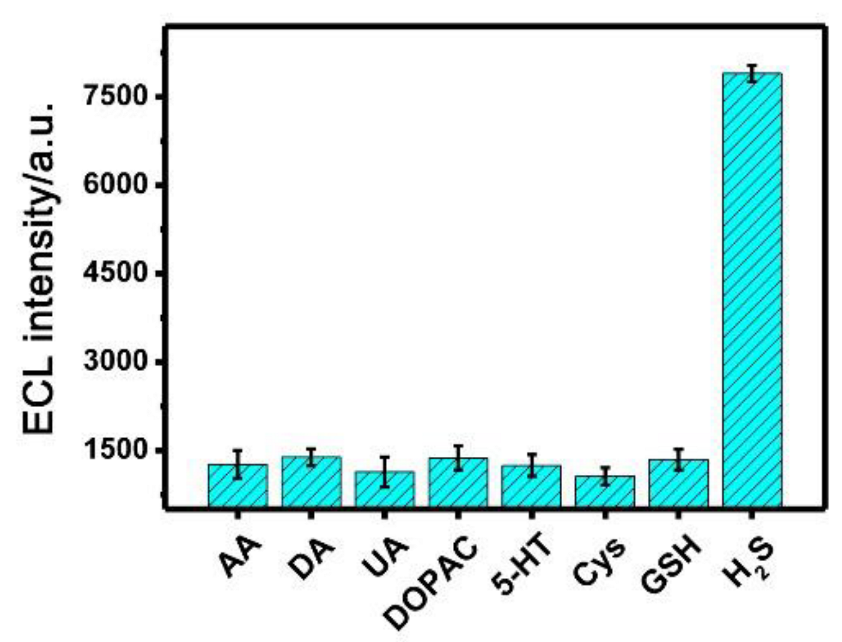
3.5. Application of the Proposed ECL Biosensor

Based on the above experimental results, the highly sensitive biosensor constructed in this experiment can analyze and detect the standard sample of H2S in the relatively mimetic system. To further investigate the application prospect of the constructed sensor in the detection of complex biological samples, it has been applied to detect H2S concentration in joint fluid. The determined results are summarized in Table 2. In addition, the recoveries were examined by the standard addition method, 200 nM H2S standard was spiked in the above-mentioned joint fluid samples, and the recoveries were in the range of 92.3–96.5%. The above experimental results show that the ECL sensor constructed in this method can be effectively applied to the determination of H2S concentration in complex samples with reasonable accuracy.

4. Conclusions

In this study, a highly sensitive and highly specific ECL biosensor was constructed to detect H2S based on the interaction between ions and the principle of HCR nucleic acid amplification. When the target was present, the C–Ag–C hairpin structure primer dissociated, exposing the HCR reaction initiation sequence, triggering the HCR reaction, and amplifying the detection signal. Compared with other H2S detection methods, this method has a lower detection limit and can be used to detect joint fluid samples. In addition, this biosensor not only is expected to analyze and detect other low-concentration H2S samples, but also has a particular practical application prospect.

Author Contributions

Data curation, conceptualization, and formal analysis, Z.C. and G.C.; data curation, Z.C. and W.L.; methodology and validation, J.L. and L.F.; visualization and writing review and editing, Y.Z. and X.W.; project administration, supervision, and writing of the original draft, Y.C. and Z.L. All authors have read and agreed to the published version of the manuscript.

Funding

This work was financially supported by the National Science Foundation of China (No. 21775026), Natural Science Foundation of Fujian Province (No. 2021J011370), Fujian Provincial Health Technology Project (No. 2019-ZQN-93), and Fujian Provincial Education and Technology Project (No. JAT200504).

Institutional Review Board Statement

Not applicable.

Informed Consent Statement

Not applicable.

Data Availability Statement

Not applicable.

Conflicts of Interest

The authors declare no conflict of interest.

References

  1. Onuora, S. Osteoarthritis: Chondrocyte clock maintains cartilage tissue. Nat. Rev. Rheumatol. 2016, 12, 71. [Google Scholar] [CrossRef] [PubMed]
  2. Li, Y.; Wei, X.; Zhou, J.; Wei, L. The Age-Related Changes in Cartilage and Osteoarthritis. BioMed Res. Int. 2013, 2013, 12. [Google Scholar] [CrossRef] [PubMed]
  3. Poulet, B.; Staines, K.A. New developments in osteoarthritis and cartilage biology. Curr. Opin. Pharmacol. 2016, 28, 8–13. [Google Scholar] [CrossRef] [PubMed] [Green Version]
  4. Fox, B.; Schantz, J.T.; Haigh, R.; Wood, M.E.; Moore, P.K.; Viner, N.; Spencer, J.P.; Winyard, P.G.; Whiteman, M. Inducible hydrogen sulfide synthesis in chondrocytes and mesenchymal progenitor cells: Is H2S a novel cytoprotective mediator in the inflamed joint? J. Cell. Mol. Med. 2012, 16, 896–910. [Google Scholar] [CrossRef] [PubMed]
  5. Whiteman, M.; Haigh, R.; Tarr, J.M.; Gooding, K.M.; Shore, A.C.; Winyard, P.G. Detection of hydrogen sulfide in plasma and knee-joint synovial fluid from rheumatoid arthritis patients: Relation to clinical and laboratory measures of inflammation. Ann. N. Y. Acad. Sci. 2010, 1203, 146–150. [Google Scholar] [CrossRef] [PubMed]
  6. Doeller, J.E.; Isbell, T.S.; Benavides, G.; Koenitzer, J.; Patel, H.; Patel, R.P.; Lancaster, J.R., Jr.; Darley-Usmar, V.M.; Kraus, D.W. Polarographic measurement of hydrogen sulfide production and consumption by mammalian tissues. Anal. Biochem. 2005, 341, 40–51. [Google Scholar] [CrossRef]
  7. Richter, B.; Mace, Z.; Hays, M.E.; Adhikari, S.; Pham, H.Q.; Sclabassi, R.J.; Kolber, B.; Yerneni, S.S.; Campbell, P.; Cheng, B.; et al. Development and Characterization of Novel Conductive Sensing Fibers for In Vivo Nerve Stimulation. Sensors 2021, 21, 7581. [Google Scholar] [CrossRef]
  8. Tao, Y.; Lin, Y.; Luo, F.; Fu, C.; Lin, C.; He, Y.; Cai, Z.; Qiu, B.; Lin, Z. Convenient detection of H2S based on the photothermal effect of Au@Ag nanocubes using a handheld thermometer as readout. Anal. Chem. Acta 2021, 1149, 338211. [Google Scholar] [CrossRef]
  9. Chen, Z.; Chen, C.; Huang, H.; Luo, F.; Guo, L.; Zhang, L.; Lin, Z.; Chen, G. Target-Induced Horseradish Peroxidase Deactivation for Multicolor Colorimetric Assay of Hydrogen Sulfide in Rat Brain Microdialysis. Anal. Chem. 2018, 90, 6222–6228. [Google Scholar] [CrossRef]
  10. Jiao, X.; Li, Y.; Niu, J.; Xie, X.; Wang, X.; Tang, B. Small-Molecule Fluorescent Probes for Imaging and Detection of Reactive Oxygen, Nitrogen, and Sulfur Species in Biological Systems. Anal. Chem. 2018, 90, 533–555. [Google Scholar] [CrossRef]
  11. Yang, M.W.; Fan, J.L.; Du, J.J.; Peng, X.J. Small-molecule fluorescent probes for imaging gaseous signaling molecules: Current progress and future implications. Chem. Sci. 2020, 11, 5127–5141. [Google Scholar] [CrossRef] [PubMed] [Green Version]
  12. Yue, X.; Zhu, Z.; Zhang, M.; Ye, Z. Reaction-based turn-on electrochemiluminescent sensor with a ruthenium(II) complex for selective detection of extracellular hydrogen sulfide in rat brain. Anal. Chem. 2015, 87, 1839–1845. [Google Scholar] [CrossRef] [PubMed]
  13. Chen, J.; Guo, L.; Chen, L.; Qiu, B.; Hong, G.; Lin, Z. Sensing of Hydrogen Sulfide Gas in the Raman-Silent Region Based on Gold Nano-Bipyramids (Au NBPs) Encapsulated by Zeolitic Imidazolate Framework-8. ACS Sens. 2020, 5, 3964–3970. [Google Scholar] [CrossRef] [PubMed]
  14. Hughes, M.N.; Centelles, M.N.; Moore, K.P. Making and working with hydrogen sulfide: The chemistry and generation of hydrogen sulfide in vitro and its measurement in vivo: A review. Free Radic. Biol. Med. 2009, 47, 1346–1353. [Google Scholar] [CrossRef] [PubMed]
  15. Ma, C.; Wu, W.; Peng, Y.; Wang, M.X.; Chen, G.; Chen, Z.; Zhu, J.J. A Spectral Shift-Based Electrochemiluminescence Sensor for Hydrogen Sulfide. Anal. Chem. 2018, 90, 1334–1339. [Google Scholar] [CrossRef]
  16. Li, L.; Zhang, Y.; Liu, F.; Su, M.; Liang, L.; Ge, S.; Yu, J. Real-time visual determination of the flux of hydrogen sulphide using a hollow-channel paper electrode. Chem. Commun. 2015, 51, 14030–14033. [Google Scholar] [CrossRef]
  17. Li, Y.; Qi, H.; Gao, Q.; Zhang, C. Label-free and sensitive electrogenerated chemiluminescence aptasensor for the determination of lysozyme. Biosens. Bioelectron. 2011, 26, 2733–2736. [Google Scholar] [CrossRef]
  18. Yang, L.; Zhang, Y.; Li, R.; Lin, C.; Guo, L.; Qiu, B.; Lin, Z.; Chen, G. Electrochemiluminescence biosensor for ultrasensitive determination of ochratoxin A in corn samples based on aptamer and hyperbranched rolling circle amplification. Biosens. Bioelectron. 2015, 70, 268–274. [Google Scholar] [CrossRef]
  19. Jin, G.; Wang, C.; Yang, L.; Li, X.; Guo, L.; Qiu, B.; Lin, Z.; Chen, G. Hyperbranched rolling circle amplification based electrochemiluminescence aptasensor for ultrasensitive detection of thrombin. Biosens. Bioelectron. 2015, 63, 166–171. [Google Scholar] [CrossRef]
  20. Lin, Y.; Yang, L.; Yue, G.; Chen, L.; Qiu, B.; Guo, L.; Lin, Z.; Chen, G. Label-free electrochemiluminescence biosensor for ultrasensitive detection of telomerase activity in HeLa cells based on extension reaction and intercalation of Ru(phen)32+. Anal. Bioanal. Chem. 2016, 408, 7105–7111. [Google Scholar] [CrossRef]
  21. Yang, L.; Tao, Y.; Yue, G.; Li, R.; Qiu, B.; Guo, L.; Lin, Z.; Yang, H.-H. Highly Selective and Sensitive Electrochemiluminescence Biosensor for p53 DNA Sequence Based on Nicking Endonuclease Assisted Target Recycling and Hyperbranched Rolling Circle Amplification. Anal. Chem. 2016, 88, 5097–5103. [Google Scholar] [CrossRef] [PubMed]
  22. Zhao, C.; Qu, K.; Song, Y.; Xu, C.; Ren, J.; Qu, X. A Reusable DNA Single-Walled Carbon-Nanotube-Based Fluorescent Sensor for Highly Sensitive and Selective Detection of Ag+ and Cysteine in Aqueous Solutions. Chem. Eur. J. 2010, 16, 8147–8154. [Google Scholar] [CrossRef] [PubMed]
  23. Feng, D.-Q.; Liu, G.; Zheng, W.; Liu, J.; Chen, T.; Li, D. A highly selective and sensitive on-off sensor for silver ions and cysteine by light scattering technique of DNA-functionalized gold nanoparticles. Chem. Commun. 2011, 47, 8557–8559. [Google Scholar] [CrossRef] [PubMed]
  24. Miao, P.; Ning, L.; Li, X. Gold Nanoparticles and Cleavage-Based Dual Signal Amplification for Ultrasensitive Detection of Silver Ions. Anal. Chem. 2013, 85, 7966–7970. [Google Scholar] [CrossRef] [PubMed]
  25. Zhang, H.; Luo, F.; Wang, P.; Guo, L.; Qiu, B.; Lin, Z. Signal-on electrochemiluminescence aptasensor for bisphenol A based on hybridization chain reaction and electrically heated electrode. Biosens. Bioelectron. 2019, 129, 36–41. [Google Scholar] [CrossRef]
  26. Yue, G.; Huang, D.; Luo, F.; Guo, L.; Qiu, B.; Lin, Z.; Chen, G. Highly selective fluorescence sensor for hydrogen sulfide based on the Cu(II)-dependent DNAzyme. J. Lumin. 2019, 207, 369–373. [Google Scholar] [CrossRef]
  27. Fang, Z.; Yue, G.; Wang, J.; Luo, F.; Guo, L.; Qiu, B.; Lin, Z. Chemiluminescent sensor for hydrogen sulfide in rat brain microdialysis based on target-induced horseradish peroxidase deactivation. Anal. Methods 2019, 11, 3085–3089. [Google Scholar] [CrossRef]
  28. Asif, M.; Aziz, A.; Wang, Z.; Ashraf, G.; Wang, J.; Luo, H.; Chen, X.; Xiao, F.; Liu, H. Hierarchical CNTs@CuMn Layered Double Hydroxide Nanohybrid with Enhanced Electrochemical Performance in H2S Detection from Live Cells. Anal. Chem. 2019, 91, 3912–3920. [Google Scholar] [CrossRef]
  29. Wang, S.; Liu, X.; Zhang, M. Reduction of Ammineruthenium(III) by Sulfide Enables In Vivo Electrochemical Monitoring of Free Endogenous Hydrogen Sulfide. Anal. Chem. 2017, 89, 5382–5388. [Google Scholar] [CrossRef]
  30. Hall, J.R.; Schoenfisch, M.H. Direct Electrochemical Sensing of Hydrogen Sulfide without Sulfur Poisoning. Anal. Chem. 2018, 90, 5194–5200. [Google Scholar] [CrossRef]
  31. Cao, J.; Fu, Y.; Fu, X.; Ren, S.; Liu, Y. Dual-wavelength electrochemiluminescence ratiometry for hydrogen sulfide detection based on Cd(2+)-doped g-C3N4 nanosheets. Analyst 2022, 147, 247–251. [Google Scholar] [CrossRef] [PubMed]
  32. Kim, K.; Oh, J.; Hong, J. Highly Selective Electrochemiluminescence Chemosensor for Sulfide Enabled by Hierarchical Reactivity. Anal. Chem. 2022, 94, 5091–5098. [Google Scholar] [CrossRef] [PubMed]
Figure 1. Schematic illustration of an ultrasensitive ECL biosensor for H2S detection based on ion interaction.
Chemosensors 10 00250 g001
Figure 2. (A) Agarose gel electrophoresis (lane a: primer; lane b: primer + Ag+; lane c: primer + Ag+ + H1 + H2; lane d: H1 + H2; lane e: primer + Ag+ + H2S + H1 + H2); (B) electrochemical impedance spectroscopy of various probes modified at the electrode (a: bare Au electrode; b: electrode ‘a’ + primer + Ag+; c: electrode ‘b’ + MCH; d: electrode ‘c’ + H1 + H2; e: electrode ‘c’ + H2S + H1 + H2) in [Fe(CN)6]3−/4− (5 mM) containing KNO3 (0.1 M) in the range of 10−2 to 106 Hz at an alternate voltage of 214 mV; (C) Cyclic voltammograms and (D) ECL intensity of the proposed biosensor in the absence (black curve) and presence (red curve) of H2S (2 μM) in Tris–HClO4 buffer. The scan rate was 100 mV/s with Ag/AgCl.
Chemosensors 10 00250 g002
Figure 3. The effects of (A) the molar ratio of a primer and Ag+; (B) H2S enrichment reaction time; (C) the time of HCR reaction; and (D) intercalation time between Ru(phen)32+ and dsDNA. The error bars show the standard deviation of three replicate determinations.
Chemosensors 10 00250 g003
Figure 4. (A) ECL responses at different H2S concentrations: a–h: 0.100, 0.300, 1.00, 3.00, 10.0, 40.0, 200, 1500 nM; (B) relationship between ECL intensity and the logarithm of H2S concentrations. The error bars show the standard deviation of three replicate determinations.
Chemosensors 10 00250 g004
Figure 5. Selectivity of the proposed ECL biosensor for H2S detection.
Chemosensors 10 00250 g005
Table 1. Analytical performance of this biosensor in H2S detection compared with previously reported literature.
MethodsLinear RangeLODReference
Electrochemistry0.08–2900 μM0.3 μM[28]
Electrochemistry0.5–10 μM0.17 μM[29]
Electrochemistry0.15–15 μM0.1 μM[30]
Electrochemiluminescent0.5–10 μM0.25 μM[12]
Electrochemiluminescent0.05–100.0 μM0.02 μM[31]
Electrochemiluminescent0–30 μM1.08 μM[32]
Electrochemiluminescent0.100–1500 nM0.0398 nMThis work
Table 2. Determination of H2S in joint fluid using the proposed sensor (n = 3).
SampleDetected
(nM)
Spiked
(nM)
Total Found
(nM)
Recovery
(%)
1855.4 ± 30.58200.0973.6 ± 22.8592.3%
2749.2 ± 27.38200.0916.4 ± 21.8196.5%
3536.6 ± 31.36200.0703.9 ± 19.5295.6%
Publisher’s Note: MDPI stays neutral with regard to jurisdictional claims in published maps and institutional affiliations.

