Article

Copper-Containing Films Obtained by the Simple Citrate Sol–Gel Route for NO2 Detection: Adsorption and Kinetic Study

by
Tatiana N. Myasoedova
1,*,
Nina K. Plugotarenko
1 and
Tatiana A. Moiseeva
2
1
Institute of Nanotechnologies, Microelectronics and Equipment Engineering, Southern Federal University, 2 Chekhov Str., Taganrog 347928, Russia
2
Ecoanalitical laboratory FSBI “CherAztechmordirekciya”, 6 Gogolevsky Str., Taganrog 347900, Russia
*
Author to whom correspondence should be addressed.
Submission received: 30 July 2020 / Revised: 27 August 2020 / Accepted: 28 August 2020 / Published: 30 August 2020
(This article belongs to the Section Materials for Chemical Sensing)

Abstract

:
The citrate sol–gel method was utilized for the fabrication of copper-containing films sensitive to NO2 gas. Effect of annealing temperature on the film phase composition, morphology, and sensor response was studied. X-ray diffraction reveals the formation of Cu2Cl(OH)3 phase at 250 °C and the CuO phase at 350 and 500 °C. It was found out that the films annealed at 250 °C and 350 °C showed the best sensor characteristics. The influence of thermal degradation on the probability of percolation effect in films and its connection to a decrease of gas sensitivity was studied. The kinetics of the NO2 gas adsorption on the film’s surface was described following the Elovich model. Activation energy estimated from the ln(S) vs. 1/T plots was 252 and 30 kJ/mol for the films annealed at 250 and 350 °C, respectively.

1. Introduction

Nitrogen oxides are formed in the atmosphere, both natural and by anthropogenic combustion of fossil fuels. Air pollution with nitrogen oxides is generally relatively low. However, in areas with the developed chemical industry, there are local zones of increased NOX content in the air. The main anthropogenic sources of nitrogen oxides entering the atmosphere are the combustion of all types of natural fuels (12 million tons/year), transport (8 million tons/year), and industry (1 million tons/year). So, monitoring of NO2 level is of considerable interest.
Currently, a kind of gas sensors, such as oxide semiconductors is developed [1,2,3]. Wherein, the oxide semiconductor gas sensor attracted attention due to its high sensitivity, low cost, and simple fabrication [4]. Copper oxide (CuO) as p-type material has attracted significant attention in last decade for its possible application as gas sensors [5,6,7,8,9,10,11,12,13,14,15]. It is evident that when producing gas-sensitive materials, it is necessary to increase and develop a surface adsorption center activity [16,17,18], which significantly depends on the technological conditions of manufacturing, i.e., type of precursors, reaction temperature, time, etc. In addition, the fabrication technique affects the particle size and morphology and electrophysical properties (band gap, resistance, activation energy, etc.). Materials based on copper oxide have promising physicochemical properties for gas sensor applications [15,19,20] due to their capability to form nanostructures with a different particle’s shape, such as cubes, sheets, stars, flowers, and others [21,22,23].
The gas-sensing capability of CuO also depends on the operation temperature, because it influences the response and recovery times and also the sensitivity of the sensors [24]. Working temperatures of copper oxide-based sensors are ranged from 50 to 500 °C. A few works have been reported on the low-temperature gas sensors (˂100 °C) [13,25,26,27,28].
As the principle of the resistive sensors is based on changing conductivity, it is necessary to create a network of conductive particles inside the film’s structure. The sol–gel method is suitable for realizing this idea [29,30]. One of the principal advantages of the sol–gel method is the ability to control the structure of the produced materials, but a limited amount of works have been reported on the effect of particle morphology on the gas-sensing properties p-CuO [10,31,32]. Besides, many unanswered questions have been left concerning the gas sensing mechanism of the CuO materials with the non-ordinary shape of particles.
Therefore, herein, we investigate the influence of technological conditions on the value of the band gap, particle shape, and gas sensor response to NO2 at low operating temperatures. Besides, we studied the adsorption mechanism, depending on the surface particle morphology and conditions.

2. Materials and Methods

2.1. Characterization

A surface morphological study of the deposited film samples was carried out using scanning electron microscopy (LEO 1560, ZEISS). The SEM operating voltage was employed at 5 kV. X-ray diffraction (XRD) phase analysis was performed with an ARL X’TRA diffractometer equipped with a solid-state Si(Li) detector that registered selectively Cu Ka radiation (λ = 1.5418 Å). Phases were identified using the Powder Diffraction File (PDF-2), release 2006.
The band gap energy was determined from the optical absorption spectra recorded using a commercial spectrophotometer LEKI SS1207 (LEKI Instruments, Helsinki, Finland) and analyzed by the empirical relation Equation (1):
α h v = A ( h v E g ) n
where hv is the photon energy; Eg is the band gap energy; n is an exponent determined by the nature of the electron transition during the absorption process, i.e., n = 1/2 for direct transition and n = 2 for an indirect transition; A is constant; and α is the absorption coefficient defined by the Beer-Lambert’s Equation (2) law:
α = 2.303 × A b s d
where d and Abs are the film thickness and film absorbance, respectively.

2.2. Gas Sensor Fabrication

Earlier, we have already published the technology of film fabrication [33,34]. In brief, copper-containing thin films were synthesized by a citrate sol–gel method using ethylene glycol as a dispersing agent. The sol was prepared by dissolving 3 wt. % CuCl2 with a mixture of 10 mL ethanol and distilled water (10 mL). Further, the as-prepared sol was mixed with ethylene glycol in a volumetric ratio of 1:1. Then, citric acid of 10 wt. % concentration was dropped (0.25 mL) into the mixture to reach pH = 4. The resulting solution was stored at room temperature for 24 h. At the next step, the Si/SiO2 substrate preskimmed in nitric acid (10 min) was immersed in the solution and remained inside it with periodic stirring for 7 days at room temperature. Then, the substrate with the deposited film was pulled up. The prepared films were first, dried at 150 C for 1 h, and then annealed at 250, 350, and 500 °C for 2 h in ambient air. The thickness of the annealed films at 250–500 °C was measured as about 0.2 mm by an interference optical method.
Finally, V/Cu/Ni layers were deposited via an interdigitated shadow mask onto the film surface to serve as the contact electrodes.

2.3. Gas Sensor Tests
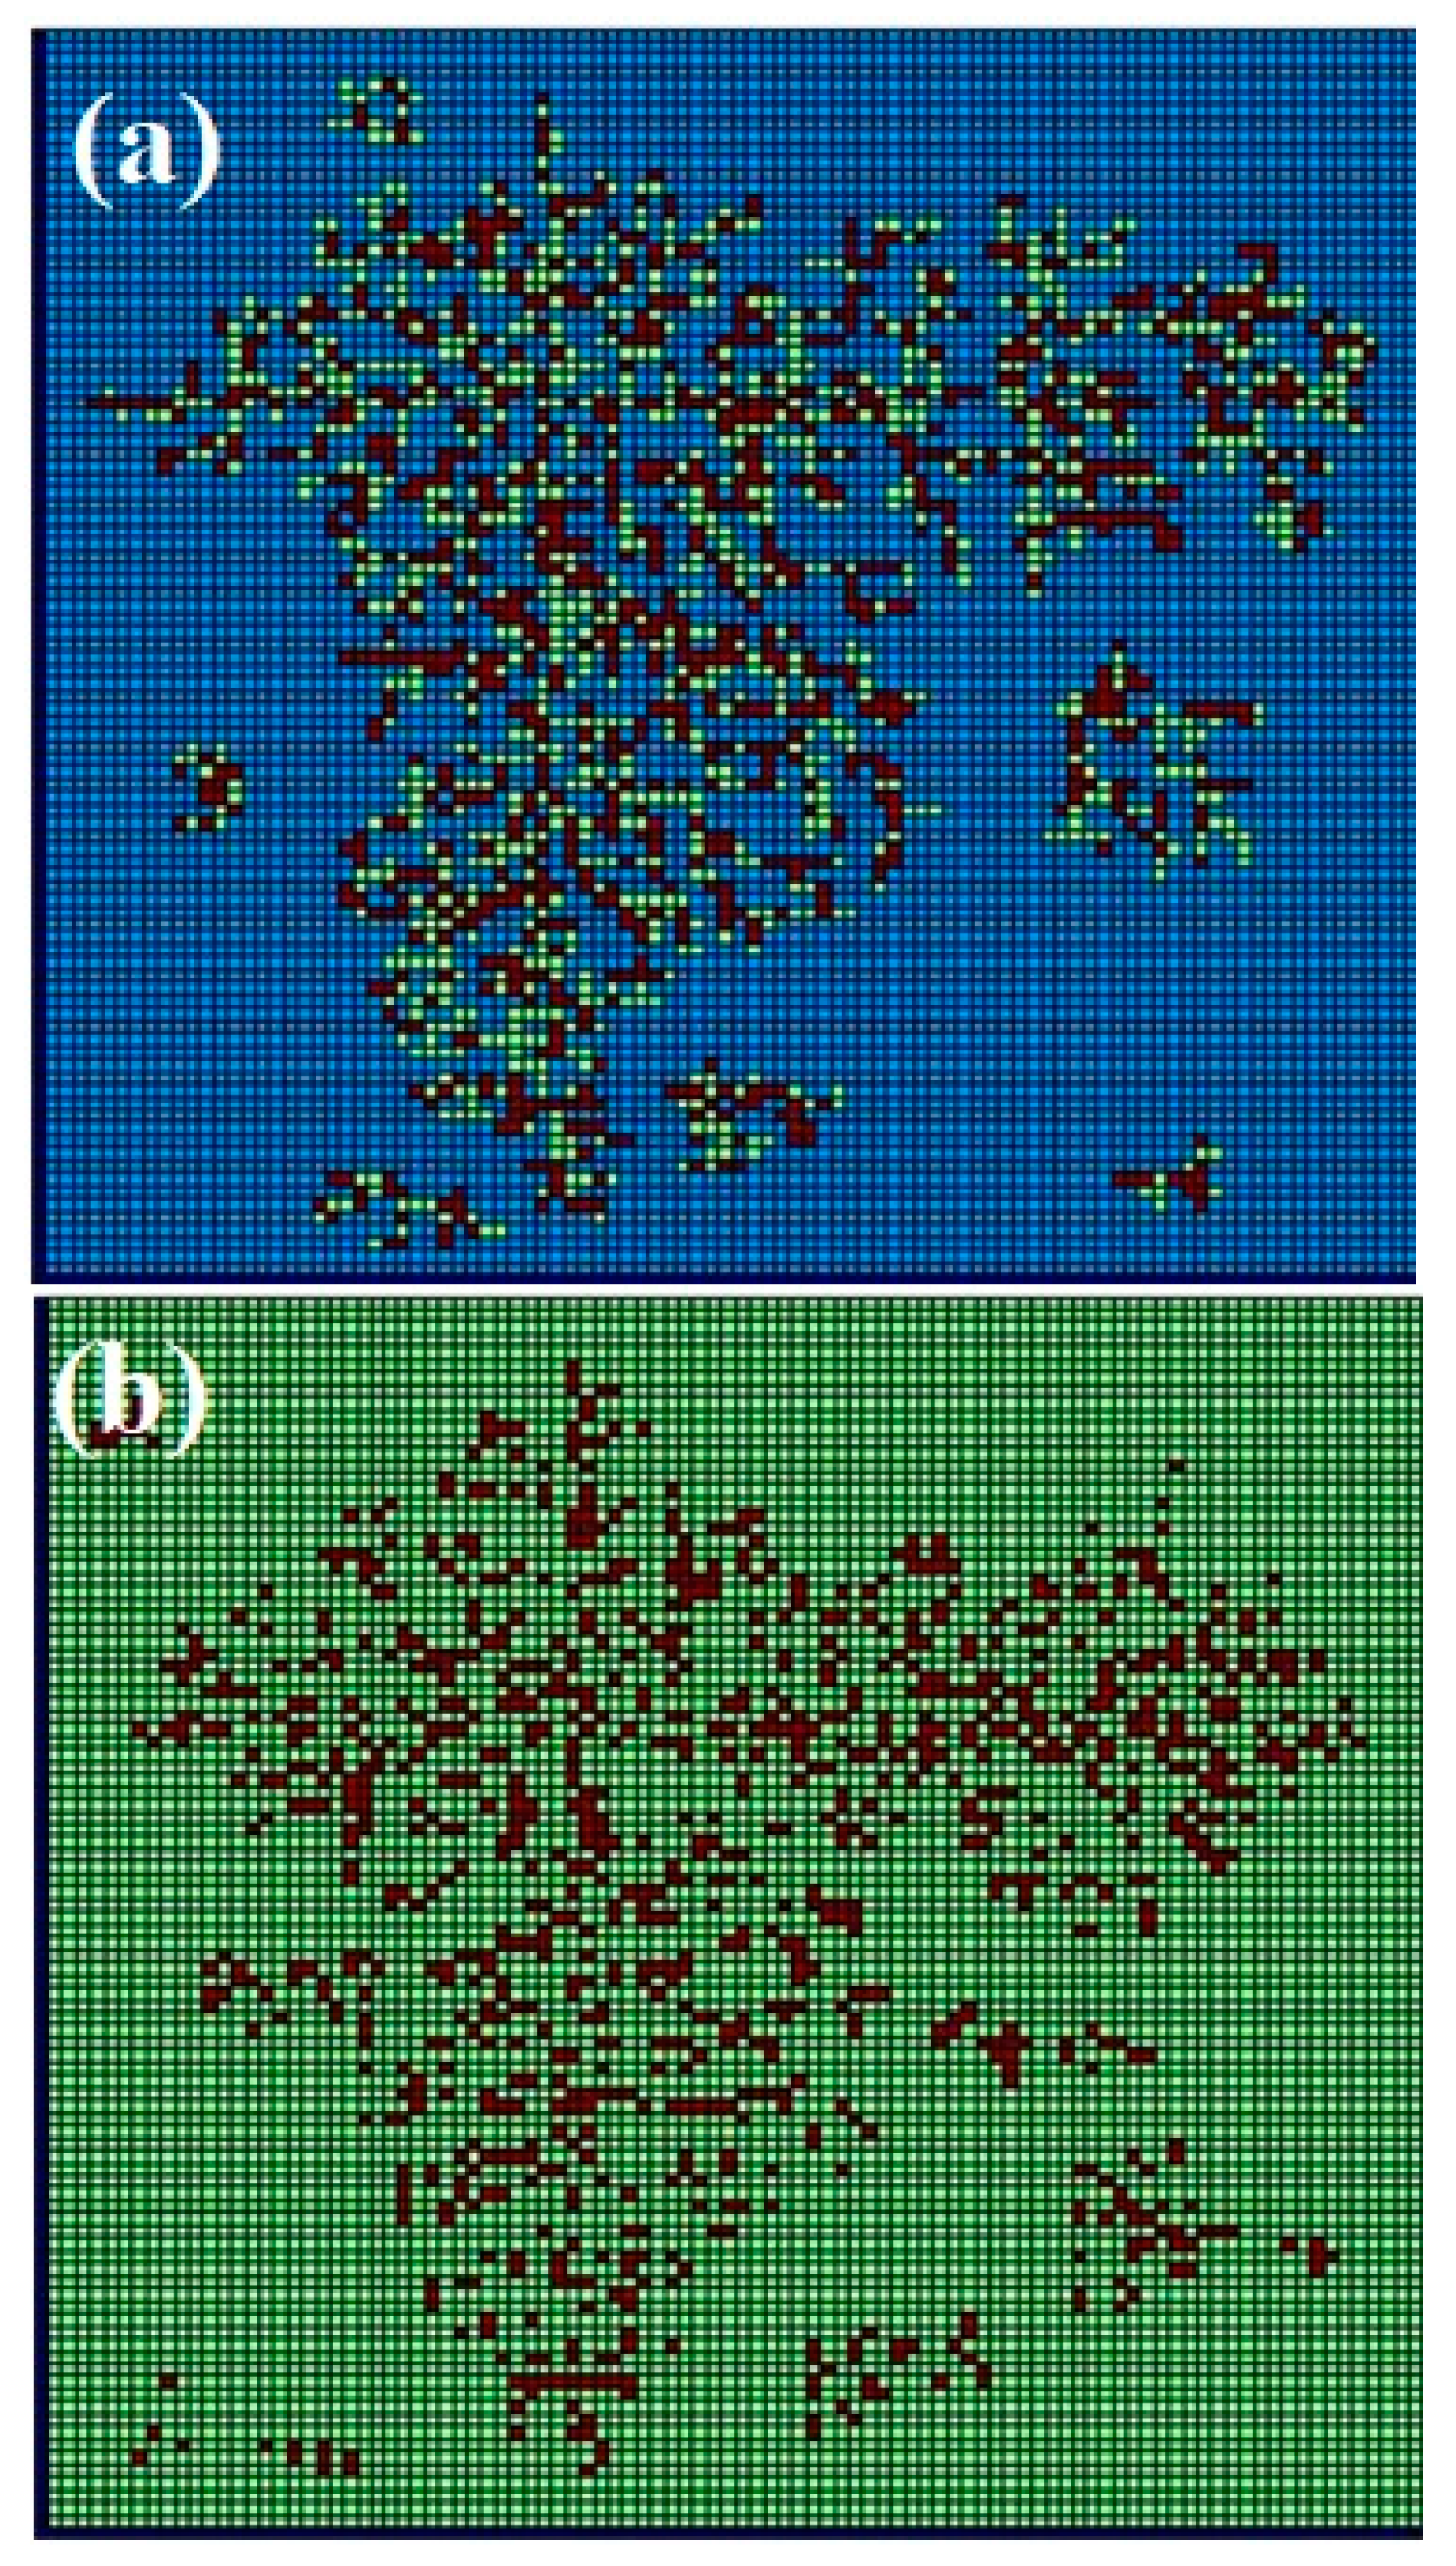
The gas-sensitive properties of the films were tested to NO2 inputs to be varied in the concentration range of 10–200 ppm in ambient air. The NO2 concentration was changed using several cylinders of different concentrations. The experimental setup consisted of a gas block (V = 1 dm3), a data-collection system RL-88AC (an analog–digital and digital–analog converter with the RealLab software), and a gas receiver block [35]. The sensor element was set on the heater inside the gas block. The RL-88AC data-collection system controlled the resistance by a resistance-voltage converter. The sensor can be heated to 350 ± 1 °C.
Gas response (S) vs. NO2 gas is defined as S = (Ra−Rg)/Ra where Rg and Ra are film resistance measured in NO2 and air atmosphere, respectively

2.4. Modeling

Modeling of the formation of branched structures was carried out in the MATLAB software environment. In a computer experiment, a square four-connected lattice of size n × n was used, with n = 100. So, the maximum number of initial particles was 104. The random walk method was utilized to organize the movement of particles when forming clusters. Both the movement of a single particle and the movement of small clusters are provided. The probability of sticking was calculated as shown elsewhere [34]. Each initial particle was labeled as copper-containing or containing only an organic base. The ratio of such particles was chosen based on experimental data. The marking was necessary for the possibility of removing such particles when simulating the thermal annealing process of the material. The mechanisms of diffusion-limited aggregation and cluster–cluster aggregation were used to model the aggregation process.

3. Results and Discussion

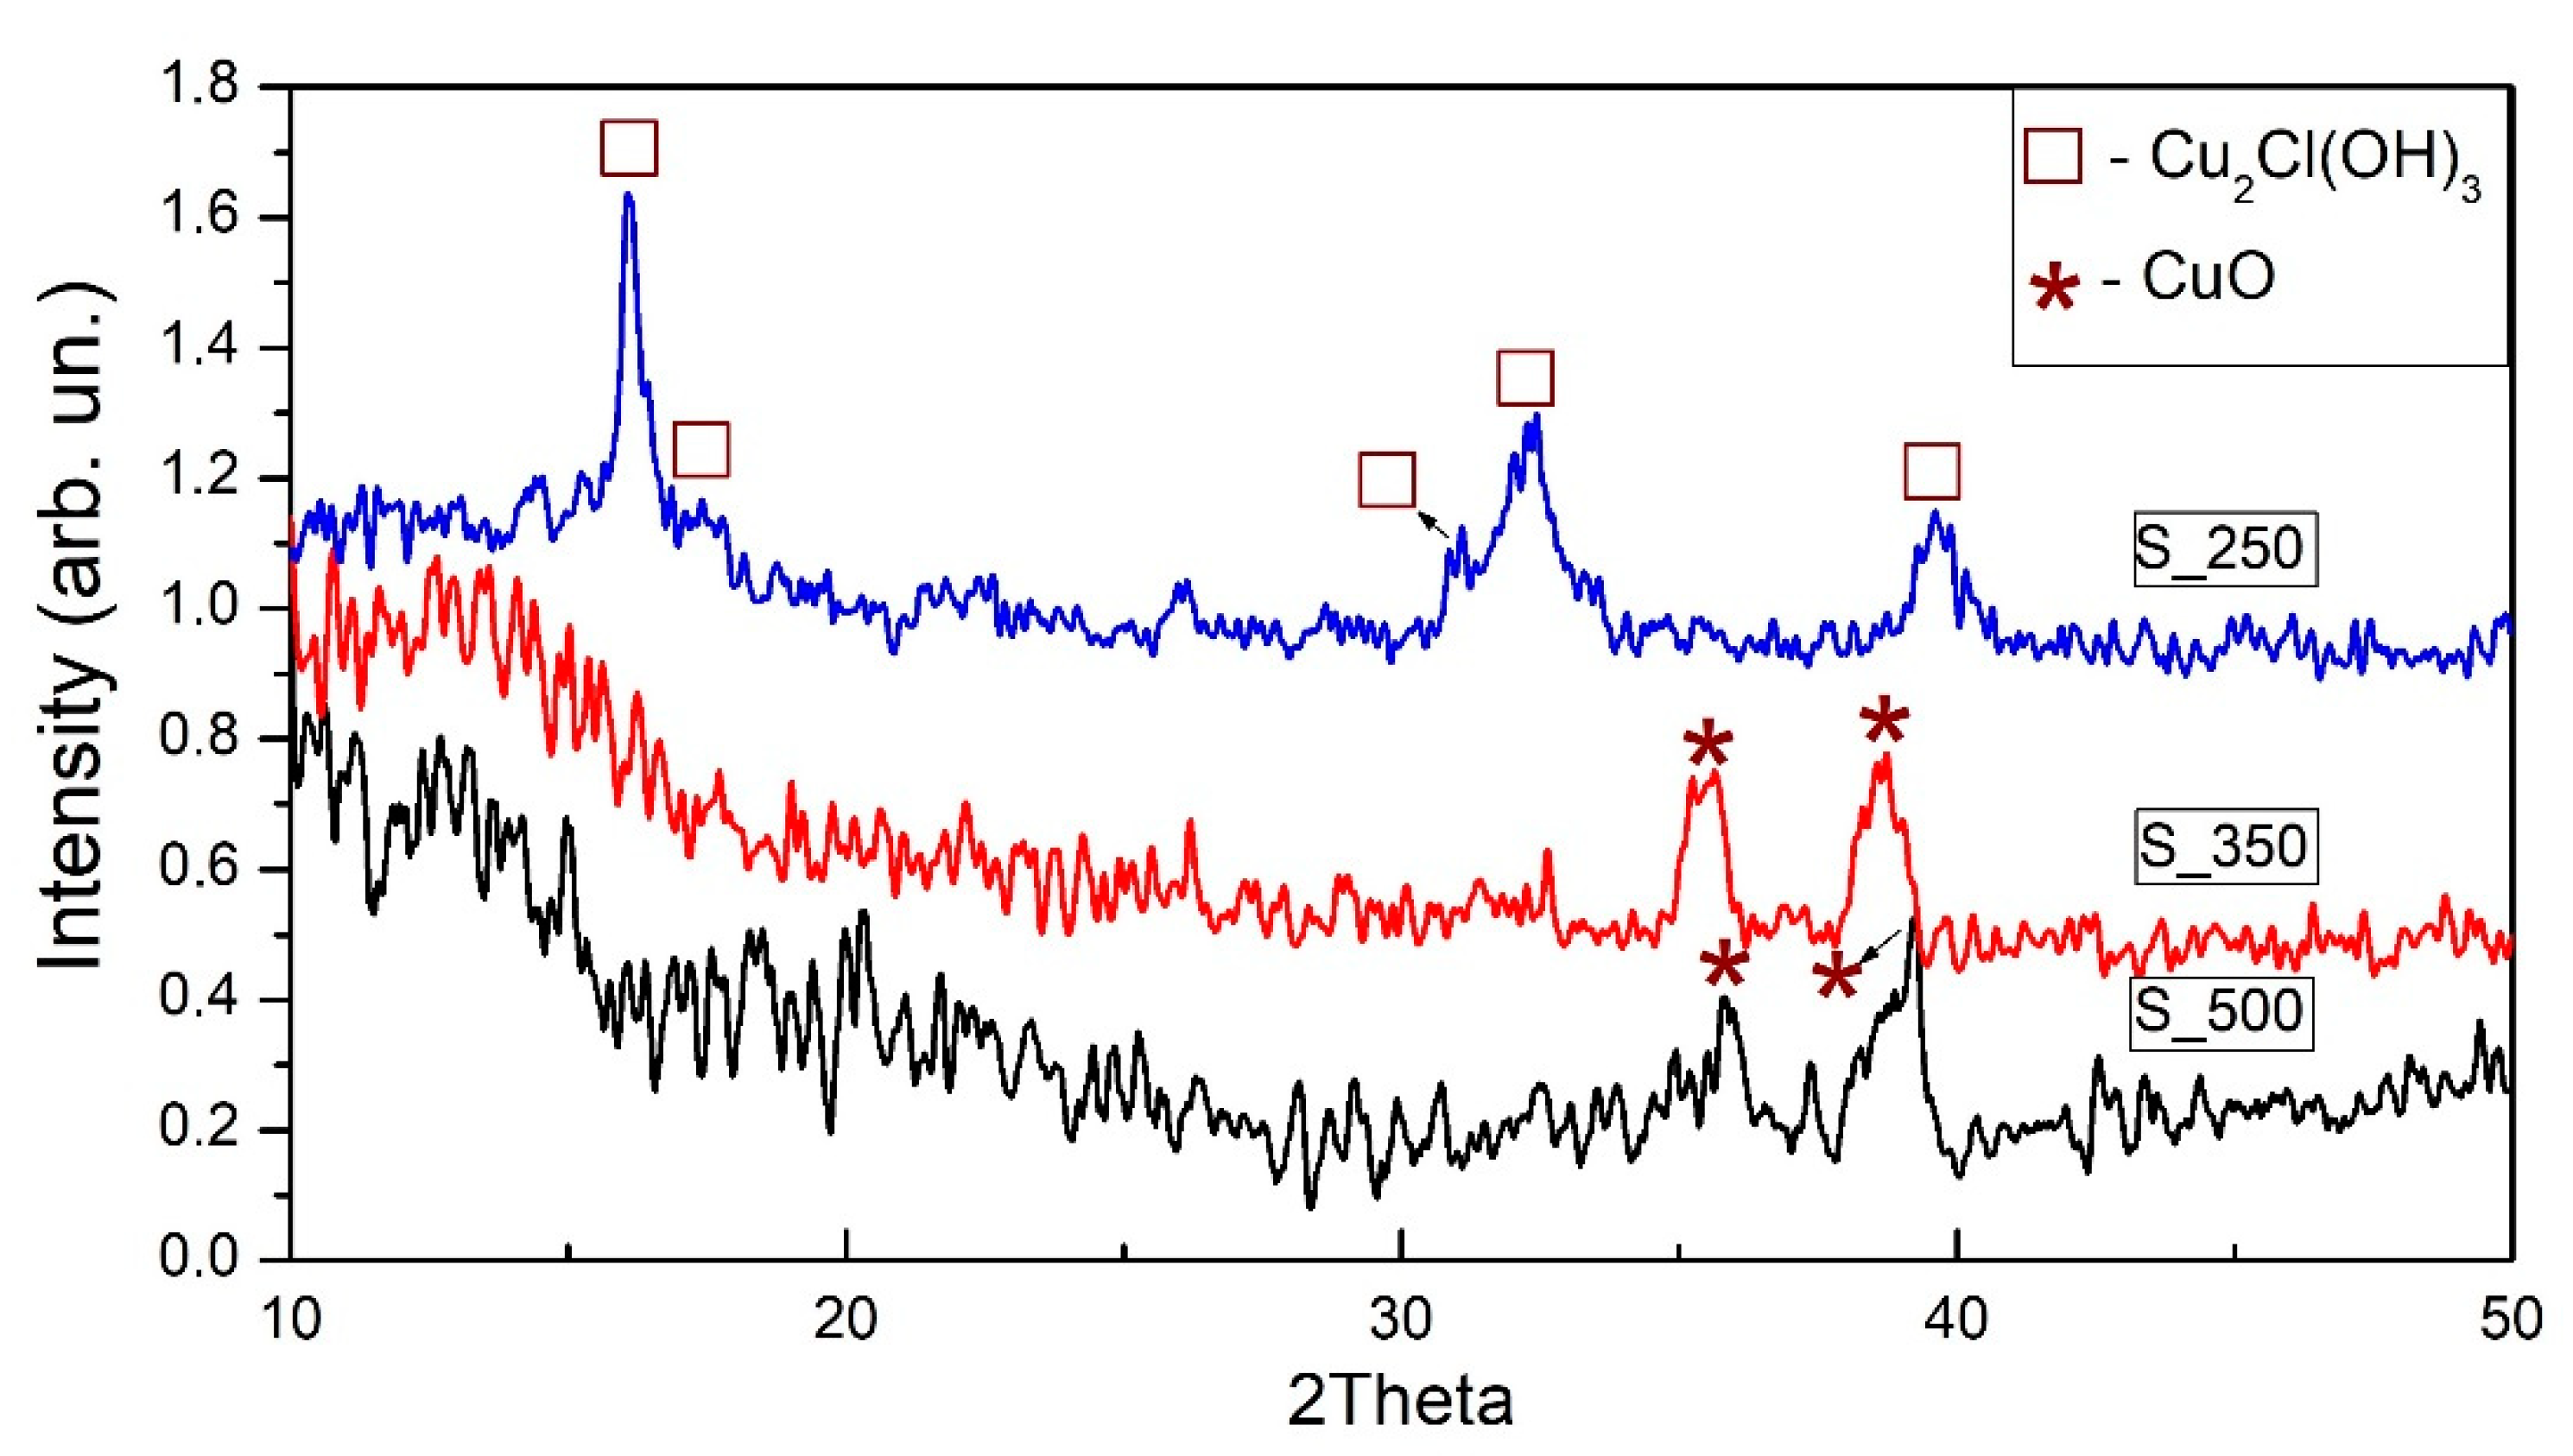
3.1. SEM and XRD Investigations

SEM micrographs reveal the evolution of surface morphology with increasing the annealing temperature (Figure 1). At 250 °C, the growth of fractal structures leads to the formation of percolation clusters that are destroyed at higher temperatures [34]. So, the S_250 sample exhibits the flower-like morphology. The “flowers” are made up of grain agglomerates with size of 400–500 nm. Agglomeration is the result of the high surface energy of particles [36]. As the temperature increases, the “flowers” destroy and the separate crystallites with the sizes ranging from to 100 to 400 nm form on the film surface (Figure 1a–c).
Elsewhere [34], we have already discussed the phase composition of the fabricated films by the XRD and XANEX studies. So, according to the XRD study (Figure 2), we showed the influence of annealing temperature on the evolution of the phase composition. Pattern S_250 differs from others and characterizes by the presence of various forms of Cu2Cl(OH)3, indistinguishable at the present level of resolution: atacamite (PDF 01-78-372), paratacamite (PDF 01-70-821), and clinoatacamite (PDF 01-86-1391). Patterns S_350 and S_500 are similar and correspond to the tenorite CuO phase (PDF 00-48-1548).
XANEX study was in a full agreement with XRD patterns and proved the formation of CuO crystallite at 350 and 500 °C. In addition, it was found that the CuK-edge XANES spectrum of Cu2Cl(OH)3 is closer to the S_250 sample [34].

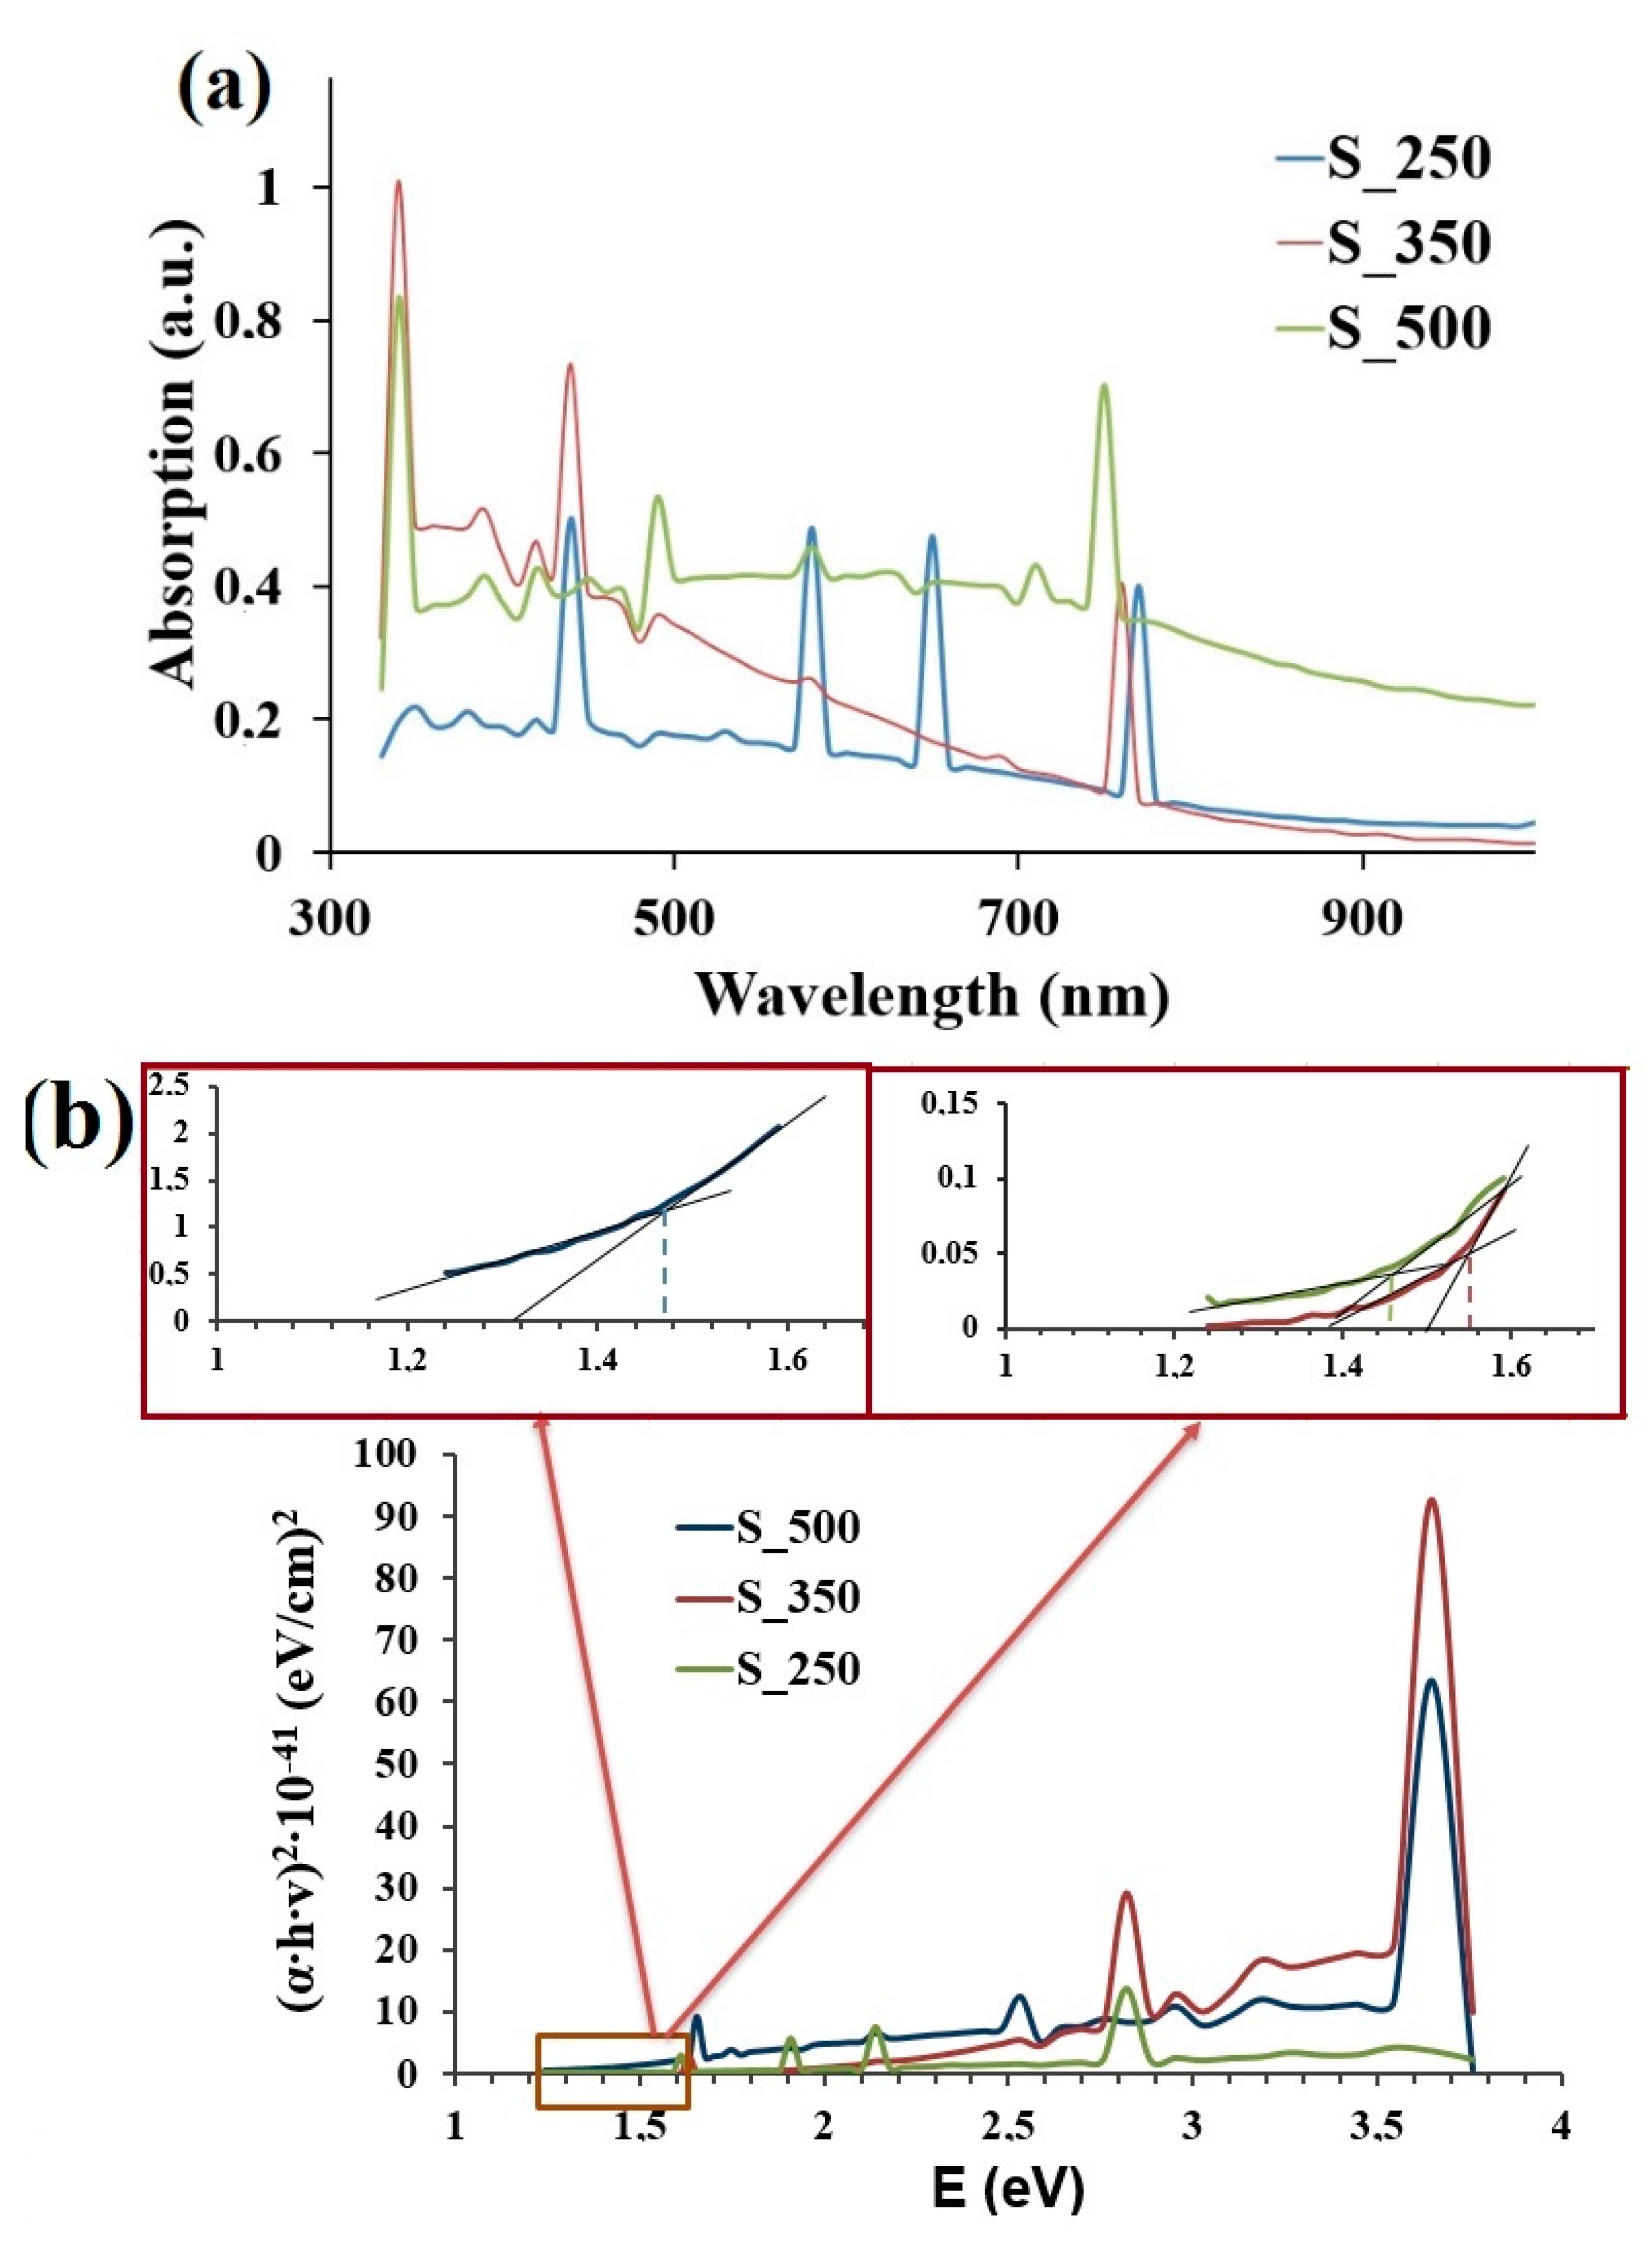
3.2. UV–Visible Studies

Because of the crystallinity and better transparency, the films are suitable for optical analysis from which the coefficient of absorption and energy band gap is also determined. Figure 3a shows the combination of optical absorbance spectra with a large series of peaks for all three samples. It is known that many organic compounds give more than one maximum peak when its UV–VIS spectra are analyzed. So, the presence of multiple peaks corresponds to the electron transitions in the organic matrix of the films.
The functional relationship between αhν and photon energy for the fabricated samples is presented in Figure 3b. The band gap energy value can be obtained by extrapolating the linear portion to the photon energy axis (inset Figure 3b).
Because Tauc plots (Figure 3b) present a large series of peaks at lower energies, estimation of band gap energy was done according to the method described in [37]. So, the linear fit of the fundamental peak is applied. Additionally, a linear fit used as an abscissa is applied for the slope below the fundamental absorption. An intersection of the two fitting lines gives the band gap energy estimation (insets Figure 3b). The direct band gaps of S_250, S_350, and S_500 samples were calculated to be ca. 1.44, 1.55, and 1.47 eV, respectively (Figure 3b). These values are close to the reported values of bulk CuO (1.4 eV) [38] and lower than the CuO films (1.72 eV) deposited by the chemical route and reported in [39]. This fact may be explained by the agglomeration of copper-containing particles during the annealing process.

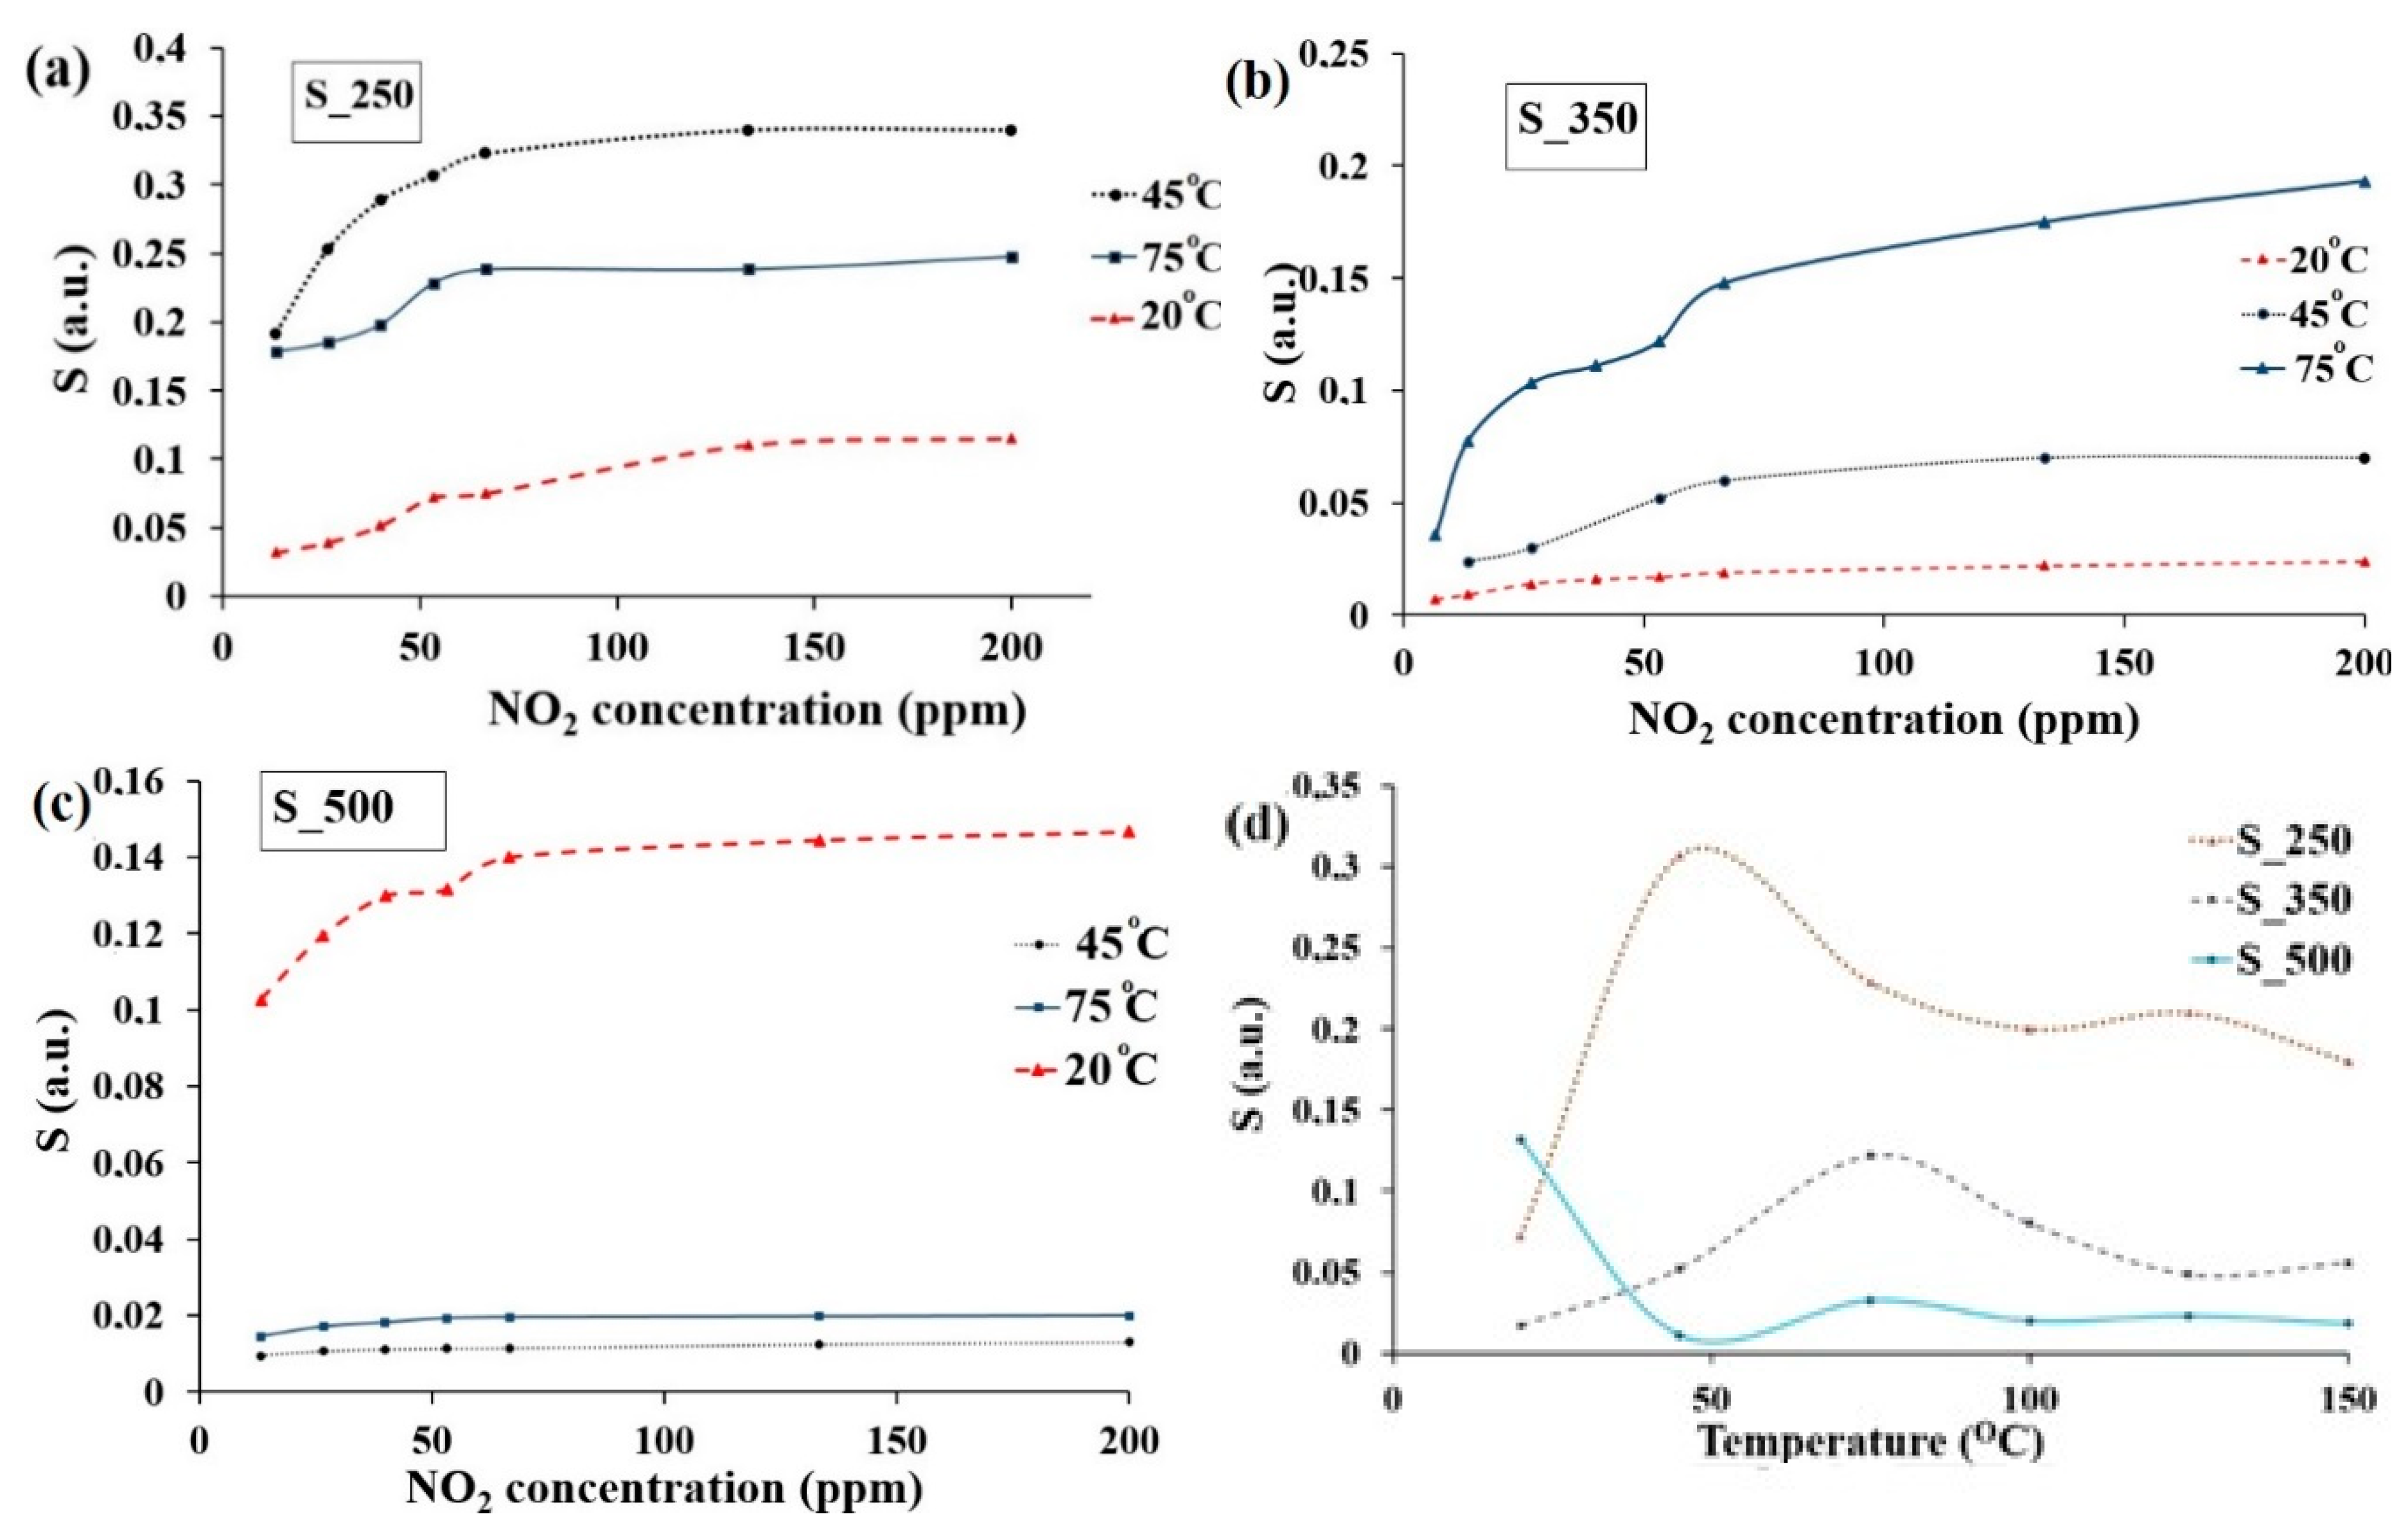
3.3. Gas Sensitivity

The film resistance was decreased under NO2 exposure at different operating temperatures. Gas sensing characteristics of the samples at operating temperatures from 20 to 150 °C are shown in Figure 4a–c. As evident from Figure 4d, a maximum response is observed at 45, 75, and 20 °C for the films, annealed at 250, 350, and 500 ℃, respectively. Comparative studies of sensors response to NO2 gas in the concentration range of 10–200 ppm showed that the sample S_250 has the best response to NO2. However, it may be due to the chemical activity of the transition Cu2Cl (OH)3 phase observed by XRD studies and flower-like morphology with high surface energy. Besides, the presence of OH-group allows the creation of additional adsorption centers as is shown earlier in [40].
Also, we declare the difference in gas sensor response between S_350 and S_500 samples.
The explanation of this fact is related to several competitive processes that influence the response of the material to the target gas. On the one hand, at low temperatures (20 °C), the probability of filling oxygen vacancies with water is higher [41]; a monolayer of water is formed on the surface of the film as a result of chemisorption. As shown in the previous work [40], this phenomenon has a positive effect on NO2 adsorption, according to Equation (3). Equation (4) also holds for S_250 sample which differs in the presence of OH-groups. This effect also occurs for the S_500 sample, which shows maximum sensitivity at 20 °C.
4NO2(g) +3ē +2H2O(ads) +O2 (ads) →4NO2 − OH (ads)
NO2(g) + ē +OH → NO2−OH(ads)
NO2(g) + ē → NO2(ads)
On the other hand, when the temperature increases, the activation energy of chemosorption becomes less and the number of adsorption sites occupied by the adsorbed oxygen increases [13]. As a result, reaction 5 is difficult to proceed, and the number of sites occupied by nitrogen dioxide decreases. This effect can be useful when creating sensors for reducing gases based on CuO-containing materials. Not only the number of active chemosorption sites and the value of the activation energy of the process but also the organization of interaction of these sites must effect the conductivity and gas sensor response of the material. Hierarchically organized structures having a small level of sensor material doping doped with metal oxides exhibit percolation effects of conductivity [42,43,44]. As shown in the SEM images (Figure 1), copper-containing compounds represent branched fractal structures. The influence of thermal degradation on the probability of percolation effect in structures was studied using the model described in [34]. So, it is the structure destruction that can be explained by the decrease in sensitivity of S_500 sample compared to S_350 one. In Figure 5, model representations of the evolution of copper-containing structures at the initial moment (S_350) (Figure 5a) and after the final annealing (S_500) are shown (Figure 5b).
The dependence of the probability of percolation on the degradation of the organic component of the fractal structure is shown in Figure 6. The probability was calculated as the ratio of found cases of percolation pathways to 1000 simulations of the degradation process at a given percentage of the organic base removed. Dependence has an inflection point. The point “40%” corresponding to the annealing temperature of 350 °C is in the area before the inflection, and the percolation effect has a high probability. At 500 °C, all organic base is removed, and the probability of percolation effect is zero. So, we observe a decrease in gas sensitivity. According to our investigation, we assume that the optimal annealing temperature for fabrication enhanced gas-sensitive films by the citrate sol–gel technique is 250 °C.

3.4. Activation Energy and Adsorption Kinetics Study

Adsorption kinetics plays a very important role in devising and developing adsorbent materials for industrial applications. So, understanding the activated chemical adsorption of a gas on sensor surface becomes crucial and such a study will be followed using the Elovich model [14].
q = 1 α l n ( α α ´ ) + 1 α   l n ( t )
where q is the gas amount adsorbed during time t. The ά is the initial adsorption rate constant and α is the constant related to a measure of a potential barrier for successive adsorption. The constants can be obtained from the slope and the intercept of a straight-line plot of Ct-Co vs. ln(t). Co and Ct are the conductances of the films in air and on exposing NO2, respectively.
Such plots are shown in Figure 7 for NO2 adsorption on the surfaces of S_350 and S_250 samples at optimal operating temperatures. The extrapolation was done in Excel software using a trendline. The Figure 7 reveals the linear plot in the interval from ln2 to ln4.5 that confirms the validity of the Elovich model (Equation (6)). Elovich model deals with multilayer adsorption, based on a kinetic principle that adsorption sites increase exponentially with adsorption [45]. So, at the initial time, the adsorption seems to be monomolecular. This is a reason why below ln(t)≈ 2 data plots are not on the fitting line.
Constant α is responsible for a measure of the extent to which the surface has been screened by the potential barrier for successive adsorption. From Table 1 it is evident that in comparison with S_350 sample, α constant of S_250 sample is less that favored the adsorption on Cu2Cl(OH)3 particles. This fact is in agreement with experimental data (Figure 4d). The constant á depends on the activation energy and is regarded as the initial adsorption rate [14]. We see that á values for the S_250 sample are close and almost independent of concentration. The adsorption rate of the S_350 sample increases with concentration from 3.98·10−9 to 6.04·10−8 (Figure 7)
The surface reactivity depends on the activation energy, which provides the availability of free energy for promoting surface reactions.
The plots of ln(S) vs. 1/T (the linearized form of the Arrhenius-like equation 7 [46]) are used to determine activation energies [47] for S_250 and S_350 samples exposed to 53 ppm of NO2 (Figure 8) by:
S = e x p ( E a k b T )
We observe a sudden change in the slope of the Arrhenius-like plots above 75 and 45 °C for S_350 and S_250 samples, respectively. The data for the investigated samples cannot be plotted as a single activated process. So, activation energy decreases from 30 to 9 kJ/mol and from 252 kJ/mol to 80 kJ/mol when the operating temperature increases, for S_350 and S_250 sample, respectively. Accordingly, the observed change in the activation energy can be ascribed to the high surface energy at low temperatures (˂75 °C) [48]. This type of dependence is consistent with the arguments presented above about several competitive processes that occur when gas is adsorbed to the film surface. The minimum point (optimal operating temperature) corresponds to the most favorable ratio of energy parameters of the NO2 adsorption to the surface sites (oxygen vacancies) of the CuO structure, also containing adsorbed water.

4. Conclusions

We reported on the copper-containing thin films that were synthesized via citrate sol–gel method using ethylene glycol as a dispersing agent. The films were annealed at 250, 350, and 500 °C. Effect on annealing and operating temperatures on the gas sensor response towards NO2 gas was studied. We observe the best response towards NO2 gas by S_250 sample due to the presence of Cu2Cl(OH)3 phase and flower-like morphology. The phenomenon of higher gas sensitivity of S_350 compared to the S_500 sample was declared. We explained this fact by percolation in the films annealed at 350 °C. During a kinetic study, we showed that the NO2 adsorption on the surface of the fabricated films is described by the Elovich equation.
So, we conclude that the optimal temperature for manufacturing CuO-films sensitive to NO2 gas by citrate sol–gel route is 250 °C when Cu2Cl(OH)3 phase is formed. The stability of such sensors requires additional research.

Author Contributions

Conceptualization, T.N.M.; methodology, T.N.M. and N.K.P.; software, T.N.M. and N.K.P.; validation, N.K.P.; formal analysis, T.N.M. and N.K.P.; investigation, T.N.M. N.K.P., and T.A.M.; resources, N.K.P.; data curation, T.N.M. and N.K.P.; writing—original draft preparation, T.N.M.; writing—review and editing, T.N.M. and T.A.M.; visualization, T.A.M.; supervision, N.K.P.; project administration, N.K.P.; funding acquisition, N.K.P. All authors have read and agreed to the published version of the manuscript.

Funding

The research was carried out with the financial support of the Ministry of science and higher education of the Russian Federation in the framework of the state task in the field of scientific activity No. 0852-2020-0015.

Acknowledgments

We thank the Institute for Nanometre Optics and Technology (HZB, Berlin, Germany) for the opportunity provided for SEM measurements.

Conflicts of Interest

The authors declare no conflict of interest.

References

  1. Sholehah, A.; Faroz, D.F.; Huda, N.; Utari, L.; Septiani, N.L.W.; Yuliarto, B. Synthesis of ZnO Flakes on flexible substrate and its application on ethylene sensing at room temperature. Chemosensors 2020, 8, 2. [Google Scholar] [CrossRef] [Green Version]
  2. Galstyan, V.; Comini, E.; Ponzoni, A.; Sberveglieri, V.; Sberveglieri, G. ZnO Quasi-1D nanostructures: Synthesis, modeling, and properties for applications in conductometric chemical sensors. Chemosensors 2016, 4, 6. [Google Scholar] [CrossRef]
  3. Myasoedova, T.N.; Grigoryev, M.N.; Plugotarenko, N.K.; Mikhailova, T.S. Fabrication of gas-sensor chips based on silicon-carbon films obtained by electrochemical deposition. Chemosensors 2019, 7, 52. [Google Scholar] [CrossRef] [Green Version]
  4. Wang, F.; Li, H.; Yuan, Z.; Sun, Y.; Chang, F.; Deng, H.; Xie, L.; Li, H. A highly sensitive gas sensor based on CuO nanoparticles synthesized via a sol-gel method. RSC Adv. 2016, 6, 79343–79349. [Google Scholar] [CrossRef]
  5. Zhu, Z.; Zeng, W.; Cao, S.; Chen, L. Gas sensing property of novel flower-like nanostructure CuO. J. Mater. Sci. Mater. Electron. 2015, 26, 9037–9043. [Google Scholar] [CrossRef]
  6. Kim, H.-J.; Lee, J.-H. Highly sensitive and selective gas sensors using p-type oxide semiconductors: Overview. Sens. Actuators B Chem. 2014, 192, 607–627. [Google Scholar] [CrossRef]
  7. Zoolfakar, A.S.; Rani, R.A.; Morfa, A.J.; O’Mullane, A.P.; Kalantar-zadeh, K. Nanostructured copper oxide semiconductors: A perspective on materials, synthesis methods and applications. J. Mater. Chem. C 2014, 2, 5247–5270. [Google Scholar] [CrossRef] [Green Version]
  8. Oosthuizen, D.N.; Motaung, D.E.; Swart, H.C. In depth study on the notable room-temperature NO2 gas sensor based on CuO nanoplatelets prepared by sonochemical method: Comparison of various bases. Sens. Actuators B Chem. 2018, 266, 761–772. [Google Scholar] [CrossRef]
  9. Oosthuizen, D.N.; Motaung, D.E.; Swart, H.C. Selective detection of CO at room temperature with CuO nanoplatelets sensor for indoor air quality monitoring manifested by crystallinity. Appl. Surf. Sci. 2019, 466, 545–553. [Google Scholar] [CrossRef]
  10. Navale, Y.H.; Navale, S.T.; Galluzzi, M.; Stadler, F.J.; Debnath, A.K.; Ramgir, N.S.; Gadkari, S.C.; Gupta, S.K.; Aswal, D.K.; Patil, V.B. Rapid synthesis strategy of CuO nanocubes for sensitive and selective detection of NO2. J. Alloy. Compd. 2017, 708, 456–463. [Google Scholar] [CrossRef]
  11. Volanti, D.P.; Felix, A.A.; Orlandi, M.O.; Whitfield, G.; Yang, D.-J.; Longo, E.; Tuller, H.L.; Varela, J.A. The role of hierarchical morphologies in the superior gas sensing performance of CuO-based chemiresistors. Adv. Funct. Mater. 2013, 23, 1759–1766. [Google Scholar] [CrossRef]
  12. Sendi, A.; Besnard, G.; Menini, P.; Talhi, C.; Blanc, F.; Franc, B. Sub-ppm nitrogen dioxide (NO2) sensor based on inkjet printed CuO on microhotplate with a pulsed temperature modulation. In Proceedings of the Third International Conference on Advances in Sensors, Actuators, Metering and Sensing (ALLSENSORS 2018), Italy, Rome, 25–29 March 2018. [Google Scholar]
  13. Oosthuizen, D.N.; Korditis, I.; Swart, H.C.; Motaung, D.E. Facile control of room temperature nitrogen dioxide gas selectivity induced by copper oxide nanoplatelets. J. Colloid Interface Sci. 2020, 560, 755–768. [Google Scholar] [CrossRef]
  14. Das, A.; Venkataramana, B.; Partheephan, D.; Prasad, A.K.; Dgara, S.; Tyagi, A.K. Facile synthesis of nanostructured CuO for low temperature NO2 sensing. Phys. E Low Dimens. Syst. Nanostruct. 2013, 54, 40–44. [Google Scholar] [CrossRef]
  15. Myasoedova, T.N.; Yalovega, G.E.; Shmatko, V.A.; Funik, A.O.; Petrov, V.V. SiO2CuOx films for nitrogen dioxide detection: Correlation between technological conditions and properties. Sens. Actuators B Chem. 2016, 230, 167–175. [Google Scholar] [CrossRef]
  16. Yang, M.; He, J. Tailoring the structure of metal oxide nanostructures towards enhanced sensing properties for environmental applications. J. Colloid Interface Sci. 2012, 368, 41–48. [Google Scholar] [CrossRef]
  17. Singh, S.; Yadav, B.C.; Prakash, R.; Bajaj, B.; Lee, J.R. Synthesis of nanorods and mixed shaped copper ferrite and their applications as liquefied petroleum gas sensor. J. Appl. Surf. Sci. 2011, 257, 10763–10770. [Google Scholar] [CrossRef]
  18. Shmatko, V.A.; Yalovega, G.E.; Myasoedova, T.N.; Brzhezinskaya, M.M.; Shtehkin, I.E.; Petrov, V.V. Influence of the surface morphology and structure on the gas-sorption properties of SiO2CuOx nanocomposite materials: X-ray spectroscopy investigations. Phys. Solid State 2015, 57, 399–406. [Google Scholar] [CrossRef]
  19. Kuo, C.-H.; Chen, C.-H.; Huang, M.H. Seed-mediated synthesis of monodispersed Cu2O nanocubes with five different size ranges from 40 to 420 nm. Adv. Funct. Mater. 2007, 17, 3773–3780. [Google Scholar] [CrossRef]
  20. Zhang, Y.; He, X.; Li, J.; Zhang, H.; Gao, X. Gas-sensing properties of hollow and hierarchical copper oxide microspheres. Sens. Actuators B Chem. 2007, 128, 293–298. [Google Scholar] [CrossRef]
  21. Etefagh, R.; Azhir, E.; Shahtahmasebi, N. Synthesis of CuO nanoparticles and fabrication of nanostructural layer biosensors for detecting Aspergillus niger fungi. Sci. Iran. F 2013, 20, 1055–1058. [Google Scholar]
  22. Vaseem, M.; Umar, A.; Hahn, Y.B.; Kim, D.H.; Lee, K.S.; Jang, J.S.; Lee, J.S. Flower-shaped CuO nanostructures: Structural, photocatalytic and XANES studies. Catal. Commun. 2008, 10, 11–16. [Google Scholar] [CrossRef]
  23. Li, L.; Nan, C.; Peng, Q.; Li, Y. Selective synthesis of Cu2O nanocrystals as shape-dependent catalysts for oxidative arylation of phenylacetylene. Chem. Eur. J. 2012, 18, 10491–10496. [Google Scholar] [CrossRef] [PubMed]
  24. Zhu, G.; Xu, H.; Xiao, Y.; Liu, Y.; Yuan, A.; Shen, X. Facile fabrication and enhanced sensing properties of hierarchically porous CuO architectures. ACS Appl. Mater. Interfaces 2012, 4, 744–751. [Google Scholar] [CrossRef]
  25. Li, D.; Tang, Y.; Ao, D.; Xiang, X.; Wang, S.; Zu, H. Ultra-highly sensitive and selective H2S gas sensor based on CuO with sub-ppb detection limit. Int. J. Hydrog. Energy 2019, 44, 3985–3992. [Google Scholar] [CrossRef]
  26. Li, D.; Zu, X.; Ao, D.; Tang, Q.; Fu, Y.; Guo, Y.; Bilawal, K.; Faheem, M.B.; Li, L.; Li, S.; et al. High humidity enhanced surface acoustic wave (SAW) H2S sensors based on sol–gel CuO films. Sens. Actuators B Chem. 2019, 294, 55–61. [Google Scholar] [CrossRef]
  27. Poloju, M.; Jayababu, N.; Reddy, M.V.R. Improved gas sensing performance of Al doped ZnO/CuO nanocomposite based ammonia gas sensor. Mater. Sci. Eng. B 2018, 227, 61–67. [Google Scholar] [CrossRef]
  28. Xu, H.; Zhu, Z.; Chen, C.; Wen, T.; Zhao, X.; Xie, L. Highly sensitive H2S gas sensors based on Pd-doped CuO nanoflowers with low operating temperature. Sens. Actuators B Chem. 2017, 253, 809–817. [Google Scholar]
  29. Deiminiat, B.; Razavipanah, I.; Rounaghi, G.H.; Arbab-Zavar, M.H. A novel electrochemical imprinted sensor for acetylsalicylic acid based on polypyrrole, sol-gel and SiO2@Au core-shell nanoparticles. Sens. Actuators B Chem. 2017, 244, 785–795. [Google Scholar] [CrossRef]
  30. Mahendraprabhu, K.; Sgarma, A.S.; Elomalai, P. CO sensing performances of YSZ-based sensor attached with sol-gel derived ZnO nanospheres. Sens. Actuators B Chem. 2019, 283, 842–847. [Google Scholar] [CrossRef]
  31. Ding, H.; Ma, J.; Yue, F.; Gao, P.; Jia, X. Size and morphology dependent gas-sensing selectivity towards acetone vapor based on controlled hematite nano/microstructure (0D to 3D). J. Solid State Chem. 2019, 276, 30–36. [Google Scholar] [CrossRef]
  32. Choi, J.-M.; Byun, J.-H.; Kim, S.S. Influence of grain size on gas-sensing properties of chemiresistive p-type NiO nanofibers. Sens. Actuators B Chem. 2016, 227, 149–156. [Google Scholar] [CrossRef]
  33. Myasoedova, T.N.; Yalovega, G.E.; Plugotarenko, N.K.; Brzhezinskaya, M.M.; Petrov, V.V.; Moiseeva, T.A.; Shmatko, V.A. CuOX Films for NO2 Detection: Microstructural Characterization. Appl. Mech. Mater. 2013, 481, 133–136. [Google Scholar] [CrossRef]
  34. Yalovega, G.; Myasoedova, T.; Funik, A.; Plugotarenko, N.; Brzhezinskaya, M.; Bahmatskaya, A. Mechanism of the formation of copper-containing fractal-like crystallites in metal-organic thin films: Shape simulation and XANES analysis. Phys. Status Solidi 2016, 253, 2217–2224. [Google Scholar] [CrossRef]
  35. Petrov, V.V.; Nazarova, T.N.; Korolev, A.N.; Kopilova, N.F. Thin sol–gel SiO2–SnOx–AgOy films for low temperature ammonia gas sensor. Sens. Actuators B Chem. 2008, 133, 291–295. [Google Scholar] [CrossRef]
  36. Dhineshbabu, N.R.; Rajendran, V.; Nithyavathy, N.; Vetumperumal, R. Study of structural and optical properties of cupric oxide nanoparticles. Appl. Nanosci. 2015, 6, 933–939. [Google Scholar] [CrossRef] [Green Version]
  37. Makuła, P.; Pacia, M.; Macyk, W. How to correctly determine the band gap energy of modified semiconductor photocatalysts based on UV–Vis spectra. J. Phys. Chem. Lett. 2018, 9, 6814–6817. [Google Scholar]
  38. Ghijsen, J.; Tjeng, L.H.; Van Elp, J.; Eskes, H.; Westerink, J.; Sawatzky, G.A.; Czyzyk, M.T. Electronic structure of Cu2O and CuO. Phys. Rev. B 1988, 38, 11322–11330. [Google Scholar] [CrossRef]
  39. Johan, M.R.; Suan, M.S.M.; Havari, N.L.; Ching, H.A. Annealing effects on the properties of copper oxide thin films prepared by chemical deposition. Int. J. Electrochem. Sci. 2011, 6, 6094–6104. [Google Scholar]
  40. Myasoedova, T.N.; Mikhailova, T.S.; Yalovega, G.E.; Plugotarenko, N.K. Resistive low-temperature sensor based on the SiO2ZrO2 film for detection of high concentrations of NO2 gas. Chemosensors 2018, 6, 67. [Google Scholar] [CrossRef] [Green Version]
  41. Staerz, A.; Berthold, C.; Russ, T.; Wicker, S.; Weimar, U.; Barsan, N. The oxidizing effect of humidity on WO3 based sensors. Sens. Actuators B Chem. 2016, 237, 54–58. [Google Scholar] [CrossRef]
  42. Thong, L.V.; Hoa, N.D.; Le, D.T.T.; Viet, D.T.; Tam, P.D.; Le, A.-T.; Hieu, N.V. On-chip fabrication of SnO2-nanowire gas sensor: The effect of growth time on sensor performance. Sens. Actuators B Chem. 2010, 146, 361–367. [Google Scholar] [CrossRef]
  43. Calheiro, D.S.; Bianchi, R.F. Tuning the detection limit in hybrid organic-inorganic materials for improving electrical performance of sensing devices. Sens. Actuators B Phys. 2019, 298, 111480. [Google Scholar] [CrossRef]
  44. Gerasimov, G.N.; Gromov, V.F.; Ilegbusi, O.J.; Trakhtenberg, T.I. The mechanisms of sensory phenomena in binary metal-oxide nanocomposites. Sens. Actuators B Chem. 2017, 240, 613–624. [Google Scholar] [CrossRef]
  45. Hanbali, M.; Holail, H.; Hammud, H. Remediation of lead by pretreated red algae: Adsorption isotherm, kinetic, column modeling and simulation studies. Green Chem. Lett. Rev. 2014, 7, 342–358. [Google Scholar] [CrossRef]
  46. Baik, J.M.; Zielke, M.; Kim, M.H.; Turner, K.L.; Wodtke, A.M.; Moskovits, M. Tin-oxide-nanowire-based electronic nose using heterogeneous catalysis as a functionalization strategy. ACS Nano 2010, 4, 3117–3122. [Google Scholar] [CrossRef] [Green Version]
  47. Tongpool, R.; Yoriya, S. Kinetics of nitrogen dioxide exposure in lead phthalocyanine sensors. Thin Solid Film. 2005, 477, 148–152. [Google Scholar] [CrossRef]
  48. Das, A.; Bonu, V.; Prasad, A.K.; Panda, D.; Dhara, S.; Tyagi, A.K. The role of SnO2 quantum dots in improved CH4 sensing at low temperature. J. Mater. Chem. C 2014, 2, 164–171. [Google Scholar] [CrossRef]
Figure 1. SEM micrographs copper-containing films annealed at (a) 250, (b) 350, and (c) 500 °C.
Chemosensors 08 00079 g001aChemosensors 08 00079 g001b
Figure 2. XRD patterns of the films annealed at different temperatures.
Chemosensors 08 00079 g002
Figure 3. Optical properties of the films: (a) UV–VIS absorption spectra and (b) Tauc plot of direct transitions.
Chemosensors 08 00079 g003
Figure 4. Dependences of sensor response on NO2 concentration at different operating temperatures: (a) S_250 sample, (b) S_350 sample, (c) S_500 sample, (d) dependences of sensor response on operating temperature (NO2 concentration = 53 ppm).
Chemosensors 08 00079 g004
Figure 5. Model representations of the evolution of copper-containing structures: (a) S_350 and (b) S_500 (red—copper-containing particles, green—organic matrix, blue—background).
Chemosensors 08 00079 g005
Figure 6. Dependence of percolation probability on the degradation of organic matter of fractal structure.
Chemosensors 08 00079 g006
Figure 7. Elovich plot for NO2 adsorption on the surfaces of the S_250 (a) and S_350 (b) samples at 45 °C. The insets indicate the typical dynamic of sensor response to 53 ppm of NO2 gas.
Chemosensors 08 00079 g007
Figure 8. Ln(S) vs. 1/T plots are used to determine the activation energy.
Chemosensors 08 00079 g008
Table 1. Values of constants from the Elovich plot.
SampleNO2 Concentration, ppmα, Ωά
S_250400.76·1092.39·10−9
530.67·1091.38·10−9
660.63·1092.04·10−9
S_350400.25·10103.98·10−9
530.23·10106.02·10−8
660.25·10106.04·10−8

