Article

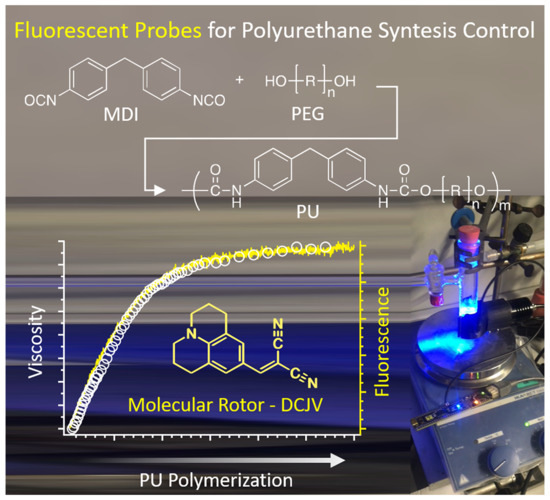
Molecular Rotors with Aggregation-Induced Emission (AIE) as Fluorescent Probes for the Control of Polyurethane Synthesis

1
Department of Chemistry and Industrial Chemistry, University of Pisa, Via Moruzzi 13, 56124 Pisa, Italy
2
Center for Micro-BioRobotics @SSSA Istituto Italiano di Tecnologia Viale Rinaldo Piaggio 34, 56025 Pontedera, Italy
*
Author to whom correspondence should be addressed.
Submission received: 29 November 2020 / Revised: 19 December 2020 / Accepted: 22 December 2020 / Published: 23 December 2020
(This article belongs to the Special Issue Organic Fluorescent Materials as Chemical Sensors)

Abstract

:
In this work, the use of fluorescent molecular rotors such as 9-(2,2-dicyanovinyl)julolidine (DCVJ) and 2,3-bis(4-(phenyl(4-(1,2,2-triphenylvinyl) phenyl)amino)phenyl)fumaronitrile (TPETPAFN) was proposed for the real-time monitoring of polyurethane (PU) formation in a solution of dimethylacetamide starting with 4,4′-methylenediphenyl diisocyanate (MDI) and different polyethylene glycols (PEG400 and PEG600) as diols. Notably, relative viscosity variations were compared with fluorescence changes, recorded as a function of the polymerization progress. The agreement between these two parameters suggested the innovative use of a low-cost fluorescence detection system based on a LED/photodiode assembly directly mountable on the reaction apparatus. The general validity of the proposed experiments enabled the monitoring of polyurethane polymerization and suggested its effective applications to a variety of industrial polymers, showing viscosity enhancement during polymerization.

Graphical Abstract

1. Introduction

Global demand for polyurethanes (PUs) is continuously growing, representing one of the main markets of polymeric materials. Indeed, PUs are employed for producing materials in different forms (adhesive, foams, elastomers, and so on), finding applications not only in the automotive sector but in the construction sector as well. Global demand for rigid PU foams, which is used primarily as an insulation material for construction and refrigeration and freezer applications, is expected to reach 5844.3 thousand tons by 2020, growing at a compound annual growth rate (CAGR) of 5.2% from 2013 to 2020 [1]. In 2013, the global bio-PU market comprised 1634 tons vs. 4074 thousand tons of rigid PU foam, with construction being the largest end-user, accounting for 35% of the total volume (572 tons) [2]. In 2014, the market size for global adhesives was 9390 thousand tons, with 27% of the overall demand being for the construction sector [3]. Adhesives in construction are used mainly in ceramic tiles, concrete, pipe cement, countertop lamination, flooring underlayment, drywall lamination, HVAC, prefinished panels, roofing, and wall coverings. The shift towards green methods of manufacturing eco-friendly PU foams and the increasing construction of green buildings, coupled with a growing consumer preference towards eco-friendly construction materials such as foams and coatings, adhesives, sealants, and elastomers (CASE), is expected to strongly increase PU’s market penetration. Considering the diverse features of PU provided by different experimental conditions (e.g., nature of the reagents and their stoichiometry), rigorous control of the polymerization parameters is crucial to obtain high-quality products and high production rates in safe conditions. Control of the polymerization process occurs by monitoring the reaction extent using parameters related to the molecular weight such as viscosity and light diffusion or infrared spectroscopy, taking advantage of the quantitative estimation of the formed urethane linkages [4,5]. This latter method previously allowed the development of the real-time monitoring of reaction progress using optical fibers and without the need for product sampling [6]. Fluorescence was also used to determine the progress of the polymerization rate of PU due to the high sensitivity of the technique, which allows the use of small amounts of inert fluorescent probes dissolved in the reaction mixture. For example, the variation in fluorescence has been experimentally related to the progress of the polymerization of epoxy resins [7], acrylic adhesives [8], PU formulations containing acrylic monomers [6], and PUs based on diisocyanates and polyether and polyester polyols [9]. The fluorescent probes utilized in these studies belong to the category of fluorescent molecular rotors (FMR), which have recently received much attention due to their easy applicability as nonmechanical viscosity sensors and local microviscosity imaging [10,11,12,13,14,15,16,17,18,19,20]. Notably, their emission characteristics are often attributed to the formation of an equilibrium between a nonemissive twisted intramolecular charge transfer (TICT) state that occurs in solutions and a strongly emissive locally excited (LE) state, which is favored in molecular aggregates or viscous environments [10,15,21,22]. Therefore, on the basis of fluorescent probe characteristics, the progressive enhancement of fluorescence intensity with an increase in the polymer molecular weight of the host polymer can be attributed to the inhibition of radiationless decay from the TICT state by rigidization of the probe by the local environment. Nowadays, the concept of FMR has been incorporated into the definition of aggregation-induced emission (AIE). The AIE effect, discovered by Tang in 2001 [23], is typical of these molecules, the structure of which consists of two or more units that can dynamically rotate against each other. Emission, therefore, arises from the restriction of the intramolecular motion (RIM) of the fluorophore that occurs with steric hindrance due to molecular aggregation or by viscosity enhancement in solutions [24,25,26,27]. Moreover, AIE with a twisted propeller-shaped conformation hampers intermolecular π–π interactions in the aggregate state, minimizing quenching of the emission in the solid state. As fluorescent molecular rotors, AIE emitters (AIEgens) have recently been utilized as fluorescent molecular probes to monitor the progress of diverse polymerization processes [28,29,30].
In this work, we proposed the use of AIEgens as fluorescent probes (i.e., 9-(2,2-dicyanovinyl)julolidine (DCVJ) and 2,3-bis(4-(phenyl(4-(1,2,2-triphenylvinyl) phenyl)amino)phenyl)fumaronitrile (TPETPAFN)) for monitoring the polymerization of PU in a dimethylacetamide solution starting with 4,4′-methylenediphenyl diisocyanate (MDI) and polyethylene glycol (PEG) as diols (Figure 1). Notably, the fluorescence spectroscopy was flanked by viscosity measurements and the innovative use of a photodiode, which was able to collect the light emitted by the probe and convert it into an electric current. In this way, the polymerization progress was effectively monitored without using bulky and cost-effective apparatuses, beneficial for scaling-up the process.

2. Materials and Methods

2.1. Materials

4,4′-Methylenediphenyl diisocyanate (MDI, Sigma-Aldrich (Milan, Italy), 98%) and 9-(2,2-dicyanovinyl) julolidine (DCVJ, Sigma-Aldrich) were used as received. Polyethylene glycol 400 (Sigma-Aldrich, average molecular mass of 380–420, 97–110 cSt at 20 °C, melting point of 5 °C) and polyethylene glycol 600 (Sigma-Aldrich, average molecular mass of 570–630, melting point of 17–22 °C) were dried at 50 °C under vacuum before use. N,N-dimethylacetamide (DMAc, Alfa Aesar, 99%) was distilled over calcium hydride (Sigma-Aldrich, 99.99%) and stored under nitrogen before use. 2,3-Bis(4-(phenyl(4-(1,2,2-triphenylvinyl)phenyl)amino)phenyl)fumaronitrile (TPETPAFN) [31] was a kind gift of Prof. Ben Zhong Tang and coworkers.

2.2. Polymerization of MDI with PEG: Synthesis of PU and Viscosity Measurements

A 15 g amount of MDI (0.06 mol) was dissolved under nitrogen in 15 mL of DMAc, and the solution was added to another 15 mL of DMAc containing 24 g of PEG400 (0.06 mol). The system was vigorously stirred under a hood of nitrogen at room temperature (20 °C) with a magnetic stirring bar. The viscosimeter rotor was immersed in the reaction vessel, and viscosity was measured at regular time intervals for 100 min. The crude product was then poured in a large excess of water (3 L), filtered, and dried under vacuum. The polymeric material was characterized in terms of Fourier transform infrared spectroscopy (FT-IR), proton nuclear magnetic resonance (1H-NMR), and gel permeation chromatography (GPC). The same procedure was repeated using PEG600 and, in the case of the fluorescent probe, doping by dissolving 1 mg di DCVJ (4.5 × 10⁻⁶ mol) or 4.8 mg of TPETPAFN (4.5 × 10⁻⁶ mol) in the reaction mixture.

2.3. Polymerization of MDI with PEG: Synthesis of PU and Fluorescence Measurements

A 2 g amount of MDI (8 × 10⁻³ mol) was dissolved under nitrogen in 2 mL of DMAc, and the solution was added in a Schlenk tube previously purged with nitrogen containing 3.19 g of PEG400 (8 × 10⁻³ mol) dissolved in 2 mL of DMAc with a magnetic stirring bar. A 0.6 mL volume of 10−3 M of DCVJ in DMAc was eventually added to the reaction mixture under nitrogen. The Schlenk tube was then inserted into a dark chamber and connected to an optical fiber, which was connected to the spectrofluorometer, and the system was vigorously stirred at room temperature (20 °C). The reaction was followed by monitoring the emission intensity collected at 510 nm under the excitation at 430 nm. In the case of the TPETPAFN fluorescent probe, 1.2 mL of 5 × 10⁻⁴ M of TPETPAFN in DMAc was added to 1 mL of the reaction mixture. Analogously, the reaction was followed by monitoring the emission intensity collected at 625 nm under the excitation at 500 nm. The same procedure was repeated using PEG600.

2.4. Polymerization of MDI with PEG: Synthesis of PU and Photodiode Measurements

The same experimental conditions (Section 2.3) were also adopted in the case of the photodiode measurements, purposely developed for providing a low-cost, easy-to-apply alternative to the spectrophotometric measurement. In this case, the reaction was followed by monitoring the emission intensity collected on a photodiode after low-pass filtering under the excitation at 470 nm for both DCVJ and TPETPAFN. The procedure was performed using only PEG400. Details on the photodiode set-up are reported in Section 2.6.

2.5. Characterization and Instruments

Proton nuclear magnetic resonance (1H-NMR) spectra were recorded using a Varian Mercury Plus 400 MHz spectrometer (Varian Inc., Palo Alto, CA, USA). Fourier transform infrared spectroscopy (FT-IR) spectra were recorded with a Perkin Elmer Spectrum 2000 in the attenuated total reflection (ATR) mode. Gel permeation chromatography (GPC) was used to determine molecular weights and the molecular weight dispersion (Mw/Mn) of polymer samples with respect to polystyrene standards. GPC measurements were performed on samples dissolved in THF, and using a four-channel pump PU-2089 Plus chromatograph (Jasco, Easton, MD, USA) equipped with a Jasco RI 2031 Plus refractometer and a multichannel Jasco UV-2077 Plus UV–vis detector set at 252 and 360 nm. The flow rate was 1 mL⋅min−1 at a temperature of 30 °C, held through a Jasco CO 2063 Plus Column Thermostat. A series composed of two PLgel™ MIXED D columns and a PLgel™ precolumn (Polymer Laboratories, Church Stretton, UK) packed with polystyrene-divinylbenzene was used to perform the analysis (linearity range of 100 Da–400 kDa). Fluorescence spectra were recorded at room temperature with a Horiba Jobin-Yvon Fluorolog®-3 spectrofluorometer equipped with the F-3000 Fibre Optic Mount apparatus coupled with optical fiber bundles. Light generated from the excitation spectrometer was directly focused on the Schlenk tube sample using the optical fiber bundles. Emissions from the sample were then directed back through the bundle into the collection port of the sample compartment.

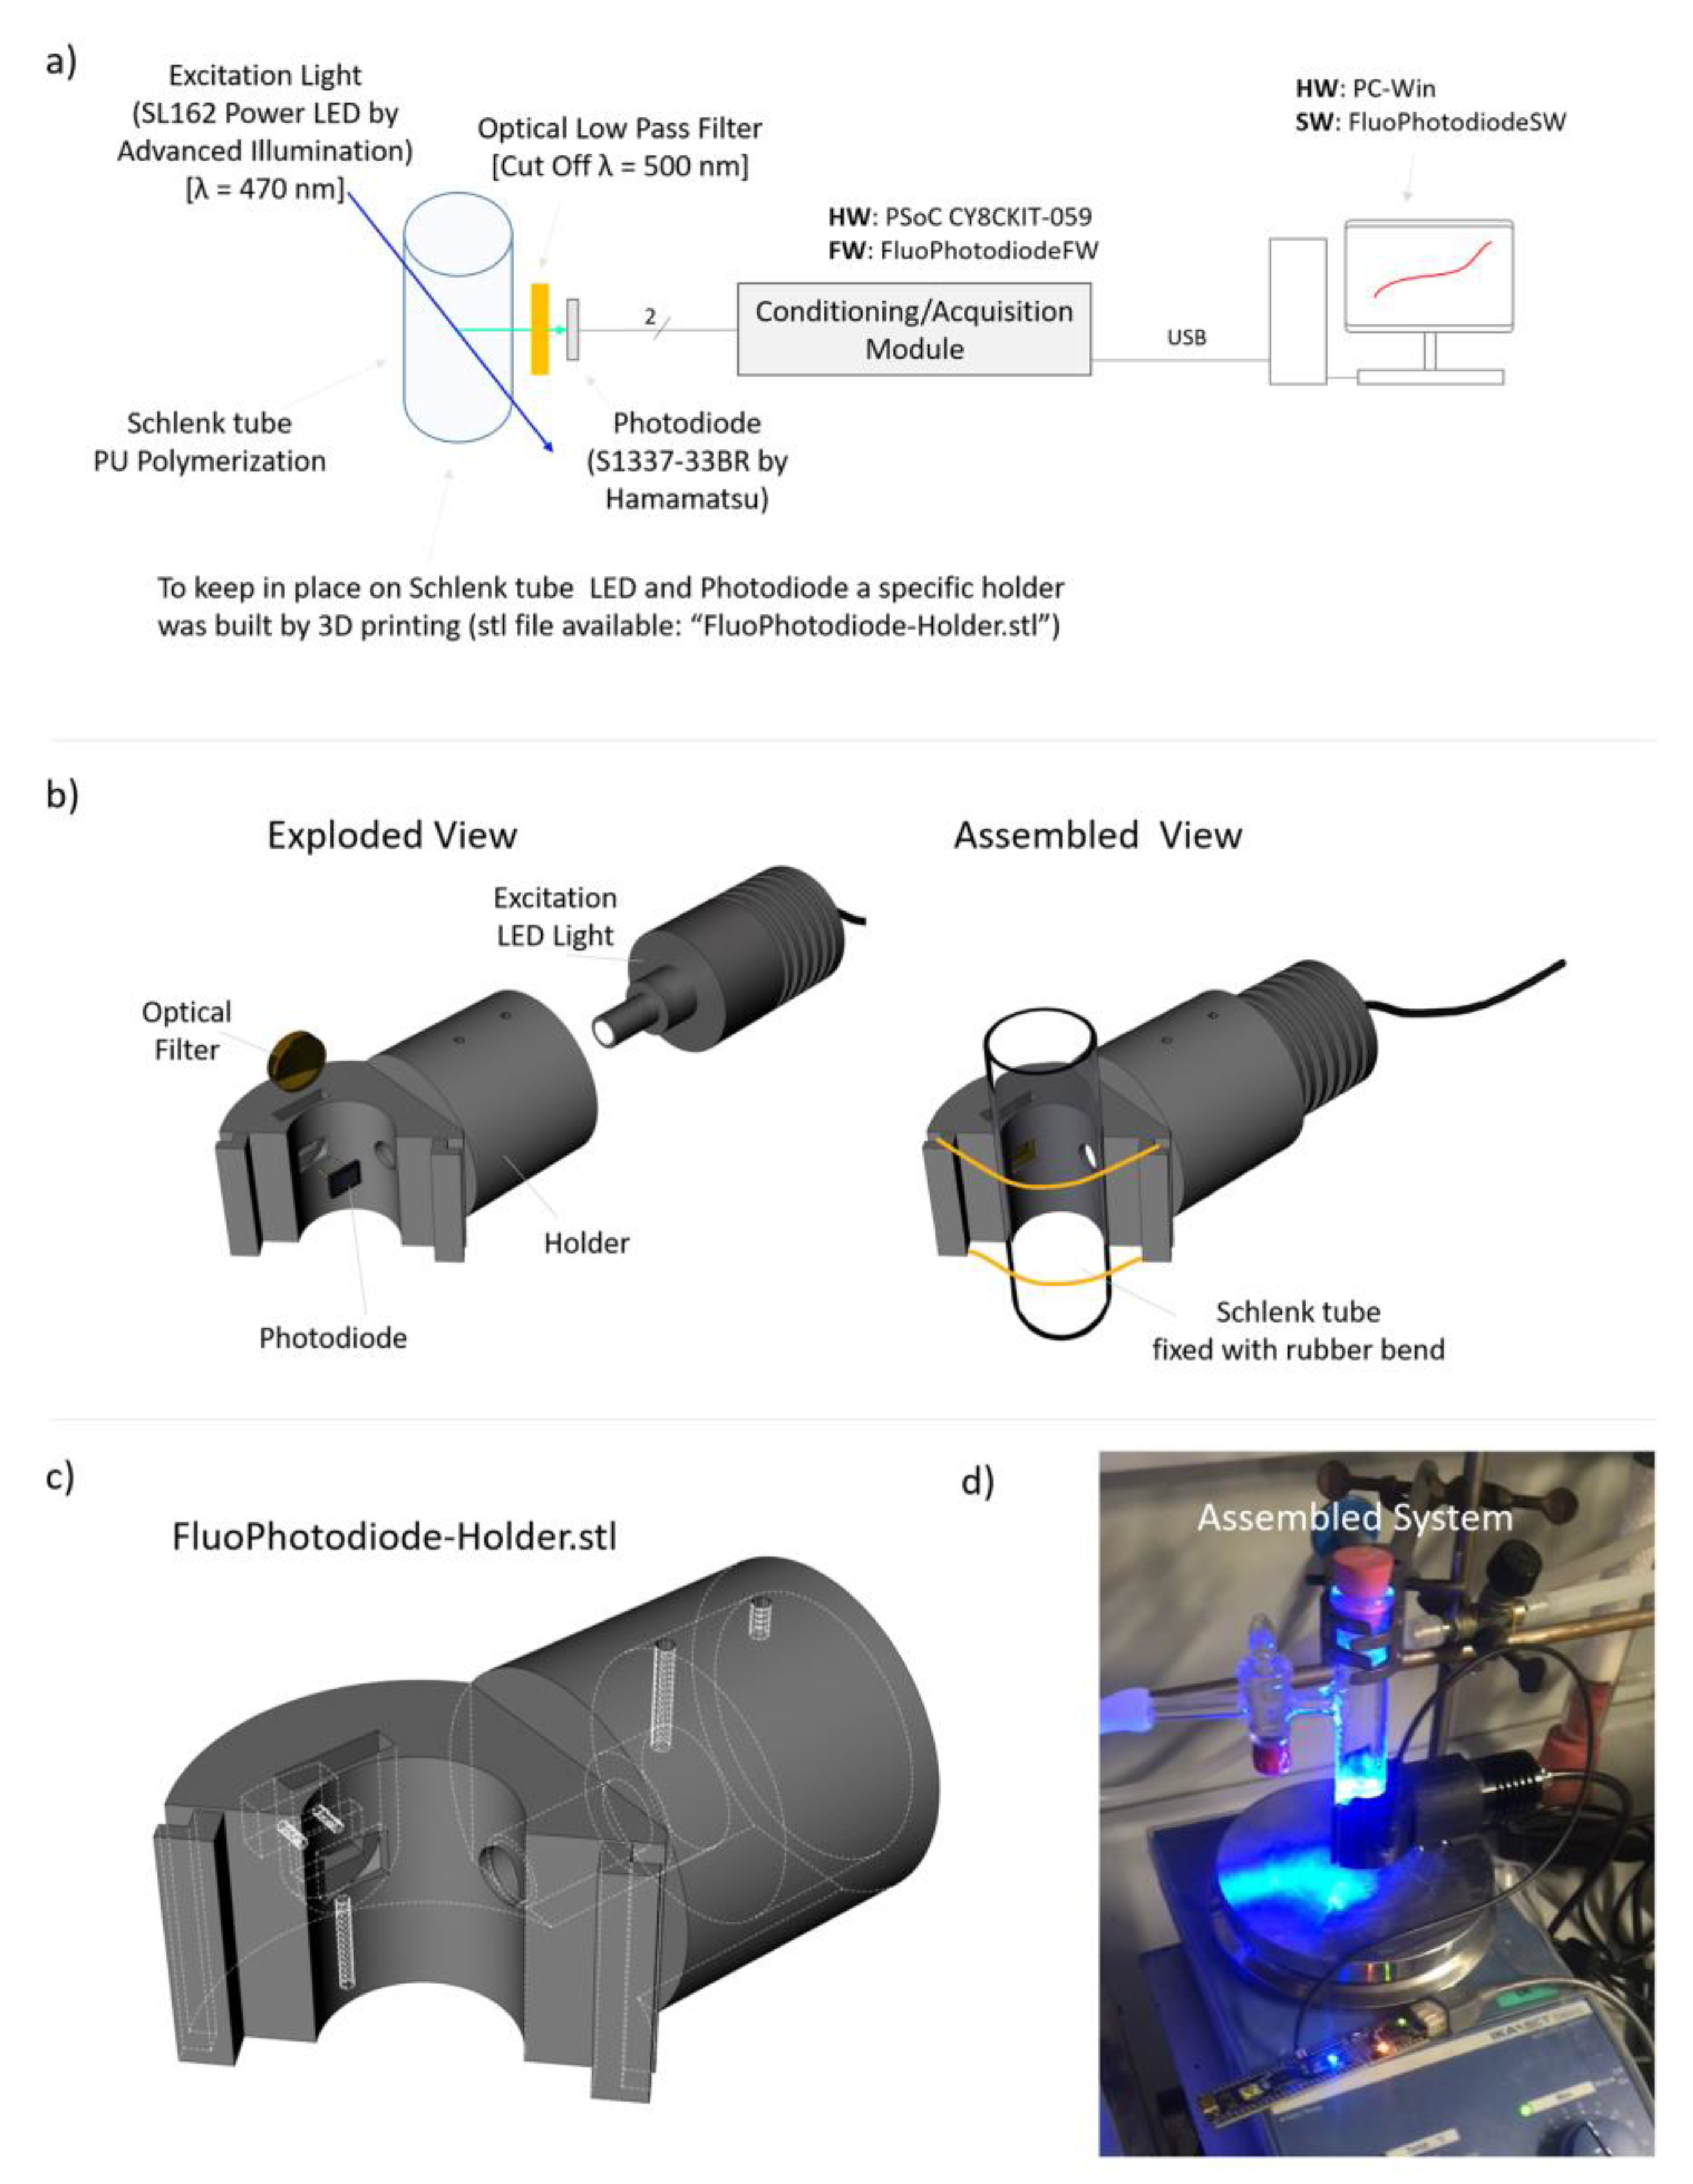
2.6. Photodiode Set-Up

As a low-cost, easy-to-apply alternative to the spectrophotometric measurement, a purposely developed photodiode-based device was proposed for monitoring the fluorescence emission intensity during the polymerization reaction. In detail, the Schlenk tube was equipped with a holder hosting a light source (SL162 Power LED by Advanced Illumination, Rochester, VT, USA) providing excitation at λ = 470 nm and a silicon photodiode (S1337-33BR by Hamamatsu, Hamamatsu City, Japan) to measure the fluorescence, placed perpendicularly to the LED. Between the Schlenk tube and the photodiode was placed an optical low-pass filter (cut-off λ = 500 nm, Code #66-039 by Edmund Optics, York, UK) to avoid the measurement of scattered light. The overall holder assembly prepared by an additive manufacturing process was fixed to the Schlenk tube using rubber bands. The photodiode was electronically conditioned by direct connection with a low-cost system on the chip development board (CY8CKIT-059 PSOC, by Cypress, San Jose, CA, USA) without requiring any additional component. The system on the chip included, by firmware configuration, a transimpedance amplifier with software-selectable gain resistors and a 16-bit delta-sigma analog-to-digital converter (resolution of <20 μV, sampling rate of 40 kSPS). The acquired voltage, proportional to the acquired fluorescence signal, was transmitted via USB to a PC for further visualization/recoding by ad-hoc-developed software. Other details on the photodiode acquisition system can be found in the Supplementary Information. All the material (including hardware, firmware, and software) is available as an open-source resource at https://0-doi-org.brum.beds.ac.uk/10.5281/zenodo.4362276.

3. Results and Discussion

3.1. Characterization of the Prepared PU

Polymerization was carried out at room temperature (20 °C) in a solution of dimethylacetamide (DMAc) with 4,4′-methylene-diphenyldiisocyanate (MDI) and polyethylene glycol (PEG) at different molecular weights (i.e., 400 and 600) and in a ratio of 1:1 by mol. The product obtained was purified by precipitation in 3 L of water under strong stirring. The precipitate was then filtered, washed with water, and dried under mechanical vacuum. Two other polymerization tests were carried out in the presence of the fluorescent viscosity probes, in particular by adding fluorescent probes DCVJ (0.3 mM) and TPETPAFN (0.6 mM), respectively, to the PEG solution. In all cases, weight average molecular weights of about 15,000 g/mol were recorded, with a polydispersity index of about 2.
The FTIR spectra of the solid samples after polymerization displayed the characteristic carbonyl stretching band of the urethane group formed by the reaction between the MDI and the diol (Figure S1) at 1725 cm−1. The NH stretching bands of the urethane group were clearly visible between 3200 and 3460 cm−1, and that attributed to the coupling between the CN stretching and the NH bending appeared at 1535 cm−1. These signals, along with the absence of the characteristic peak of the isocyanate group at about 2270 cm−1, confirmed the formation of the urethane bond. Other evident peaks were attributed to the symmetrical and asymmetrical stretching of the aliphatic methylene groups at 2875 cm−1, the stretching of the aromatic C = C at 1600 cm−1, and the C-OR ether and ester moieties at 1095 cm−1 and 1070 cm−1, respectively. Superimposable spectra were recorded for all the prepared polymers, suggesting that the presence of the fluorescent probe did not determine significant variations in the functional groups present in the structure of the prepared polymers. Furthermore, as shown in Figure S2, similar spectra were recorded, starting with the polymerized products using a diol with a molecular weight of 600 (PEG600, Figure S1b). Notably, for all the investigated polymerizations, it was not possible to identify the signals of the fluorescent probes, possibly due to the molecule concentration being below the sensitivity threshold of the FTIR analysis.
The 1H NMR investigations carried out on the PU samples in deuterated chloroform evidenced the signal attributed to the resonance of the hydrogen bound to the nitrogen of the urethane moiety at 7.77 ppm along with those at 7.07 and 7.42 ppm characteristic of the aromatic rings (Figure S2). Moreover, at 3.86 ppm, it is possible to identify the signal corresponding to the protons of the methyl group among the aromatic rings and those corresponding to the hydrogens of the aliphatic chain between 3.63 and 3.71 ppm. Notably, superimposable spectra were recorded for all the prepared polymers, suggesting that the presence of the fluorescent probe did not cause any significant changes in the structure of the prepared polymers. Furthermore, similar spectra were recorded, starting with the samples obtained using PEG600 (Figure S2b). Similar to the FTIR investigations, no signals of the fluorescent probes were detected due to their concentration being below the sensitivity threshold of the NMR analysis.
As the molecular weight and PU structure were unaffected by the presence of the fluorescent probe, we believe that the thermomechanical behavior would be the same. Nevertheless, future investigations will be considered to study such properties as well.

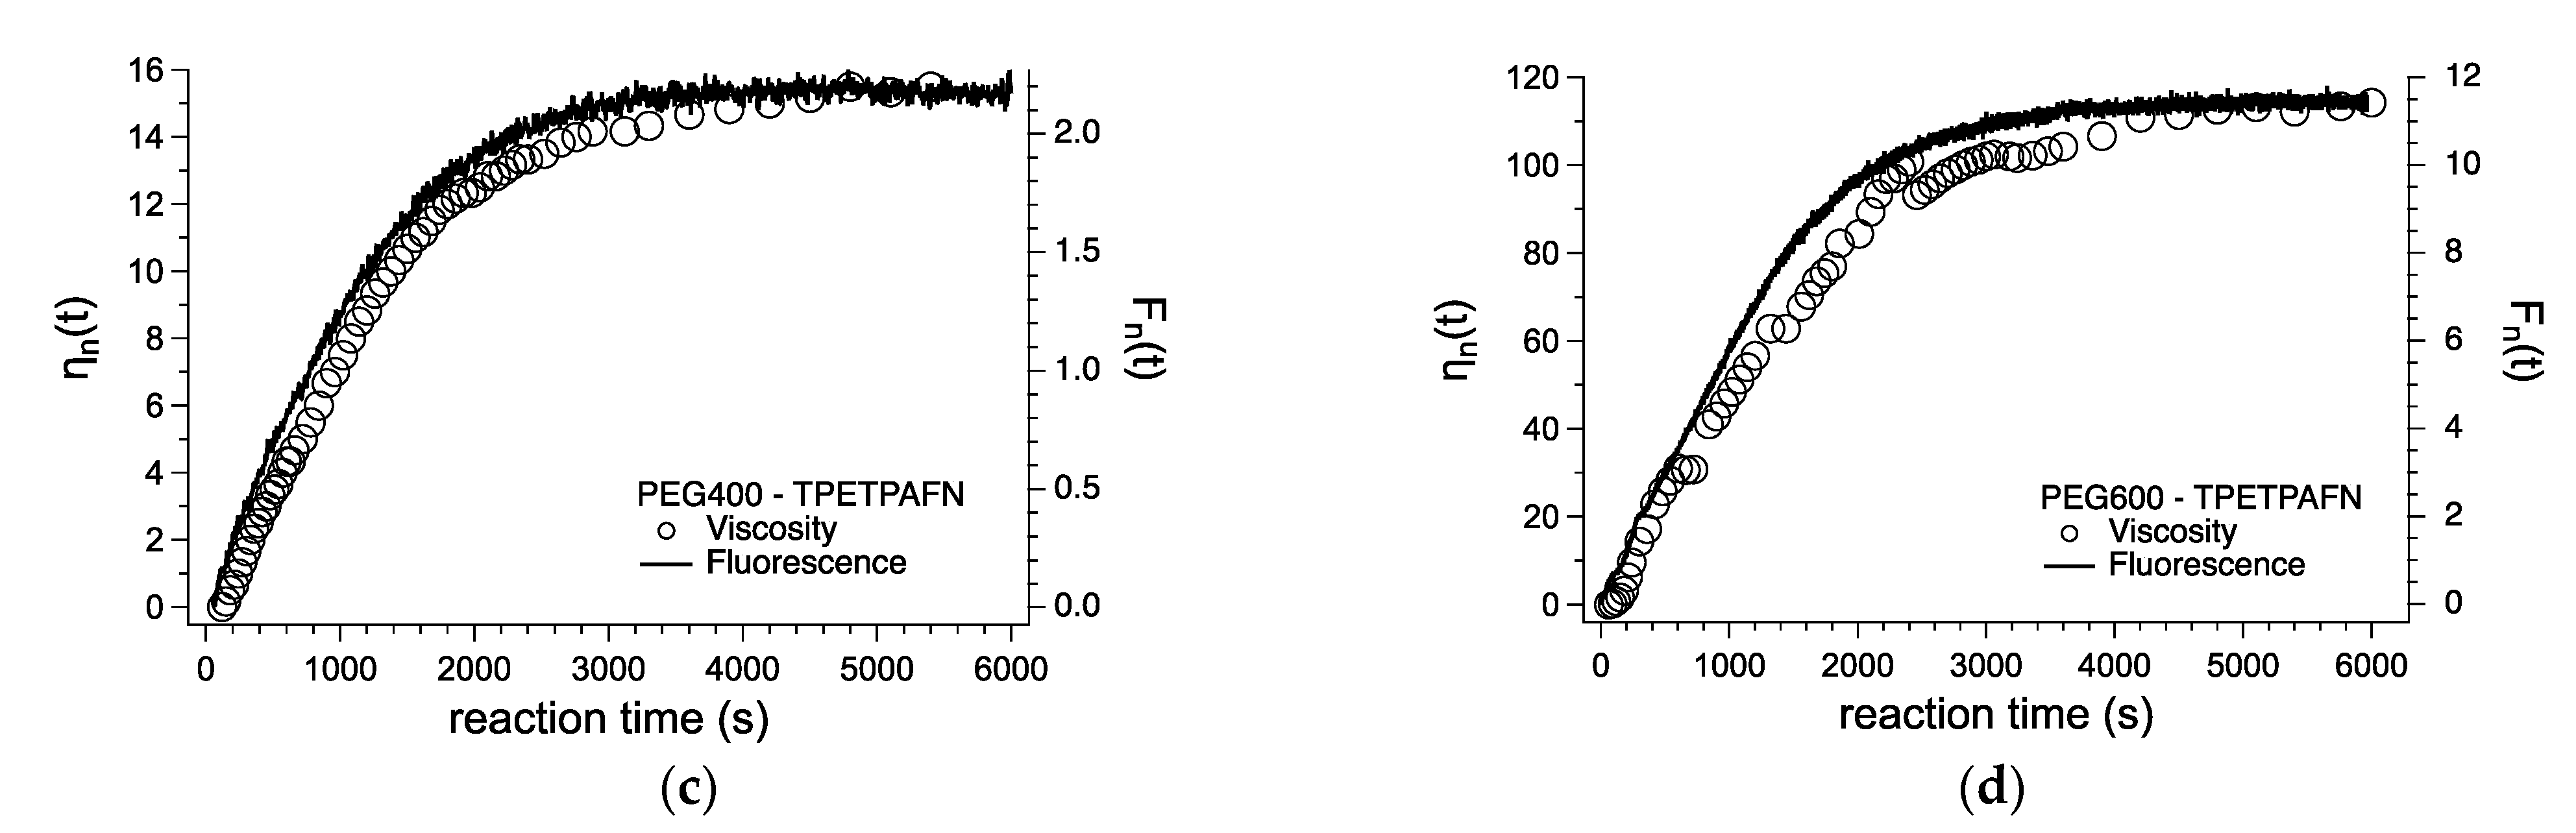
3.2. Viscosity Measurements

After having assessed the nature of the obtained products, the polymerizations were repeated under the same experimental conditions and monitored by viscosity measurements as a function of the reaction time (Figure 2). The polymerization reaction follows second-order kinetics [32,33,34], and the degree of polymerization (Xn) should increase linearly over time (t) [35]:
X n = 1 + k [ N C O ] 0 · t
where k is the rate constant, and [NCO]0 the initial isocyanate concentration. This is true within the stoichiometric regime during the early stages of the reaction, but deviation from the linearity might occur with the reaction progress [34]. Notably, the ratio r = [NCO]/[OH] in the feed mixture can hardly be considered exactly equal to one in the present experimental conditions, especially after the first stages of the reaction. At first approximation, the overall behavior is similar to the experimental data reported in Figure 2, with viscosity variations associated with Xn increasing with time. As an indicator of the progress of the reaction relative viscosity variation, ηn(t) is considered and defined as follows:
ηn(t) = [η(t) η(t0)]/η(t0)
where η(t) and η(t0) are, respectively, the viscosity measured at time t and at the start of reaction (t0).
The relative viscosity variations displayed very similar trends for both polymerizations, i.e., a linear growth at the beginning of polymerization, followed by a leveling off after about 30 min of reaction. Aside from the analogous polymerization rate constants k, viscosity variations were more pronounced for the process involving PEG600 due to the larger molecular weight.

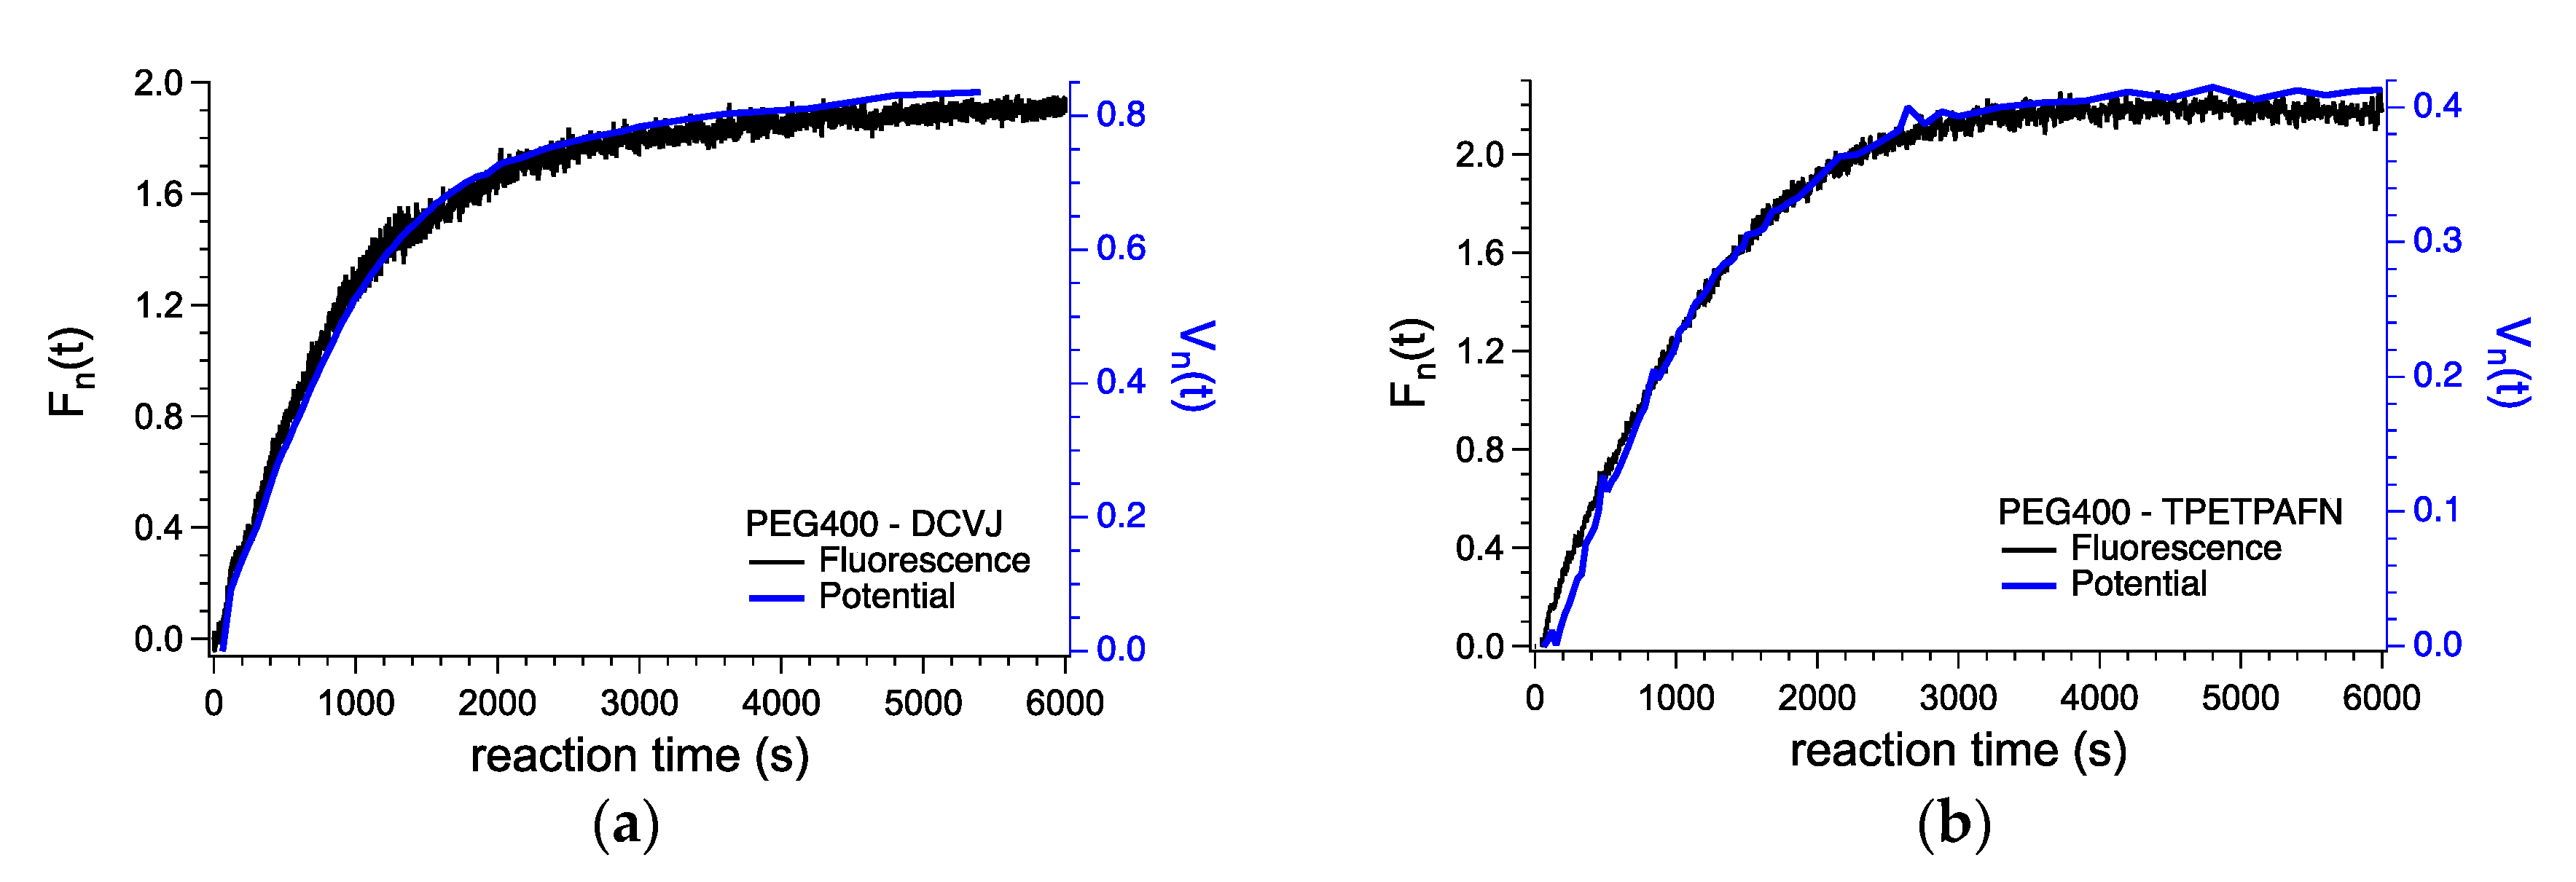
3.3. Fluorescence Measurements

The polymerizations were then repeated in the presence of the fluorescent viscosity probes, in particular by adding the FMR DCVJ (0.3 mM) and the AIEgen TPETPAFN (0.6 mM), respectively, to the PEG solution. Fluorophore’s concentrations were selected in order to provide fluorescence variations of at least 10% and 20% within the first 2 min of reaction when using PEG400 and PEG600, respectively. The polymerization reaction was followed by exciting the reaction mixture using an optical fiber connected to the spectrofluorometer at 430 nm and monitoring the emission at 510 nm when using the DCVJ fluorescent probe. In the case of the TPETPAFN probe, the excitation was set at 500 nm. and the emitted light was collected at 625 nm. Both PEG400 and PEG600 were used as diols. The fluorescence spectra of PEG400 recorded at the beginning and the end of the polymerization process are reported in Figure S3 as an illustrative example. As an indicator of the progress of the reaction relative fluorescence variation Fn(t) is considered, defined as follows:
Fn(t) = [F(t) F(t0)]/F(t0)
where F(t) and F(t0) are, respectively, the intensity measured at time t and the start of reaction (t0).
In the case of DCVJ as a fluorescent probe, the relative fluorescence variation recorded as a function of the polymerization time replicated the viscosity variation when using PEG400 as a diol (Figure 3a). Both the linear growth and plateau regime were superimposed with those collected from the viscosity measurements. This behavior was not totally confirmed in the case of PU obtained from PEG600 (Figure 3b). Whereas the plateau regime occurred in the same time interval, the linear growth appeared more rapidly in the case of fluorescence measurements. This behavior could suggest that the fluorescent DCVJ probe quickly arrested the mobility of the rotors during the early stages of polymerization due to the higher starting viscosity of the reacting medium caused by the higher molecular weight of PEG600. As a consequence of the favored inhibition of radiationless decay from the TICT state [12], the fluorescence enhancement was greater than the viscosity variation and also anticipated the deviation from the linear regime. The same experiments were repeated using TPETPAFN as a fluorescent molecular probe. The fluorophore promptly enhanced its fluorescence due to the restriction of its intramolecular motions (RIM) caused by the viscosity enhancement with the reaction time (Figure 3c), as already reported in the literature for other polymerization systems [28,29]. Notably, the differences between the behavior recorded using PEG400 and PEG 600 were less pronounced with respect to the case of DCVJ (Figure 3d). This result could be possibly addressed to the different photophysics of the two investigated fluorescent probes. The higher sensitivity of the DCVJ probe with respect to the TPETPAFN AIEgen towards viscosity changes in the environment was also supported by the need for a double concentration of the latter (0.6 mM against 0.3 mM) to display the effect. Fluorescence sensitivities, determined as the slope of the plots for a given polymerizing system in the range of 0.1 (PEG400) and 1 ms−1 (PEG600), were determined for both fluorescent probes in the range of the concentration investigated. Overall, the intensity variations of fluorescence can be visible by the naked eye by merely exciting the doped polymeric samples with a long-range UV lamp at 366 nm (Figure S4).

3.4. Use of the Photodiode

Inspired by the results gathered from the fluorescence investigations of the polymerization systems and the agreement with the viscosity behavior as a function of the reaction time, we designed a low-cost fluorescence detection system based on a LED/photodiode assembly, directly mountable on the Schlenk tube (Figure 4). In these experiments, polymerization was again performed in the presence of the fluorescent viscosity probes using PEG400 only.
The amplified signal acquired by the photodiode is directly proportional to the fluorescence, thus the relative fluorescence variation can be simply calculated by the acquired voltage V(t) analogously to the latter case, as follows:
Vn(t) = [V(t)V(t0)]/V(t0)
Comparing the results obtained by the optical fiber spectrophotometer and those acquired with the photodiode system (Figure 5), a substantial superimposition of the curves was observed, indicating that the low-cost proposed system can work appropriately as a tool to follow the polymerization process in the presence of fluorescent molecular rotors.
As the LED/photodiode holder was obtained using an additive manufacturing process, this low-cost detection apparatus can be easily adapted to any glass reaction vessel with a different size and shape.

4. Conclusions

Fluorescent molecular rotors that experience increased emission in agreement with the viscosity of the environment were demonstrated to be easily accessible in monitoring viscosity variations during polyurethane synthesis in solutions starting with MDI and PEG as diols. Both DCVJ and TPETPAFN fluorescent probes, the latter a typical AIE fluorophore, provided a fluorescence response in agreement with the early and late stages of PU formation in the solution along with the use of diols at different molecular weights such as PEG400 and PEG600. The design of the low-cost fluorescence detection apparatus based on a LED/photodiode assembly demonstrated effectiveness in monitoring polyurethane polymerization. The perfect match between the fluorescence and potential variations flanked by the easy assembly of the detector to the reaction vessel could potentially enable the photodiode characterization system to follow the polymerization of a variety of industrial polymers and demonstrate viscosity enhancement.

Supplementary Materials

The following are available online at https://0-www-mdpi-com.brum.beds.ac.uk/2227-9040/9/1/3/s1, Figure S1. FTIR spectra of the prepared polyurethanes starting with (a) PEG400 and (b) PEG600. Figure S2. 1H NMR spectra of the prepared polyurethanes starting with (a) PEG400 and (b) PEG600. Figure S3. Fluorescence spectra of PU polymerization in the presence of ((a) λexc = 430 nm) DCVJ and ((b) λexc = 500 nm) TPETPAFN fluorescent probes and quantum yield (QY) variations as a function of the viscosity variation. Figure S4. Photos taken under the excitation of a long-range UV lamp at 366 nm of reaction samples containing the respective fluorescent probe at t = 0 s, after 5000 s, and after PU precipitation in water at the end of the reaction. In all cases, the PU obtained using PEG400 as a diol was selected.

Author Contributions

Conceptualization, A.P. and G.R.; software, V.M.; validation, A.P., G.R. and V.M.; investigation, P.M. and G.I.; A.P.; funding acquisition, A.P. All authors have read and agreed to the published version of the manuscript.

Funding

This research was funded by the Bio Based Industries Joint Undertaking under the European Union’s Horizon 2020 research and innovation programme under grant agreement No 745766 (Biomotive).

Institutional Review Board Statement

Not applicable.

Informed Consent Statement

Not applicable.

Data Availability Statement

Data available in a publicly accessible repository at https://0-doi-org.brum.beds.ac.uk/10.5281/zenodo.4362276.

Acknowledgments

The authors wish to acknowledge Eleonora Corsi for help in the experimental part of the work. Ben Zhong Tang and his group are kindly acknowledged for providing the TPETPAFN fluorescent viscosity probe. A.P. wishes to thank Nadir S.r.l. Plasma&Polymers for the helpful discussion on the photodiode system.

Conflicts of Interest

The authors declare no conflict of interest.

References

  1. Rigid Polyurethane (PU) Foams Market Analysis by Product and Segment Forecasts to 2020; Grand View Research: San Francisco, CA, USA, 2015.
  2. Bio-Based Polyurethane (PU) Market Analysis by Product and Segment Forecasts to 2020; Grand View Research: San Francisco, CA, USA, 2015.
  3. Adhesives and Sealants Market Size, Share & Trends Analysis Report by Technology, by Product, by Application, by Region (North America, Europe, Asia Pacific, CSA, MEA), and Segment Forecasts, 2019–2025; Grand View Research: San Francisco, CA, USA, 2019.
  4. Çatalgil-Giz, H.; Giz, A.; Alb, A.; Reed, W.F. Absolute online monitoring of a stepwise polymerization reaction: Polyurethane synthesis. J. Appl. Polym. Sci. 2001, 82, 2070–2077. [Google Scholar] [CrossRef]
  5. Wang, S.-K.; Sung, C.S.P. Fluorescence and IR Characterization of Cure in Polyurea, Polyurethane, and Polyurethane−Urea. Macromolecules 2002, 35, 883–888. [Google Scholar] [CrossRef]
  6. Peinado, C.; Salvador, E.F.; Baselga, J.; Catalina, F. Fluorescent Probes for Monitoring the UV Curing of Acrylic Adhesives, 1. FTIR and Fluorescence in Real Time. Macromol. Chem. Phys. 2001, 202, 1924–1934. [Google Scholar] [CrossRef] [Green Version]
  7. Hakala, K.; Vatanparast, R.; Li, S.; Peinado, C.; Bosch, P.; Catalina, F.; Lemmetyinen, H. Monitoring of Curing Process and Shelf Life of the Epoxy−Anhydride System with TICT Compounds by the Fluorescence Technique. Macromolecules 2000, 33, 5954–5959. [Google Scholar] [CrossRef]
  8. Bosch, P.; Fernández-Arizpe, A.; Catalina, F.; Mateo, J.L.; Peinado, C. New Fluorescent Probes for Monitoring Polymerization Reactions: Photocuring of Acrylic Adhesives, 2. Macromol. Chem. Phys. 2002, 203, 336–345. [Google Scholar] [CrossRef]
  9. González-Benito, J.; Mikeš, F.; Baselga, J.; Lemetyinemm, H. Fluorescence method using labeled chromophores to study the curing kinetics of a polyurethane system. J. Appl. Polym. Sci. 2002, 86, 2992–3000. [Google Scholar] [CrossRef] [Green Version]
  10. Cheng, Y.; Wang, J.; Qiu, Z.; Zheng, X.; Leung, N.L.C.; Lam, J.W.Y.; Tang, B.Z. Multiscale Humidity Visualization by Environmentally Sensitive Fluorescent Molecular Rotors. Adv. Mater. 2017, 29, 1703900. [Google Scholar] [CrossRef]
  11. Haidekker, M.A.; Akers, W.; Lichlyter, D.; Brady, T.P.; Theodorakis, E.A. Sensing of Flow and Shear Stress Using Fluorescent Molecular Rotors. Sens. Lett. 2005, 3, 42–48. [Google Scholar] [CrossRef] [Green Version]
  12. Haidekker, M.A.; Brady, T.P.; Lichlyter, D.; Theodorakis, E.A. Effects of solvent polarity and solvent viscosity on the fluorescent properties of molecular rotors and related probes. Bioorg. Chem. 2005, 33, 415–425. [Google Scholar] [CrossRef]
  13. Haidekker, M.A.; Theodorakis, E.A. Environment-sensitive behavior of fluorescent molecular rotors. J. Biol. Eng. 2010, 4, 11. [Google Scholar] [CrossRef] [Green Version]
  14. Mustafic, A.; Huang, H.-M.; Theodorakis, E.A.; Haidekker, M.A. Imaging of Flow Patterns with Fluorescent Molecular Rotors. J. Fluoresc. 2010, 20, 1087–1098. [Google Scholar] [CrossRef] [PubMed] [Green Version]
  15. Zhou, F.; Shao, J.; Yang, Y.; Zhao, J.; Guo, H.; Li, X.; Ji, S.; Zhang, Z. Molecular Rotors as Fluorescent Viscosity Sensors: Molecular Design, Polarity Sensitivity, Dipole Moments Changes, Screening Solvents, and Deactivation Channel of the Excited States. Eur. J. Org. Chem. 2011, 2011, 4773–4787. [Google Scholar] [CrossRef]
  16. Guidugli, N.; Mori, R.; Bellina, F.; Tang, B.Z.; Pucci, A. Aggregation-Induced Emission: New Emerging Fluorophores for Environmental Sensing. In Principles and Applications of Aggregation-Induced Emission; Tang, Y., Tang, B.Z., Eds.; Springer International Publishing: Berlin/Heidelberg, Germany, 2019; pp. 335–349. [Google Scholar] [CrossRef]
  17. Sorgi, C.; Martinelli, E.; Galli, G.; Pucci, A. Julolidine-labelled fluorinated block copolymers for the development of two-layer films with highly sensitive vapochromic response. Sci. China Chem. 2018, 61, 947–956. [Google Scholar] [CrossRef]
  18. Borelli, M.; Iasilli, G.; Minei, P.; Pucci, A. Fluorescent polystyrene films for the detection of volatile organic compounds using the twisted intramolecular charge transfer mechanism †. Molecules 2017, 22, 1306. [Google Scholar] [CrossRef] [PubMed]
  19. Minei, P.; Pucci, A. Fluorescent vapochromism in synthetic polymers. Polym. Int. 2016, 65, 609–620. [Google Scholar] [CrossRef]
  20. Minei, P.; Koenig, M.; Battisti, A.; Ahmad, M.; Barone, V.; Torres, T.; Guldi, D.M.; Brancato, G.; Bottari, G.; Pucci, A. Reversible vapochromic response of polymer films doped with a highly emissive molecular rotor. J. Mater. Chem. C 2014, 2, 9224–9232. [Google Scholar] [CrossRef] [Green Version]
  21. Lee, S.-C.; Lee, J.-A.; Kwon, O.P.; Heo, J.; Seo, Y.H.; Kim, S.; Woo, H.C.; Lee, C.-L.; Kim, S.; Kim, S. Fluorescent Molecular Rotors for Viscosity Sensors. Chemistry 2018, 24, 13706–13718. [Google Scholar] [CrossRef]
  22. Haidekker, M.A.; Nipper, M.; Mustafic, A.; Lichlyter, D.; Dakanali, M.; Theodorakis, E.A. Dyes with segmental mobility: Molecular rotors. Springer Ser. Fluoresc. 2010, 8, 267–308. [Google Scholar] [CrossRef]
  23. Luo, J.; Xie, Z.; Lam, J.W.Y.; Cheng, L.; Chen, H.; Qiu, C.; Kwok, H.S.; Zhan, X.; Liu, Y.; Zhu, D.; et al. Aggregation-induced emission of 1-methyl-1,2,3,4,5-pentaphenylsilole. Chem. Commun. 2001, 1740–1741. [Google Scholar] [CrossRef]
  24. Mei, J.; Hong, Y.; Lam, J.W.Y.; Qin, A.; Tang, Y.; Tang, B.Z. Aggregation-Induced Emission: The Whole Is More Brilliant than the Parts. Adv. Mater. 2014, 26, 5429–5479. [Google Scholar] [CrossRef]
  25. Hu, R.; Leung, N.L.C.; Tang, B.Z. AIE macromolecules: Syntheses, structures and functionalities. Chem. Soc. Rev. 2014, 43, 4494–4562. [Google Scholar] [CrossRef] [PubMed]
  26. Hong, Y.; Lam, J.W.Y.; Tang, B.Z. Aggregation-induced emission. Chem. Soc. Rev. 2011, 40, 5361–5388. [Google Scholar] [CrossRef] [PubMed] [Green Version]
  27. Hong, Y.; Lam, J.W.Y.; Tang, B.Z. Aggregation-induced emission: Phenomenon, mechanism and applications. Chem. Commun. 2009, 4332–4353. [Google Scholar] [CrossRef] [PubMed]
  28. Zhao, D.; You, J.; Fu, H.; Xue, T.; Hao, T.; Wang, X.; Wang, T. Photopolymerization with AIE dyes for solid-state luminophores. Polym. Chem. 2020, 11, 1589–1596. [Google Scholar] [CrossRef]
  29. Liu, B.; Zhang, H.; Liu, S.; Sun, J.; Zhang, X.; Tang, B.Z. Polymerization-induced emission. Mater. Horiz. 2020, 7, 987–998. [Google Scholar] [CrossRef]
  30. Wang, X.; Qiao, X.; Yin, X.; Cui, Z.; Fu, P.; Liu, M.; Wang, G.; Pan, X.; Pang, X. Visualization of Atom Transfer Radical Polymerization by Aggregation-Induced Emission Technology. Chem. Asian J. 2020, 15, 1014–1017. [Google Scholar] [CrossRef]
  31. Li, K.; Qin, W.; Ding, D.; Tomczak, N.; Geng, J.; Liu, R.; Liu, J.; Zhang, X.; Liu, H.; Liu, B.; et al. Photostable fluorescent organic dots with aggregation-induced emission (AIE dots) for noninvasive long-term cell tracing. Sci. Rep. 2013, 3, 1150. [Google Scholar] [CrossRef]
  32. Król, P. Linear Polyurethanes: Synthesis Methods, Chemical Structures, Properties and Applications; Taylor & Francis: Abingdon, UK, 2008. [Google Scholar]
  33. Parnell, S.; Min, K.; Cakmak, M. Kinetic studies of polyurethane polymerization with Raman spectroscopy. Polymer 2003, 44, 5137–5144. [Google Scholar] [CrossRef]
  34. Verhoeven, V.W.A.; Padsalgikar, A.D.; Ganzeveld, K.J.; Janssen, L.P.B.M. A kinetic investigation of polyurethane polymerization for reactive extrusion purposes. J. Appl. Polym. Sci. 2006, 101, 370–382. [Google Scholar] [CrossRef] [Green Version]
  35. Flory, P.J. Principles of Polymer Chemistry; Cornell University Press: Ithaca, NY, USA, 1953. [Google Scholar]
Figure 1. Synthesis of polyurethane from 4,4′-methylenediphenyl diisocyanate (MDI) and polyethylene glycol and the chemical structure of the aggregation-induced emission molecules (AIEgens) investigated in this work.
Chemosensors 09 00003 g001
Figure 2. Relative viscosity variations (ηn(t)) as a function of the polymerization time using PEG400 (open black circles) and PEG600 (open blue circles) as diols.
Chemosensors 09 00003 g002
Figure 3. Relative viscosity variations (ηn(t), open circles) and relative fluorescence variations (Fn(t), solid line) for the synthesis of polyurethane (PU) in the presence of ((a,b) λexc = 430 nm, λem = 510 nm) 9-(2,2-dicyanovinyl)julolidine (DCVJ) and ((c,d) λexc = 500 nm, λem = 625 nm) 2,3-bis(4-(phenyl(4-(1,2,2-triphenylvinyl) phenyl)amino)phenyl)fumaronitrile (TPETPAFN) fluorescent probes with (a,c) PEG400 and (b,d) PEG600 as diols.
Chemosensors 09 00003 g003aChemosensors 09 00003 g003b
Figure 4. Details of the led/photodiode set-up system design. (a) Overall LED/photodiode system schematic; (b) LED/photodiode system: exploded view (left) and assembled view (right); (c) LED/photodiode holder CAD design; (d) picture of the working assembled system. All the information, electronic and mechanical schemes, firmware, and software code are available as an open-source resource at: https://0-doi-org.brum.beds.ac.uk/10.5281/zenodo.4362276.
Chemosensors 09 00003 g004
Figure 5. Relative fluorescence variations (Fn(t), solid line) for the synthesis of PU in the presence of (a) DCVJ (λexc = 430 nm, λem = 510 nm) and (b) TPETPAFN fluorescent probes for PEG400 as a diol and the corresponding relative potential variations (Vn(t), blue curve) acquired by the sensing system based on the photodiode (λexc = 470 nm in both cases).
Chemosensors 09 00003 g005
Publisher’s Note: MDPI stays neutral with regard to jurisdictional claims in published maps and institutional affiliations.

