Article

Nanocrystalline Oxides NixCo3−xO4: Sub-ppm H2S Sensing and Humidity Effect

by
Kseniya Prikhodko
1,
Abulkosim Nasriddinov
1,2,
Svetlana Vladimirova
1,
Marina Rumyantseva
1,* and
Alexander Gaskov
1
1
Chemistry Department, Moscow State University, 119991 Moscow, Russia
2
Faculty of Materials Science, Moscow State University, 119991 Moscow, Russia
*
Author to whom correspondence should be addressed.
Submission received: 31 December 2020 / Revised: 24 January 2021 / Accepted: 2 February 2021 / Published: 7 February 2021
(This article belongs to the Special Issue Chemical Sensors for Air Quality Monitoring)

Abstract

:
In this work, p-type oxide semiconductors, Co3O4 and complex oxides NixCo3−xO4 (x = 0.04, 0.07, 0.1), were studied as materials for sub-ppm H2S sensing in the temperature range of 90–300 °C in dry and humid air. Nanocrystalline Co3O4 and NixCo3−xO4 (x = 0.04, 0.07, 0.1) were prepared by coprecipitation of cobalt and nickel oxalates from nitrate solutions and further annealing at 300 °C. The surface reactivity of the obtained materials toward H2S both in dry and humid atmosphere (relative humidity at 25 °C R.H. = 60%) was investigated using diffuse reflectance infrared Fourier transform spectroscopy (DRIFTS). Sensor measurements showed a decrease in sensor signal toward 1 ppm H2S with an increase in Ni content because of a decrease in chemisorbed surface oxygen species. On the other hand, sensor signal increases for all samples with increasing the relative humidity that depends on reactivity of the surface hydroxyl groups, which stimulate the decomposition of surface sulfites and provide better surface regeneration at higher temperature. This assumption was additionally confirmed by the faster saturation of the conductivity curve and a decrease in the sensor response time in humid air.

1. Introduction

Hydrogen sulfide is a highly toxic, reactive and flammable gas that is found in various technological processes. Therefore, it is extremely important to monitor its concentration in the air at a level below 100 ppm of H2S, which is considered to be immediately dangerous to life and health (IDLH). Semiconductor gas sensors based on n-type metal oxides are one of the most commonly used commercial hydrogen sulfide detectors [1]. For this type of devices, the problem of the negative influence of ambient humidity often arises [2,3]. The effect of humidity had been actively studied for the most common oxides used in gas sensors, such as SnO2 [4,5], WO3 [6], ZnO [7], In2O3 [8]. The blocking effect of adsorbed water on WO3 can be overcome by aging processes, leading to the appearance of surface hydroxyl groups [9].
Currently, there are different types of gas sensors with great potential for use in “e-nose” systems and “smart sensors” [10,11,12]. However, the attention of researchers is increasingly attracted by less common sensors based on p-type oxides, such as CuO, NiO, Co3O4. In particular, an increase in the sensor signal in the presence of moisture was observed for CuO sensors used for H2S detection in a hydrogen atmosphere [13]. This effect was associated with the formation of hydroxyl groups due to the water dissociation on the oxide surface.
Dissociation of water molecules and the formation of strongly bonded hydroxyl groups coordinated at metal centers were also observed on well-ordered Co3O4 (111) film [14]. Similar processes can be expected on the surface of polycrystalline Co3O4 (Figure 1). In this case, hydroxyl groups can act as oxidizing agents, which can lead to additional oxidation processes in humid air.
Cobalt oxide Co3O4 with a spinel structure has a high catalytic activity in oxidation reactions, which is provided by the high concentration of chemisorbed oxygen on the oxide surface. O2 molecules are adsorbed on the surface oxygen vacancy sites, forming reactive oxygen species (ROS), such as O2 and O22− (Figure 2). It is assumed that these ROS are involved in the catalytic oxidation of hydrocarbons [15], CO [16,17] and formaldehyde [18] above Co3O4.
One of the main limitations of Co3O4 as a material for gas sensors is its high electrical resistance. The introduction of nickel into the spinel structure with the formation NixCo3−xO4 (x ≤ 1) leads to a sharp drop in resistance of the material, which is realized due to an increase in the mobility of charge carriers at x ≤ 0.25 [19]. At the same time, a decrease in the concentration of chemisorbed oxygen is observed, correlating with a decrease in the proportion of Co3+ in octahedral positions. This leads to a drop in the CO sensor signal with an increase in the proportion of nickel.
The aim of the present study is to investigate the sensor properties of cobalt oxide Co3O4 and complex oxides NixCo3−xO4 (x ≤ 0.1) to hydrogen sulfide in humid air. Special attention is paid to the mechanism of reactions and the role of surface hydroxyl groups in these processes.

2. Materials and Methods

Nanocrystalline powders of Co3O4 and NixCo3−xO4 (x = 0.04, 0.07, 0.1) were prepared by coprecipitation of cobalt and nickel oxalates from nitrate solutions, and their further annealing at 300 °C. Elemental analysis of the samples was performed by XRF and ICP-MS methods. In order to avoid standard errors of the results, obtained by XRF analysis, the calibration was performed using ICP-MS method on the quadrupole mass spectrometer Agilent 7500C. Isotopes 59Co, 60Ni and 58Ni were used for determination of Co and Ni. A detailed description of this technique can be found in Ref. [20]. The phase composition, microstructure parameters and the charge state of cations were studied by XRD, TEM, XPS, EPR, as well as BET measurements [19]. The main characteristics of the samples are presented in Table 1.
The morphology of cobalt oxide was investigated by transmission electron microscopy (TEM) using a FEI Tecnai G2 30 UT microscope operated at 300 kV.
The gas sensor properties were determined by comparing the electrical resistance of thick films in dry or humid air (0, 20%, 60% R.H.) with the resistance in the presence of H2S (0.07–1.3 ppm). The films were obtained by the following procedure: the synthesized powders were ground with a binder (a solution of α–terpineol in ethanol), and then the pastes were deposited on functional substrates with Pt contacts on the front side and a Pt-meander on the back side that acts both as a heating element and a temperature probe. After covering each layer, DC voltage of 5 V was applied for 2 min. Sensors were annealed at 300 °C for 24 h. The films obtained by this technique are uniform and continuous throughout the substrate, and their thickness is about 1 μm [21].
An automatic device that allowed controlling the temperature and the gas flows (100 mL/min in all experiments) was used for the measurements. Sensor properties were investigated in the temperature range 90–300 °C. For each temperature stage, at first pure air and then a mixture of the test gas and air was supplied into the chamber for 15 min. The cycle was repeated three times for each temperature stage. Pure air generator (Granat-Engineering Co. Ltd., Moscow, Russia) was used to produce purified carrier gas. In sensor measurements and DRIFTS investigations a relative humidity was set and measured by Humidifier P-2 (Cellkraft AB, Sweden). The sensor signal S was determined according to:
S = (Rg − Ra)/Ra,
From the averaged values of the resistance in air Ra and in the presence of the test gas Rg.
A Perkin–Elmer Frontier spectrometer provided with a DiffusIR annex and flow-through reactor with a furnace (HC900, Pike Technologies) sealed with the ZnSe window was used for in situ diffuse-reflectance infrared Fourier-transform (DRIFT) spectroscopy study of material interactions with H2S. The spectra were recorded in the range of 4000–1000 cm−1 with a resolution of 1 cm−1 and averaging of 30 scans under control of the gas phase composition. The powders (50 mg) were placed in alundum crucibles 5 mm in diameter. The samples were heated in a flow of clean air at 300 °C before collecting the spectra. The sequence of recording conditions for Co3O4 is shown in Figure 3. A similar experiment was carried out for Ni0.1Co2.9O4 sample. Hydrogen sulfide treatment was carried out at a temperature of 220 °C in a flow of H2S (20 ppm, 100 mL/min) in dry air and in a humidity of 60% R.H. After 50 min of measurements, the temperature was raised to 300 °C and a flow of pure air was started.

3. Results and Discussion

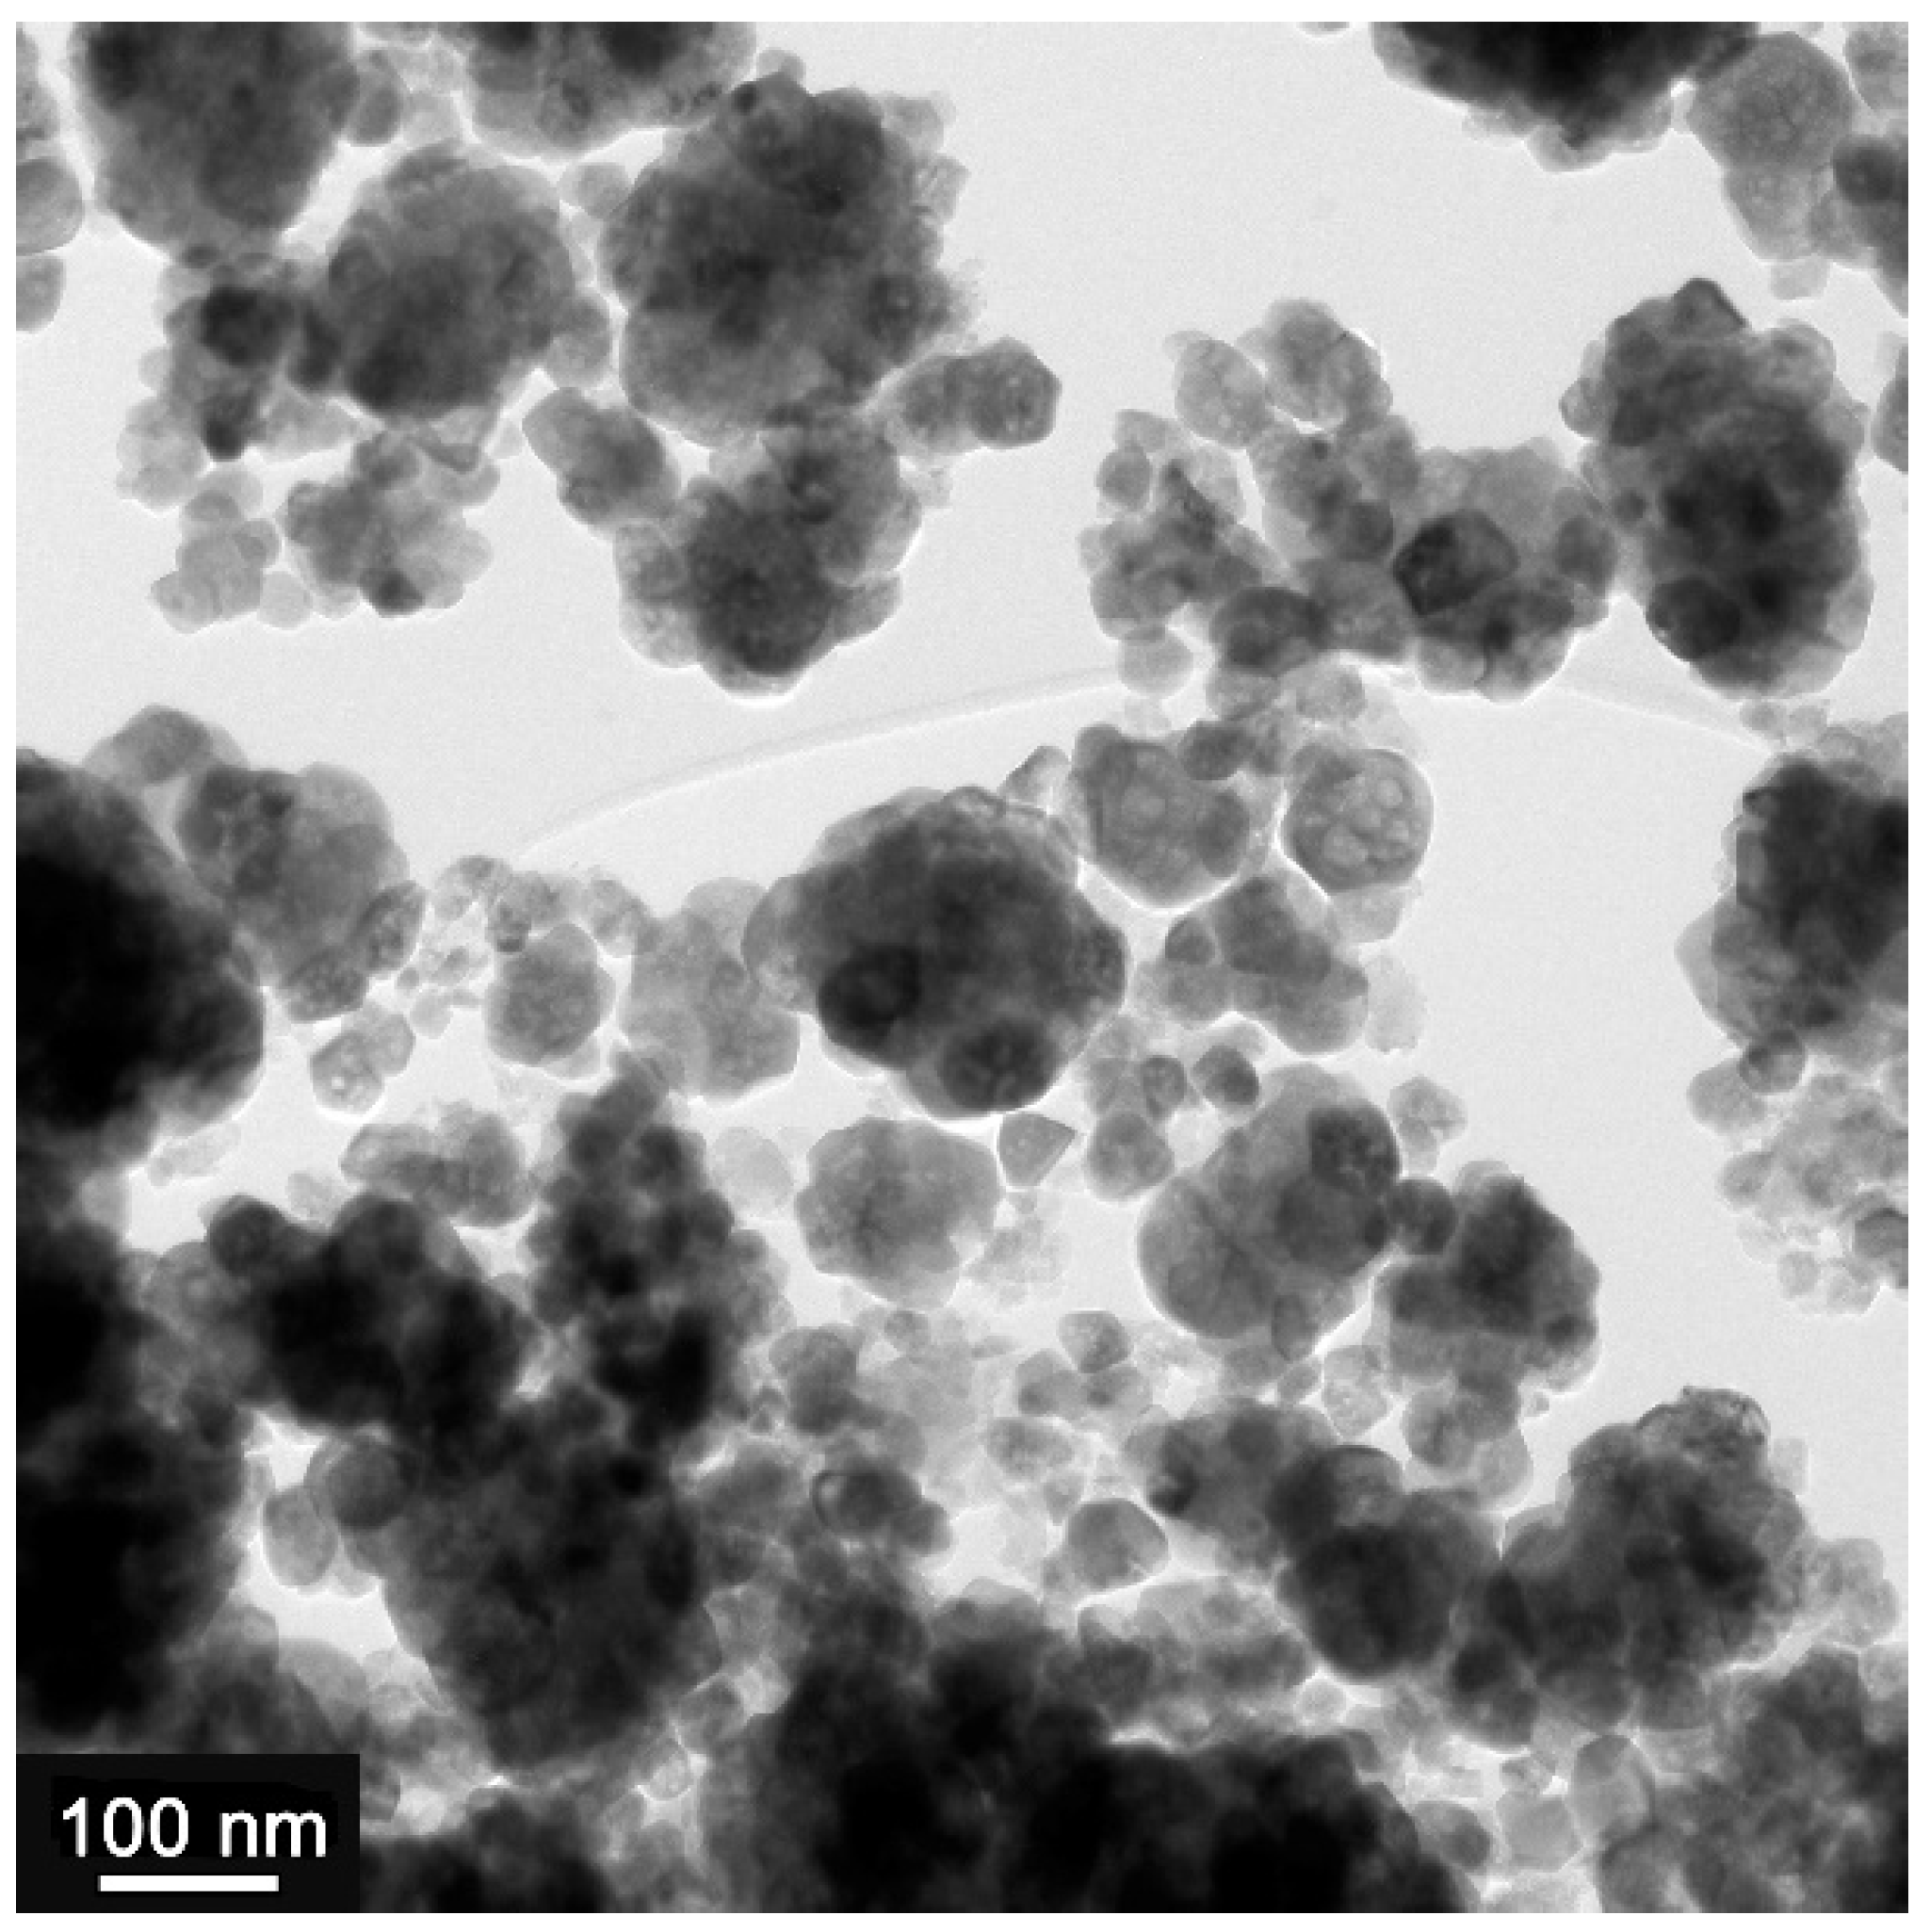
3.1. Characteristics of Nanocrystalline Co3O4 and NixCo3−xO4 Samples

The microstructure of Co3O4 was investigated by TEM (Figure 4). The sample consists of aggregated particles (20–100 nm) and has a porous structure due to the release of gases (CO, CO2) during the decomposition of the oxalate precursor.

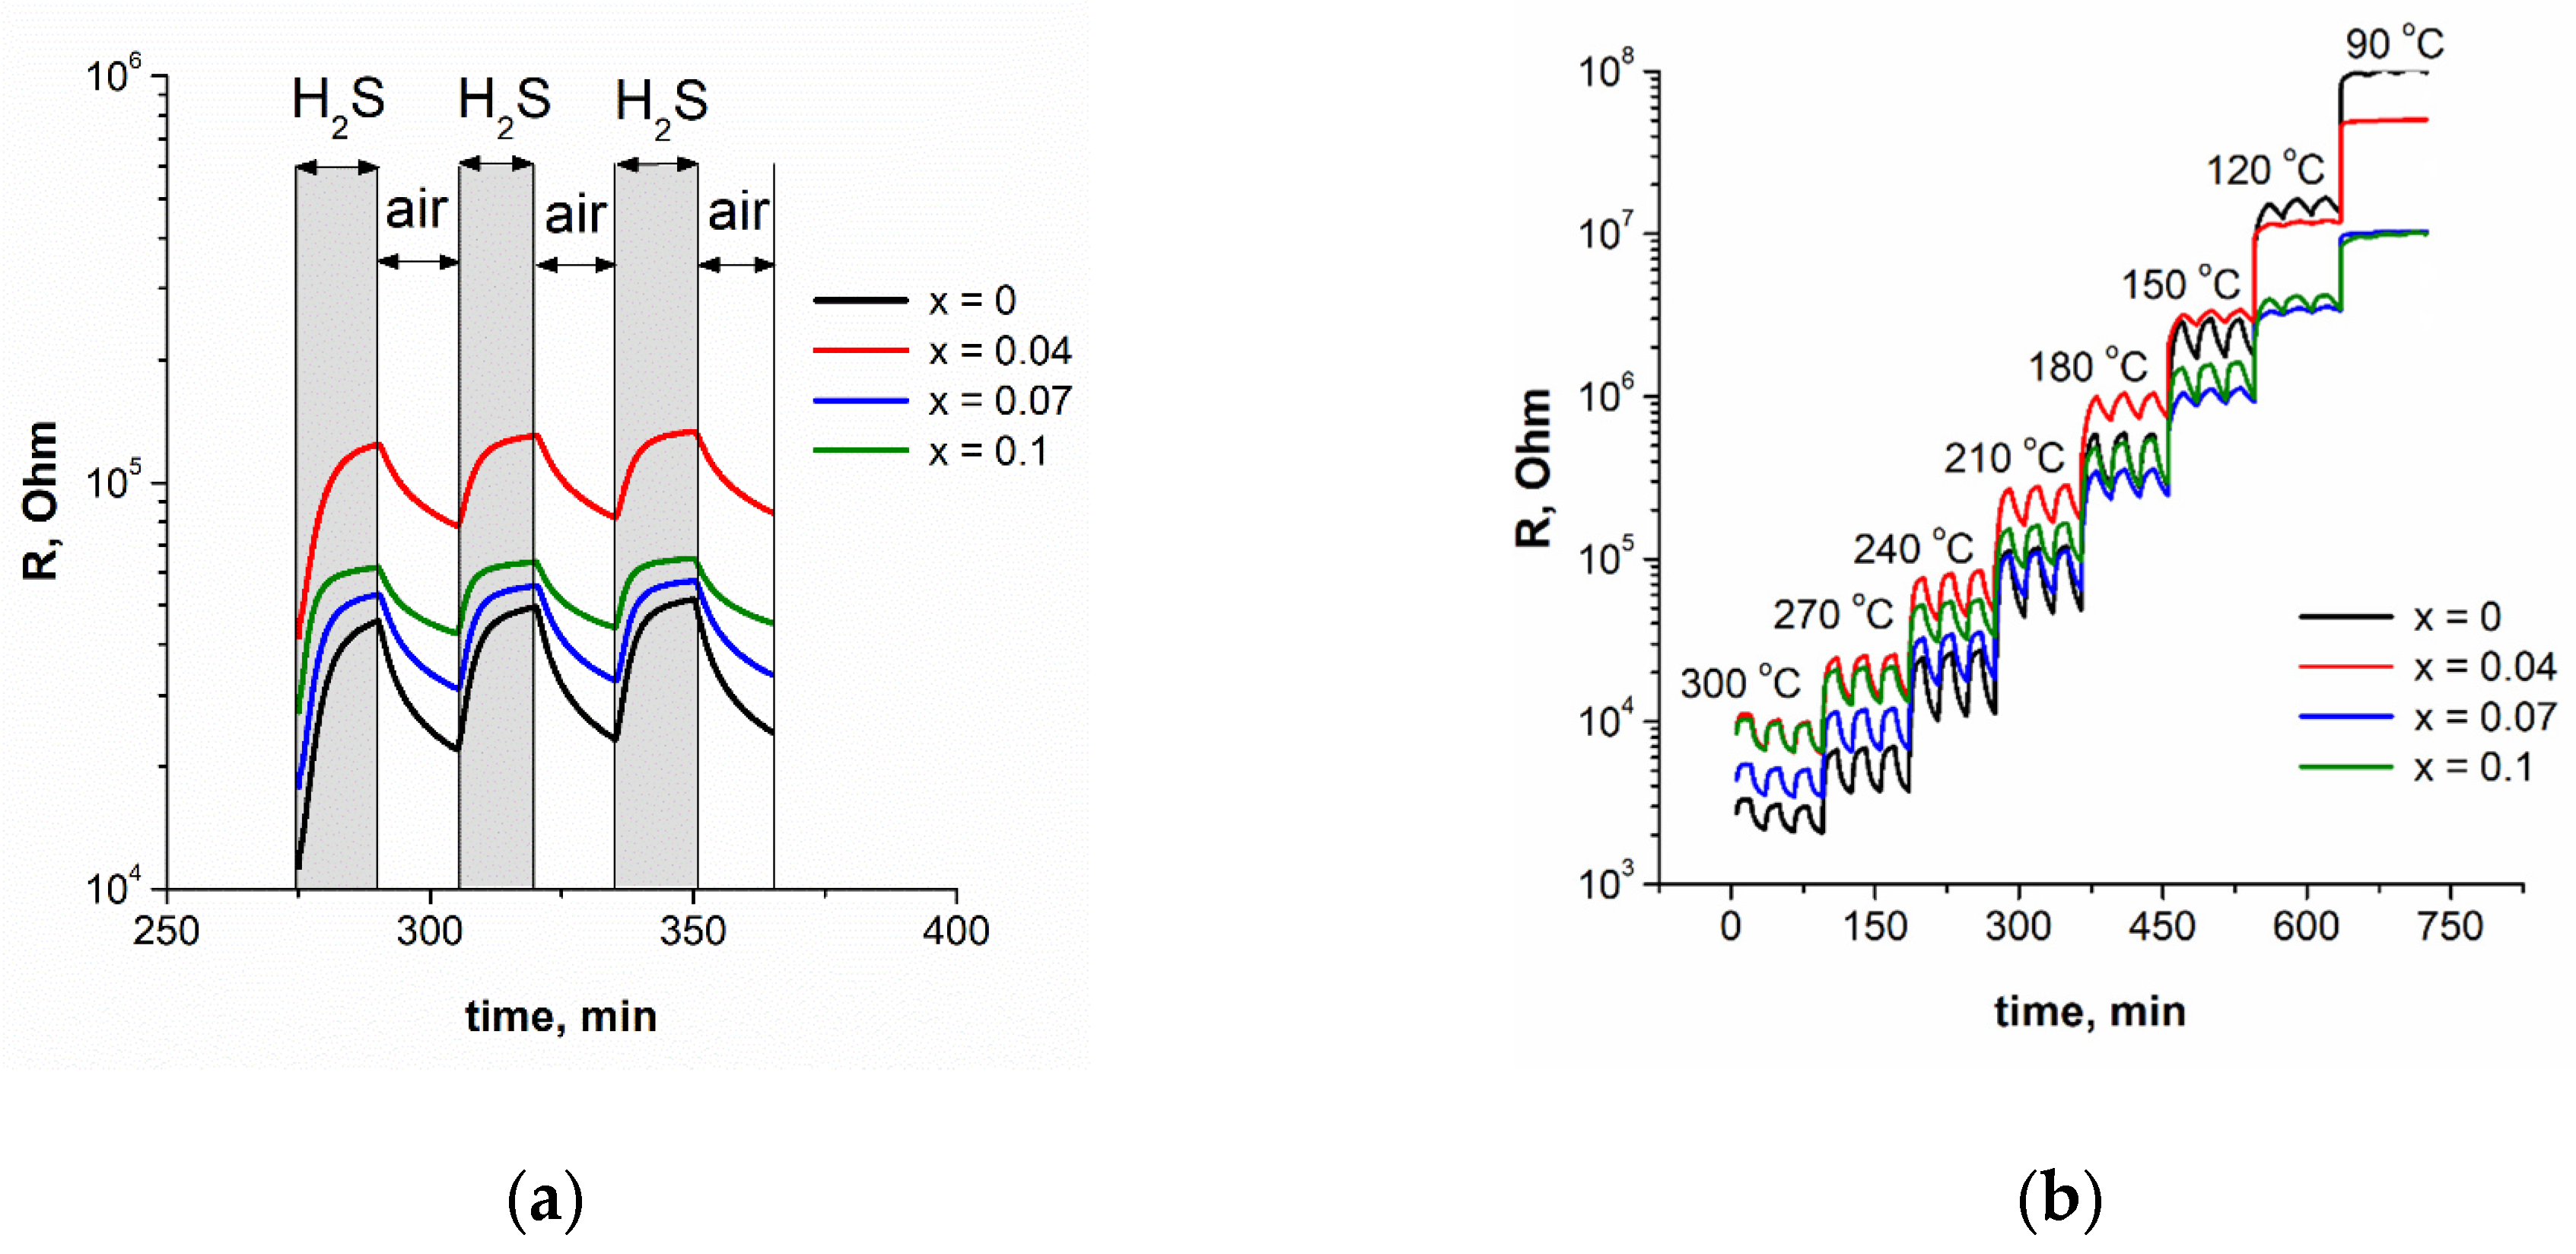
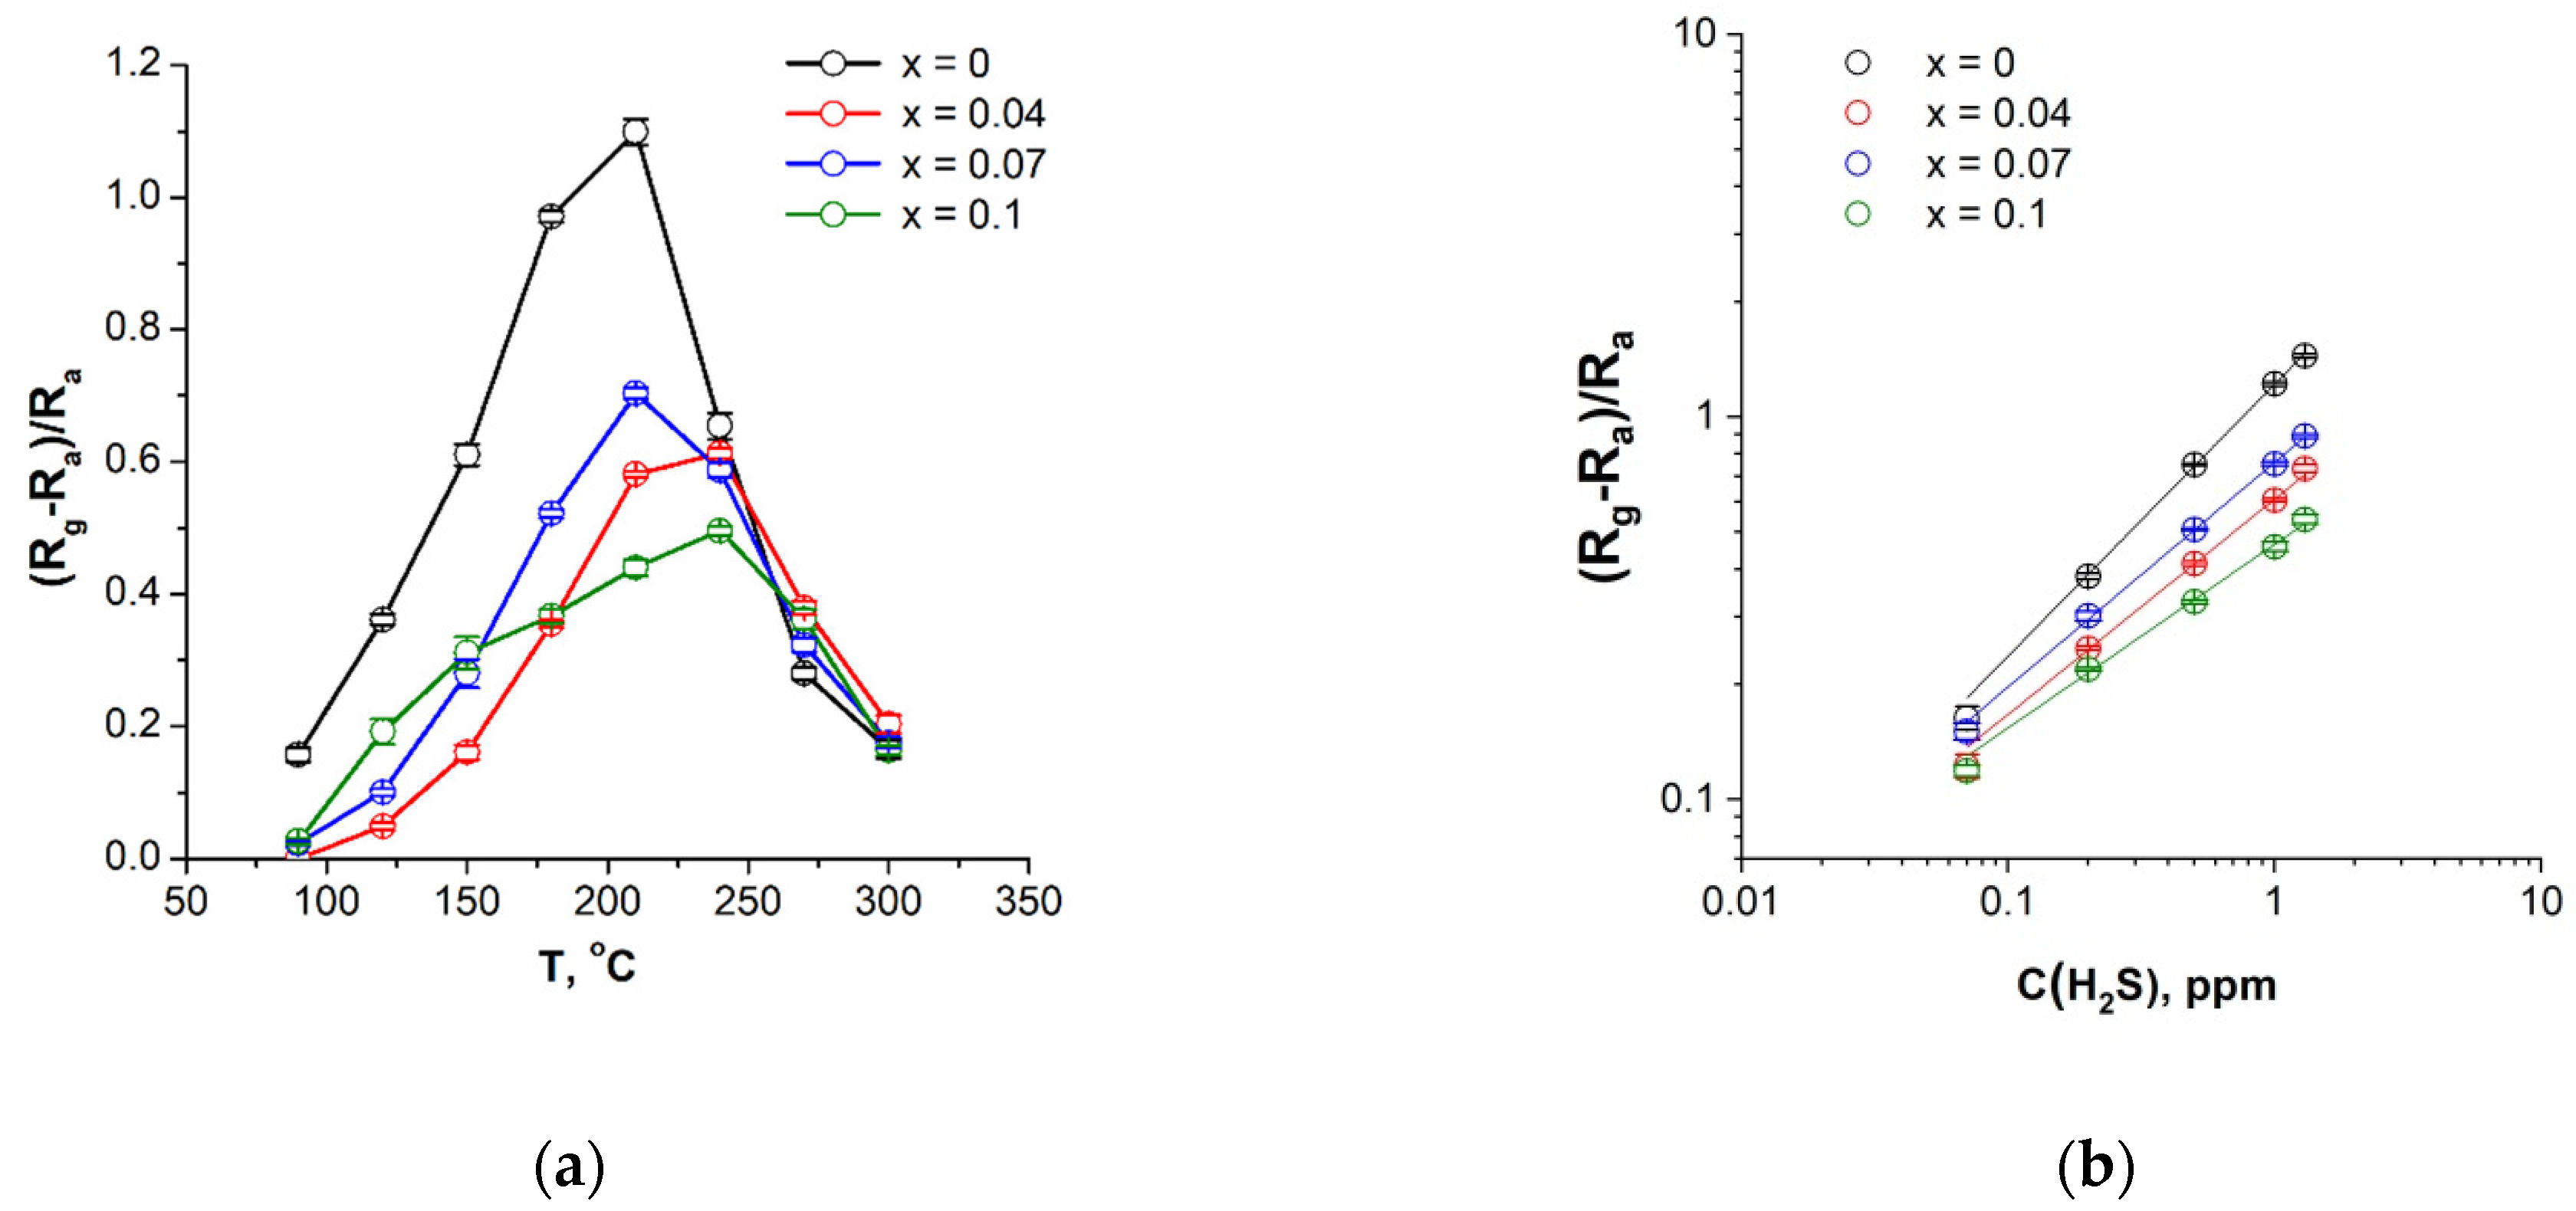
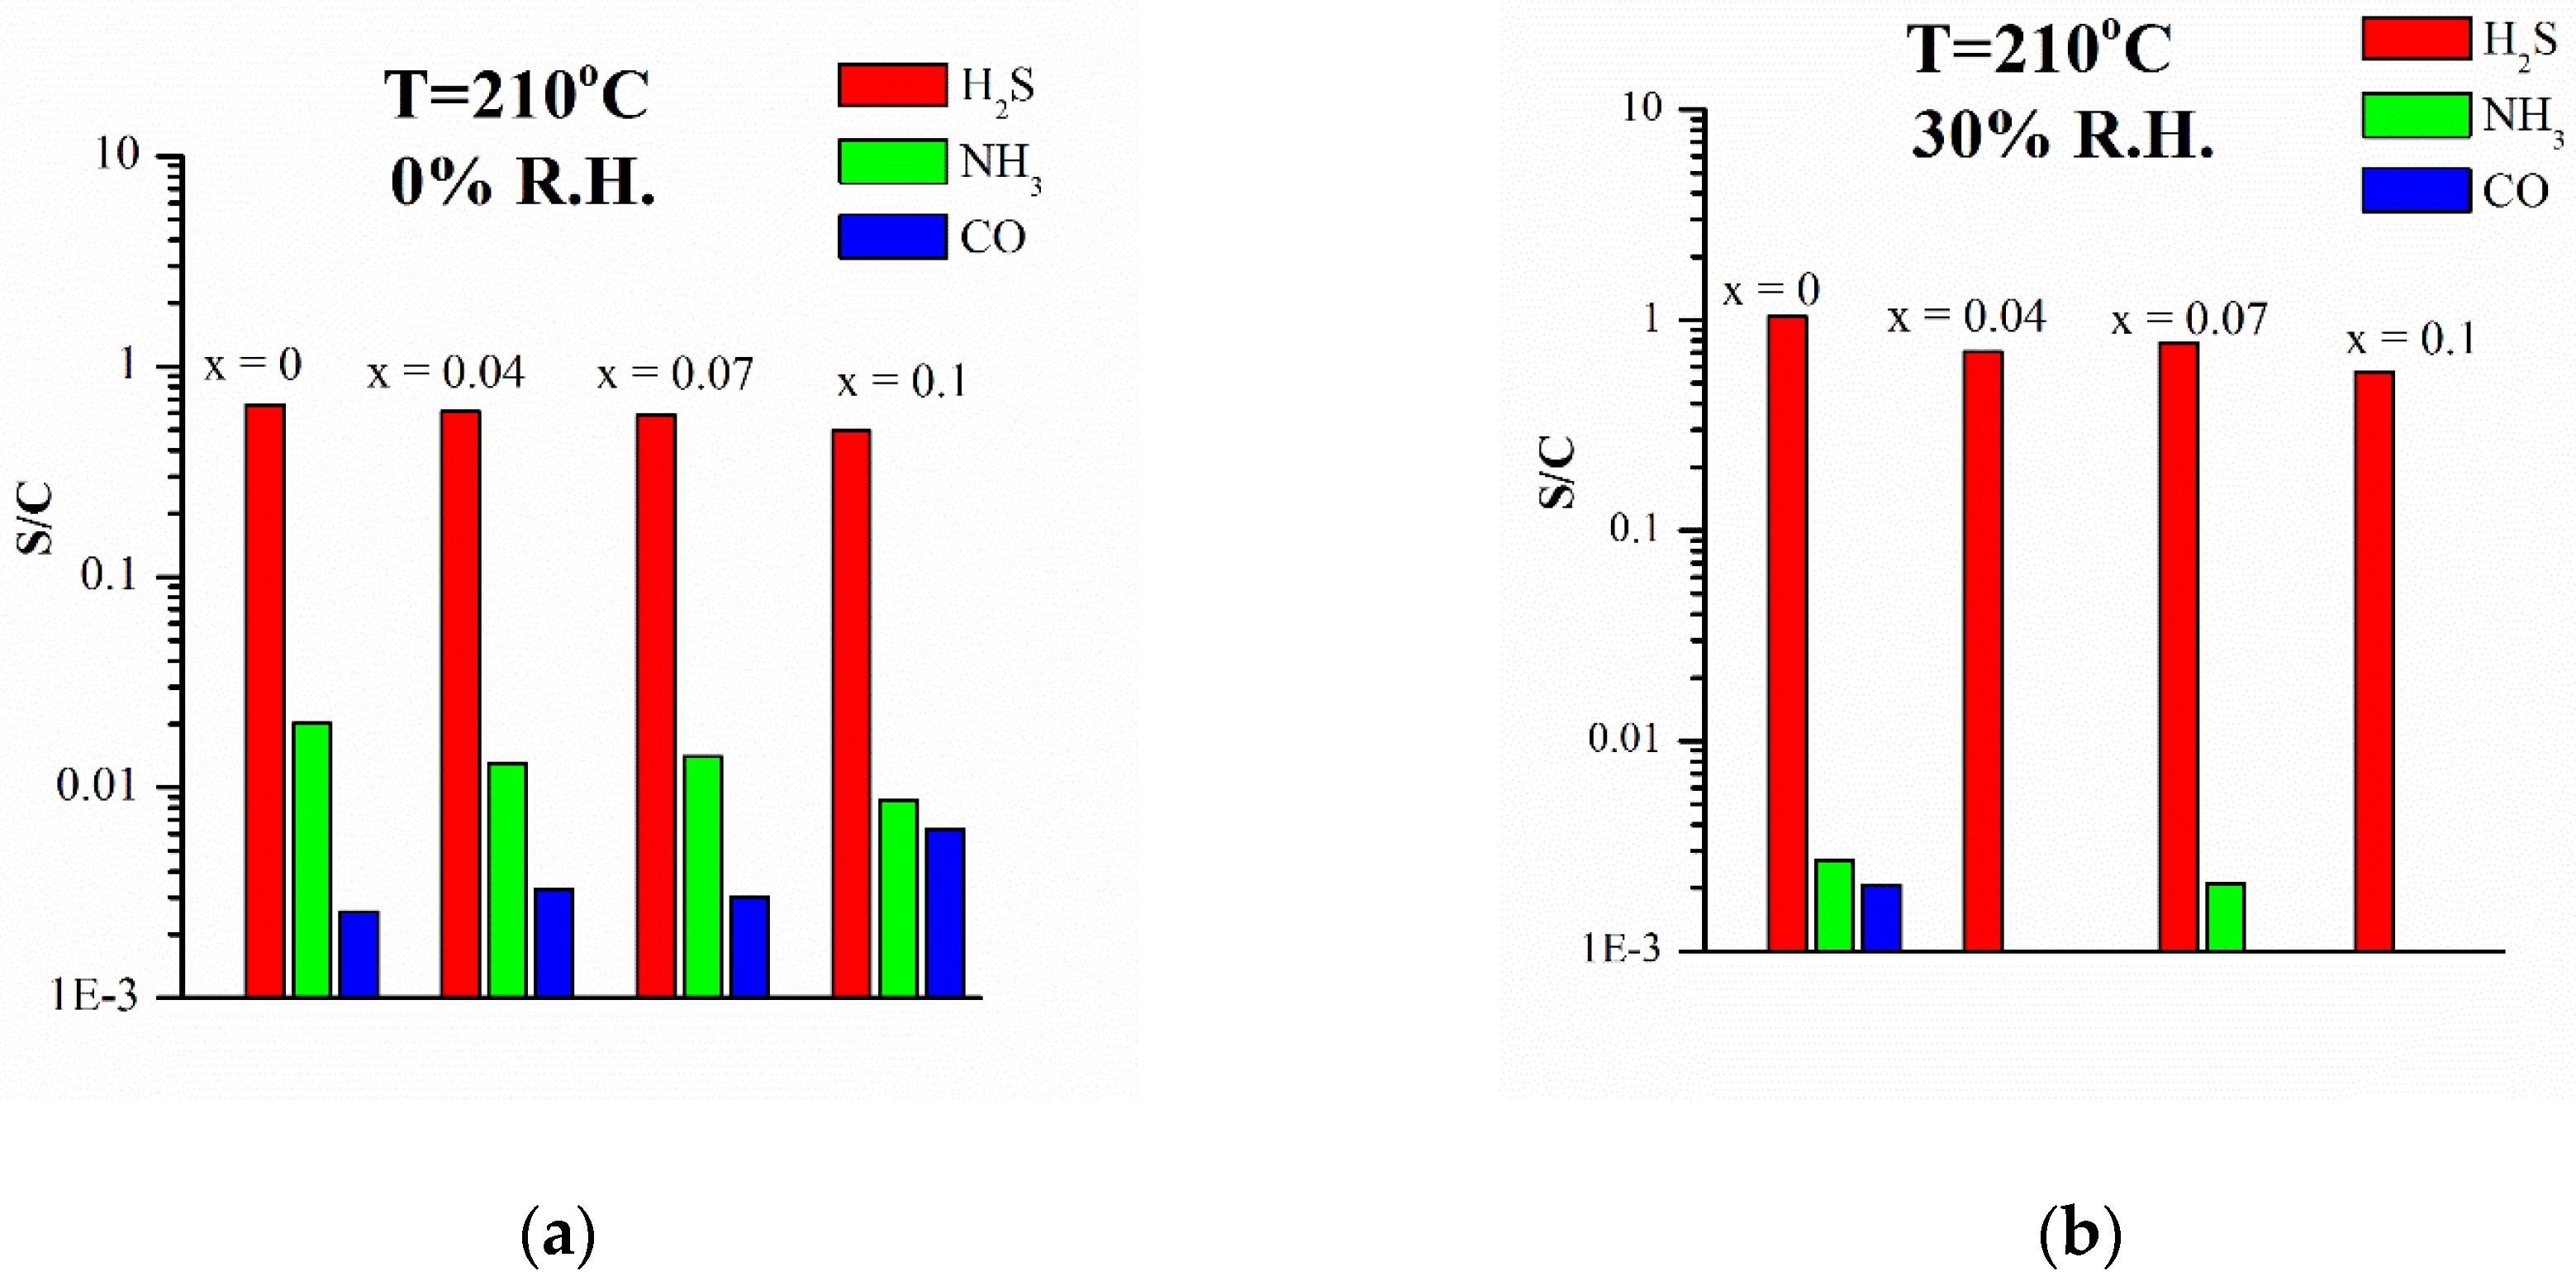
3.2. Sensor Properties for H2S Detection

Initially the Co3O4 and NixCo3−xO4 (x = 0.04, 0.07, 0.1) sensors were exposed to H2S in dry air. In order to find the optimum conditions, the operating temperature was varied from 300 to 90 °C. Figure 5a shows a dynamic response of Co3O4 and NixCo3−xO4 based gas sensors to the periodical change of gas phase composition from 1 ppm H2S to dry air at 210 °C. There are 3 periodical changes in gas phase composition for every operating temperature, the flow of H2S and dry air was supplied to the test chamber for strictly 15 min. All samples showed a typical response of p-type oxides towards a reducing gas such as hydrogen sulfide: the resistance growth in the presence of H2S and returns back in dry air. The same type of response to H2S was observed in the humid conditions at 300–90 °C (Figure 5b). All samples showed stable and well reproducible resistance changes and, accordingly, sensor signal.
The temperature dependencies of the sensor signal S (Figure 6a) with a maximum value in the region of 210–240 °C are very similar for all the samples. Therefore, this temperature range is the most favorable for H2S detection. A maximum value of S = 1.1 was observed for Co3O4 at 210 °C.
The effect of hydrogen sulfide concentration was also studied at this temperature (210 °C). The lowest-observed-adverse-effect level of H2S is 10 ppm, when the irritation of eyes, nose, and throat is caused. In order to prevent serious eye damage, a relatively high protection factor of 100 is used, which leads to a target value of 0.1 ppm with an averaging time of 24 h [22]. On the other hand, the human olfactory organ is able to sense the presence of hydrogen sulfide at a rather low concentration limit of about 0.008–0.13 ppm. Therefore, in this work, the range of target concentrations for Co3O4 and NixCo3−xO4 samples were selected between 0.07 and 1.3 ppm, which indicates a high potential for use as an “electronic nose” system.
The dependences of the sensor signal S on the H2S concentration were linearized in double logarithmic coordinates corresponding to the power law S~C(H2S)n (Figure 6b). From these calibration curves the values of the lowest detectable concentration (LDC) for H2S were determined (Table 2). The value 3 σ R a v , where Rav is the average resistance value and σ is the standard deviation of the resistance in the air, was used as the minimum measurable response. A decrease in the sensitivity of NixCo3−xO4 samples with increasing Ni content is accompanied by a decrease in LDC from 120 to 100 ppb if a minimum amount of nickel is introduced.
Further tests were carried out in humid air. As the R.H. value increases, the overall temperature dependence of the sensor signal is retained, but its value has increased. This effect was especially noticeable at temperatures above 210 °C (Figure 7a). The rise in the signal value was sharper for Co3O4 than for NixCo3−xO4 samples (Figure 7b).
Figure 8a,b shows a comparison of the sensor signal value divided by gas concentration for H2S, NH3, and CO at 210 °C in dry air (0% R.H.) and humid atmosphere (30% R.H.), respectively. All samples show high sensitivity to H2S, despite the fact that its concentration is 20 times less than the concentration of other gases. Further, it can be noticed that the sensitivity of H2S increases in humid air, unlike ammonia and carbon monoxide. Most likely, the decisive contribution to the formation of an electric signal towards NH3 and CO in dry and humid air is made only by the process of their oxidation with the participation of various chemisorbed oxygen species on the surface of complex oxides. During interaction with hydrogen sulfide in humid air, surface-adsorbed hydroxyl groups also make an additional contribution to the oxidation of H2S molecules.

3.3. DRIFT Spectroscopy Investigation in a Hydrogen Sulfide Atmosphere

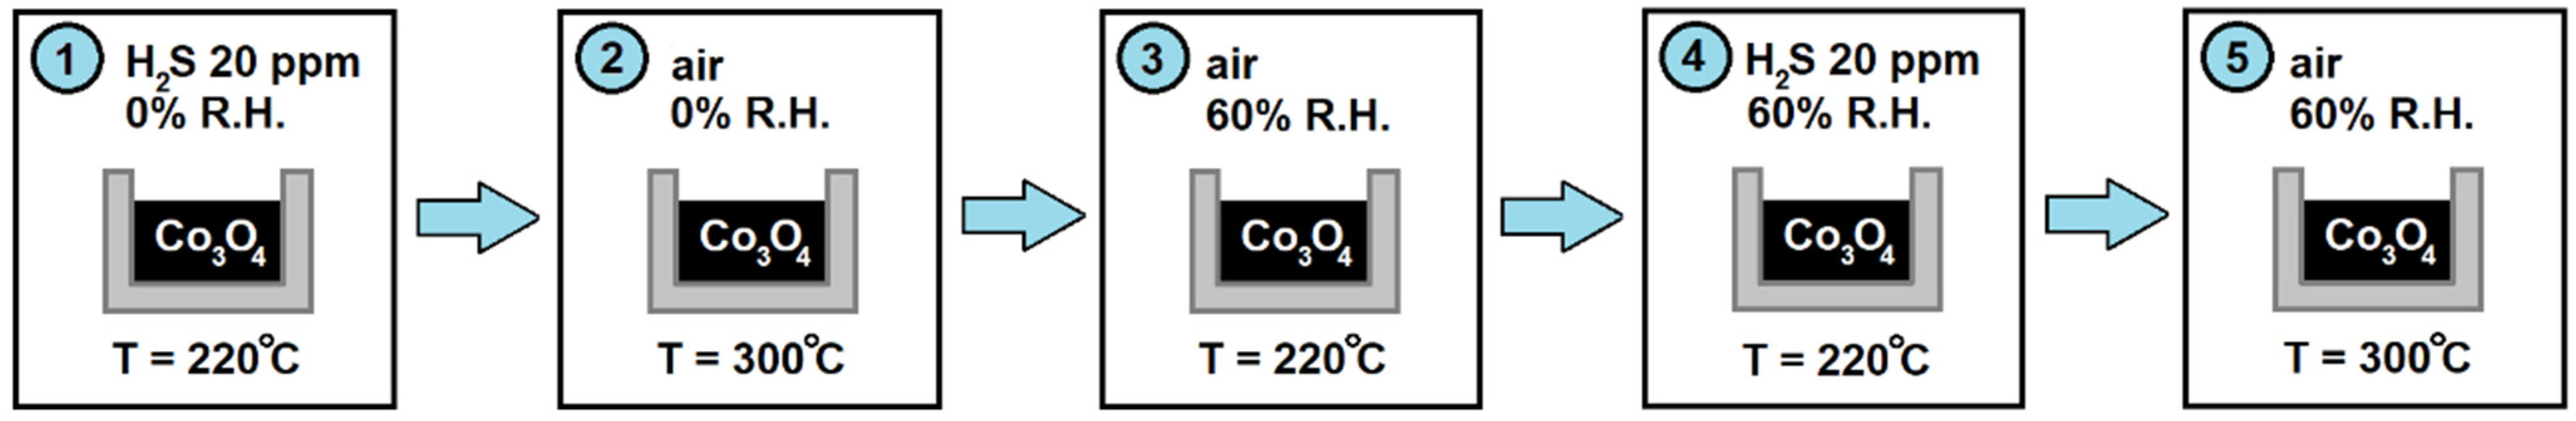
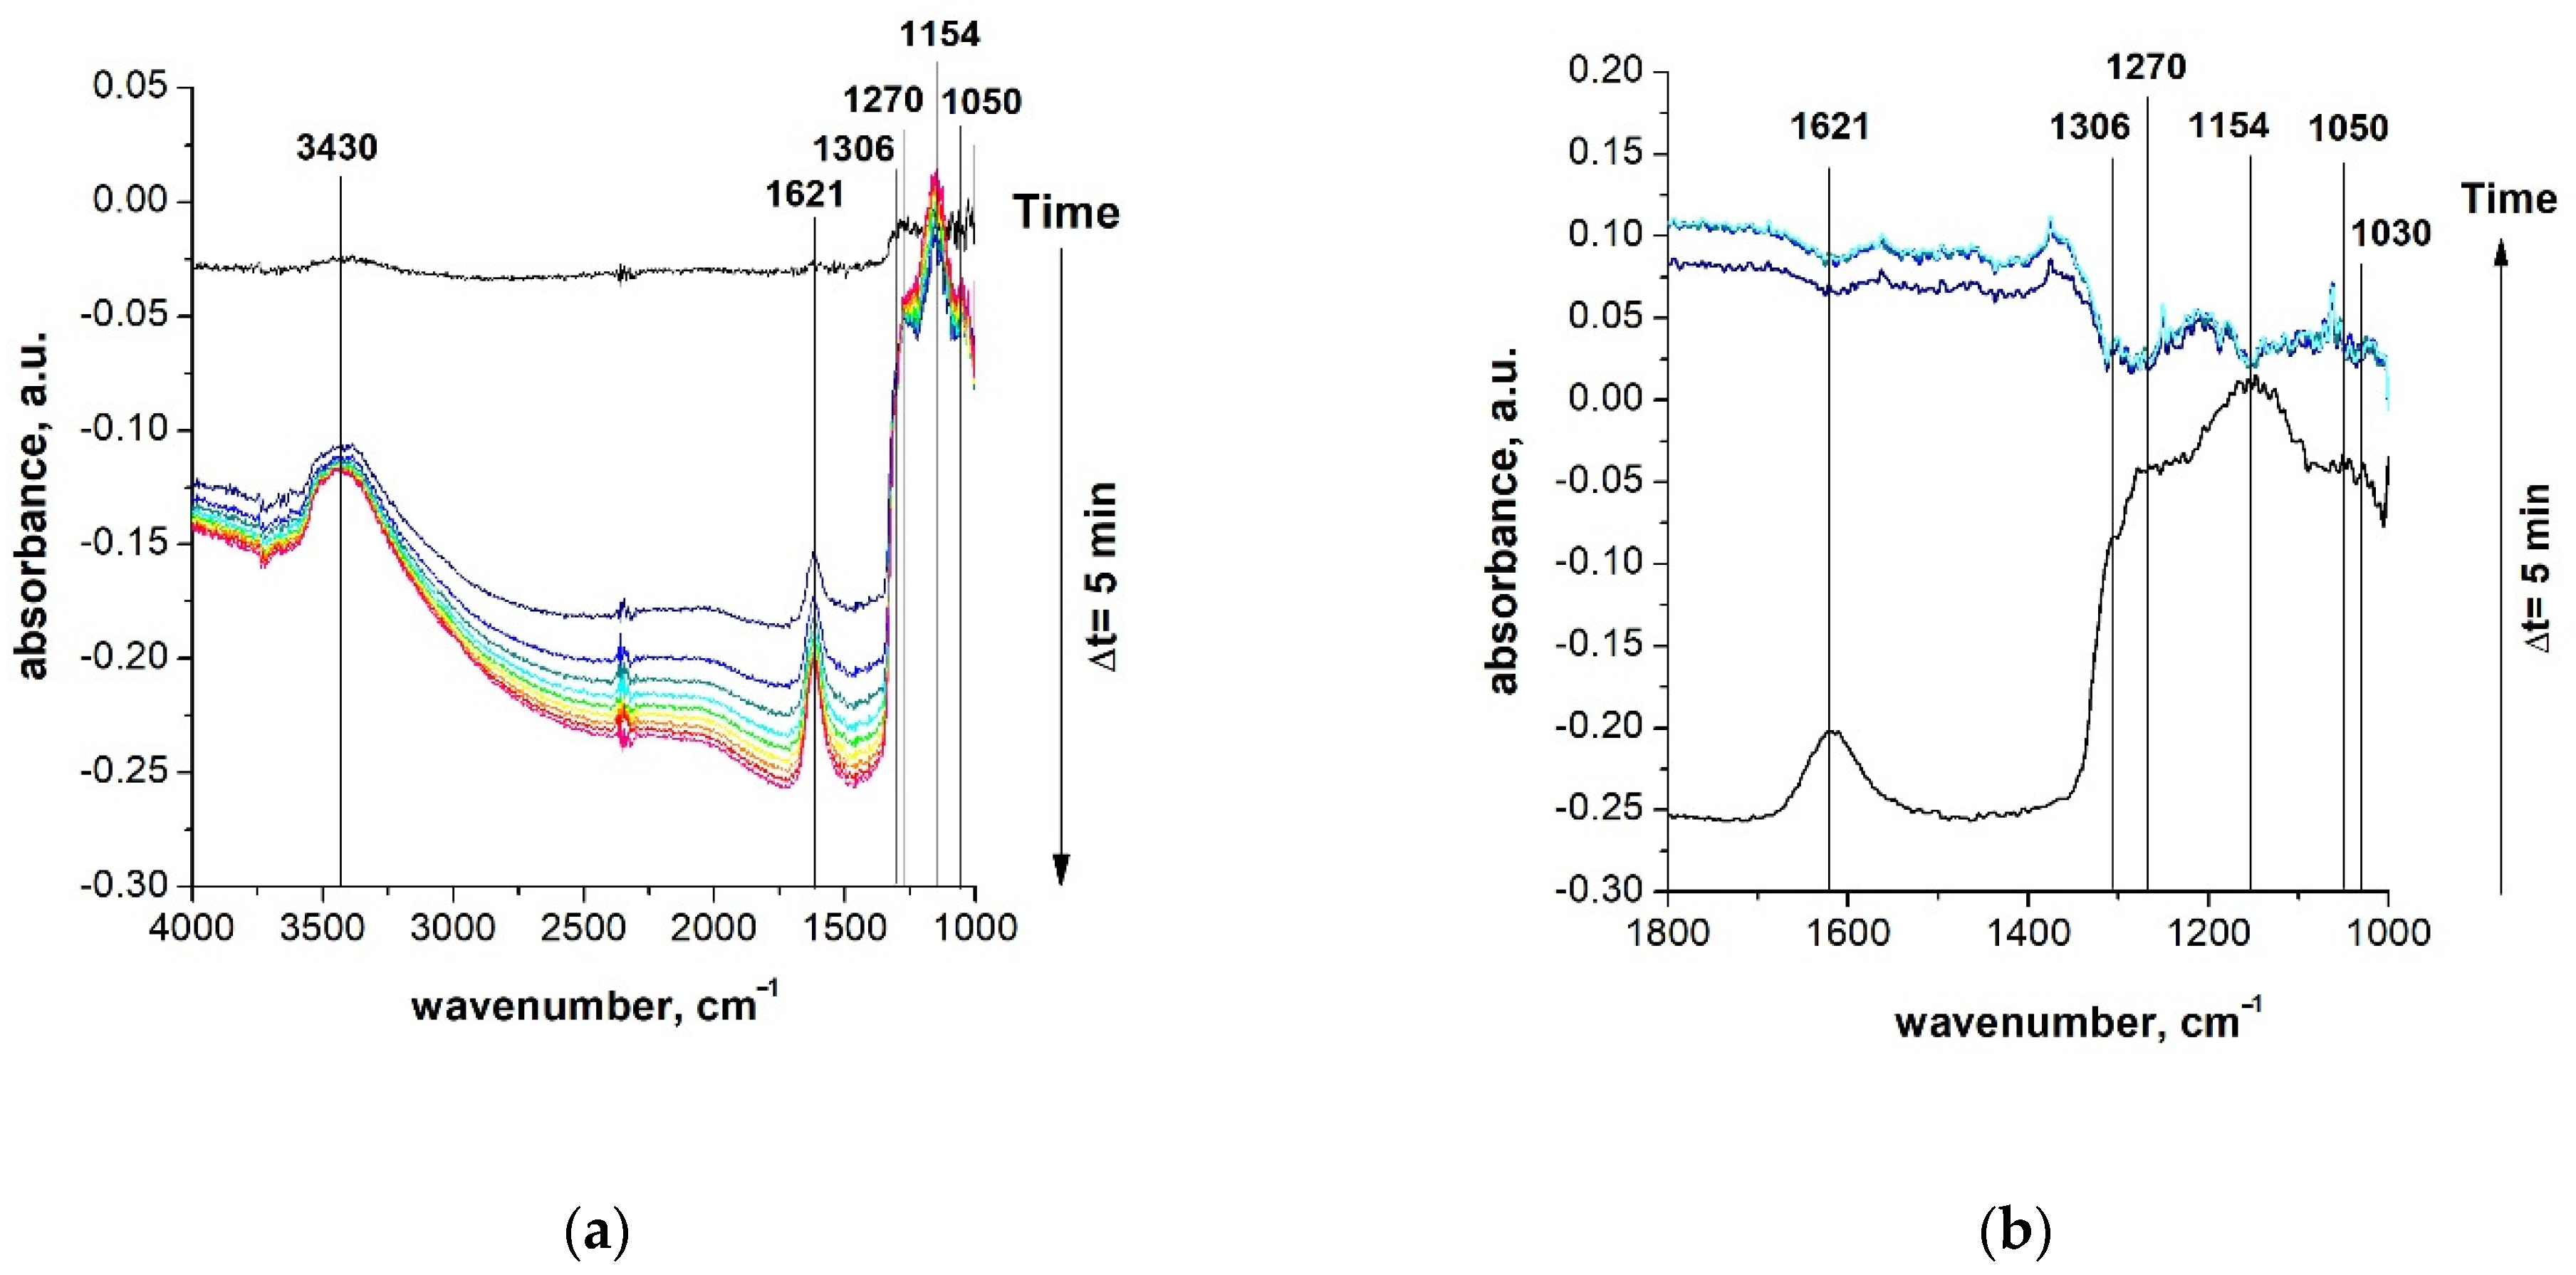
3.3.1. Interaction of Co3O4 with H2S in Dry Air

During adsorption of the hydrogen sulfide on the Co3O4 surface in dry air at the temperature of the maximum sensor signal, there was no absorption bands in the region of 2560–2580 cm−1 related to characteristic ν(SH) bands of adsorbed hydrogen sulfide molecules on the DRIFT spectra (Figure 9a) [23]. This fact indicates rapid oxidation of H2S on the cobalt oxide surface, which can occur with the participation of chemisorbed oxygen or hydroxyl groups:
2H2S(g) + 3O22− → 2SO2(g) + 2H2O + 6e,
H2S(g) + 6OH → SO2(g) + 4H2O + 6e.
The products of H2S oxidation appeared in the form of a complex absorption band at 1380–1000 cm−1, which can correspond to S–O vibrations in sulfates, sulfites or adsorbed SO2 [24,25,26,27,28]. Oxidation products, as well as adsorbed water molecules (1616 cm−1) and hydroxyl groups (broad band at 3400 cm−1) accumulated on the oxide surface during the experiment. The decreasing signal at 1530 cm−1 corresponds to surface nitrates (from the precursor [26]) consumed in the oxidation of hydrogen sulfide.
A more detailed analysis of changes in spectra over time, as well as varying temperature and humidity, allowed the determination of the composition of the oxidation products. Firstly, the bands at 1330, 1290, 1154 cm−1 and the vibrational mode of hydroxyl groups were observed. Then, there was a sharp increase in the intensity of the bands at 1290 and 1154 cm−1 and the appearance of the water signal and bands at 1124 and 1030 cm−1. With an increase in temperature to 300 °C in a flow of dry air (Figure 9b), a new signal appeared at 1340 cm−1, and the intensity of the remaining bands decreased. However, complete desorption of the products was not observed. In the presence of moisture (Figure 9c), the band at 1340 cm−1 disappeared, but the intensities of signals at 1290, 1154 cm−1 increased.
The low-frequency signal at 1030 cm−1 can be attributed to sulfite groups, which are formed through the SO2 adsorption on the basic O2 centers (Figure 10a) on the oxides surface [23,28]. Under humid conditions, the adsorption of SO2 also occurs on hydroxyl groups, resulting in the formation of HSO3 groups (Figure 10b). Thus, the bands at 1290 and 1154 cm−1 should be attributed to hydrosulfite groups, which correlates with the frequencies reported for HSO3 on zeolites [23,29]. The absorption at 1330 cm−1, which is close to the asymmetric vibrations (νas) O=S=O, is probably associated with weakly chemisorbed SO2 [27].
Temperature resistant bands at 1340 and 1124 cm−1 probably correspond to surface sulfate species [24,25], which were formed upon further oxidation of SO2 or sulfites:
SO32− + O22− → SO42− + H2O + 2e.

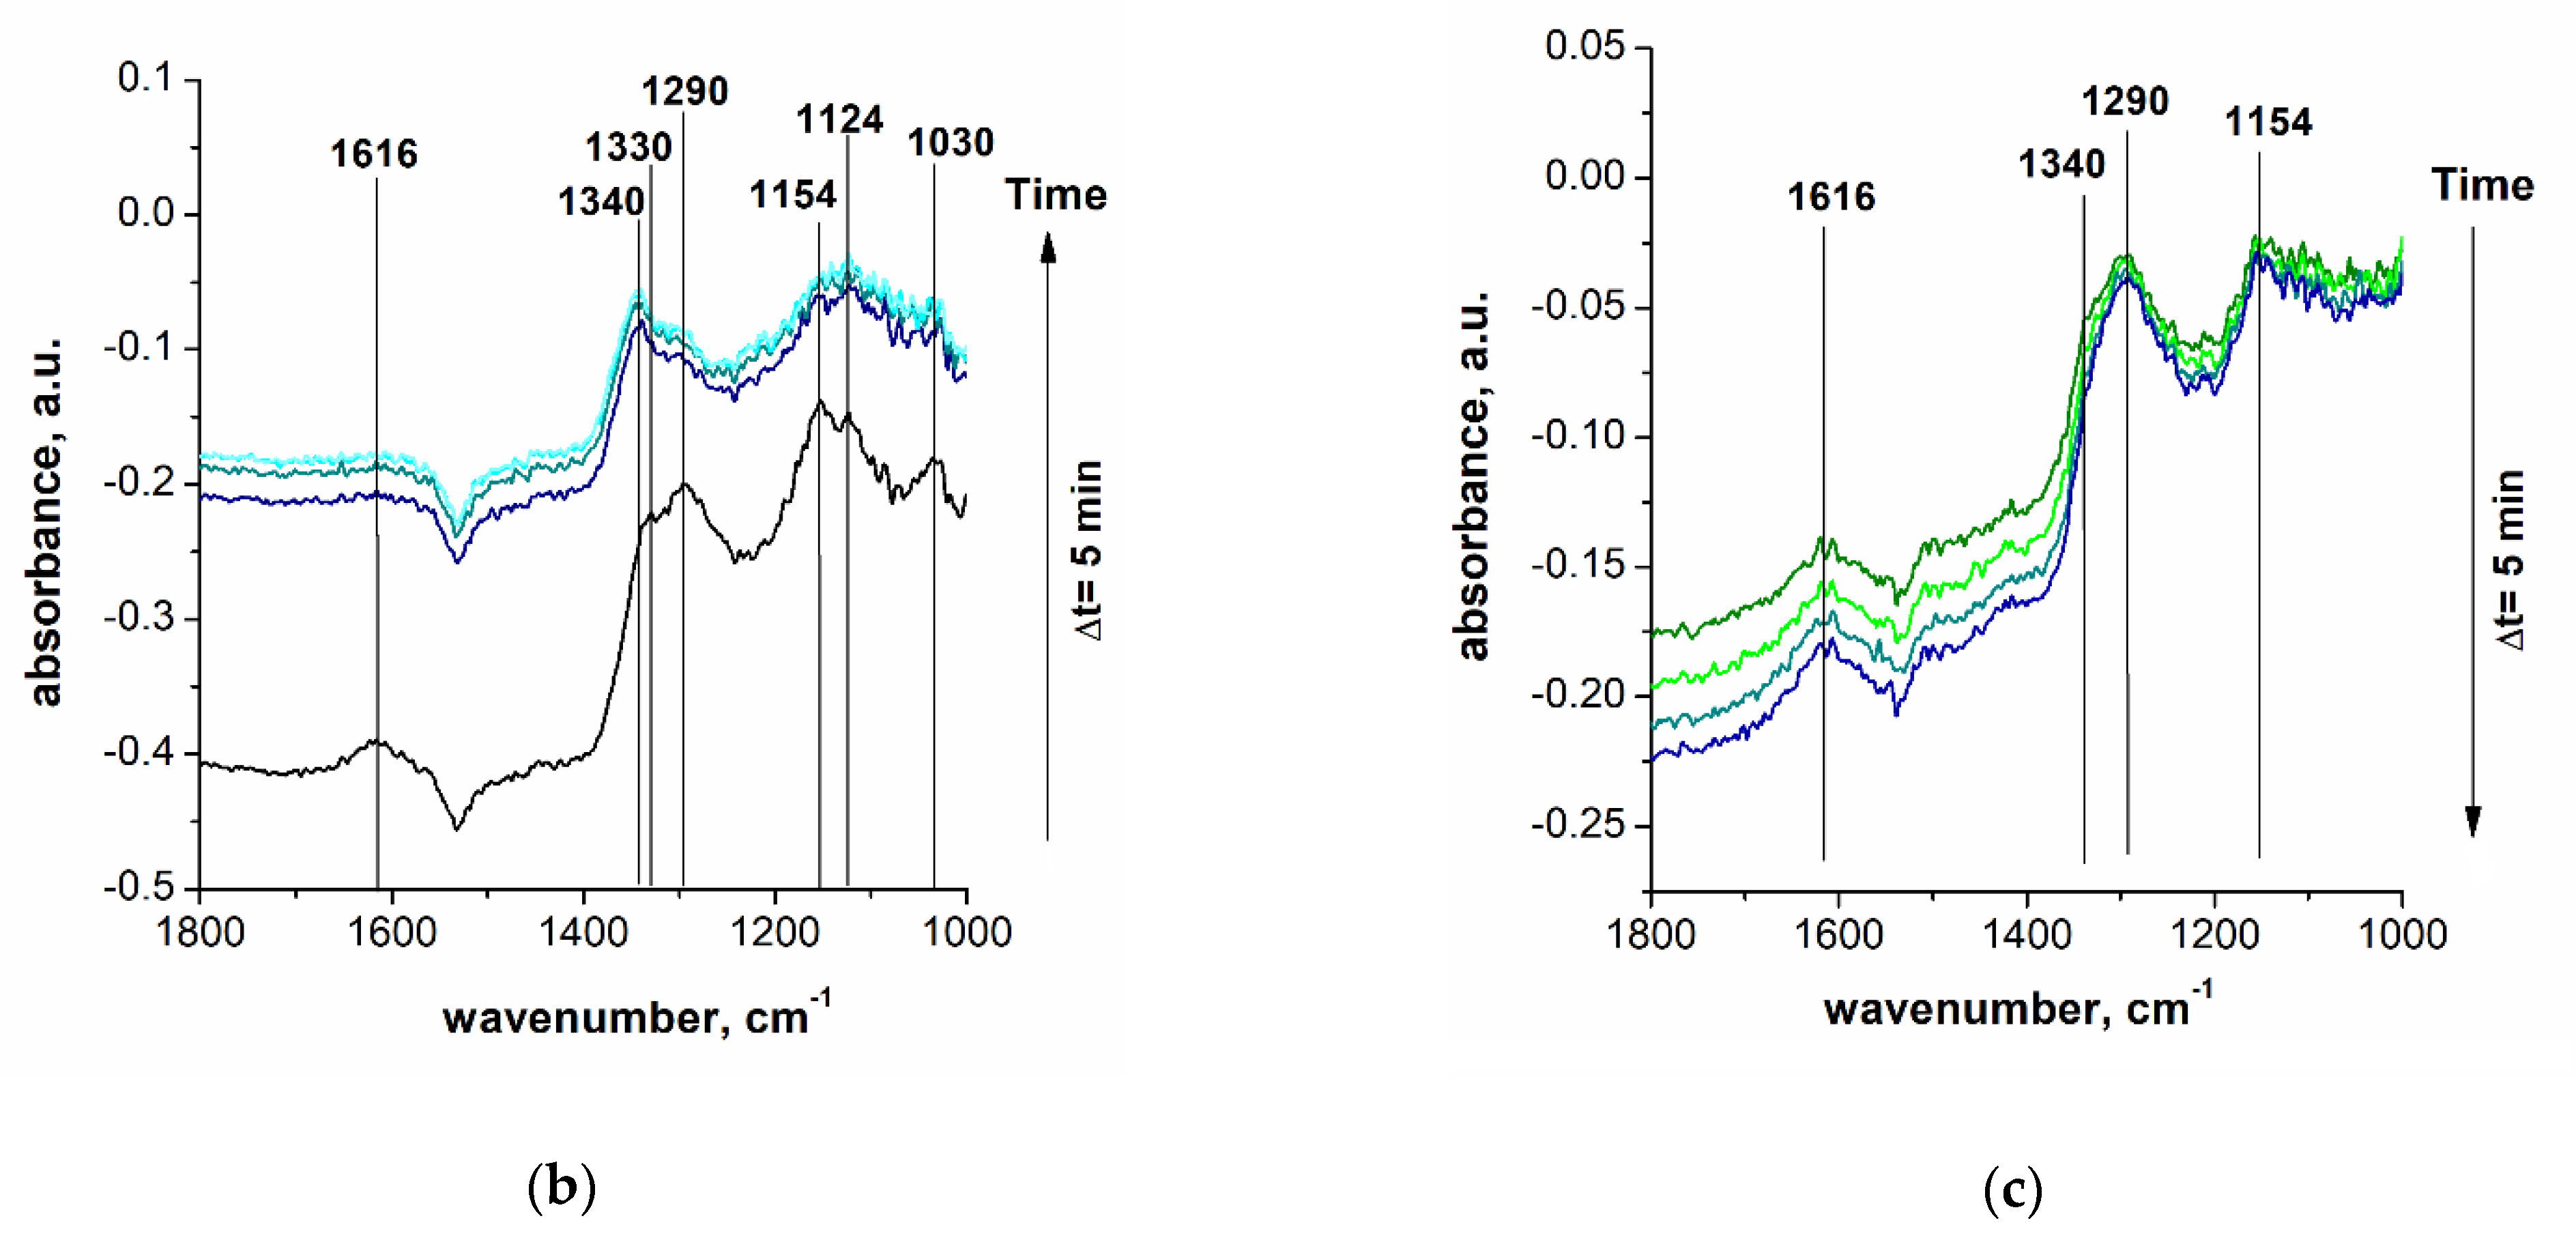
3.3.2. Interaction of Co3O4 with H2S in Humid Air

DRIFT spectra of Co3O4 in a flow of H2S in humid air (Figure 11a) are characterized by intense absorption bands of water (1621 cm−1) and broad bands of hydroxyl groups (3430 cm−1).
In the flow of hydrogen sulfide, there was a rapid accumulation of hydrosulfite groups (1270 and 1154 cm−1), as well as sulfites (1050 and 1030 cm−1). The shoulder at 1306 cm−1 corresponds to weakly bounded SO2 molecules [27].
Upon further annealing at 300 °C in humid air (Figure 11b), a rapid disappearance of the oxidation products signals was observed. The negative absorption bands (1306, 1270, and 1154 cm−1) indicate decomposition of the sulfite groups remained on the cobalt oxide surface after supplying H2S in dry air. Thus, the catalytic effect of water on the decomposition of surface sulfite groups takes place (Figure 12).

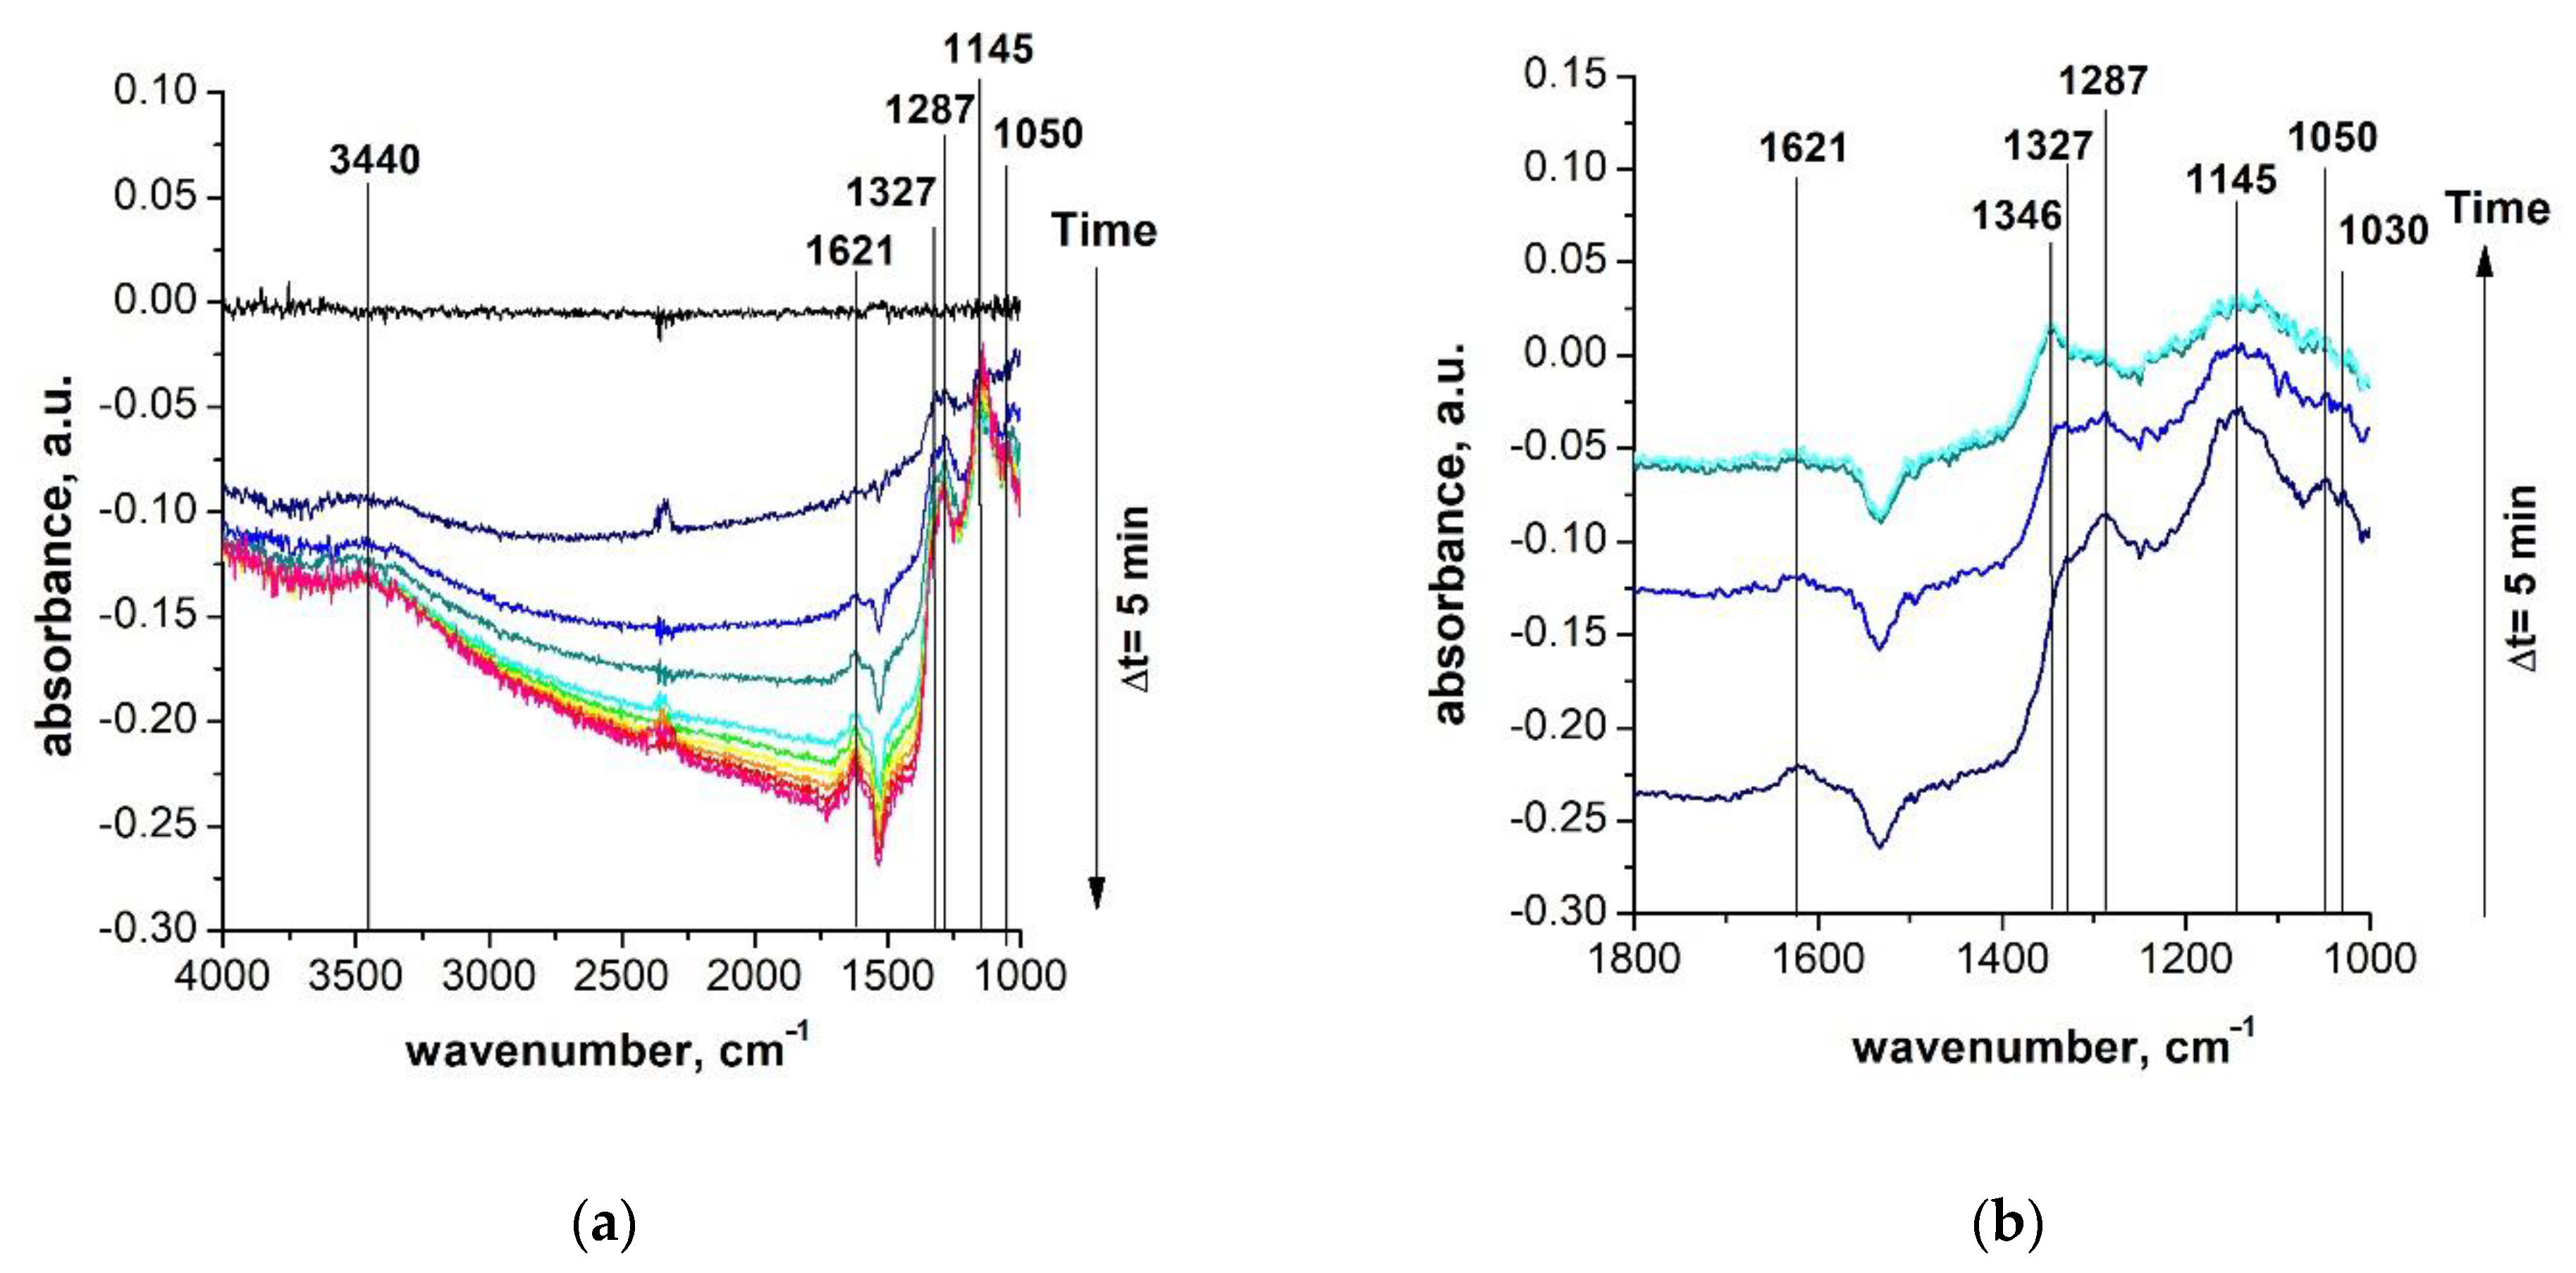
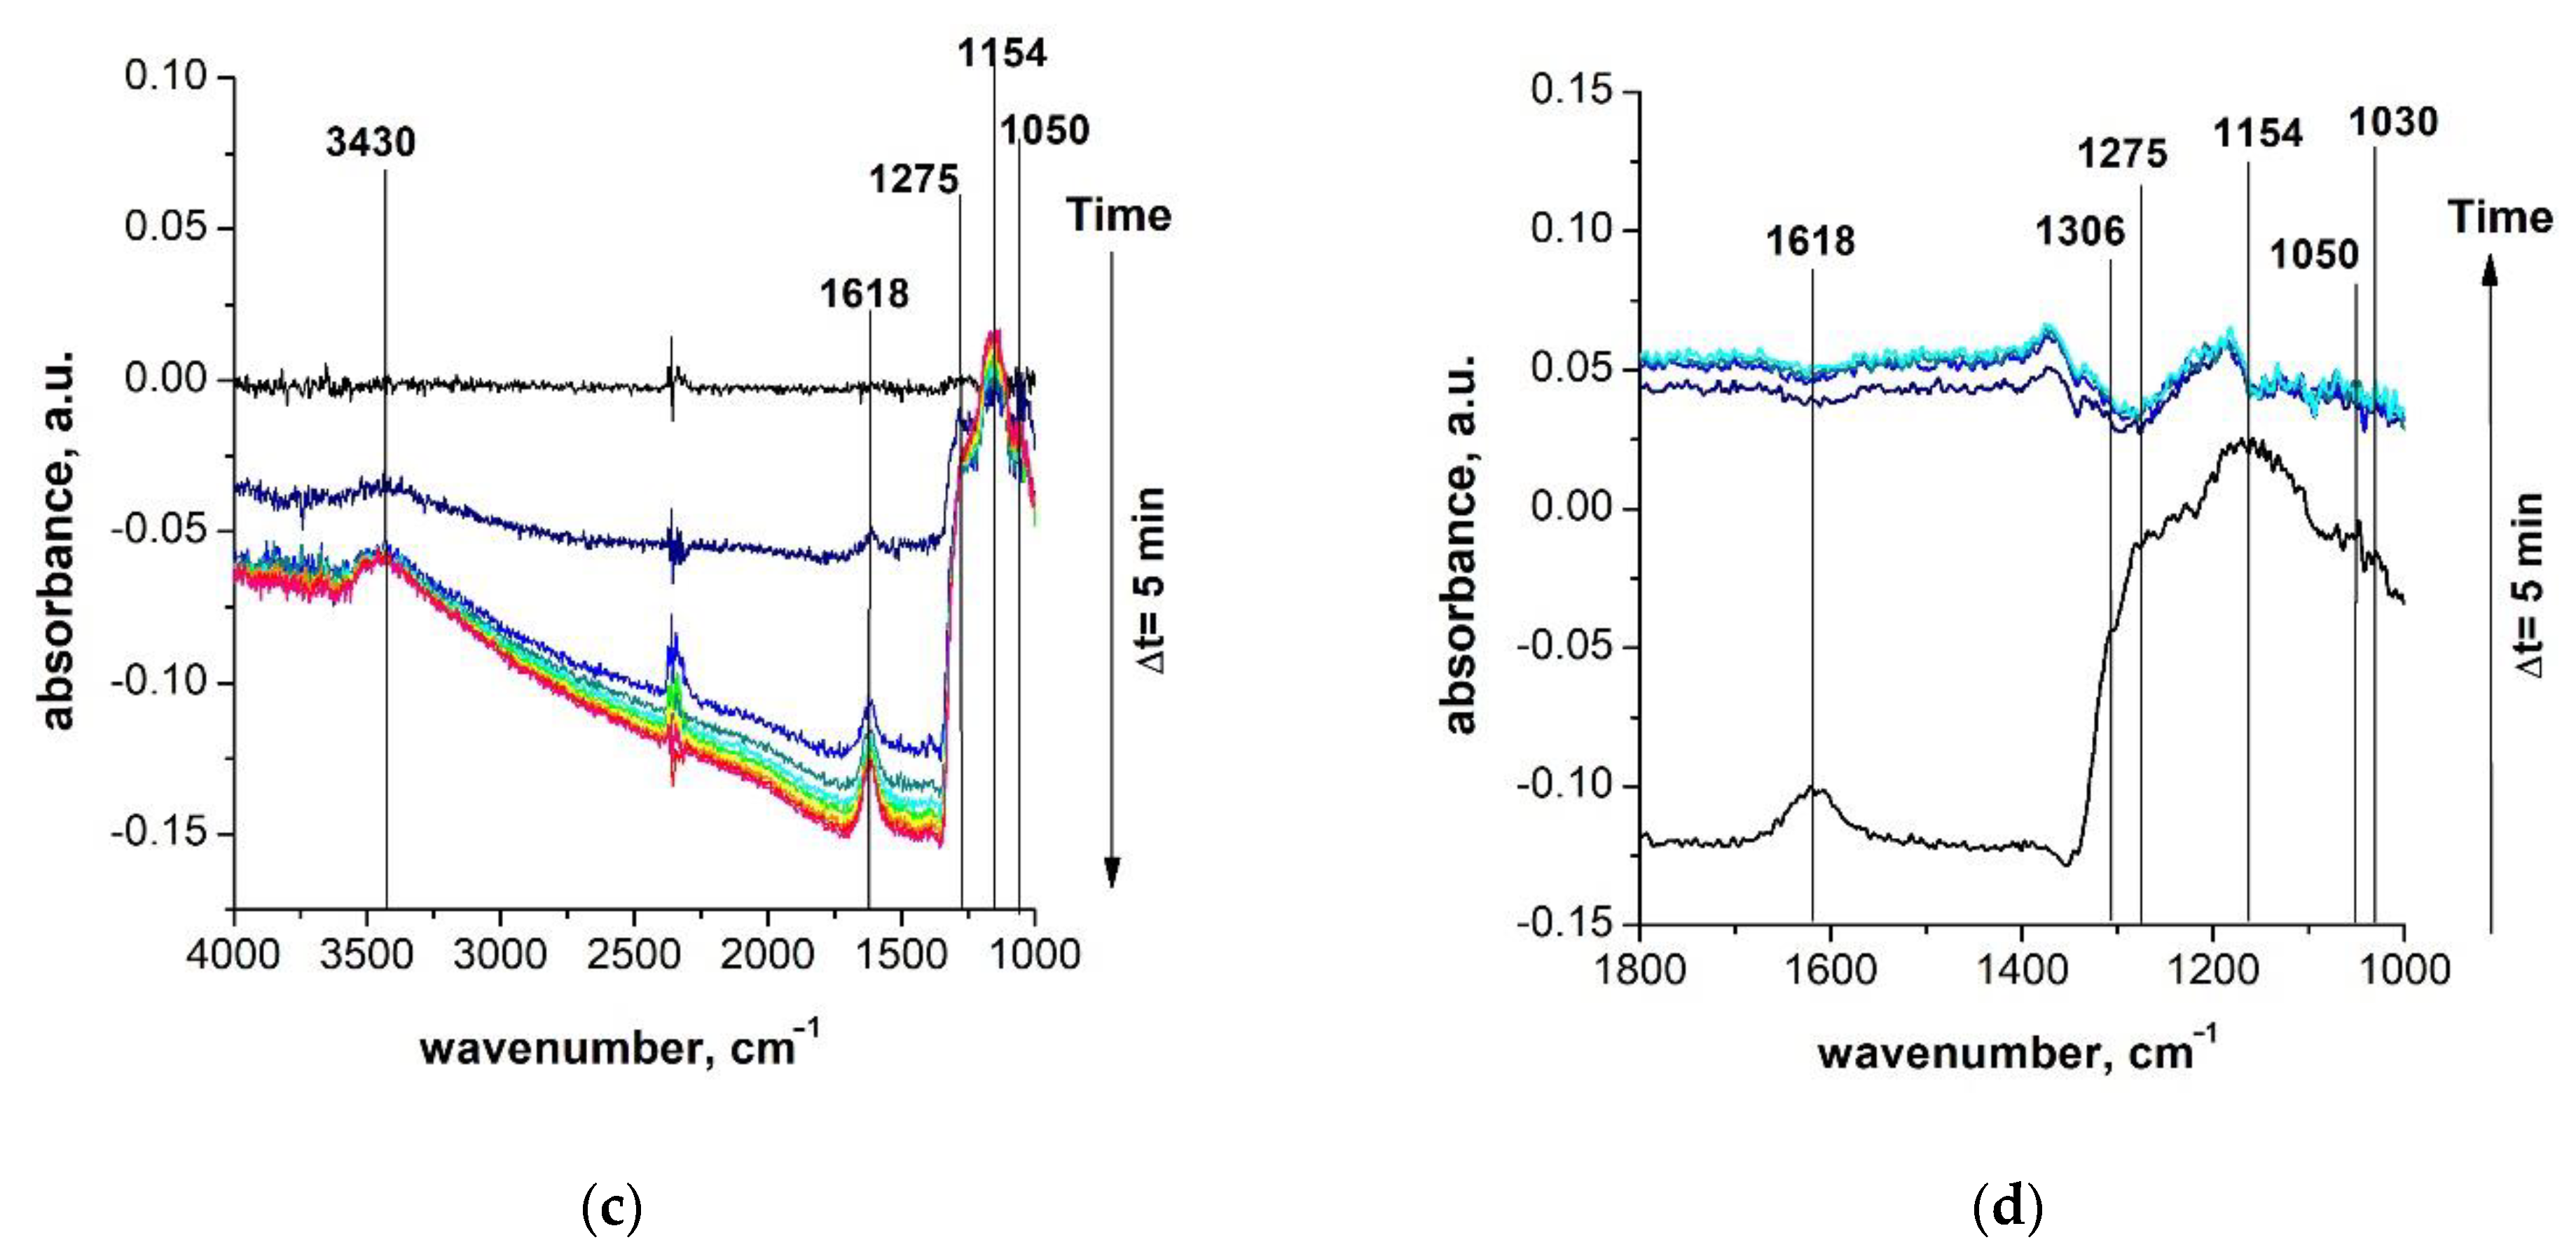
3.3.3. Interaction of Ni0.1Co2.9O4 with H2S in Dry and Humid Air

In order to investigate the influence of Ni addition on the reactivity of Co3O4 with H2S, the Ni0.1Co2.9O4 sample has been chosen for DRIFT investigation. This sample has the maximum nickel content, which can significantly affect the surface active centers. DRIFT spectra of Ni0.1Co2.9O4 (Figure 13) obtained at the same conditions are similar to those for Co3O4.
Comparing the absorption modes of Ni0.1Co2.9O4 with Co3O4 spectra (Table 3), a shift to the low-frequency region of a number of bands was noticed. In general, the introduction of nickel into the structure did not distinctly affect the H2S oxidation process and the adsorption of products on the sample surface.

3.3.4. DRIFT Spectra Baseline Absorption and Sensor Signal

For semiconductor compounds, part of the infrared absorption occurs on free carriers. From the Drude-Zener theory it can be shown [30,31] that the absorption at a given wavelength A(λ) is directly related to the electrical conductivity of the material:
A(λ) = σ(λ)z/ε0 c n,
where σ (λ) is the electrical conductivity depending on the wavelength, z is the thickness of the sample, ε0 is the permittivity of the vacuum, c is the velocity of light, and n is the refractive index of the material.
Since the DRIFT spectra were recorded on the same sample, the change in the baseline intensity is associated with a change in the electrical conductivity of the sample, and hence its resistance. This allows us to relate the change in the absorption intensity of the baseline (Figure 14) and the resistance of the samples in the sensor experiments. Moreover, the change in resistance in both cases was caused by the processes of oxidation of hydrogen sulfide and adsorption of products on the surface of oxides.
As follows from the change in the absorption value at 2000 cm−1, for both Co3O4 and Ni0.1Co2.9O4 in a flow of hydrogen sulfide in dry air, the saturation electrical conductivity was lower (the resistance was higher) than in humid conditions. This means that for a long time of H2S supply, the sensor signal should be higher in dry air. However, the conductivity curve for Co3O4 in humidity reaches saturation faster especially at short times (less than 10 min). The observed sensor signal (measurement for 15 min) turns out to be higher in humid air. It should be noted that the concentration of hydrogen sulfide for recording DRIFT spectra (20 ppm) is significantly higher than for sensor measurements (1 ppm) due to the different sensitivity of the methods. This should lead to an increase in the rate of all processes associated with H2S in the DRIFT experiment.
A decrease in the sensor response time τ90 also indicates the processes of the sensor signal formation for Co3O4 in humid air are faster (Figure 15a).
In the case of Ni0.1Co2.9O4, the response time to H2S τ90 is the same in both dry and humid air, and coincides with that for Co3O4 in humidity. At the early times, the sensor signal of Ni0.1Co2.9O4 in dry air grows even a little faster (Figure 15b). Similar trends can be seen in the DRIFT spectra (Figure 14b).
For both samples, the baseline of DRIFT spectra in dry air after the annealing cycle does not return to the initial value (Figure 14). That indicates the accumulation of sulfite and sulfate groups on the sensor surface during the detection cycles. Whereas, the sensor completely restores its original resistance in humid conditions. The observed increase in conductivity (decrease in resistance) is caused by the remove of sulfite groups during the annealing in dry air and by the increase in temperature.

4. Conclusions

In dry air, the surface of Co3O4 and Ni0.1Co2.9O4 is partially covered by chemisorbed oxygen species and a relatively small number of hydroxyl groups, which can act as oxidants. Therefore, during H2S interaction with the oxide surface, the predominant process of the oxidation is due to chemisorbed oxygen according to reaction (2), leading to the formation of SO2 and water. This process increases the number of electrons (minority charge carriers) in the conduction band, and the resistance grows. The resulting water adsorbs on the surface and dissociates with the formation of new hydroxyl groups. On the one hand, hydroxyl groups are oxidizing agents and, on the other hand, they are more favorable as SO2 adsorption centers than oxygen. Further oxidation of surface sulfites to sulfates by reaction (4) serves as an additional source of electrons, which increases the sensor signal at long times. In our previous work [19], it was shown that the concentration of chemisorbed oxygen on the surface of Ni0.1Co2.9O4 is lower than on Co3O4. This leads to a slowdown in the rate of reaction (2) and, as a result, led to a decrease in sensor signal toward 1 ppm H2S with increase in Ni content.
In humid air, during dissociative adsorption of water molecules, the concentration of hydroxyl groups increases on the surface of oxides. Reactivity of the surface hydroxyl groups leads to an increase of the sensor signal with increasing of the relative humidity. The decrease in the sensor response time τ90 for Co3O4 in humid air indicates the acceleration of H2S oxidation due to a change in the reaction mechanism, which is most likely realized with the participation of hydroxyl groups (3). The saturation state is reached when all surface hydroxyl groups are converted to hydrosulfites by reacting with SO2. In this case, no further oxidation to sulfates was observed.
The sensor response time τ90 for Ni0.1Co2.9O4 in both dry and humid air coincides in value with that for Co3O4 in humid air. This may indicate the participation of hydroxyl groups in the oxidation of hydrogen sulfide in both cases and the predominant of the reaction (3). In this case, an increase in the sensor signal in humidity is most likely caused by an increase in the concentration of hydroxyl groups. The signals of sulfate groups in the DRIFT spectra for Ni0.1Co2.9O4 in dry air are less pronounced than for Co3O4, which also indicates that the oxidation of sulfites to sulfates occurs due to chemisorbed oxygen rather than hydroxyl groups.

Author Contributions

Conceptualization, M.R. and A.G.; methodology, M.R., K.P., A.N. and S.V.; formal analysis, K.P. and S.V.; investigation, K.P., A.N. and S.V.; data curation, K.P., A.N. and S.V.; supervision, M.R.; writing—original draft preparation, K.P. and M.R.; writing—review and editing, M.R. and A.G. All authors have read and agreed to the published version of the manuscript.

Funding

This research was funded by RFBR, grant number 18-03-00580.

Institutional Review Board Statement

Not applicable.

Informed Consent Statement

Not applicable.

Data Availability Statement

The data presented in this study are available on request from the corresponding author. The data are not publicly available due to privacy reason.

Acknowledgments

The DRIFT spectral experiments were carried out using the equipment purchased by funds of Lomonosov Moscow State University Program of the Development.

Conflicts of Interest

The authors declare no conflict of interest.

References

  1. Dey, A. Semiconductor metal oxide gas sensors: A review. Mater. Sci. Eng. B 2018, 229, 206–217. [Google Scholar] [CrossRef]
  2. Korotcenkov, G. Metal oxides for solid-state gas sensors: What determines our choice? Mater. Sci. Eng. B 2007, 139, 1–23. [Google Scholar] [CrossRef]
  3. Llobet, E.; Brunet, J.; Pauly, A.; Ndiaye, A.; Varenne, C. Nanomaterials for the Selective Detection of Hydrogen Sulfide in Air. Sensors 2017, 17, 391. [Google Scholar] [CrossRef] [PubMed]
  4. Advani, G.N.; Nanis, L. Effects of humidity on hydrogen sulfide detection by SnO2 solid state gas sensors. Sens. Actuators 1981, 2, 201–206. [Google Scholar] [CrossRef]
  5. Grossmann, K.; Pavelko, R.G.; Barsan, N.; Weimar, U. Interplay of H2, water vapor and oxygen at the surface of SnO2 based gas sensors—An operando investigation utilizing deuterated gases. Sens. Actuators B Chem. 2012, 166, 787–793. [Google Scholar] [CrossRef]
  6. Staerz, A.; Berthold, C.; Russ, T.; Wicker, S.; Weimar, U.; Barsan, N. The oxidizing effect of humidity on WO3 based sensors. Sens. Actuators B Chem. 2016, 237, 54–58. [Google Scholar] [CrossRef]
  7. Platonov, V.; Rumyantseva, M.; Khmelevsky, N.; Gaskov, A. Electrospun ZnO/Pd Nanofibers: CO Sensing and Humidity Effect. Sensors 2020, 20, 7333. [Google Scholar] [CrossRef]
  8. Wang, Y.; Duan, G.; Zhu, Y.; Zhang, H.; Xu, Z.; Dai, Z.; Cai, W. Room temperature H2S gas sensing properties of In2O3 micro/nanostructured porous thin film and hydrolyzation-induced enhanced sensing mechanism. Sens. Actuators B Chem. 2016, 228, 74–84. [Google Scholar] [CrossRef]
  9. Itoh, T.; Matsubara, I.; Tamaki, J.; Kanematsu, K.; Shin, W.; Izu, N.; Nishibori, M. Effect of high-humidity aging on performance of tungsten oxide-type aromatic compound sensors. Sens. Mater. 2012, 24, 13–19. [Google Scholar]
  10. Shalev, G. The Electrostatically Formed Nanowire: A Novel Platform for Gas-Sensing Applications. Sensors 2017, 17, 471. [Google Scholar] [CrossRef] [PubMed] [Green Version]
  11. Henning, A.; Molotskii, M.; Swaminathan, N.; Vaknin, Y.; Godkin, A.; Shalev, G.; Rosenwaks, Y. Electrostatic Limit of Detection of Nanowire-Based Sensors. Small 2015, 11, 4931–4937. [Google Scholar] [CrossRef]
  12. Arshak, K.; Moore, E.; Lyons, G.; Harris, J.; Clifford, S. A review of gas sensors employed in electronic nose applications. Sens. Rev. 2004, 24, 181–198. [Google Scholar] [CrossRef] [Green Version]
  13. Urasińska-Wójcik, B.; Gardner, J.W. H2S Sensing in Dry and Humid H2 Environment With p-Type CuO Thick-Film Gas Sensors. IEEE Sens. J. 2018, 18, 3502–3508. [Google Scholar] [CrossRef]
  14. Schwarz, M.; Faisal, F.; Mohr, S.; Hohner, C.; Werner, K.; Xu, T.; Skála, T.; Tsud, N.; Prince, K.C.; Matolín, V.; et al. Structure-Dependent Dissociation of Water on Cobalt Oxide. J. Phys. Chem. Lett. 2018, 9, 2763–2769. [Google Scholar] [CrossRef] [PubMed]
  15. Liotta, L.F.; Wu, H.; Pantaleo, G.; Venezia, A.M. Co3O4 nanocrystals and Co3O4–MOx binary oxides for CO, CH4 and VOC oxidation at low temperatures: A review. Catal. Sci. Technol. 2013, 3, 3085–3102. [Google Scholar] [CrossRef]
  16. Baidya, T.; Murayama, T.; Nellaiappan, S.; Katiyar, N.K.; Bera, P.; Safonova, O.; Lin, M.; Priolkar, K.R.; Kundu, S.; Rao, B.S. Ultra-low-temperature CO oxidation activity of octahedral site cobalt species in Co3O4 based catalysts: Unravelling the origin of the unique catalytic property. J. Phys. Chem. C 2019, 123, 19557–19571. [Google Scholar] [CrossRef]
  17. Wang, H.-F.; Kavanagh, R.; Guo, Y.-L.; Guo, Y.; Lu, G.; Hua, P. Origin of extraordinarily high catalytic activity of Co3O4 and its morphological chemistry for CO oxidation at low temperature. J. Catal. 2012, 296, 110–119. [Google Scholar] [CrossRef]
  18. Wang, Z.; Wang, W.; Zhang, L.; Jiang, D. Surface oxygen vacancies on Co3O4 mediated catalytic formaldehyde oxidation at room temperature. Catal. Sci. Technol. 2015, 6, 3845–3853. [Google Scholar] [CrossRef]
  19. Vladimirova, S.A.; Prikhodko, K.Y.; Rumyantseva, M.N.; Konstantinova, E.A.; Chizhov, A.S.; Khmelevsky, N.O.; Gaskov, A.M. Nanocrystalline complex oxides NixCo3-xO4: Cations distribution impact on electrical and gas sensor behavior. J. Alloys Compd. 2020, 828, 154420. [Google Scholar] [CrossRef]
  20. Krotova, A.; Prikhodko, K.; Vladimirova, S.; Filatova, D. Determination of nickel, zinc and cobalt in advanced materials based on NixCo3-xO4and ZnxCo3-xO4by inductively coupled plasma mass spectrometry (ICP-MS) and X-Ray fluorescence. Inorg. Mater. 2019, 55, 1343–1346. [Google Scholar] [CrossRef]
  21. Chizhov, A.; Rumyantseva, M.; Vasiliev, R.; Filatova, D.; Drozdov, K.; Krylov, I.; Marchevsky, A.; Karakulina, O.; Abakumov, A.; Gaskov, A. Visible light activation of room temperature NO2 gas sensors based on ZnO, SnO2 and in 2O3 sensitized with CdSe quantum dots. Thin Solid Film. 2016, 618, 253–262. [Google Scholar] [CrossRef]
  22. World Health Organization (WHO). Air Quality Guidelines for Europe, 2nd ed.; WHO Regional Publications: Copenhagen, Denmark, 2000; Volume 91. [Google Scholar]
  23. Davydov, A. Molecular Spectroscopy of Oxide Catalyst Surfaces; Wiley: Hoboken, NJ, USA, 2003; pp. 139–157. [Google Scholar]
  24. Kataoka, S.; Lee, E.; Tejedor-Tejedor, M.I.; Anderson, M.A. Photocatalytic degradation of hydrogen sulfide and in situ FT-IR analysis of reaction products on surface of TiO2. Appl. Catal. B Environ. 2005, 61, 159–163. [Google Scholar] [CrossRef]
  25. Piéplu, A.; Saur, O.; Lavalley, J.-C. IR Study of H2S and SO2 Adsorption on Ferric Oxide. Prog. Fourier Transform. Spectrosc. 1997, 14, 707–709. [Google Scholar] [CrossRef]
  26. Jin, T.; Machida, M.; Yamaguchi, T.; Tanabe, K. Infrared study of sulfur-containing iron oxide. Behavior of sulfur during reduction and oxidation. Inorg. Chem. 1984, 23, 4396–4398. [Google Scholar] [CrossRef]
  27. Wang, J.; Chen, L.; Ballesteros, R.L.; de la Fuente, J.M.; Domínguez, J. Evaluation of crystalline structure and SO2 storage capacity of a series of composition-sensitive De-SO2 catalysts. J. Mol. Catal. A Chem. 2003, 194, 181–193. [Google Scholar] [CrossRef]
  28. Waqif, M.; Saad, A.M.; Bensitel, M.; Bachelier, J.; Saur, O.; Lavalley, J.-C. Comparative study of SO2 adsorption on metal oxides. J. Chem. Soc. Faraday Trans. 1992, 88, 2931–2936. [Google Scholar] [CrossRef]
  29. Laniecki, M.; Ziolek, M.; Karge, H.G. Effect of water on the formation of HSO3—Ions upon SO2 adsorption onto Faujasite-type zeolites. J. Phys. Chem. 1987, 91, 4–6. [Google Scholar] [CrossRef]
  30. Baraton, M.-I.; Merhari, L. Determination of the gas sensing potentiality of nanosized powders by FTIR spectrometry. Scr. Mater. 2001, 44, 1643–1648. [Google Scholar] [CrossRef]
  31. Du, X.; Du, Y.; George, S.M. CO Gas Sensing by Ultrathin Tin Oxide Films Grown by Atomic Layer Deposition Using Transmission FTIR Spectroscopy. J. Phys. Chem. A 2008, 112, 9211–9219. [Google Scholar] [CrossRef]
Figure 1. The dissociation of water molecule on Co3O4 surface.
Chemosensors 09 00034 g001
Figure 2. Formation of ROS on the Co3O4 surface.
Chemosensors 09 00034 g002
Figure 3. Diffuse-reflectance infrared Fourier-transform spectroscopy (DRIFTS) experimental scheme for Co3O4.
Chemosensors 09 00034 g003
Figure 4. TEM image of Co3O4.
Chemosensors 09 00034 g004
Figure 5. Dynamic response of Co3O4 and NixCo3−xO4 based gas sensors in the periodic presence of H2S (1 ppm): (a) in dry air at 210 °C; (b) in humid air (60% R.H.) at 90–300 °C.
Chemosensors 09 00034 g005
Figure 6. (a) The temperature dependence of the sensor signal at the range of 90–300 °C in the presence of H2S (1 ppm) in dry air; (b) Dependence of the sensor signal value on the concentration of H2S at 210 °C in dry air.
Chemosensors 09 00034 g006
Figure 7. (a) The temperature dependence of the sensor signal of Co3O4 at the range of 90–300 °C in the presence of H2S (1 ppm) at different air humidity (0, 20, 60% R.H.); (b) Dependence of the sensor signal of Co3O4 and NixCo3−xO4 on air humidity at 240 °C toward 1 ppm H2S.
Chemosensors 09 00034 g007
Figure 8. The sensor signal toward 1 ppm H2S, 20 ppm NH3, 20 ppm CO (divided by gas concentration) of Co3O4 and NixCo3−xO4 at 210 °C (a) 0% R.H. (b) 30% R.H.
Chemosensors 09 00034 g008
Figure 9. Co3O4 DRIFT spectra: (a) 20 ppm H2S in dry air at 220 °C; (b) Annealing in dry air at 300 °C; (c) Humid air (60% R.H.) at 220 °C.
Chemosensors 09 00034 g009aChemosensors 09 00034 g009b
Figure 10. SO2 adsorption on the Co3O4 surface: (a) on O2 centers; (b) on hydroxyl groups.
Chemosensors 09 00034 g010
Figure 11. Co3O4 DRIFT spectra: (a) 20 ppm H2S in humid air (60% R.H.) at 220 °C; (b) Annealing in humid air (60% R.H.) at 300 °C.
Chemosensors 09 00034 g011
Figure 12. Decomposition of sulfites on Co3O4 in the presence of water.
Chemosensors 09 00034 g012
Figure 13. Ni0.1Co2.9O4 DRIFT spectra: (a) 20 ppm H2S in dry air at 220 °C; (b) Annealing in dry air at 300 °C; (c) 20 ppm H2S in humid air (60% R.H.) at 220 °C; (d) Annealing in humid air (60% R.H.) at 300 °C.
Chemosensors 09 00034 g013aChemosensors 09 00034 g013b
Figure 14. Baseline absorption at 2000 cm−1 on DRIFT spectra: (a) Co3O4; (b) Ni0.1Co2.9O4.
Chemosensors 09 00034 g014
Figure 15. Sensor response time τ90 in dry and humid air for: (a) Co3O4; (b) Ni0.1Co2.9O4.
Chemosensors 09 00034 g015
Table 1. Composition and microstructure parameters of Co3O4 and NixCo3−xO4 samples.
Sample [ N i ] [ N i ] + [ C o ] ,   w t   % Structural Type/Lattice Constant a (Å)XRD
Particles Size d (nm)
BET Specific Surface Area
SBET (m2 g−1)
Co3O40normal spinel
8.0575(14)
11 ± 248 ± 3
Ni0.04Co2.96O41.24 ± 0.06normal spinel
8.0681(12)
12 ± 144 ± 3
Ni0.07Co2.93O42.4 ± 0.1normal spinel
8.0734(17)
9 ± 156 ± 4
Ni0.1Co2.9O43.3 ± 0.2normal spinel
8.0800(30)
10 ± 153 ± 3
Table 2. Lowest detectable concentration (LDC) of H2S for sensors based on Co3O4 and NixCo3−xO4 materials measured at 210 °C.
SampleLDC, ppbSensitivity (Signal per Concentration), ppm−1
Co3O41200.74
Ni0.04Co2.96O41000.60
Ni0.07Co2.93O41500.60
Ni0.1Co2.9O41200.51
Table 3. Absorption bands on Co3O4 and Ni0.1Co2.9O4 DRIFT spectra.
Surface GroupsAdsorption Bands, cm−1
Co3O4Ni0.1Co2.9O4
0% R.H.60% R.H.0% R.H.60% R.H.
OH3400 (broad.)3430 (broad.)3440 (broad.)3430 (broad.)
H2O1616162116211618
SO42−1340, 11241346
SO32−10301030, 10501030, 10501030, 1050
HSO31290, 11541270, 11541287, 11451275, 1154
SO2(ads)1330130613271306
Publisher’s Note: MDPI stays neutral with regard to jurisdictional claims in published maps and institutional affiliations.

