
Electrospun Fibres of Chitosan/PVP for the Effective Chemotherapeutic Drug Delivery of 5-Fluorouracil

 ,
,  ,
,  and
and
Abstract
:1. Introduction
2. Materials and Methods
2.1. Materials
2.2. Preliminary Analysis/Solubility Testing
2.3. Chitosan-PVP Solutions
Chitosan-PVP-5-Fu Solutions
2.4. Electrospinning Procedure
2.5. Characterization
2.6. Cell Culture
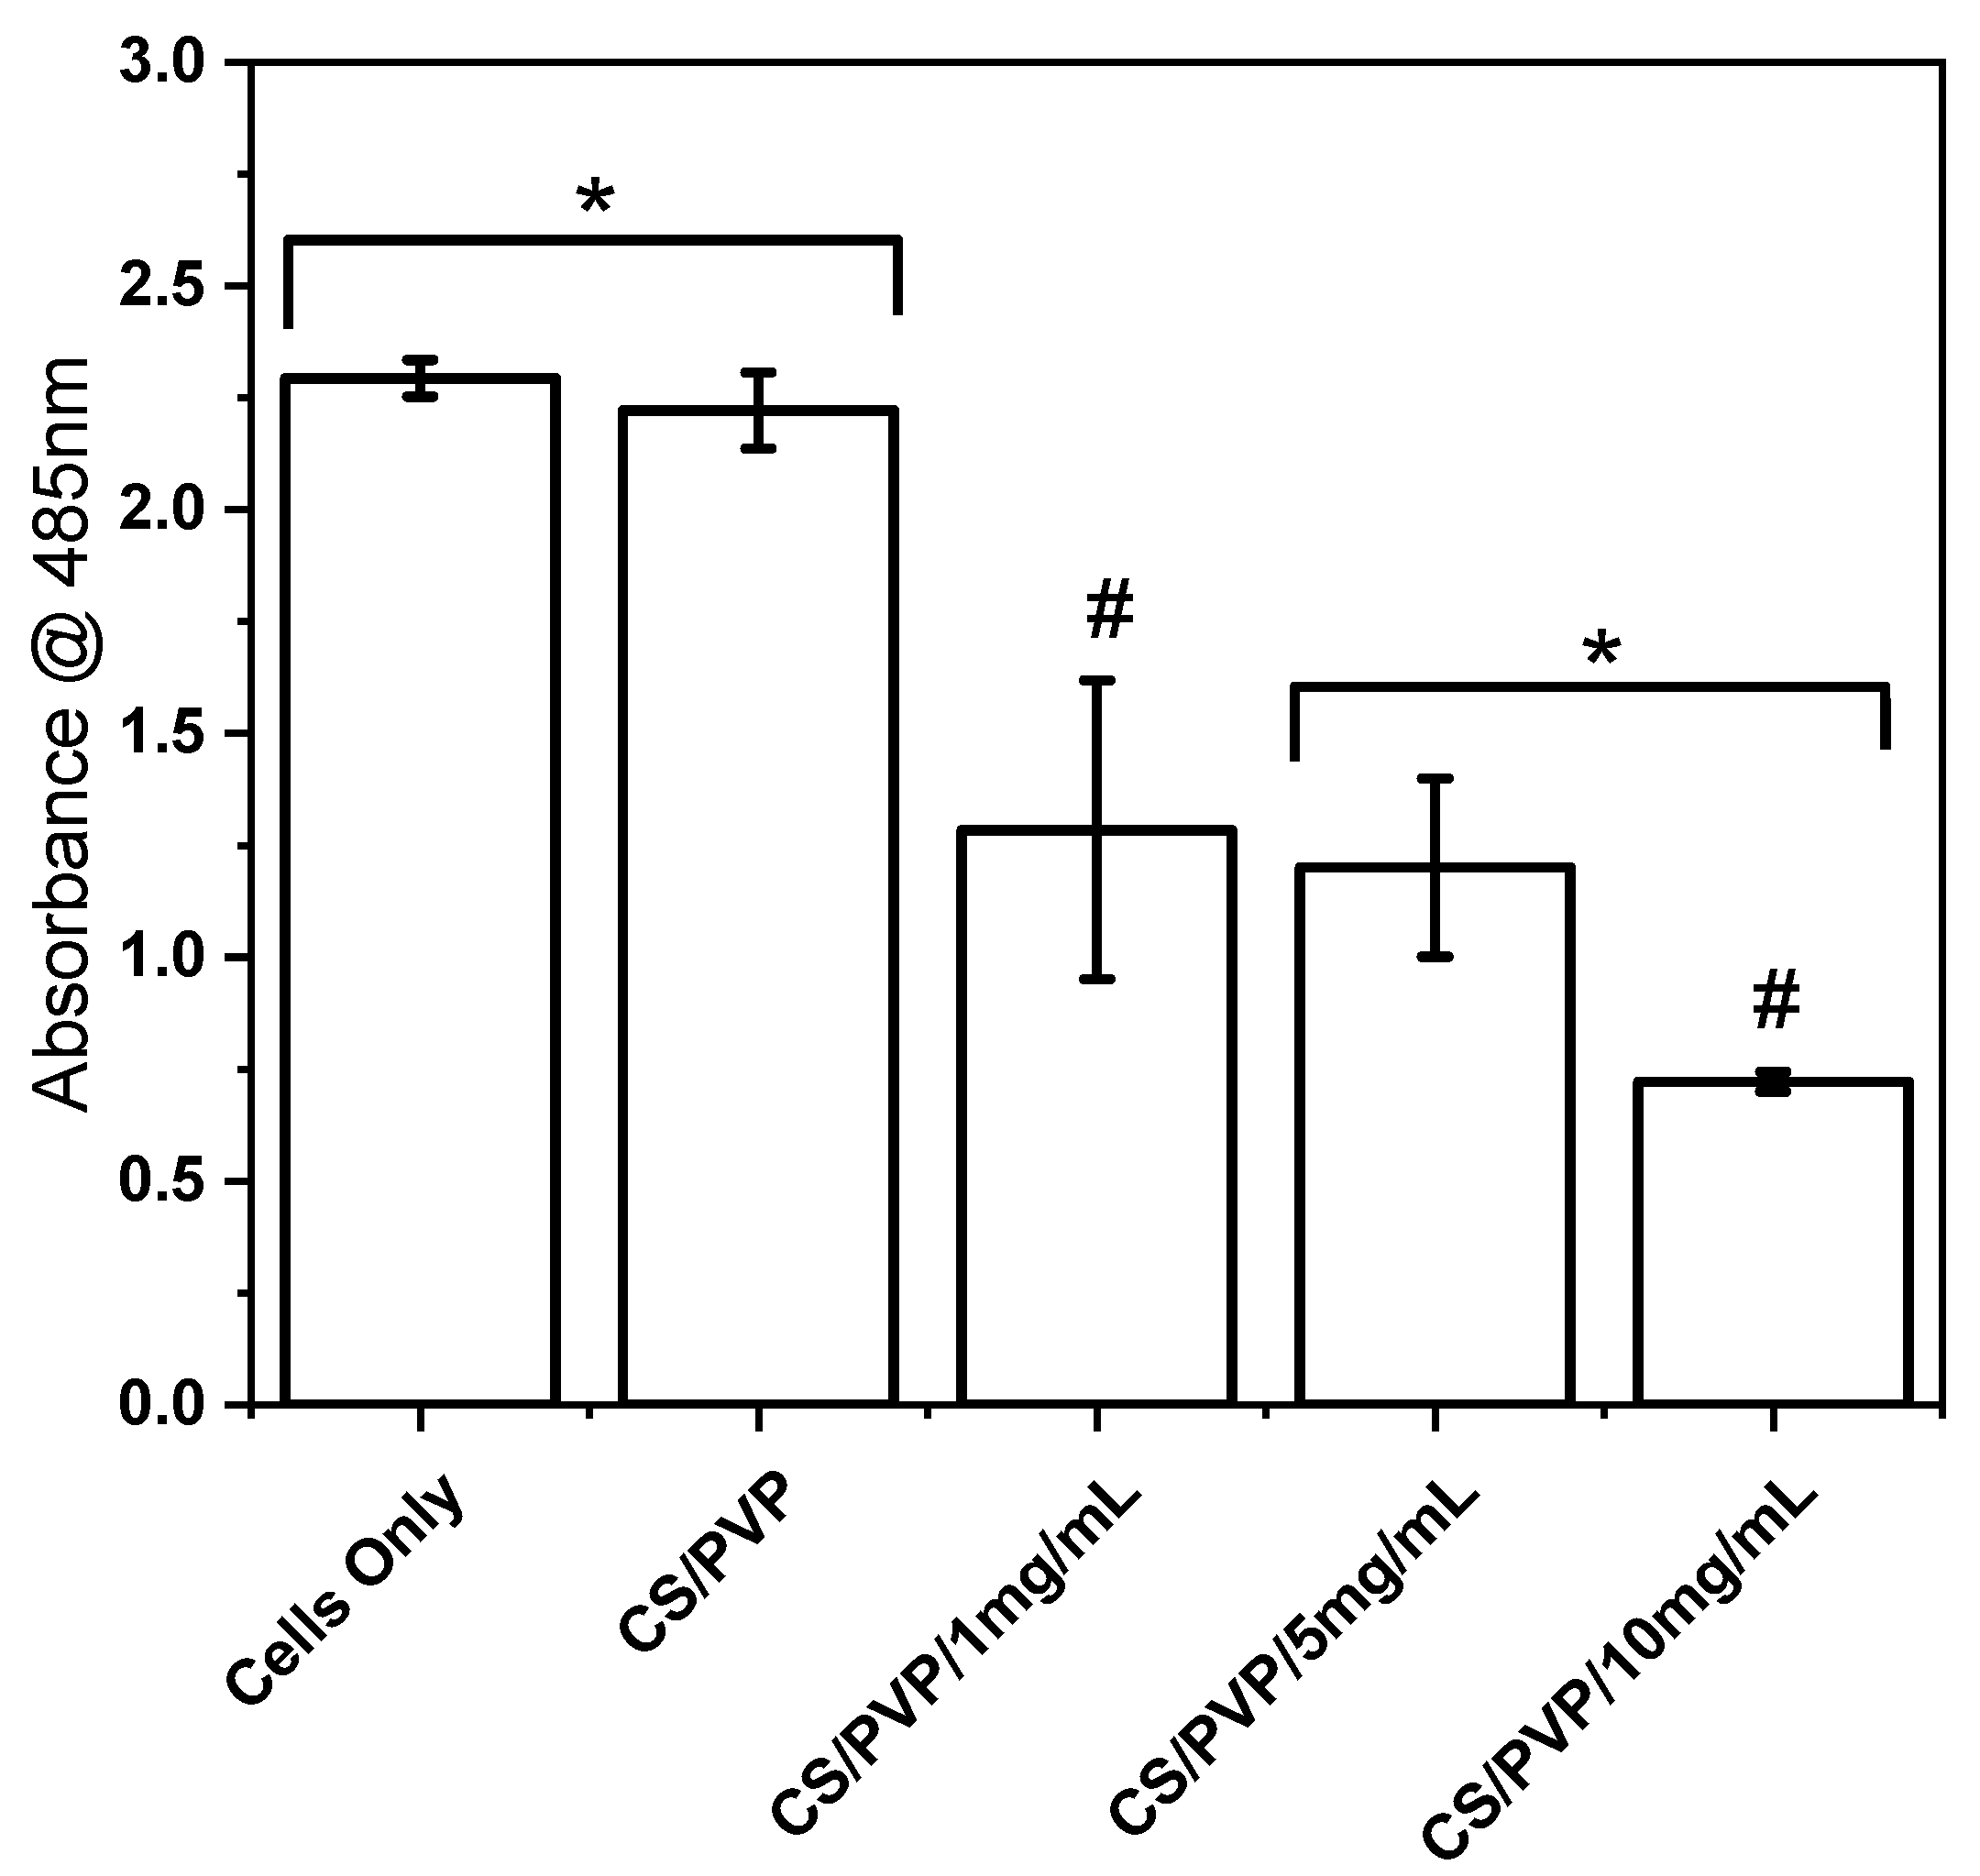
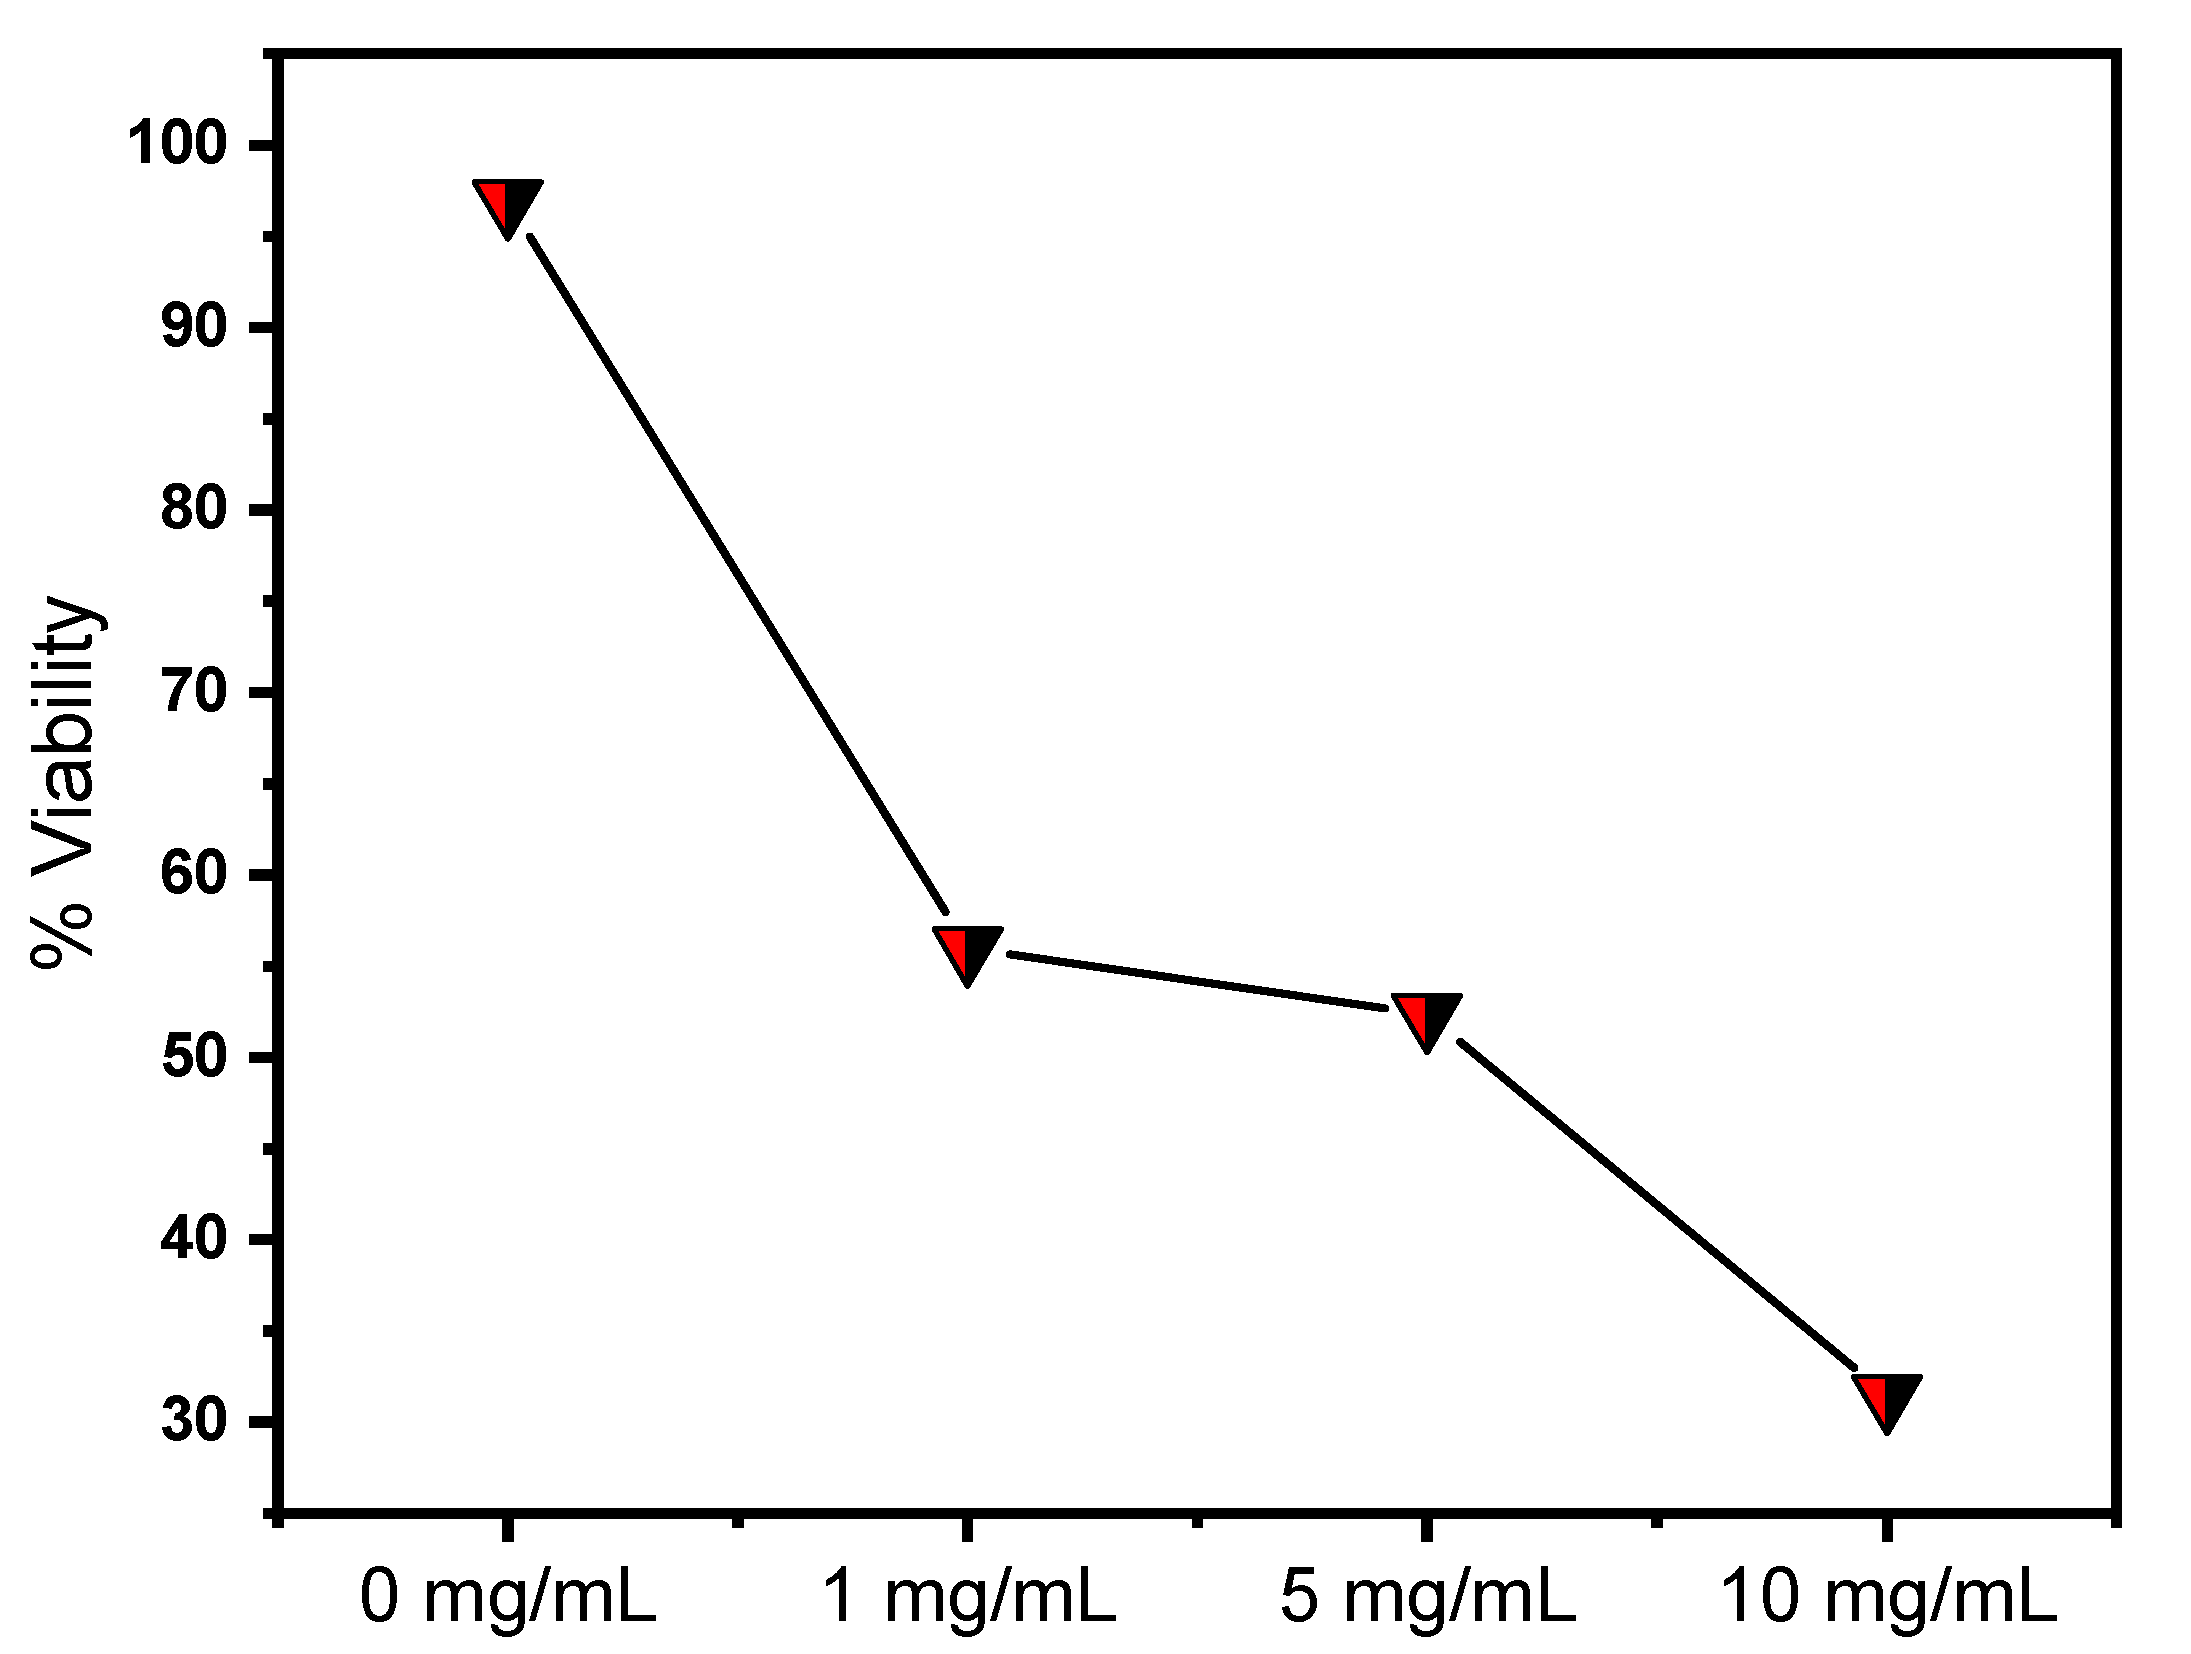
Cell Viability Assay
3. Results and Discussion
3.1. Electrospinning of Chitosan/PVP
3.2.1. Tuning of Chitosan/PVP Blend Solution Parameters
3.2.2. Investigation of the Electrospinning Process Parameters on Fibres
3.3. Characterization of Electrospun Blends
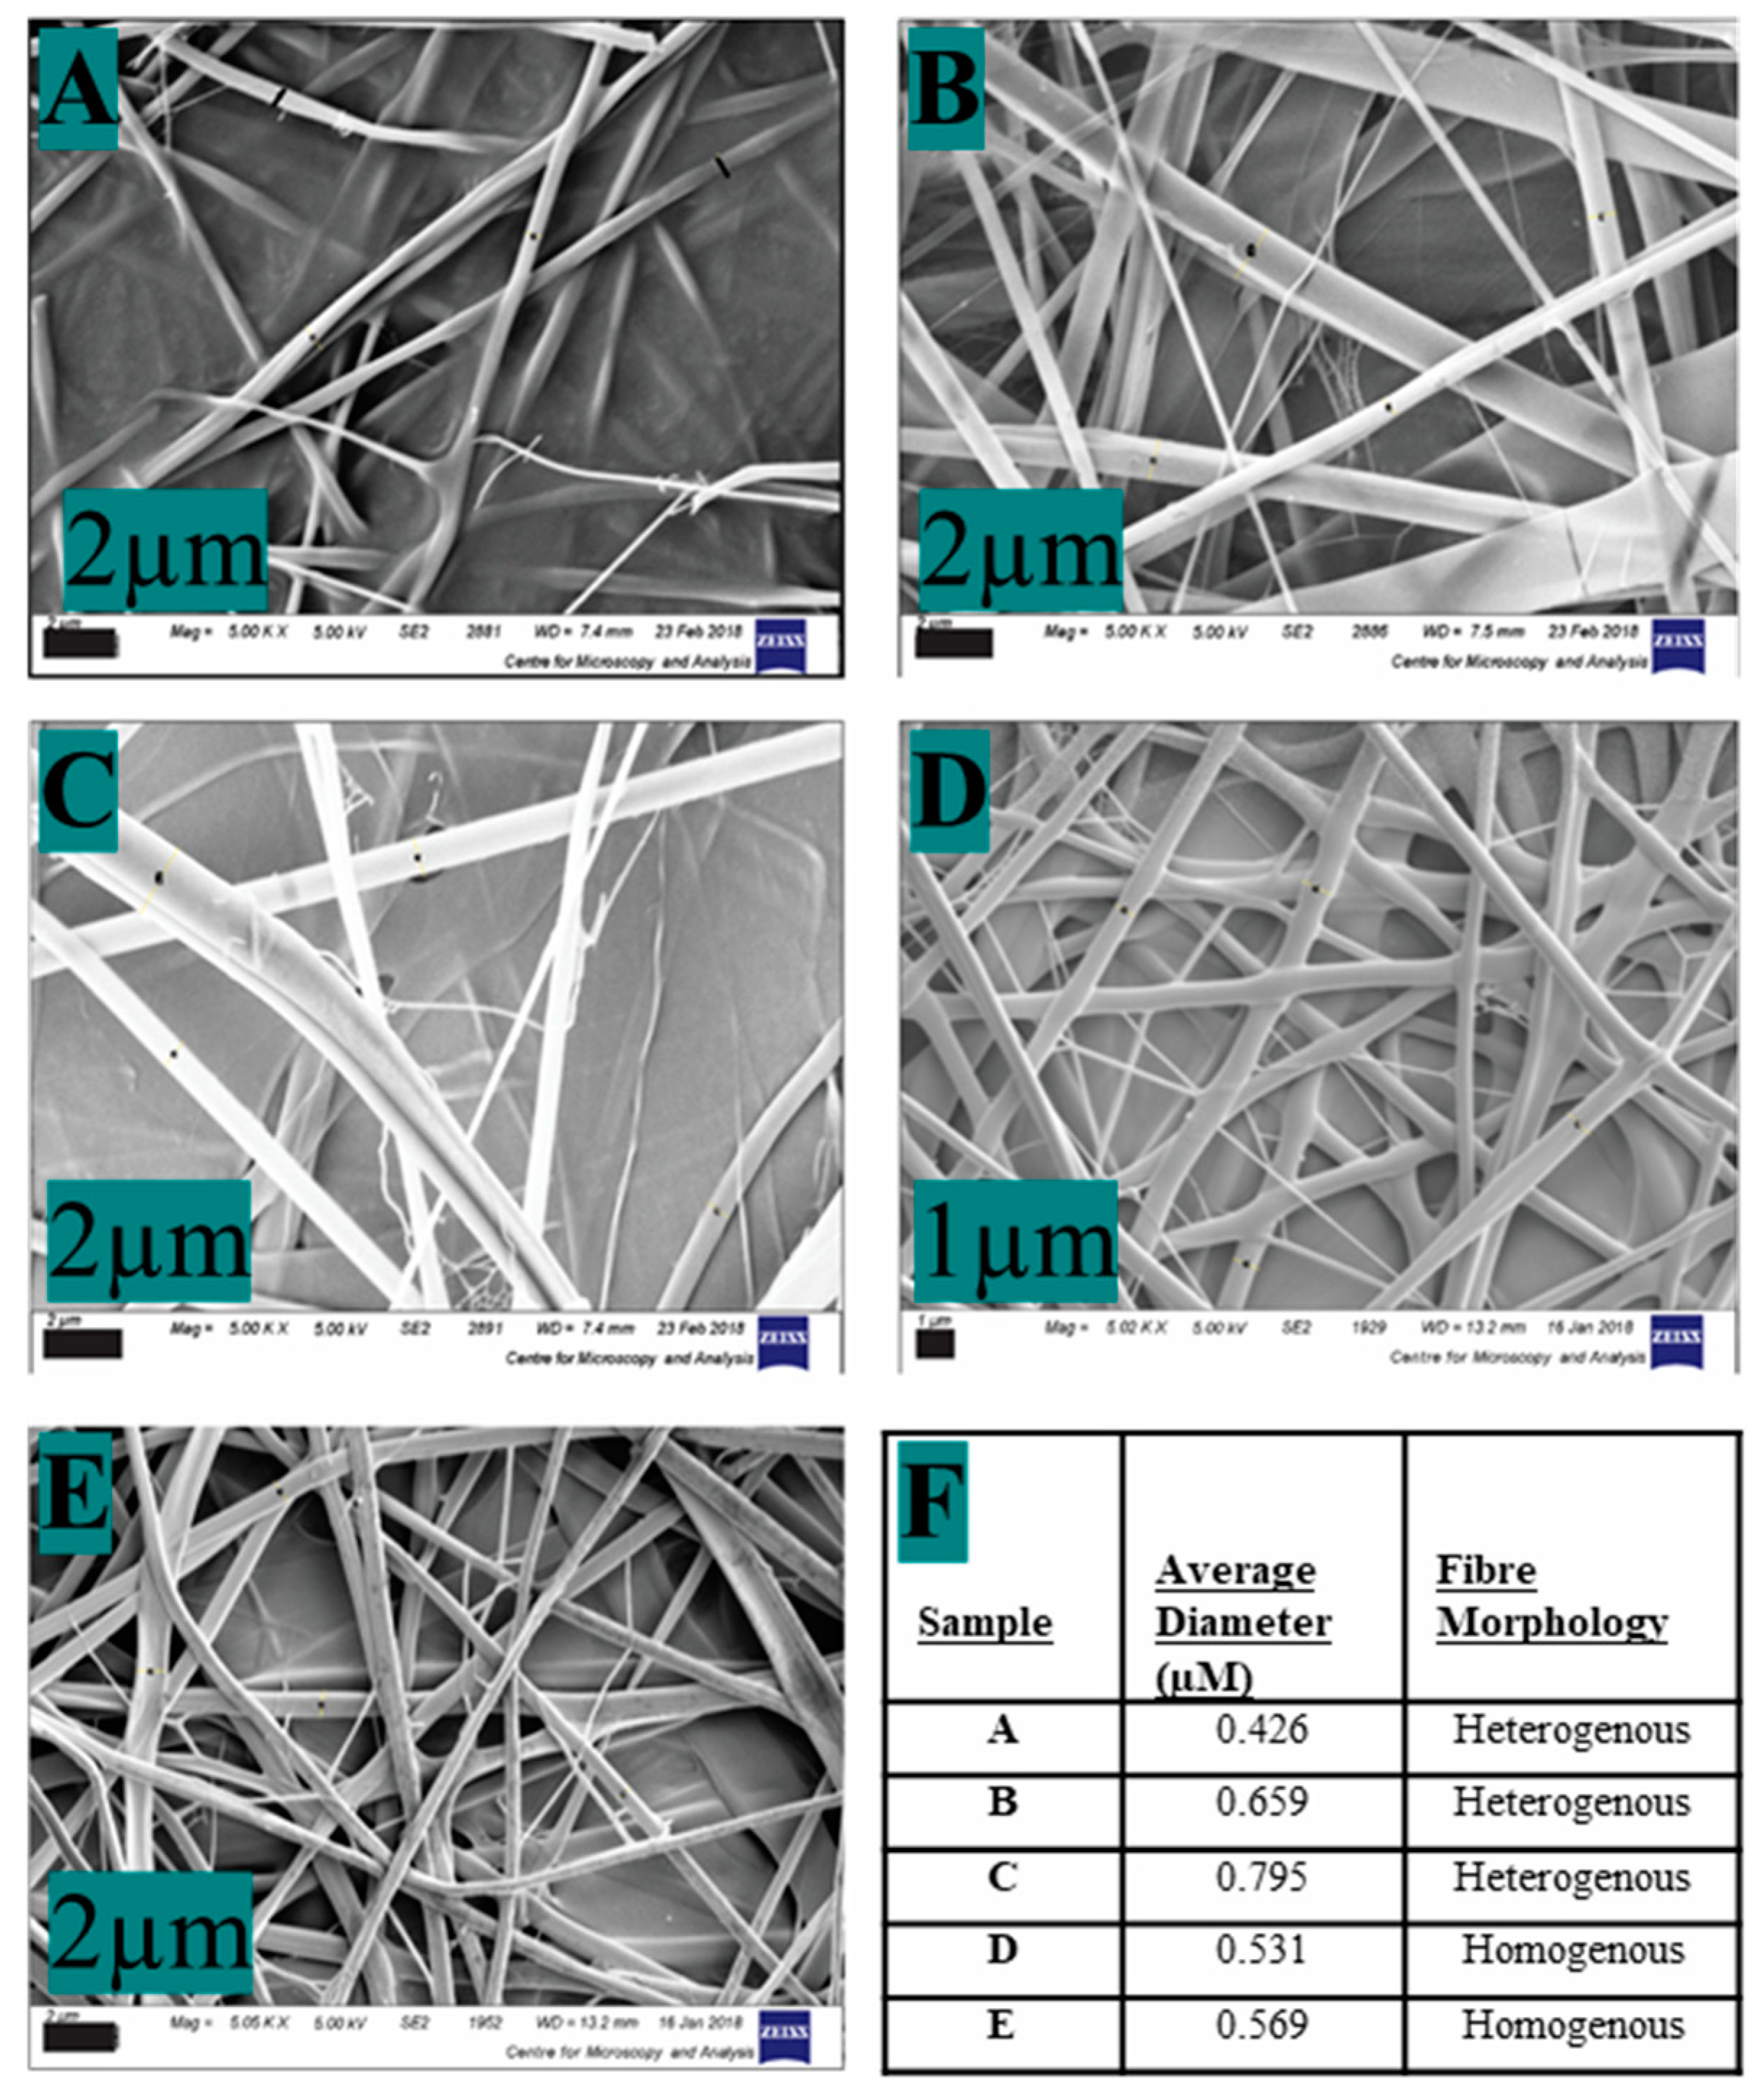
3.3.1. SEM Analysis
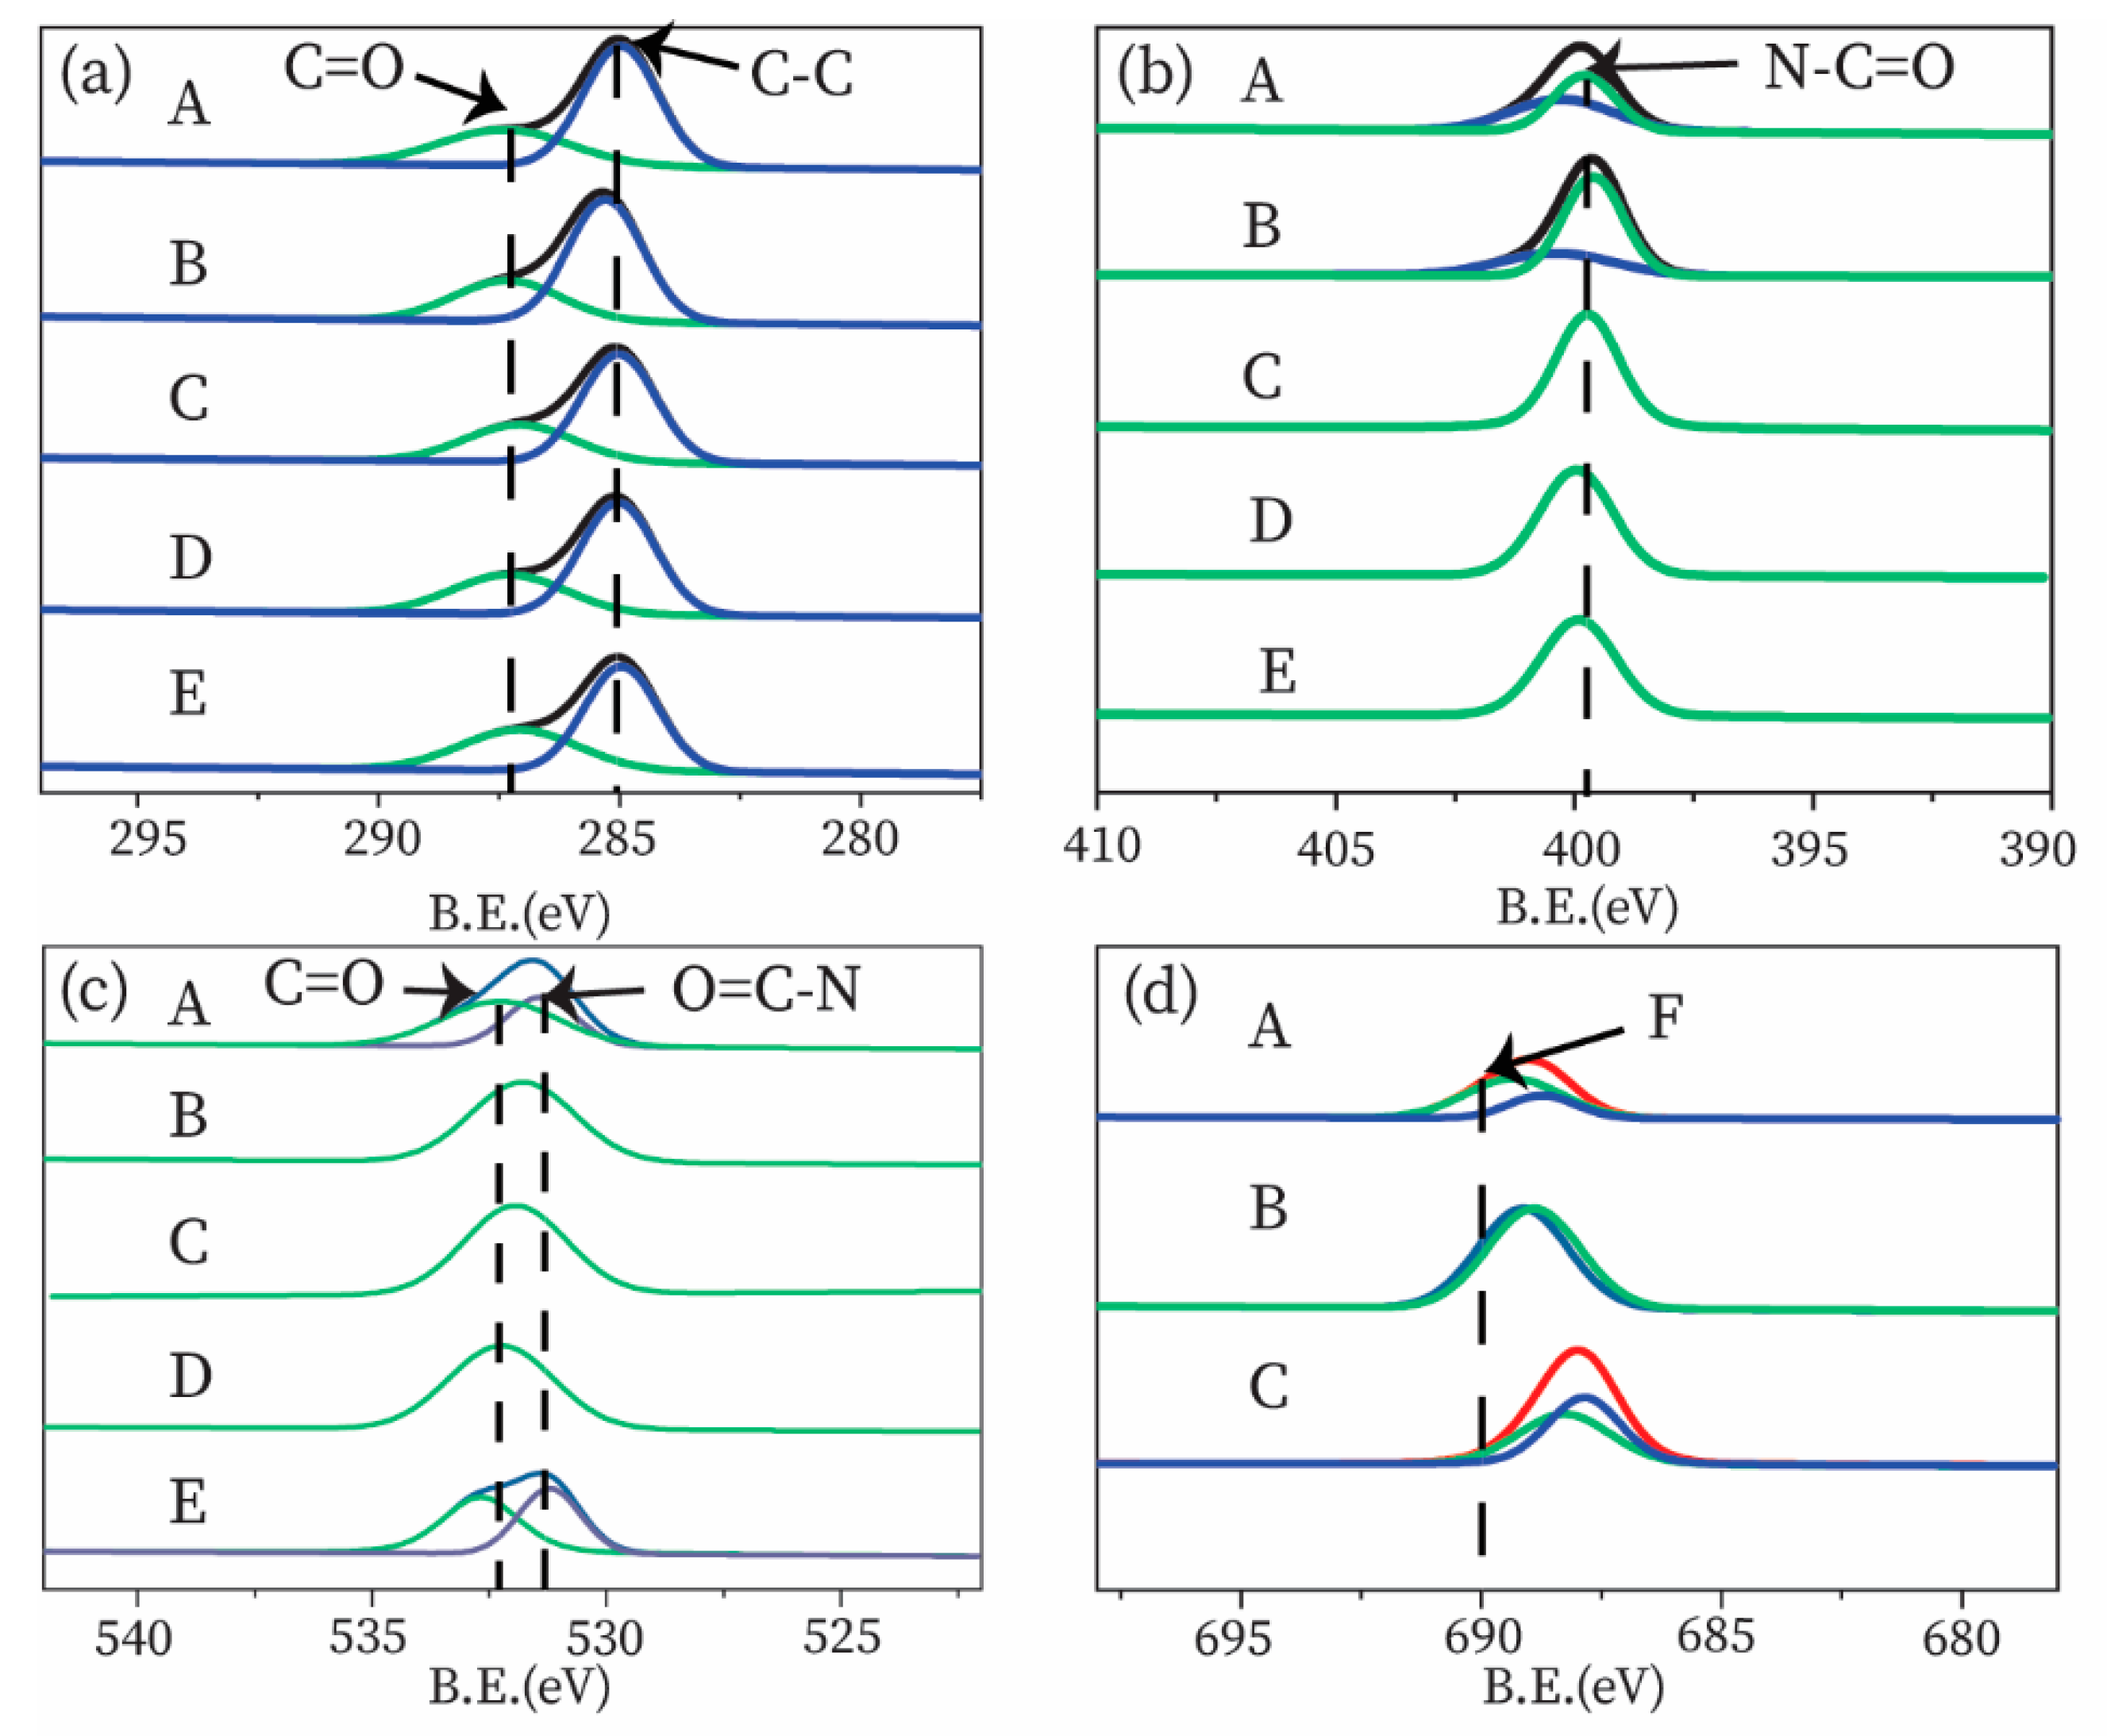
3.3.2. XPS Analysis
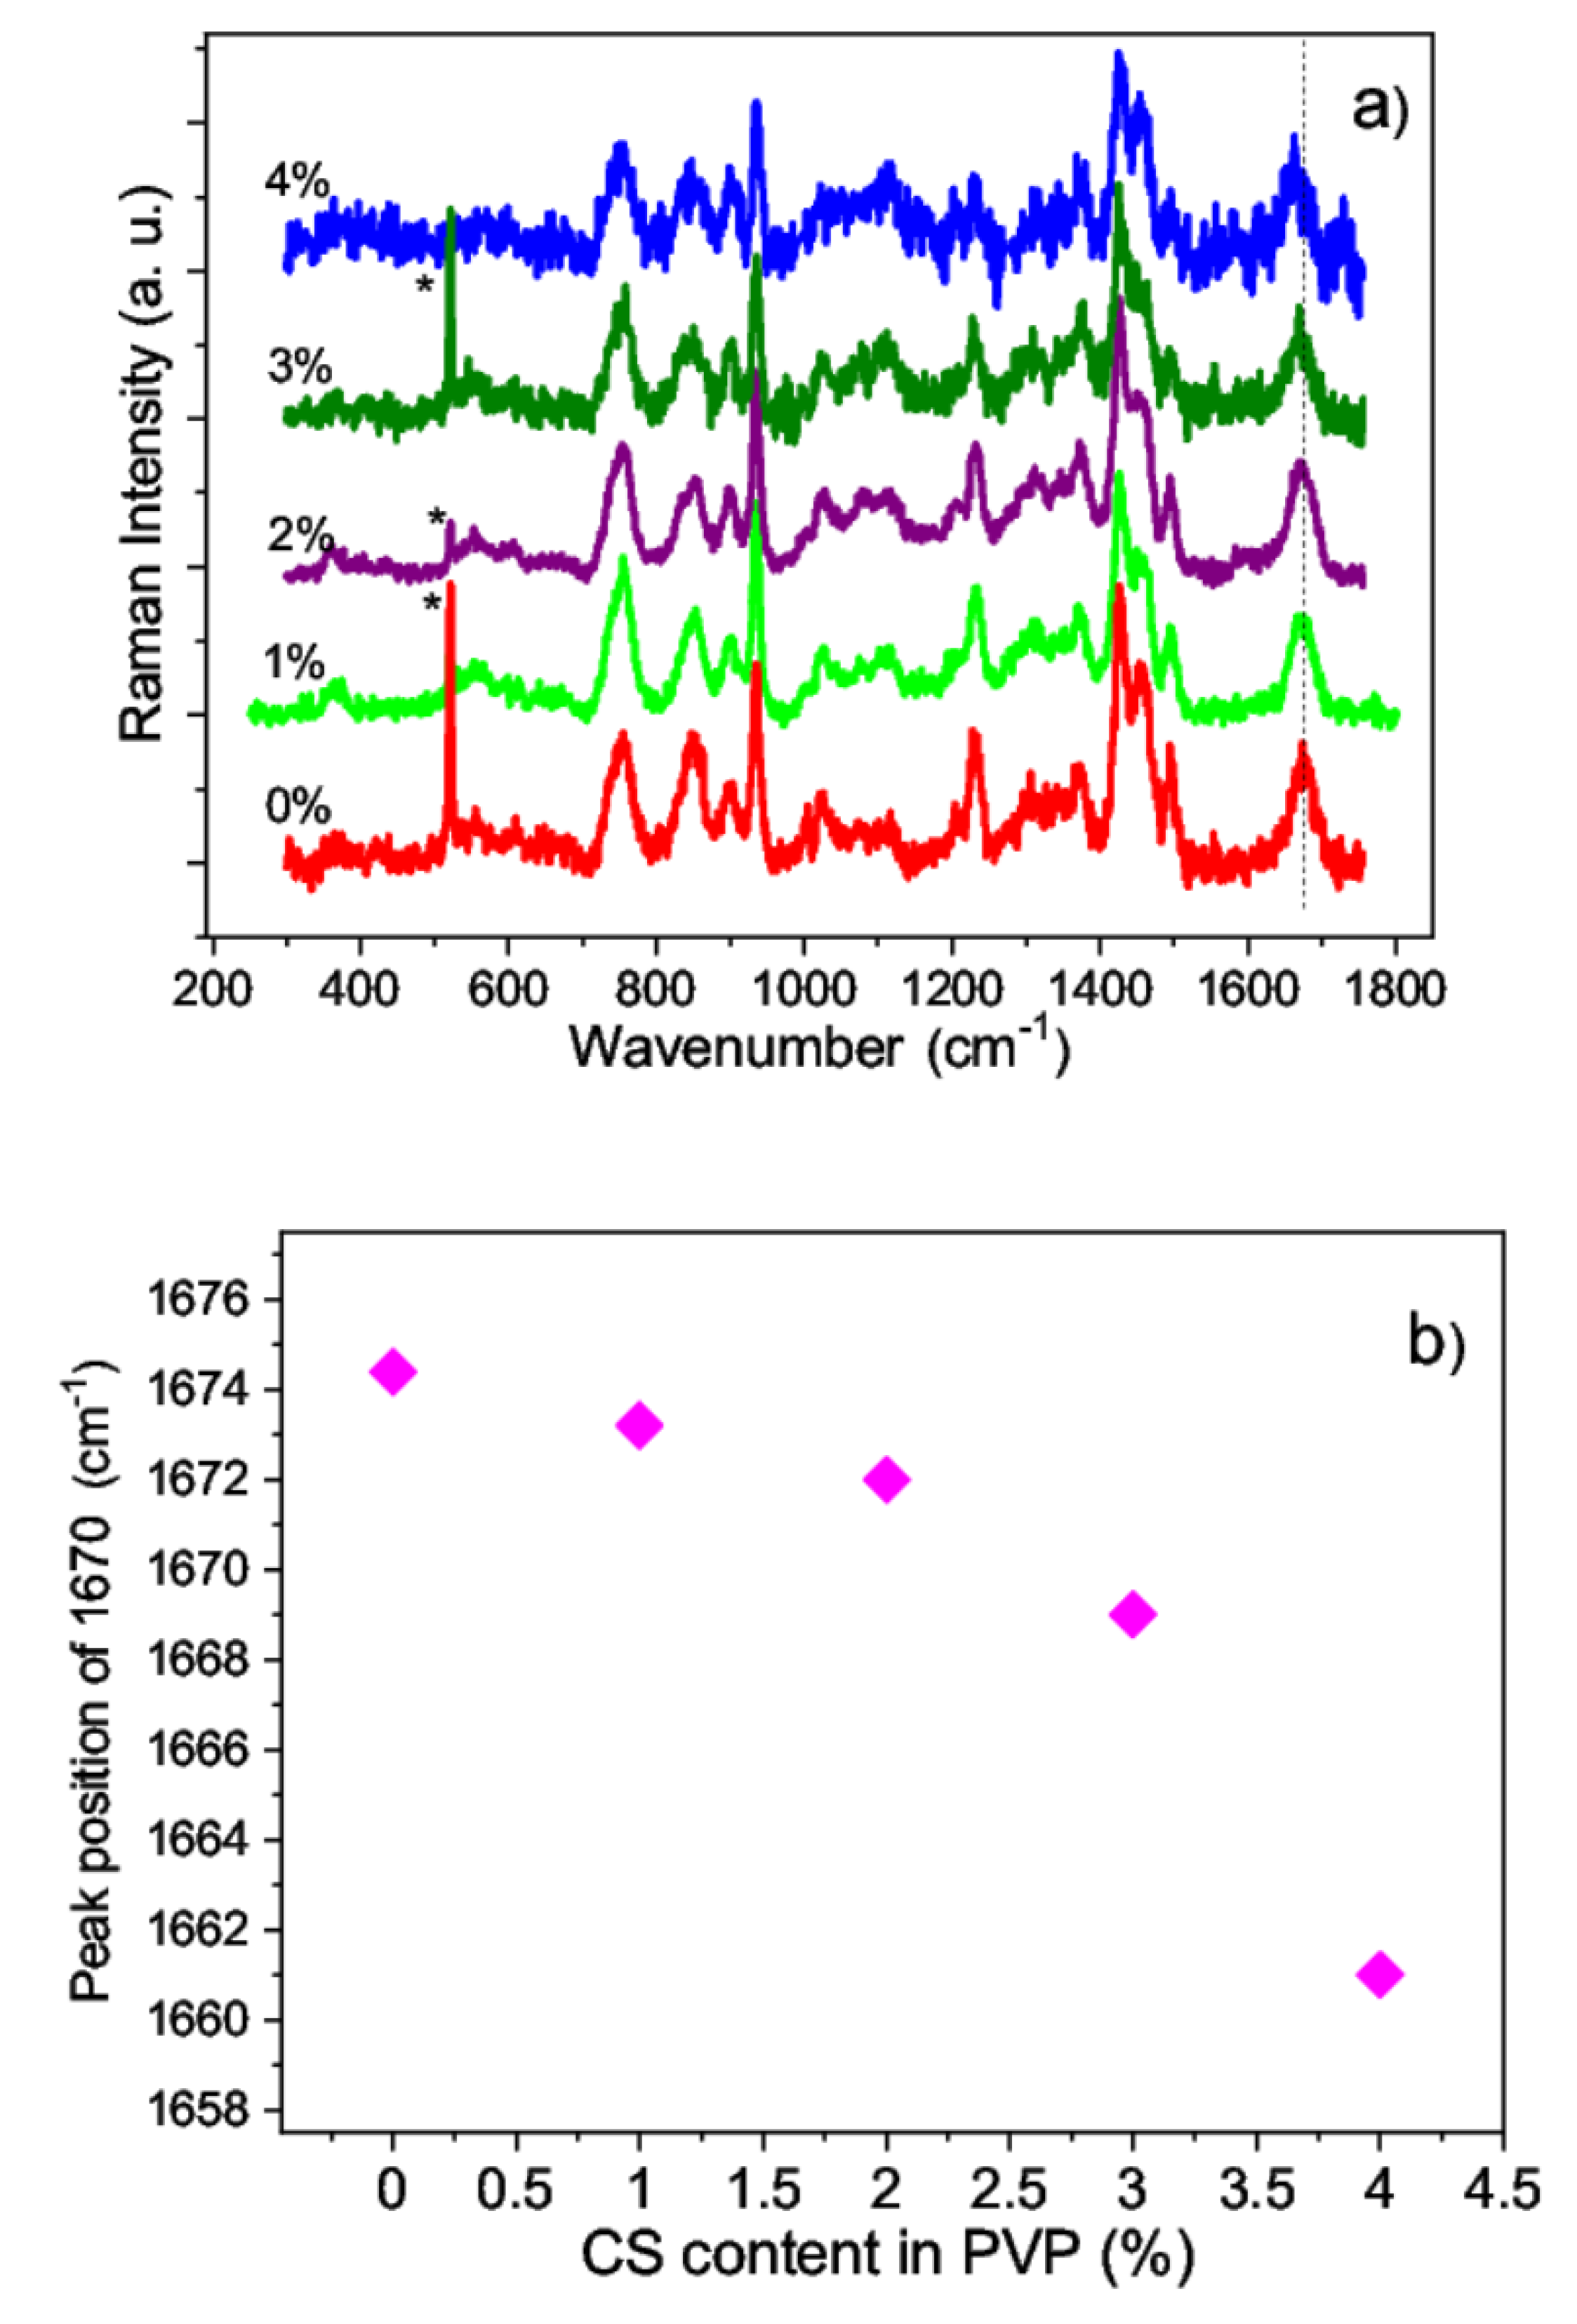
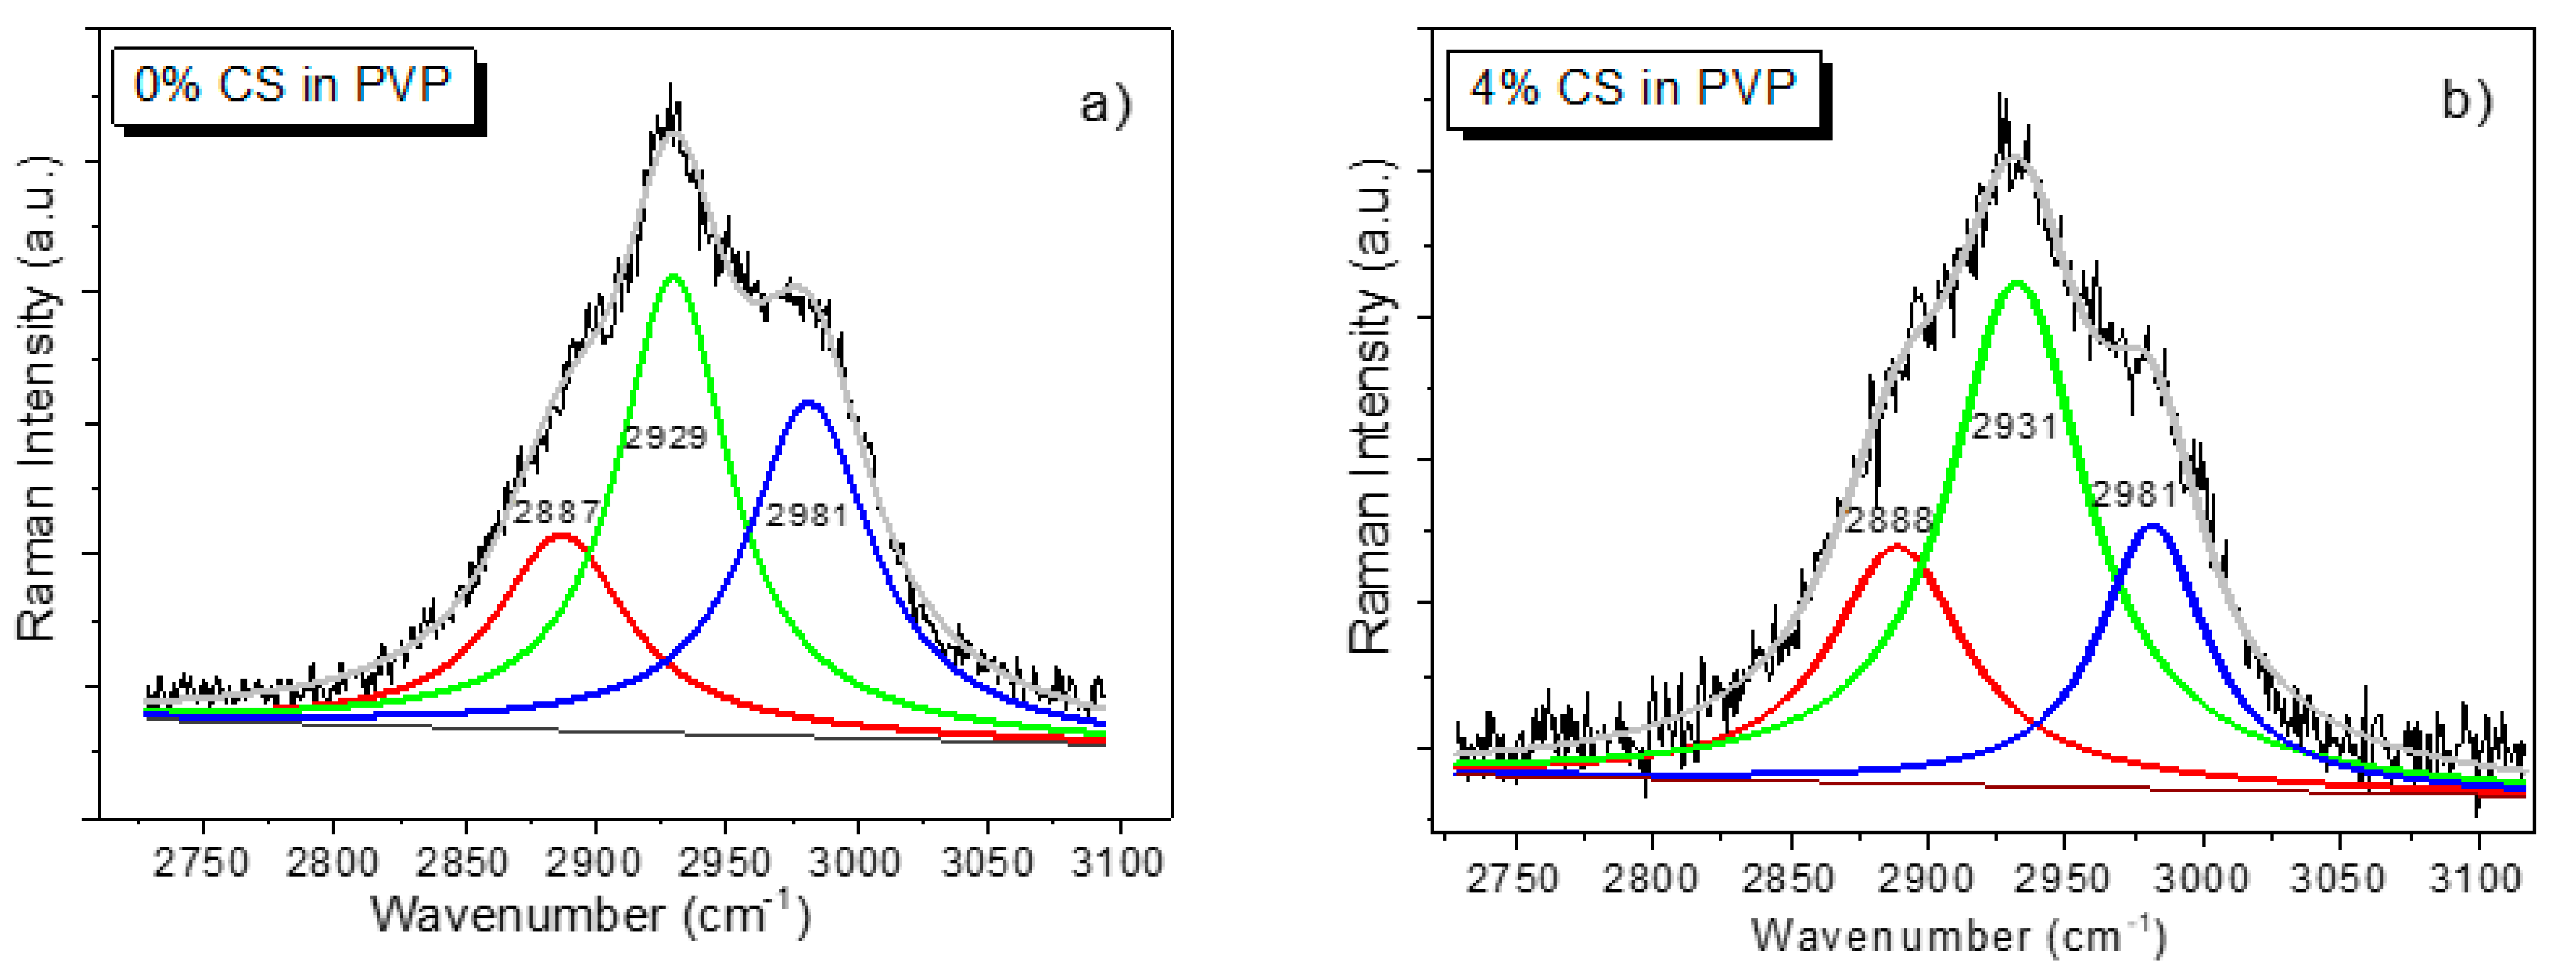
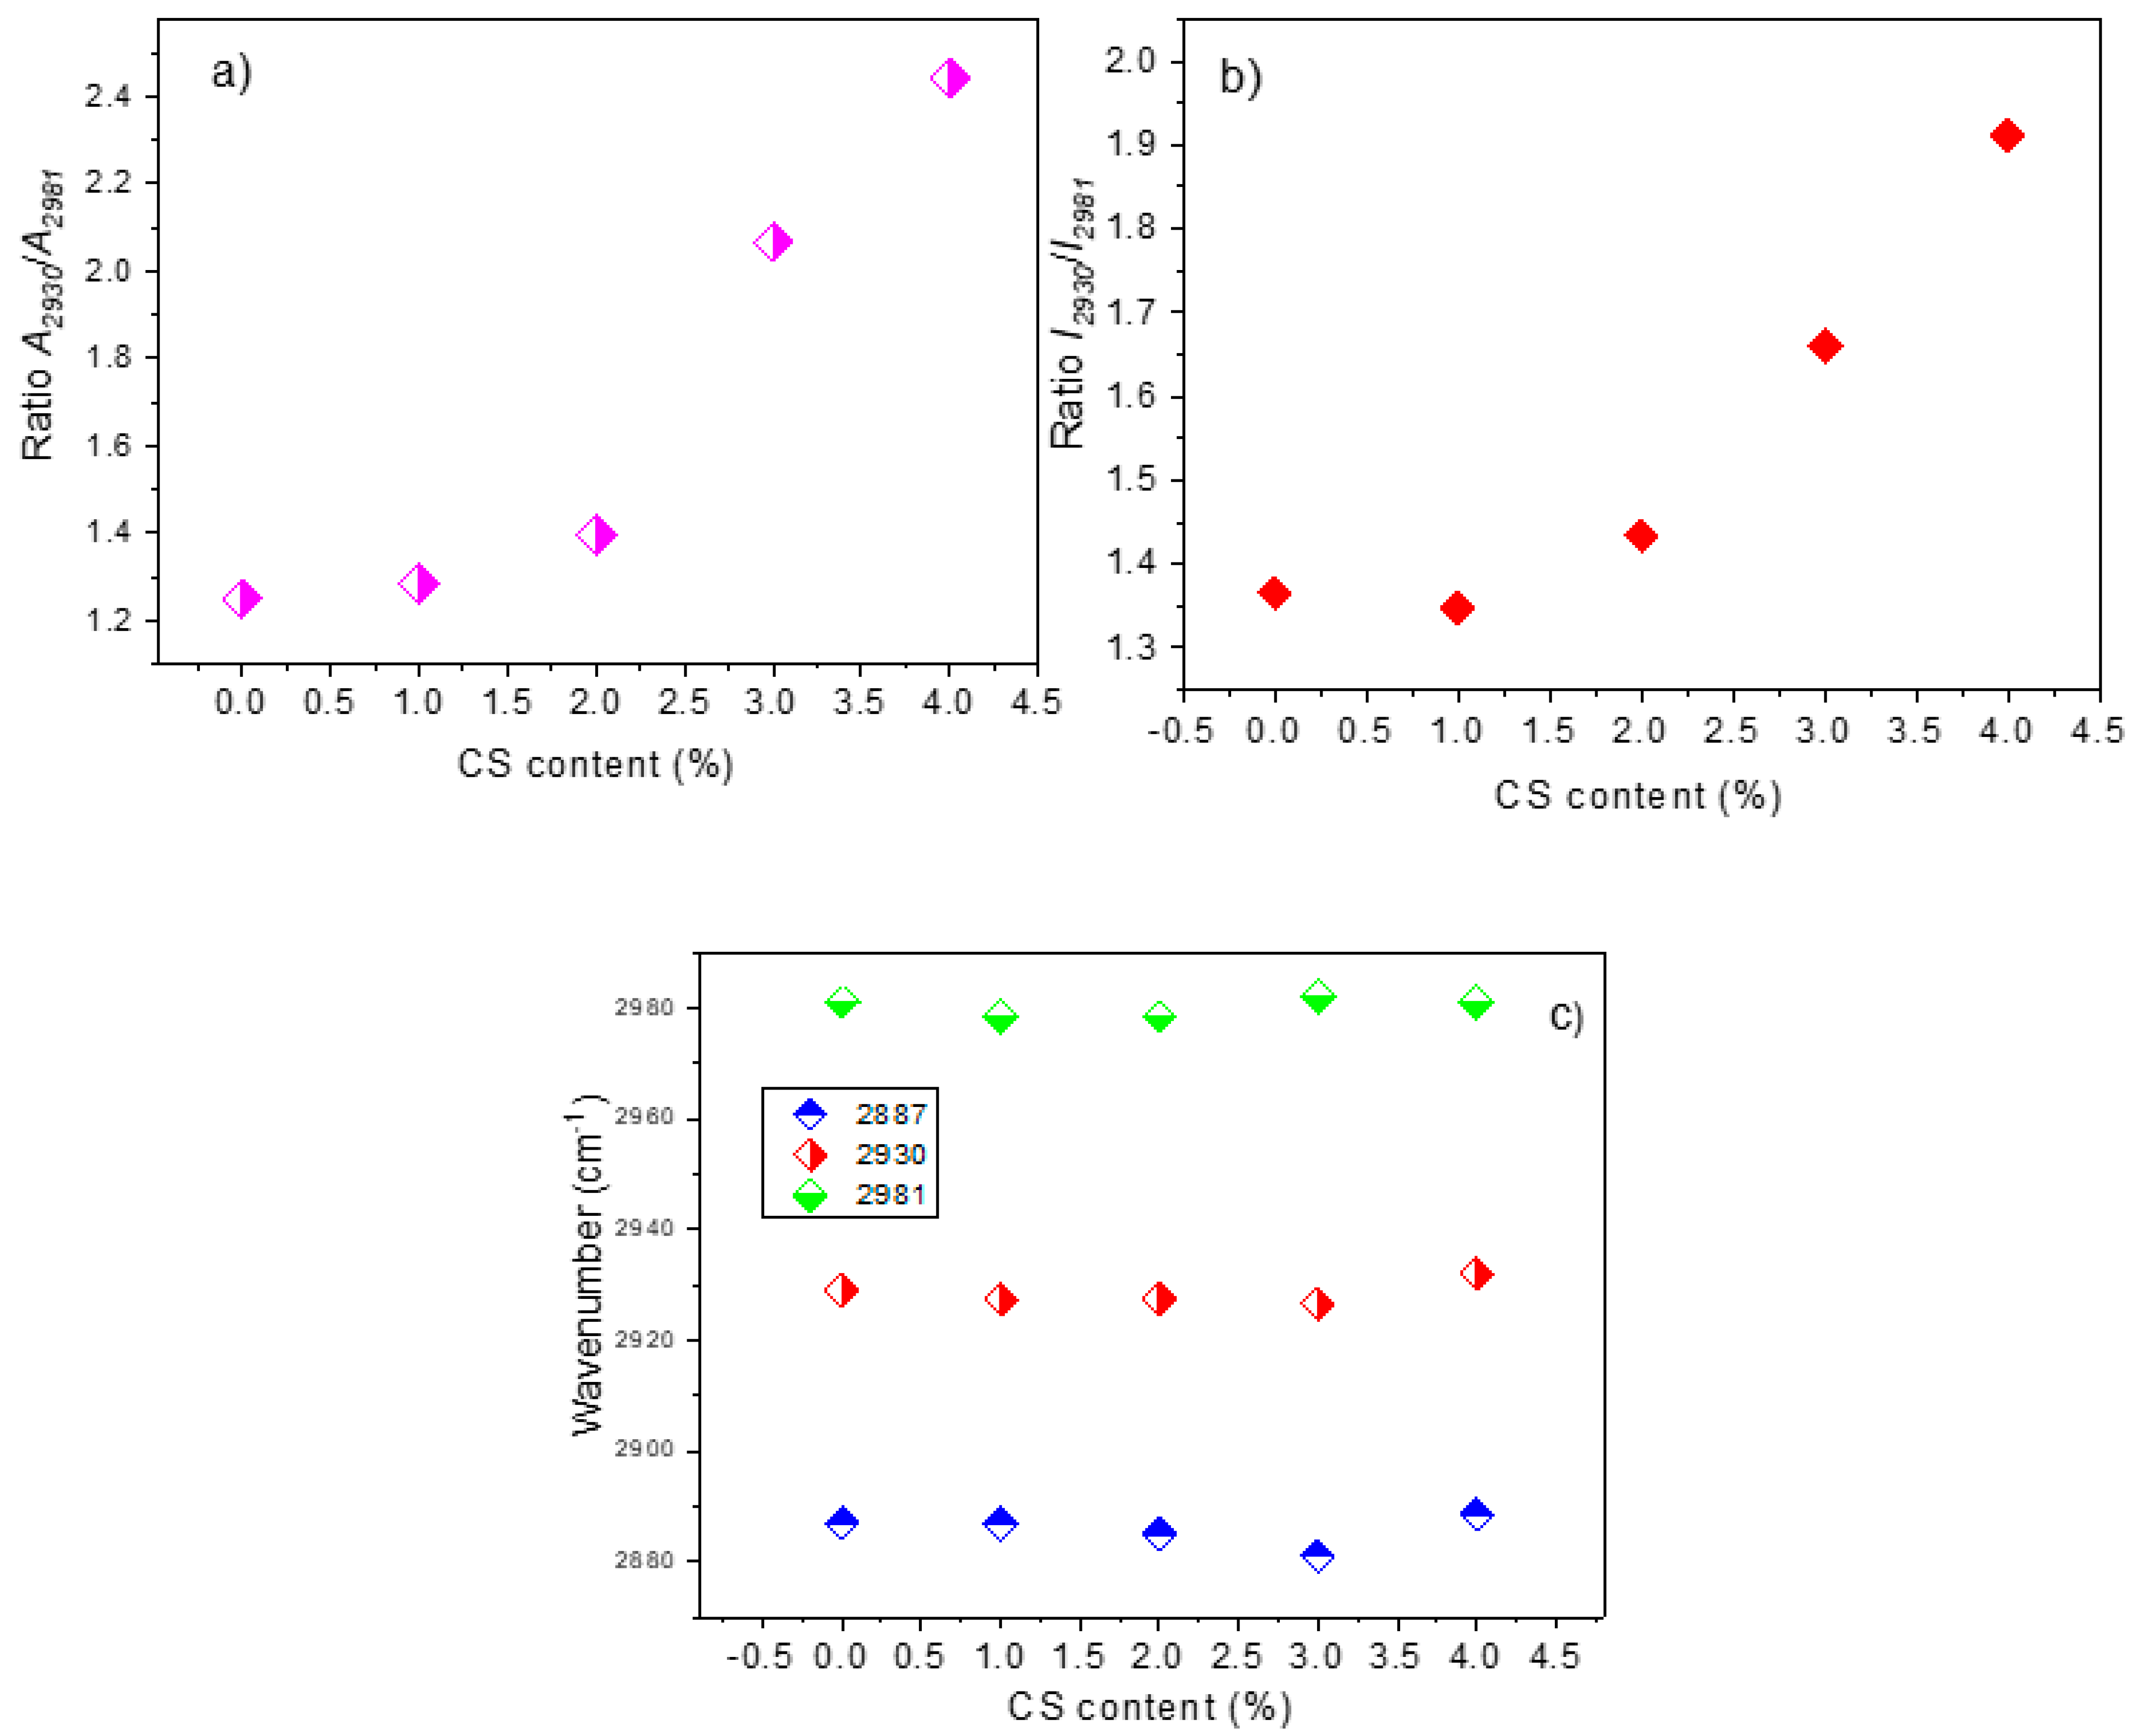
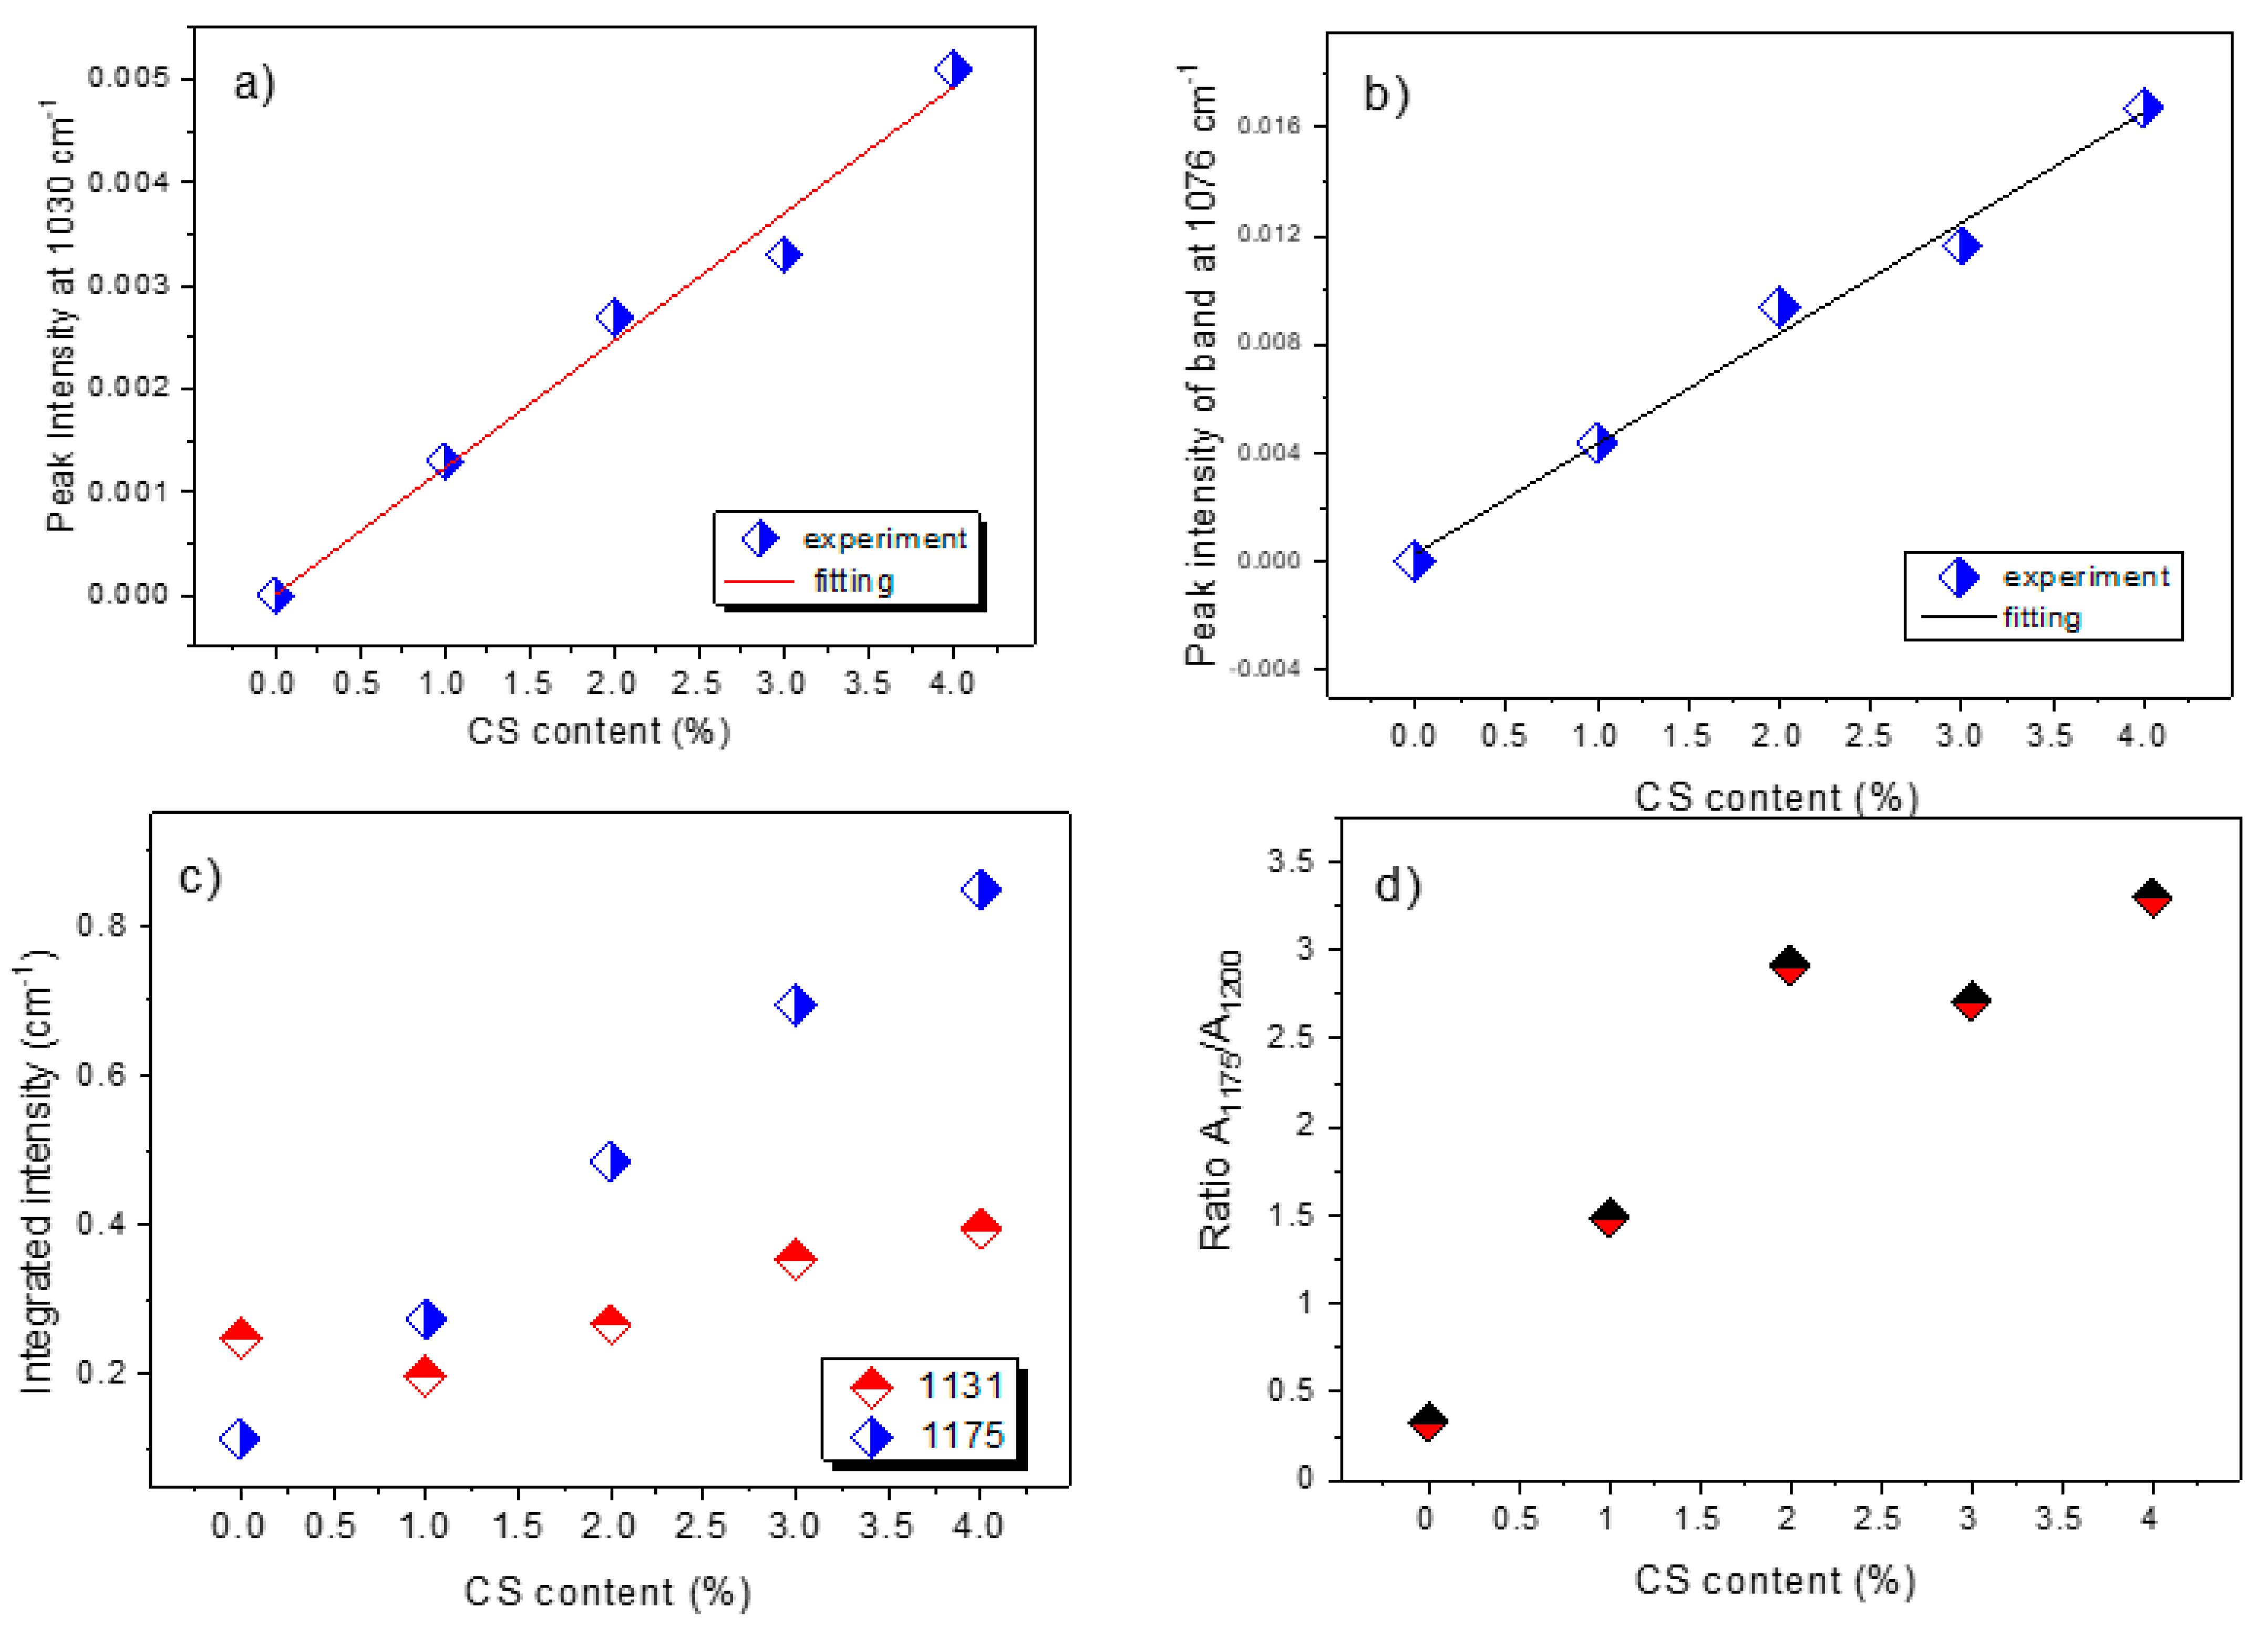
3.3.3. Raman Analysis
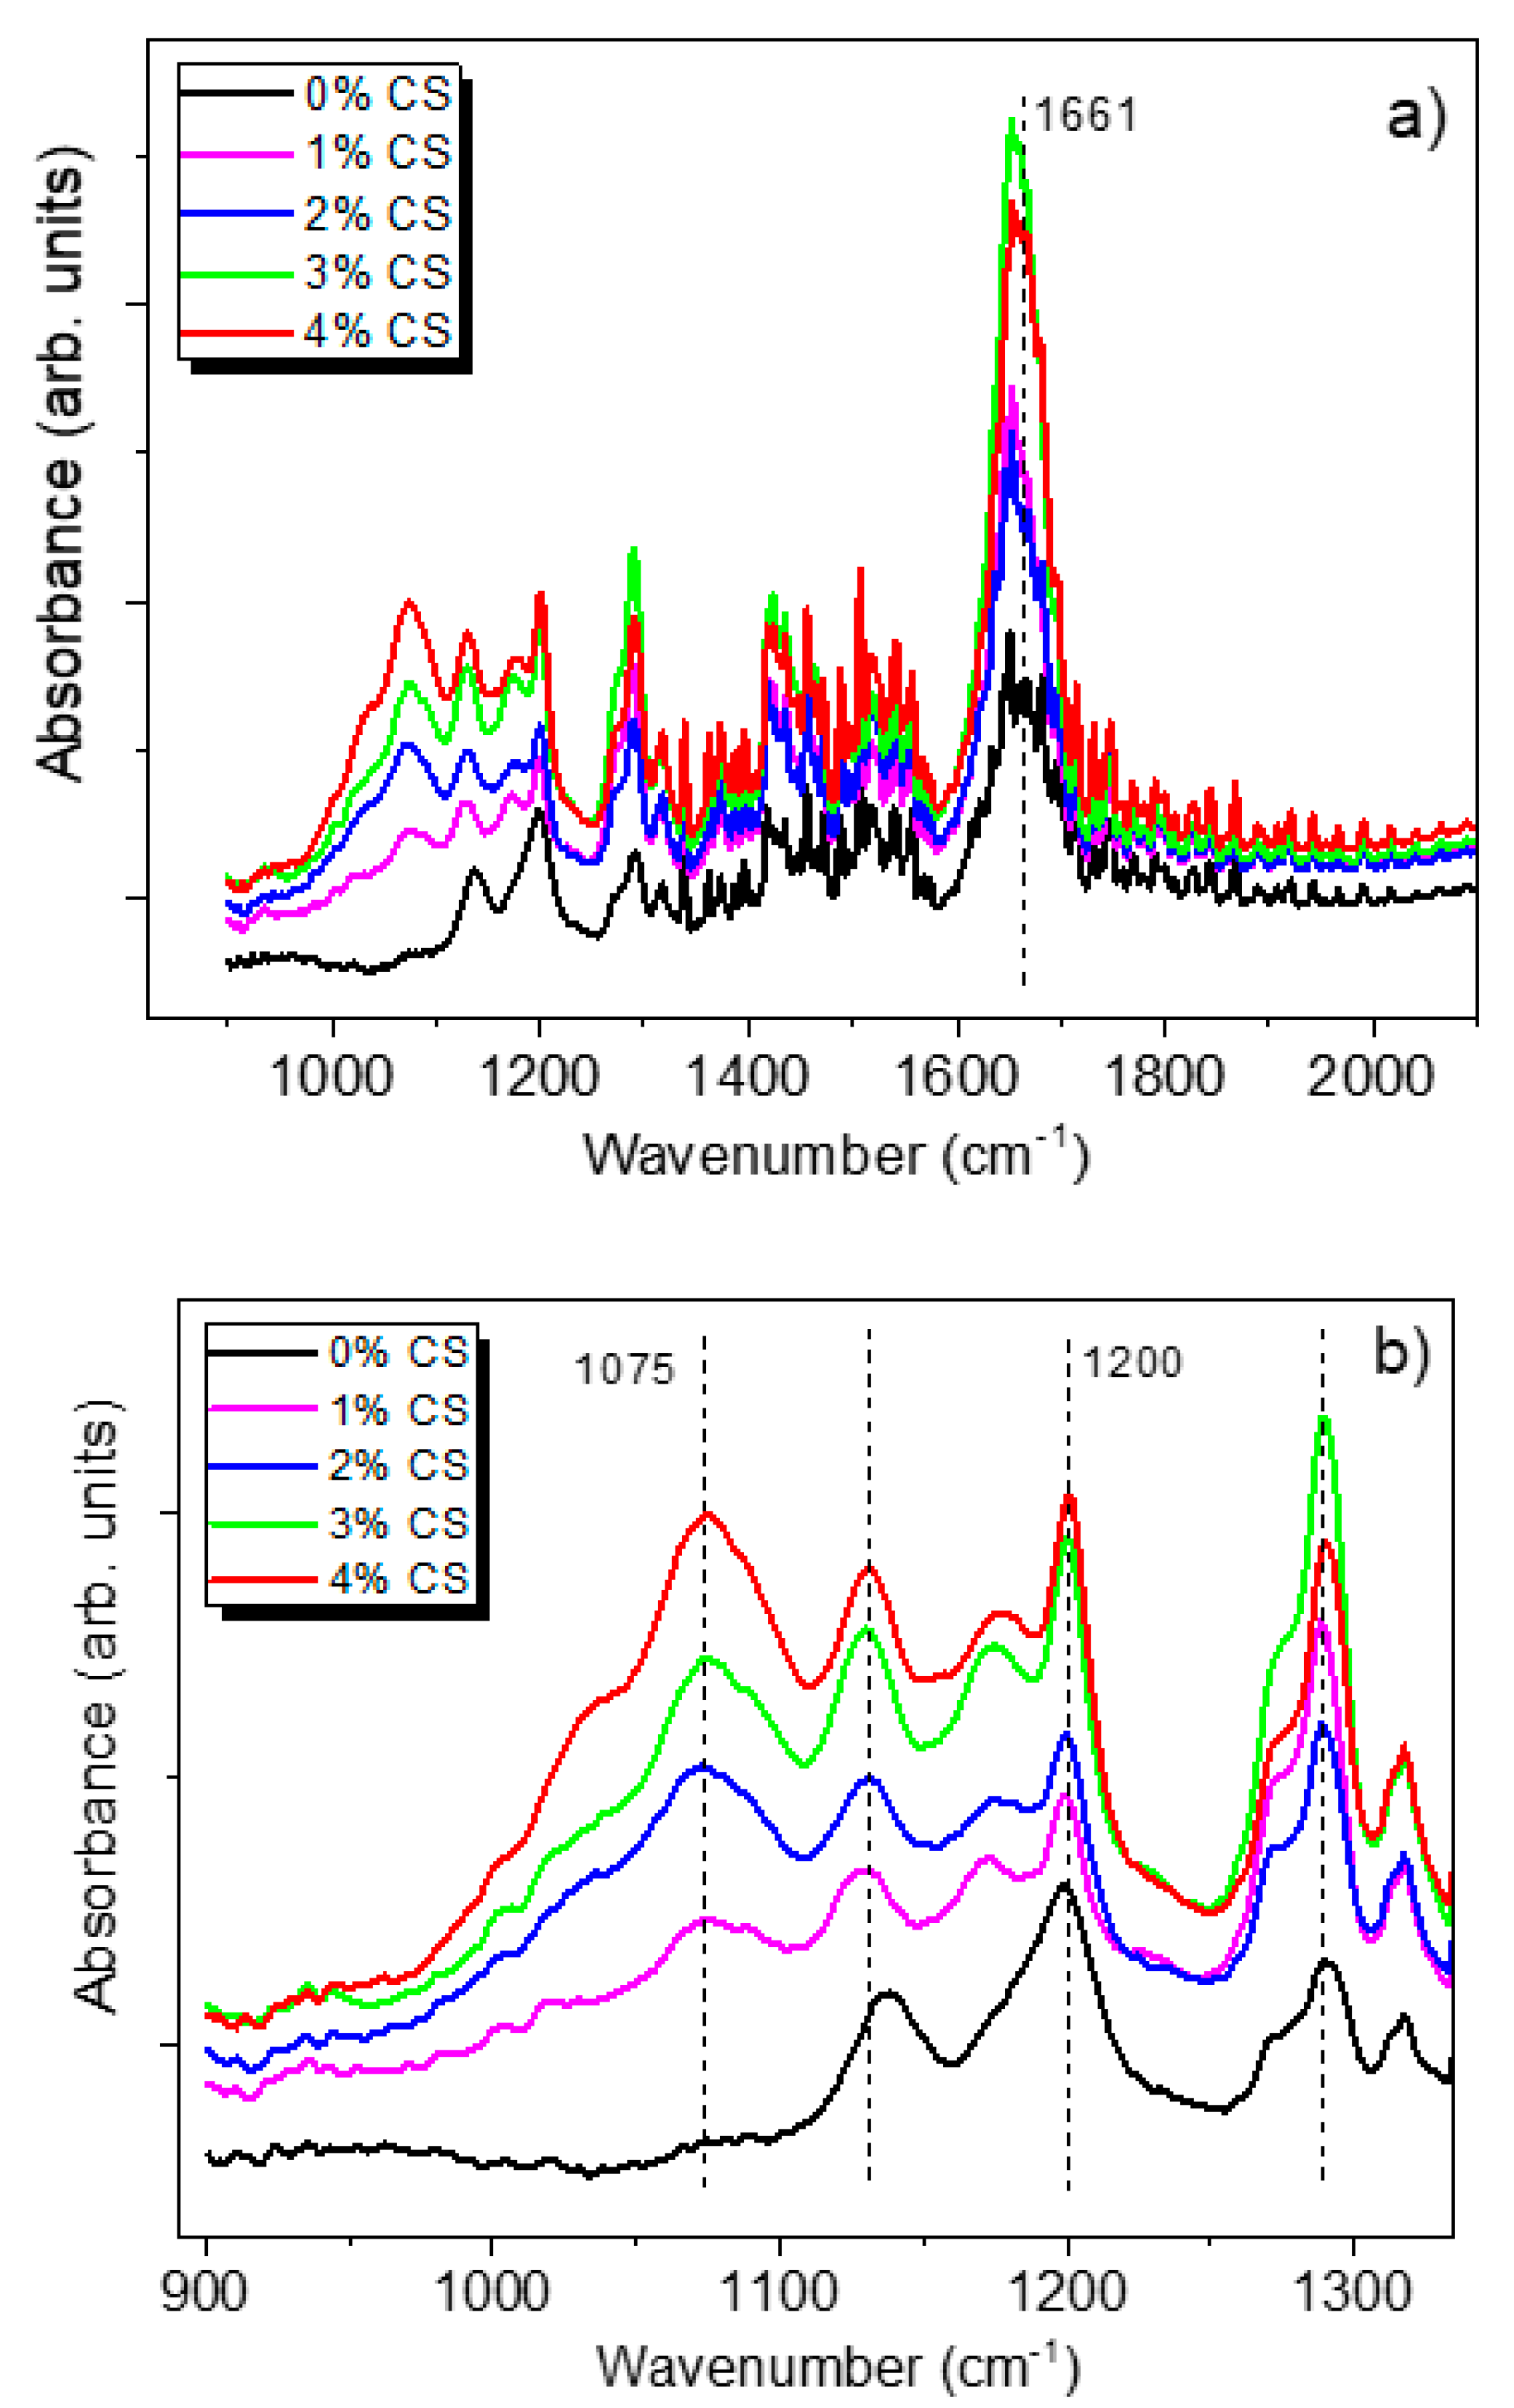
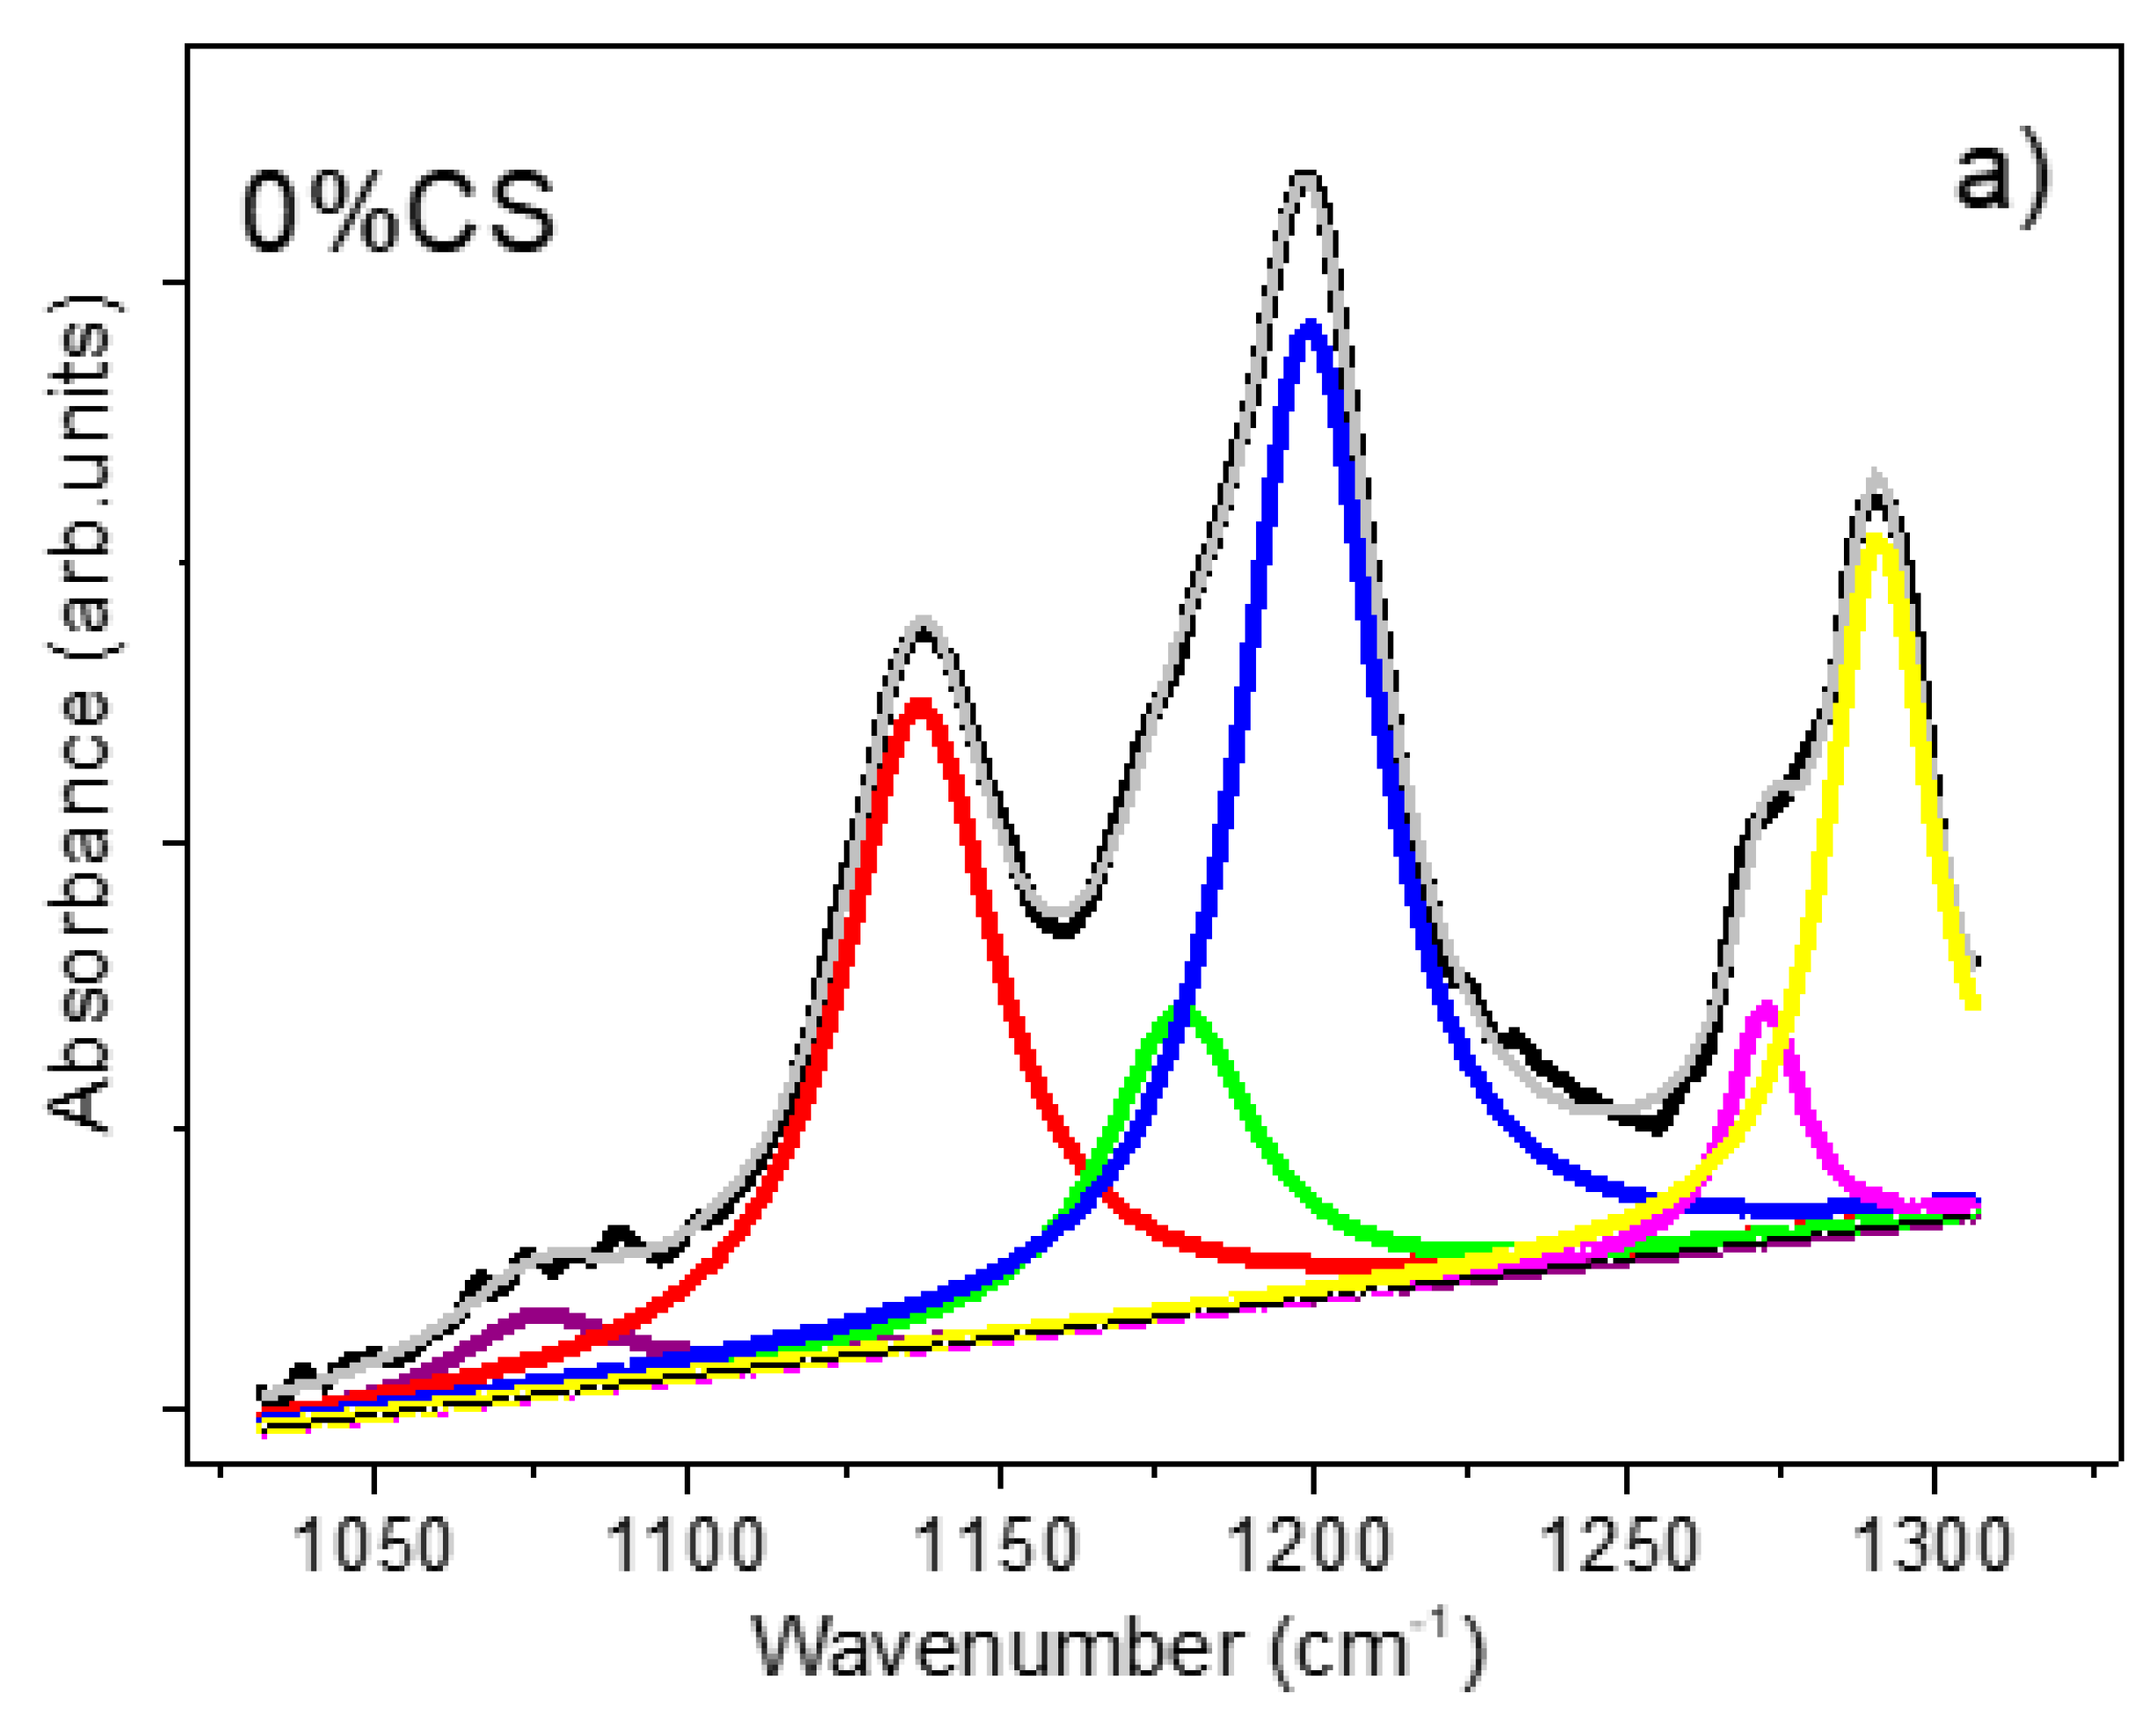
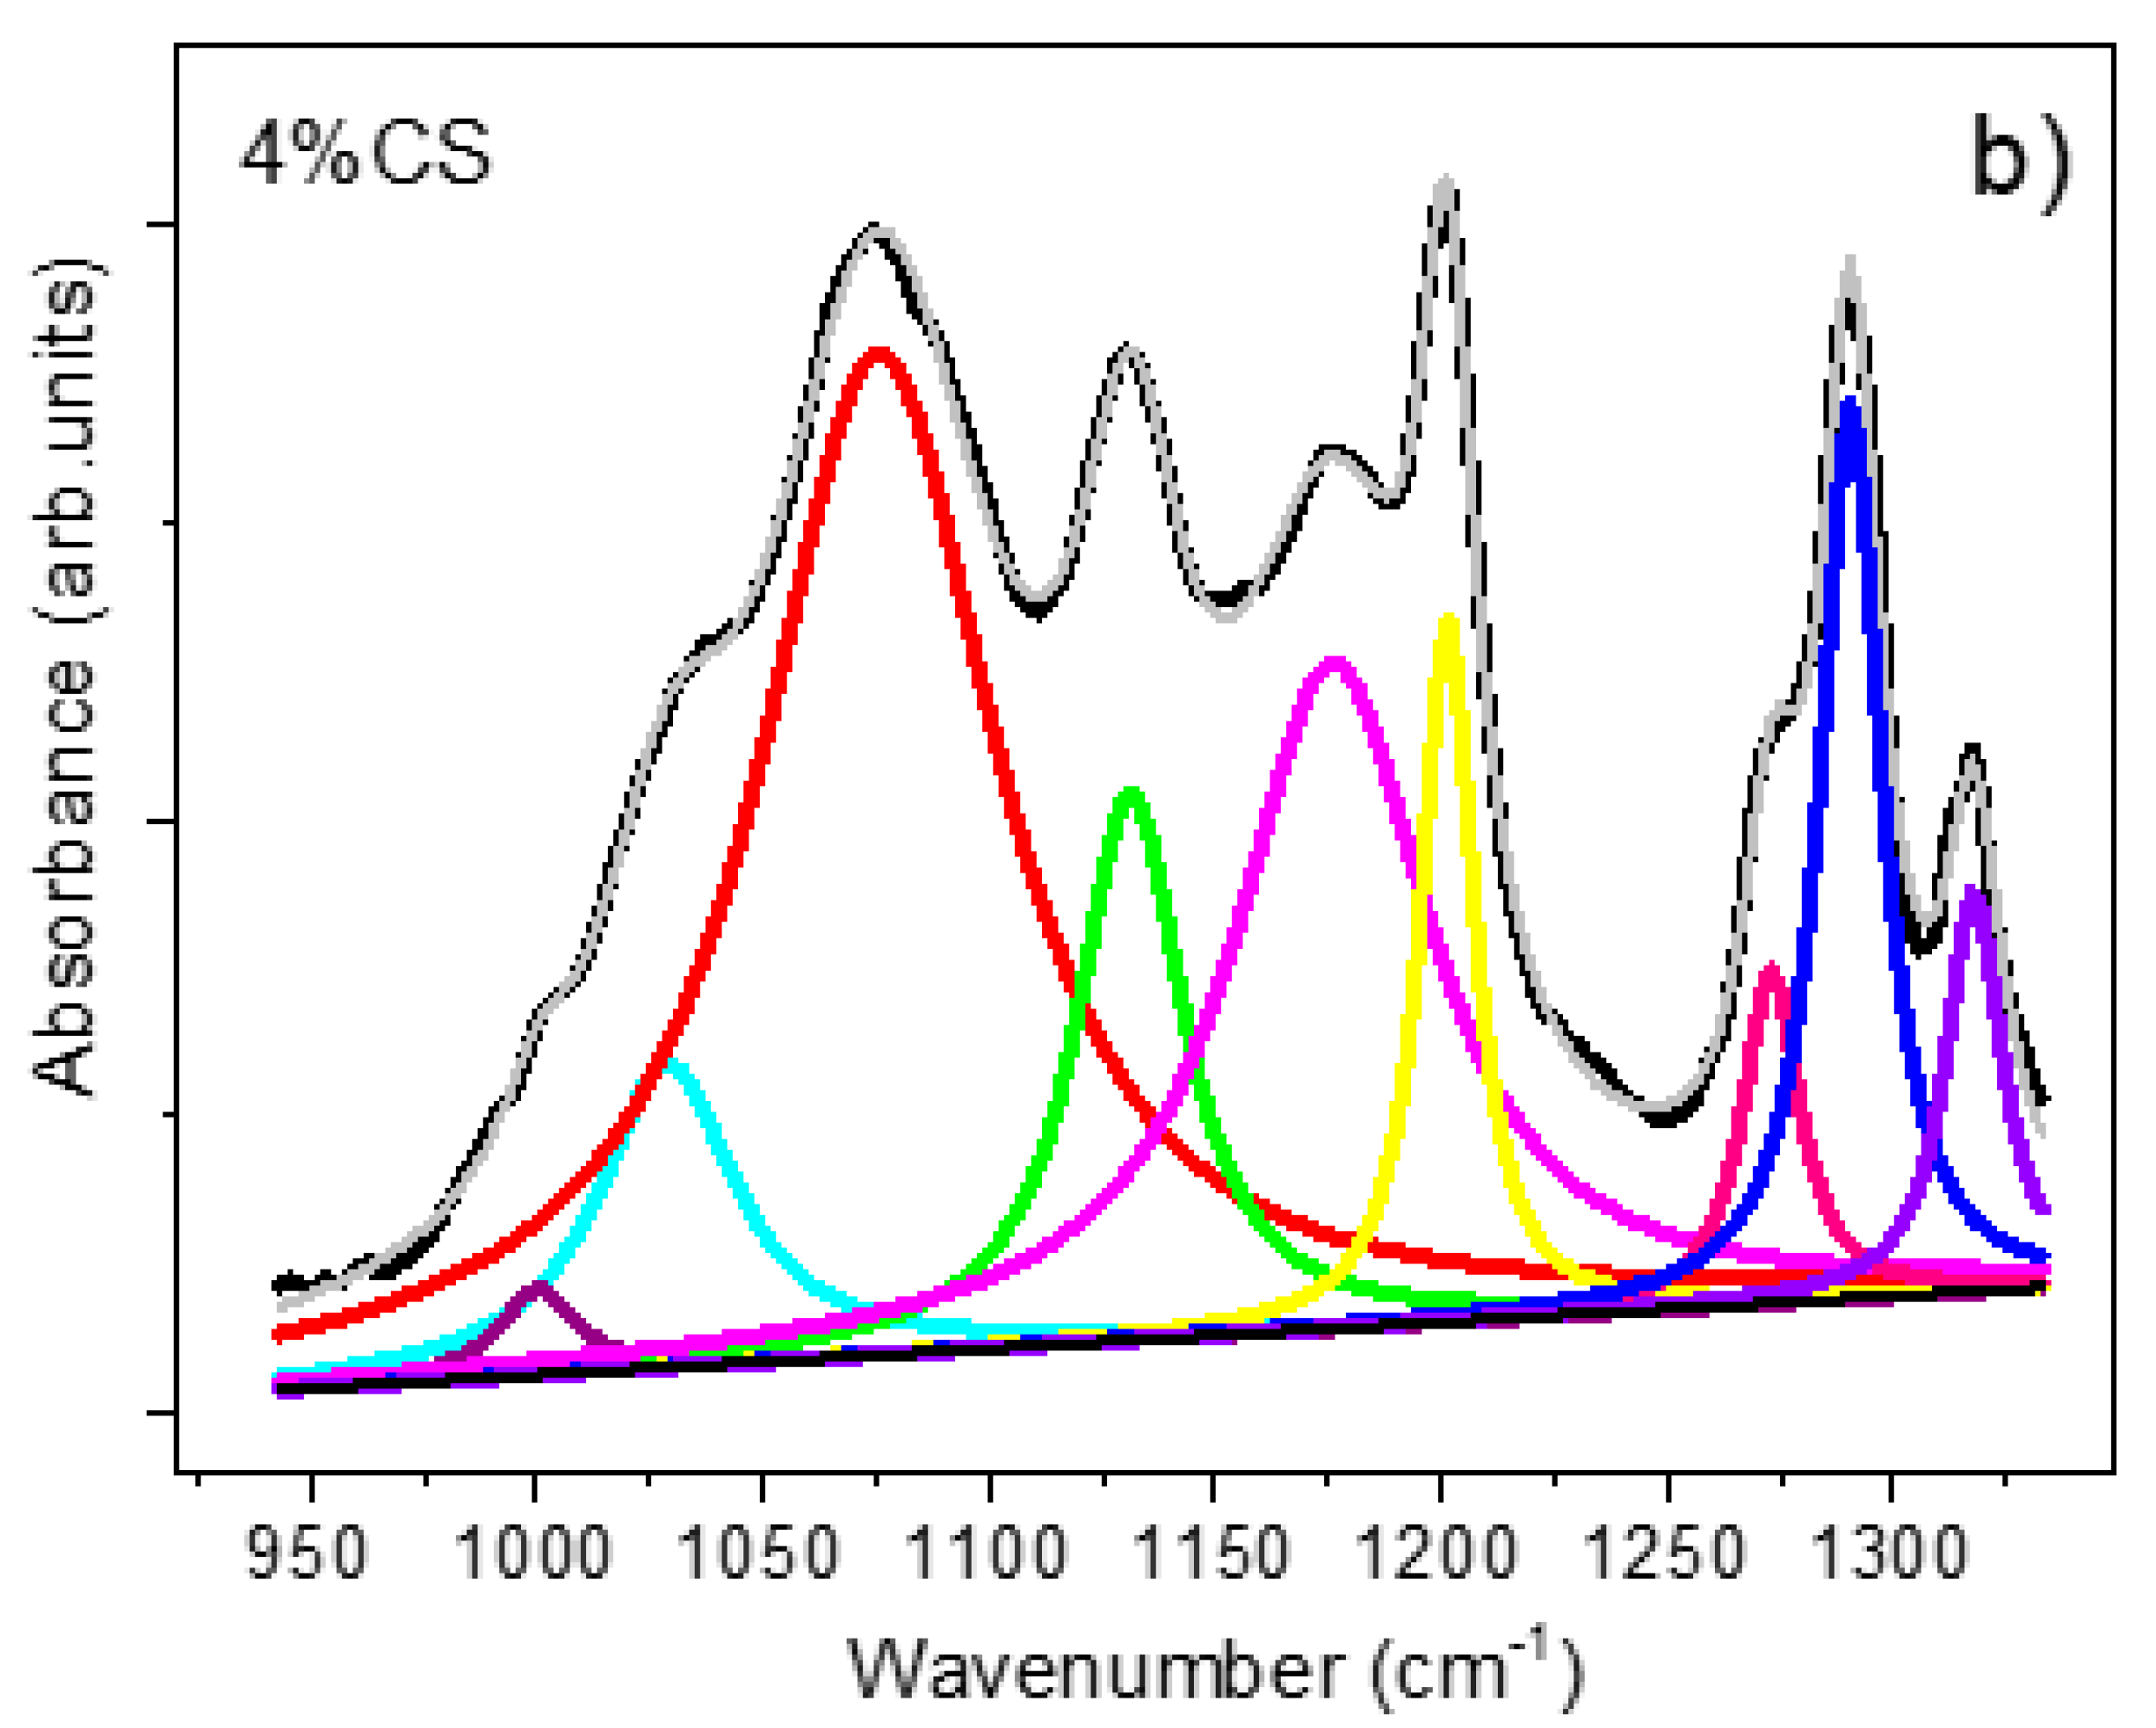
3.3.4. FTIR Spectroscopy
3.4. Drug Incorporation
Cell Viability Study
4. Conclusions
Supplementary Materials
Author Contributions
Funding
Institutional Review Board Statement
Informed Consent Statement
Data Availability Statement
Acknowledgments
Conflicts of Interest
References
- Balan, P.; Indrakumar, J.; Murali, P.; Korrapati, P.S. Bi-faceted delivery of phytochemicals through chitosan nanoparticles impregnated nanofibers for cancer therapeutics. Int. J. Biol. Macromol. 2020, 142, 201–211. [Google Scholar] [CrossRef] [PubMed]
- Khodadadi, M.; Alijani, S.; Montazeri, M.; Esmaeilizadeh, N.; Sadeghi-Soureh, S.; Pilehvar-Soltanahmadi, Y. Recent advances in electrospun nanofiber-mediated drug delivery strategies for localized cancer chemotherapy. J. Biomed. Mater. Res. Part A 2020, 108, 1444–1458. [Google Scholar] [CrossRef]
- Zhang, J.; Wang, X.; Liu, T.; Liu, S.; Jing, X. Antitumor activity of electrospun polylactide nanofibers loaded with 5-fluorouracil and oxaliplatin against colorectal cancer AU—Zhang, Jiayu. Drug Deliv. 2016, 23, 794–800. [Google Scholar] [CrossRef]
- Hu, X.L.; Liu, S.; Zhou, G.Y.; Huang, Y.B.; Xie, Z.G.; Jing, X.B. Electrospinning of polymeric nanofibers for drug delivery applications. J. Control. Release 2014, 185, 12–21. [Google Scholar] [CrossRef]
- Chou, S.F.; Carson, D.; Woodrow, K.A. Current strategies for sustaining drug release from electrospun nanofibers. J. Control. Release 2015, 220, 584–591. [Google Scholar] [CrossRef] [PubMed] [Green Version]
- Kalantari, K.; Afifi, A.M.; Jahangirian, H.; Webster, T.J. Biomedical applications of chitosan electrospun nanofibers as a green polymer—Review. Carbohydr. Polym. 2019, 207, 588–600. [Google Scholar] [CrossRef]
- Roozbahani, F.; Sultana, N.; Ismail, A.F.; Nouparvar, H. Effects of Chitosan Alkali Pretreatment on the Preparation of Electrospun PCL/Chitosan Blend Nanofibrous Scaffolds for Tissue Engineering Application. J. Nanomater. 2013. [Google Scholar] [CrossRef]
- Augustine, R.; Rehman, S.R.U.; Ahmed, R.; Zahid, A.A.; Sharifi, M.; Falahati, M.; Hasan, A. Electrospun chitosan membranes containing bioactive and therapeutic agents for enhanced wound healing. Int. J. Biol. Macromol. 2020, 156, 153–170. [Google Scholar] [CrossRef]
- Singare, D.S.; Marella, S.; Gowthamrajan, K.; Kulkarni, G.T.; Vooturi, R.; Rao, P.S. Optimization of formulation and process variable of nanosuspension: An industrial perspective. Int. J. Pharm. 2010, 402, 213–220. [Google Scholar] [CrossRef] [PubMed]
- Risbud, M.V.; Hardikar, A.A.; Bhat, S.V.; Bhonde, R.R. pH-sensitive freeze-dried chitosan–polyvinyl pyrrolidone hydrogels as controlled release system for antibiotic delivery. J. Control. Release 2000, 68, 23–30. [Google Scholar] [CrossRef]
- Archana, D.; Singh, B.K.; Dutta, J.; Dutta, P. In vivo evaluation of chitosan–PVP–titanium dioxide nanocomposite as wound dressing material. Carbohydr. Polym. 2013, 95, 530–539. [Google Scholar] [CrossRef]
- Marsano, E.; Vicini, S.; Skopinska, J.; Wisniewski, M.; Sionkowska, A. Chitosan and poly (vinyl pyrrolidone): Compatibility and miscibility of blends. In Macromolecular Symposia; Wiley: Hoboken, NJ, USA, 2004; pp. 251–260. [Google Scholar]
- Yu, D.-G.; Williams, G.R.; Yang, J.-H.; Wang, X.; Qian, W.; Li, Y. Chitosan Nanoparticles Self-Assembled from Electrospun Composite Nanofibers. J. Text. Sci. Eng. 2012, 2. [Google Scholar] [CrossRef] [Green Version]
- Homayoni, H.; Ravandi, S.A.H.; Valizadeh, M. Electrospinning of chitosan nanofibers: Processing optimization. Carbohydr. Polym. 2009, 77, 656–661. [Google Scholar] [CrossRef]
- Geng, X.; Kwon, O.-H.; Jang, J. Electrospinning of chitosan dissolved in concentrated acetic acid solution. Biomaterials 2005, 26, 5427–5432. [Google Scholar] [CrossRef] [PubMed]
- Ohkawa, K.; Cha, D.; Kim, H.; Nishida, A.; Yamamoto, H. Electrospinning of chitosan. Macromol. Rapid Commun. 2004, 25, 1600–1605. [Google Scholar] [CrossRef]
- Dhanavel, S.; Revathy, T.; Sivaranjani, T.; Sivakumar, K.; Palani, P.; Narayanan, V.; Stephen, A. 5-Fluorouracil and curcumin co-encapsulated chitosan/reduced graphene oxide nanocomposites against human colon cancer cell lines. Polym. Bull. 2020, 77, 213–233. [Google Scholar] [CrossRef]
- Hadjianfar, M.; Semnani, D.; Varshosaz, J. Polycaprolactone/chitosan blend nanofibers loaded by 5-fluorouracil: An approach to anticancer drug delivery system. Polym. Adv. Technol. 2018, 29, 2972–2981. [Google Scholar] [CrossRef]
- Patel, G.; Yadav, B.K. Formulation, Characterization and In vitro Cytotoxicity of 5-Fluorouracil Loaded Polymeric Electrospun Nanofibers for the Treatment of Skin Cancer. Recent Pat. Nanotechnol. 2019, 13, 114–128. [Google Scholar] [CrossRef]
- Yuya, N.; Kai, W.; Kim, B.-S.; Kim, I. Morphology controlled electrospun poly (Vinyl Pyrrolidone) fibers: Effects of organic solvent and relative humidity. J. Mater. Sci. Eng. Adv. Technol. 2010, 2, 97–112. [Google Scholar]
- Amariei, N.; Manea, L.; Bertea, A.; Bertea, A.; Popa, A. The influence of polymer solution on the properties of electrospun 3D nanostructures. In IOP Conference Series: Materials Science and Engineering; IOP: Bristol, UK, 2017; p. 012092. [Google Scholar]
- Yener, F.; Jirsak, O.; Gemci, R. Effect of polymer concentration on electrospinning System. In Proceedings of the Conference: Fiber Society Conference, Bursa, Turkey, 5–7 May 2010. [Google Scholar]
- Maachou, H.; Genet, M.J.; Aliouche, D.; Dupont-Gillain, C.C.; Rouxhet, P.G. XPS analysis of chitosan–hydroxyapatite biomaterials: From elements to compounds. Surf. Interface Anal. 2013, 45, 1088–1097. [Google Scholar] [CrossRef]
- Borodko, Y.; Habas, S.E.; Koebel, M.; Yang, P.; Frei, H.; Somorjai, G.A. Probing the Interaction of Poly (vinylpyrrolidone) with Platinum Nanocrystals by UV—Raman and FTIR. J. Phys. Chem. B 2006, 110, 23052–23059. [Google Scholar] [CrossRef]
- Fini, A.; Cavallari, C.; Ospitali, F. Raman and thermal analysis of indomethacin/PVP solid dispersion enteric microparticles. Eur. J. Pharm. Biopharm. 2008, 70, 409–420. [Google Scholar] [CrossRef]
- Socrates, G. Infrared and Raman Characteristic Group Frequencies, 3rd ed.; John Wiley & Sons: Hoboken, NJ, USA, 2001. [Google Scholar]
- De Faria, D.; Gil, H.; De Queiroz, A. The interaction between polyvinylpyrrolidone and I2 as probed by Raman spectroscopy. J. Mol. Struct. 1999, 478, 93–98. [Google Scholar] [CrossRef]
- Pérez, S.; Rebollar, E.; Oujja, M.; Martín, M.; Castillejo, M. Laser-induced periodic surface structuring of biopolymers. Appl. Phys. A 2013, 110, 683–690. [Google Scholar] [CrossRef]
- Rahma, A.; Munir, M.M.; Prasetyo, A.; Suendo, V.; Rachmawati, H. Intermolecular interactions and the release pattern of electrospun curcumin-polyvinyl (pyrrolidone) fiber. Biol. Pharm. Bull. 2016, 39, 163–173. [Google Scholar] [CrossRef] [PubMed] [Green Version]
- Szaraz, I.; Forsling, W. A spectroscopic study of the solvation of 1-vinyl-2-pyrrolidone and poly (1-vinyl-2-pyrrolidone) in different solvents. Polymer 2000, 41, 4831–4839. [Google Scholar] [CrossRef]
- Hao, J.S.; Chan, L.W.; Shen, Z.X.; Heng, P.W. Complexation between PVP and Gantrez polymer and its effect on release and bioadhesive properties of the composite PVP/Gantrez films. Pharm. Dev. Technol. 2005, 9, 379–386. [Google Scholar] [CrossRef]
- Huang, S.; Zhou, L.; Li, M.-C.; Wu, Q.; Kojima, Y.; Zhou, D. Preparation and properties of electrospun poly (vinyl pyrrolidone)/cellulose nanocrystal/silver nanoparticle composite fibers. Materials 2016, 9, 523. [Google Scholar] [CrossRef]
- Suknuntha, K.; Tantishaiyakul, V.; Vao-Soongnern, V.; Espidel, Y.; Cosgrove, T. Molecular modeling simulation and experimental measurements to characterize chitosan and poly (vinyl pyrrolidone) blend interactions. J. Polym. Sci. Part B Polym. Phys. 2008, 46, 1258–1264. [Google Scholar] [CrossRef]
- Roscigno, P.; Asaro, F.; Pellizer, G.; Ortona, O.; Paduano, L. Complex formation between poly (vinylpyrrolidone) and sodium decyl sulfate studied through NMR. Langmuir 2003, 19, 9638–9644. [Google Scholar] [CrossRef]
- Zając, A.; Hanuza, J.; Wandas, M.; Dymińska, L. Determination of N-acetylation degree in chitosan using Raman spectroscopy. Spectrochim. Acta Part A Mol. Biomol. Spectrosc. 2015, 134, 114–120. [Google Scholar] [CrossRef]
- Fang, N.; Chan, V.; Mao, H.-Q.; Leong, K.W. Interactions of phospholipid bilayer with chitosan: Effect of molecular weight and pH. Biomacromolecules 2001, 2, 1161–1168. [Google Scholar] [CrossRef]
- Ryan, C.; Alcock, E.; Buttimer, F.; Schmidt, M.; Clarke, D.; Pemble, M.; Bardosova, M. Synthesis and characterisation of cross-linked chitosan composites functionalised with silver and gold nanoparticles for antimicrobial applications. Sci. Technol. Adv. Mater. 2017, 18, 528–540. [Google Scholar] [CrossRef] [PubMed]
- Zhang, K.; Peschel, D.; Helm, J.; Groth, T.; Fischer, S. FT Raman investigation of novel chitosan sulfates exhibiting osteogenic capacity. Carbohydr. Polym. 2011, 83, 60–65. [Google Scholar] [CrossRef]
- Kanti, P.; Srigowri, K.; Madhuri, J.; Smitha, B.; Sridhar, S. Dehydration of ethanol through blend membranes of chitosan and sodium alginate by pervaporation. Sep. Purif. Technol. 2004, 40, 259–266. [Google Scholar] [CrossRef]
- Mincheva, R.; Manolova, N.; Sabov, R.; Kjurkchiev, G.; Rashkov, I. Hydrogels from chitosan crosslinked with poly (ethylene glycol) diacid as bone regeneration materials. e-Polymers 2004, 4, 643–653. [Google Scholar] [CrossRef] [Green Version]
- Orrego, C.; Salgado, N.; Valencia, J.; Giraldo, G.; Giraldo, O.; Cardona, C. Novel chitosan membranes as support for lipases immobilization: Characterization aspects. Carbohydr. Polym. 2010, 79, 9–16. [Google Scholar] [CrossRef]
- Austero, M.S.; Donius, A.E.; Wegst, U.G.; Schauer, C.L. New crosslinkers for electrospun chitosan fibre mats. I. Chemical analysis. J. R. Soc. Interface 2012, 9, 2551–2562. [Google Scholar] [CrossRef] [PubMed] [Green Version]
- Schiffman, J.D.; Schauer, C.L. Cross-linking chitosan nanofibers. Biomacromolecules 2007, 8, 594–601. [Google Scholar] [CrossRef]
- Chen, J.-P.; Chang, G.-Y.; Chen, J.-K. Electrospun collagen/chitosan nanofibrous membrane as wound dressing. Colloids Surf. A Physicochem. Eng. Asp. 2008, 313, 183–188. [Google Scholar] [CrossRef]
- Zhao, R.; Li, X.; Sun, B.; Zhang, Y.; Zhang, D.; Tang, Z.; Chen, X.; Wang, C. Electrospun chitosan/sericin composite nanofibers with antibacterial property as potential wound dressings. Int. J. Biol. Macromol. 2014, 68, 92–97. [Google Scholar] [CrossRef] [PubMed]
- Labuschagne, P.W.; John, M.J.; Sadiku, R.E. Investigation of the degree of homogeneity and hydrogen bonding in PEG/PVP blends prepared in supercritical CO2: Comparison with ethanol-cast blends and physical mixtures. J. Supercrit. Fluids 2010, 54, 81–88. [Google Scholar] [CrossRef]
- Zhu, L.-F.; Zheng, Y.; Fan, J.; Yao, Y.; Ahmad, Z.; Chang, M.-W. A novel core-shell nanofiber drug delivery system intended for the synergistic treatment of melanoma. Eur. J. Pharm. Sci. 2019, 137, 105002. [Google Scholar] [CrossRef] [PubMed]
- Sarhan, W.A.; Azzazy, H.M. High concentration honey chitosan electrospun nanofibers: Biocompatibility and antibacterial effects. Carbohydr. Polym. 2015, 122, 135–143. [Google Scholar] [CrossRef]
- Jouybari, M.H.; Hosseini, S.; Mahboobnia, K.; Boloursaz, L.A.; Moradi, M.; Irani, M. Simultaneous controlled release of 5-FU, DOX and PTX from chitosan/PLA/5-FU/g-C3N4-DOX/g-C3N4-PTX triaxial nanofibers for breast cancer treatment in vitro. Colloids Surf. B Biointerfaces 2019, 179, 495–504. [Google Scholar] [CrossRef]
- Mccarron, P.A.; Woolfson, A.D.; Keating, S.M. Sustained release of 5-fluorouracil from polymeric nanoparticles. J. Pharm. Pharmacol. 2000, 52, 1451–1459. [Google Scholar] [CrossRef]
- Cheng, M.; Gao, X.; Wang, Y.; Chen, H.; He, B.; Xu, H.; Li, Y.; Han, J.; Zhang, Z. Synthesis of glycyrrhetinic acid-modified chitosan 5-fluorouracil nanoparticles and its inhibition of liver cancer characteristics in vitro and in vivo. Mar. Drugs 2013, 11, 3517–3536. [Google Scholar] [CrossRef]
- Smith, T.; Affram, K.; Bulumko, E.; Agyare, E. Evaluation of in-vitro cytotoxic effect of 5-FU loaded-chitosan nanoparticles against spheroid models. J. Nat. Sci. 2018, 4, e535. [Google Scholar] [PubMed]
- Rose, P.A.; Praseetha, P.; Bhagat, M.; Alexander, P.; Abdeen, S.; Chavali, M. Drug embedded PVP coated magnetic nanoparticles for targeted killing of breast cancer cells. Technol. Cancer Res. Treat. 2013, 12, 463–472. [Google Scholar] [CrossRef]
- Rejinold, N.S.; Chennazhi, K.; Nair, S.; Tamura, H.; Jayakumar, R. Biodegradable and thermo-sensitive chitosan-g-poly (N-vinylcaprolactam) nanoparticles as a 5-fluorouracil carrier. Carbohydr. Polym. 2011, 83, 776–786. [Google Scholar] [CrossRef]
- Szalai, B.; Subramanian, V.; Holland, C.H.; Alföldi, R.; Puskás, L.G.; Saez-Rodriguez, J. Signatures of cell death and proliferation in perturbation transcriptomics data—from confounding factor to effective prediction. Nucleic Acids Res. 2019, 47, 10010–10026. [Google Scholar] [CrossRef] [PubMed] [Green Version]
- Hu, J.; Zeng, F.; Wei, J.; Chen, Y.; Chen, Y. Novel controlled drug delivery system for multiple drugs based on electrospun nanofibers containing nanomicelles. J. Biomater. Sci. Polym. Ed. 2014, 25, 257–268. [Google Scholar] [CrossRef] [PubMed]
- Mano, J.; Silva, G.; Azevedo, H.S.; Malafaya, P.; Sousa, R.; Silva, S.S.; Boesel, L.; Oliveira, J.M.; Santos, T.; Marques, A. Natural origin biodegradable systems in tissue engineering and regenerative medicine: Present status and some moving trends. J. R. Soc. Interface 2007, 4, 999–1030. [Google Scholar] [CrossRef] [Green Version]


| Element | Sample (%) | ||||
|---|---|---|---|---|---|
| A | B | C | D | E | |
| C 1s | 67.75 | 72.02 | 71.60 | 71.33 | 71.98 |
| N 1s | 6.17 | 9.44 | 9.28 | 8.55 | 8.31 |
| O 1s | 19.99 | 15.41 | 16.38 | 17.86 | 17.91 |
| F 1s | 0 | 2.22 | 2.11 | 0 | 0 |
Publisher’s Note: MDPI stays neutral with regard to jurisdictional claims in published maps and institutional affiliations. |
© 2021 by the authors. Licensee MDPI, Basel, Switzerland. This article is an open access article distributed under the terms and conditions of the Creative Commons Attribution (CC BY) license (https://creativecommons.org/licenses/by/4.0/).
Share and Cite
Grant, J.J.; Pillai, S.C.; Perova, T.S.; Hehir, S.; Hinder, S.J.; McAfee, M.; Breen, A. Electrospun Fibres of Chitosan/PVP for the Effective Chemotherapeutic Drug Delivery of 5-Fluorouracil. Chemosensors 2021, 9, 70. https://0-doi-org.brum.beds.ac.uk/10.3390/chemosensors9040070
Grant JJ, Pillai SC, Perova TS, Hehir S, Hinder SJ, McAfee M, Breen A. Electrospun Fibres of Chitosan/PVP for the Effective Chemotherapeutic Drug Delivery of 5-Fluorouracil. Chemosensors. 2021; 9(4):70. https://0-doi-org.brum.beds.ac.uk/10.3390/chemosensors9040070
Chicago/Turabian StyleGrant, Jamie J., Suresh C. Pillai, Tatiana S. Perova, Sarah Hehir, Steven J. Hinder, Marion McAfee, and Ailish Breen. 2021. "Electrospun Fibres of Chitosan/PVP for the Effective Chemotherapeutic Drug Delivery of 5-Fluorouracil" Chemosensors 9, no. 4: 70. https://0-doi-org.brum.beds.ac.uk/10.3390/chemosensors9040070