
A Paper-Based Potentiometric Platform for Determination of Water Hardness


1
Department of Analytical and Organic Chemistry, Universitat Rovira i Virgili, 43007 Tarragona, Spain
2
Laboratory of Electrochemistry-Corrosion, Metallurgy and Inorganic Chemistry, Faculty of Chemistry, University of Sciences and Technology, Houari Boumediene, USTHB, B.P. 32, Algiers 16111, Algeria
*
Author to whom correspondence should be addressed.
Chemosensors 2021, 9(5), 96; https://0-doi-org.brum.beds.ac.uk/10.3390/chemosensors9050096
Submission received: 10 March 2021
/
Revised: 23 April 2021
/
Accepted: 25 April 2021
/
Published: 28 April 2021
(This article belongs to the Special Issue Paper-Based Sensors and Microfluidic Devices)
Abstract
:A novel paper-based potentiometric platform for the simple and fast monitoring of water hardness is presented. First, potentiometric ion-selective electrodes for calcium and magnesium printed on a paper substrate were built and optimized. These sensors, which display near-Nernstian sensitivity, were used for the determination of the concentration of these cations and the calculation of the water hardness. Second, the incorporation of a solid-state reference electrode allowed building an integrated paper-based potentiometric cell for the determination of the hardness of artificial and real samples (mineral waters). The validation of the results shows good ability to predict hardness in the conventional scale. Truly decentralized measurements were demonstrated by integration of a miniaturized instrument and dedicated software in a portable device. The measurements were able to be performed in just under two minutes, including a two-point calibration. Since the method is simple to use and cost-effective, it can be implemented in domestic and industrial settings.
1. Introduction
Water quality has a direct impact on natural and physiological processes as well as in human activities. Water hardness, defined as the sum of the concentration of Ca2+ and Mg2+ cations, is one of the most basic and routinely performed determinations in water analysis, since the abundance and chemistry of these ions have a major impact in a plethora of fields. A popular form to measure this parameter is a scale that ranges from soft to hard waters, directly related to the concentration levels of Ca2+ and Mg2+. Thus, instead of the individual levels of these cations, hardness is calculated as a degree. Therefore, water can be classified into categories ranging from soft to very hard (Table S1) [1].
One of the main reasons that drives the interest on water hardness is the low solubility of many Ca2+ and Mg2+ salts, such as carbonates, sulphates or phosphates, which leads to problems with a significant economic impact. The formation of solid deposits, films and incrustations leads to problems, such as clogging or changes in transport and heat exchange properties with major implications for industrial, domestic and social infrastructures. Hardness also affects the organoleptic properties of water, has a direct impact on the production of beverages and foods, and impacts the performance of soaps and other cleaning products. As a result, significant efforts—such as the use of water “softeners”—are devoted to keeping the hardness level under control. Devices with ion-exchange cartridges are often used in the water pre-processing stage. Alternatively, water softening by the addition of complexing agents is also employed. Interestingly, recent studies have also suggested some positive effects of water hardness on health, such as the reduction of cardiovascular mortality [2,3]. In any case, as the saying goes, it is hard to manage what cannot be measured. Although it is a very basic parameter, improving methods that can monitor water hardness may have significant social and economic impact.
The standard method for measuring hardness is complexometric titration using EDTA [4]. The approach is cheap, simple and accessible; several commercial kits for domestic use are available [5]. Nevertheless, it requires the manipulation of liquids and certain skills in order to reduce determination errors. While this is the method of choice for common use, simplification of the process as well as reducing the steps of the methodology, i.e., the addition of drops of titrants, may have benefits for domestic use, particularly with people without previous lab skills.
During the last decades, several alternatives have been proposed [6]. In 2002, Saurina et al. reported an array of potentiometric sensors for monitoring calcium, ammonium, potassium, sodium, lithium, magnesium and hydrogen ion. Although the performance of the ion-selective electrodes were not optimized (reduced linear range and sensitivity were reported), hardness determination was demonstrated for water samples using chemometric tools to analyze the response of the potentiometric sensor array [7]. Capitán-Vallvey et al. developed an optical test strip based on the ion-exchange mechanism for calcium and magnesium simultaneously [8]. Although the methodology takes 5 min of immersion into the sample, validation against complexometry shows suitable results. This method is straightforward and simple to use with real samples. Acoustic wave sensors were also reported in 2007 [9]. Indeed, the selective cocktail containing the ionophore and the polymer matrix was cast onto a quartz crystal and measurements were achieved through flow injection. The methodology was compared with EDTA titration for real sample analysis with excellent recovery. Tsogas et al. described the formation of coacervate phase produced by metal cations and an anionic surfactant in the presence of methanol [10]. The spectrophotometric detection allowed the measurements of real samples and reported good reproducibility. Hardness was also reported based on a fluorescence resonance energy transfer using two dyes to determine calcium and magnesium [11]. Recently, Shariati-Rad and Heidari used silver nanoparticles for the determination of hardness in real samples [12].
Improvements have been also introduced in order to integrate the analytical procedure with the detection scheme. In particular, efforts have been focused on the integration of the sampling procedure with the steps for calibration and determination. For instance, an automatic flow injection analysis based on pH measurements of the EDTA solutions allowed the detection of calcium and magnesium [13]. A few samples were determined and compared to batch determination with good recovery. A printed 3D channel was also developed by Bhattacharjee et al. with light emitting diodes and photodiodes [14].
Water hardness is one of those parameters where the use of distributed analytical tools—i.e., widespread systems to generate chemical information on-site—would be ideal. Recently, metallic organic frameworks based on copper were reported for the adsorption of calcium and magnesium ions in water as well as the corresponding potentiometric sensors for water hardness determination [15]. Nevertheless, the above-mentioned methods require the development of robust, simple-to-operate and economically-accessible tools. Many of the systems mentioned above do not fulfill all these needs. We have developed low-cost electrochemical platforms based on potentiometric sensors [16,17]. Potentiometry is a simple, robust and effective technique to determine the concentration of ions. Indeed, we have shown that paper-based potentiometric systems for detection of lithium [18] and potassium [19] in whole blood can be developed. Paper-based potentiometry lowers costs and makes the construction of chemical sensors more accessible while preserving the analytical performance. Several examples of paper-based potentiometry for decentralized applications have been described during recent years [20,21,22,23,24]. Our group has demonstrated that paper-based sensors for peroxide and biosensors for glucose in whole blood can be successfully developed.
In this work, we introduce for the first time a complete, paper-based potentiometric cell for the determination of water hardness. Calcium and magnesium sensors were built and optimized for the determination of these ions in drinking water and were then coupled to a reference electrode for the construction of a whole, disposable potentiometric cell validated in artificial and real samples. An in situ demonstration is shown with a simple and portable instrumentation to afford a measurement within two minutes.
2. Experimental
Chemicals. Analytical grade salts of sodium bicarbonate (NaHCO₃), anhydrous sodium sulfate (Na2SO4), sodium nitrate (NaNO3), chloride salts of calcium, magnesium, sodium and potassium, calcium ionophore II (ETH 129), magnesium ionophore VI (ETH 5506), potassium tetrakis (4-chlorophenyl) borate (KTpClPB) with >98% purity, 2-nitrophenyl octyl ether (o-NPOE), high molecular weight polyvinyl chloride (PVC), tetrahydrofuran (THF) and methanol were obtained from Sigma-Aldrich. Polyvinyl butyral (PVB) (Butvar B-98) was obtained from Quimidroga S.A. (Barcelona, Spain). All solutions and standards were prepared using 18.2 MΩ cm−1 double deionized water obtained from Milli-Q PLUS (Millipore Corporation, Bedford, MA, USA).
Electrochemical Measurements. Electromotive force (EMF) was measured with a high input impedance device (1015Ω EMF16 multichannel data acquisition, Lawson Laboratories, Inc. Malvern, USA) at room temperature (22 °C) in a well-stirred solution. A double junction Ag/AgCl/KCl 3 M reference electrode (type 6.0726.100, Methrom AG) containing a 1 M LiAcO electrode bridge was used. In all cases, the time trace of the EMF upon the addition of the analytes was used to build the calibration curves. To do so, linear regression was employed in order to define the slope as the sensitivity (mV/dec) and the range as the linear range in the performance reported (Table 1, Table 2 and Table S3). In all cases, the R-squared in the regression analysis was higher than 0.99.
Spectroscopic Measurements. Atomic Absorption Spectroscopy (AAS) and Atomic Emission Spectroscopy (AES) (Unicam Solar 969) were used to compare with the potentiometric predictions of concentration of Mg2+ and Ca2+. Linear regression was used in the 0.1–0.5 mg mL−1 range, herein.
Decentralized measurement. The potentiometric cell was connected to a Yocto-milliVolt-Rx-BNC voltmeter (Yoctopuce, Geneva, Switzerland) for the in situ measurement. The device was connected to a tablet equipped with a home-built program (Python programming language) for the calibration to obtain the sensitivity as well as the prediction of concentration.
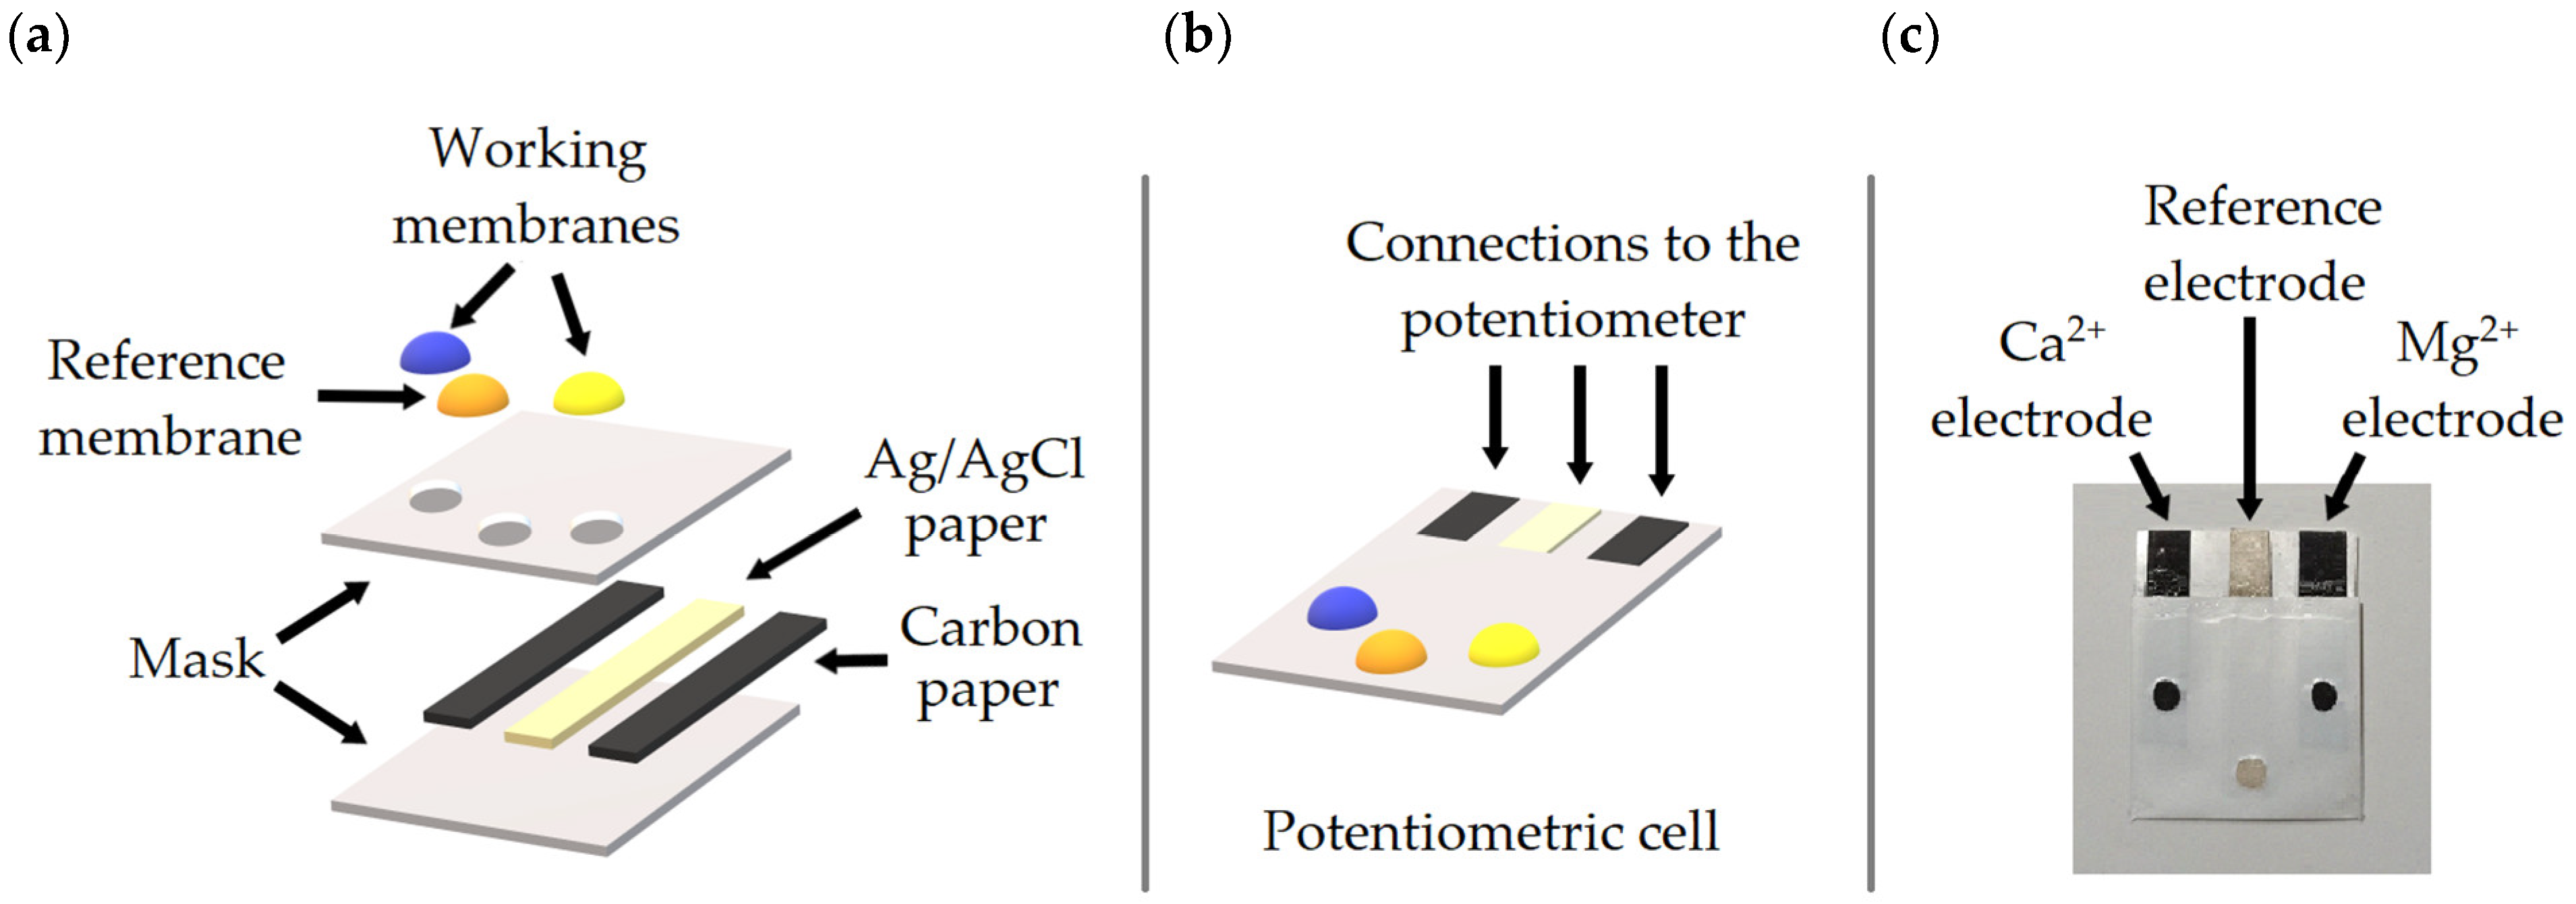
Fabrication of carbon-ink paper-based ion-selective electrode (ISE). Whatman® Grade 5 qualitative filter papers were painted with Carbon ink (screen-printable electrically conductive ink, 122-49, Creative Materials, Inc., Ayer, MA, USA) to form a homogenous layer and were allowed to dry at room temperature. Details of the sensor construction can be found elsewhere [16]. In short, the conductive paper was “sandwiched” between two adhesive plastic masks (ARCare 8259, Adhesives Research, Inc., Glen Rock, PA, USA), one of which has orifices that leave the conductive material exposed. This orifice (radius = 1.5 mm) is the electroactive window. For practical purposes, each arrangement contained three electrodes, as shown in Figure 1.
Preparation of ion-selective membranes and reference membrane. For the ion-selective membrane (ISM), a poly(vinyl chloride)/plasticizer ratio of 1:3 was employed with the cation exchanger/ionophore molar ratio, as detailed in Table S2. The cocktail was dissolved in THF (1 mL) and vigorously sonicated with a bath sonicator (Branson 3800 ultrasonic cleaner); the resulting polymeric matrix will be referred to as the membrane cocktail in the following. The membrane cocktail (15 µL) was drop-cast onto the carbon-ink paper. The reference membrane was prepared by dissolving 78 mg of PVB and 50 mg of NaCl in 1 mL of methanol. The cocktail was shaken vigorously in order to achieve a homogenous solution. Again, a total of 15 µL of the reference membrane was drop-cast [25].
Fabrication of paper-based potentiometric cell. In order to build the working electrodes, 15 µL of the membrane cocktail were drop-cast onto the electroactive window (Figure 1a) while the Ag/AgCl ink-based paper substrate was used for the reference electrode (Creative Materials, Inc., Ayer, MA, USA). The working electrodes were conditioned for 5 h in 10−2 M solutions of the primary analyte, then in 10−5 M solutions of the primary analyte for approximately 30 min; no additional conditioning was required and the working electrodes were kept dry. The reference electrode was conditioned during 24 h in a 3 M KCl stirred solution. Based on the geometry of the potentiometric cell, here, the conditioning was achieved by drop instead of immersion. Thereafter, the reference electrode was kept wet until use by the use of a wet tissue on top of the reference electrode. This tissue was changed every day to keep the humidity constant.
3. Results and Discussion
3.1. Development of Paper-Based ISE for Ca2+ and Mg2+
Paper-based ion-selective electrodes were built for the detection of Ca2+ and Mg2+ based on previous works from our research group [16,18,19]. Originally, carbon nanotubes ink was introduced as both an ion-to-electron transducer and conductive electrode path in paper-based sensors [16]. More recently, the nanotubes ink was replaced by commercial carbon ink, and showed suitable performance in a real-case scenario while improving practical aspects, such as manufacturing and cost [19]. To be fair, one of the main advantages of using special types of ion-to-electron transducers, such as nanomaterials or conducting polymers, is enhanced limits of detection (LODs) and long-term stability. The generation of a water layer, for example, is known to produce instabilities over the long term. In single-use paper-based sensors—and particularly in this work—these factors have less importance. Therefore, carbon ink was selected to construct the sensors since it reduces cost and simplifies manufacturing. Notably, three sensors were built into a single piece for assessing reproducibility (Figure 1). At first, the analytical parameters were characterized for each sensor separately, i.e., from one side the Ca2+ ISEs and from the other side the Mg2+ ISEs. Near-Nernstian sensitivity and comparable performance to conventional ISEs were obtained (Table S3). Then, calibration curves for both Ca2+ and Mg2+ were performed at the same time, i.e., in a single potentiometric cell with the simultaneous addition of standards of calcium and magnesium (Figure 2). Indeed, as the hardness degree is calculated from the concentration of both calcium and magnesium ions, we assumed that this methodology would be more suitable for a truly decentralized measurement. Table 1 and Table 2 summarize the main analytical parameters: the sensitivity of both sensors is comparable (29.8 mV/dec) in a broad linear range (10−6–10−1 M). The dynamic range matches the expected range in real water samples.
Selectivity was assessed by calculating the selectivity coefficients using the separate solution method (SSM) [26]. The results are in good agreement with the previously reported data (Table 1 and Table 2). Although it is known that magnesium ISE may suffer interference from calcium (log k −1.7 ± 0.1, see Table 1 entry 6), in the determination of hardness, the difference in concentration of these cations rarely exceeds one order of magnitude. Thus, we did not foresee any serious interference to be taken into account at this stage. Overall, these preliminary results show that the paper-based sensors keep the performance of conventional sensors while the cost of manufacturing is drastically reduced.
The economic aspects of these devices offer an attractive outlook. The substrate of the electrodes is made of filter paper and conductive carbon inks, both commodity materials. Furthermore, the ink can be applied through direct printing, one of the oldest, and perhaps cheapest, mass-manufacturing techniques. The membrane is made mostly of a conventional polymer (PVC) and a plasticizer, and can be also applied through a direct drop-casting technique. The ionophore is the most “expensive” component, but the amount required in each sensor makes the contribution to the overall cost negligible. Thus, from a manufacturing point of view, the approach offers potential to develop low-cost devices. Market price, on the other hand, would be subject to a significantly more complex analysis that falls beyond the scope of this work.

Table 1.
Comparison of the analytical parameters of the paper-based Mg-ISE (N = 3).
| Mg2+ Paper-Based ISE | Previous Works: [27,28] | |
|---|---|---|
| Sensitivity (mV/decade) | 29.8 ± 0.1 | 28.2 ± 0.6 * |
| Linear range (M) | 10−6–10−1 | 10−5–10−1 * |
| Detection limit (M) | 3.6 × 10⁻⁷ | 9.5 × 10⁻⁷ * |
| −3.8 ± 0.1 | −3.6 ± 0.1 ** | |
| −2.1 ± 0.1 | −2.9 ± 0.1 ** | |
| −1.7 ± 0.1 | −1.9 ± 0.1 ** |
* Glassy carbon. ** Philips IS-561 electrode bodies.
Table 2.
Comparison of the analytical parameters of the paper-based Ca-ISE (N = 3).
| Ca2+ Paper-Based ISE | Previous Works: [29,30] | |
|---|---|---|
| Sensitivity (mV/decade) | 29.8 ± 0.2 | 27.3 ± 0.8 * |
| Linear range (M) | 10−6–10−1 | 10−5–10−1 * |
| Detection limit (M) | 3.3 × 10⁻⁷ | 10−8.8 * |
| −10.6 ± 0.3 | −8.3 ± 0.2 ** | |
| −8.5 ± 0.2 | −10.1 ± 0.2 ** | |
| −7.9 ± 0.2 | −9.3 ± 0.1 ** |
* Philips electrode body (IS 561). ** FIM method.
3.2. Prediction of Water Hardness in Lab-Made Testing Solutions
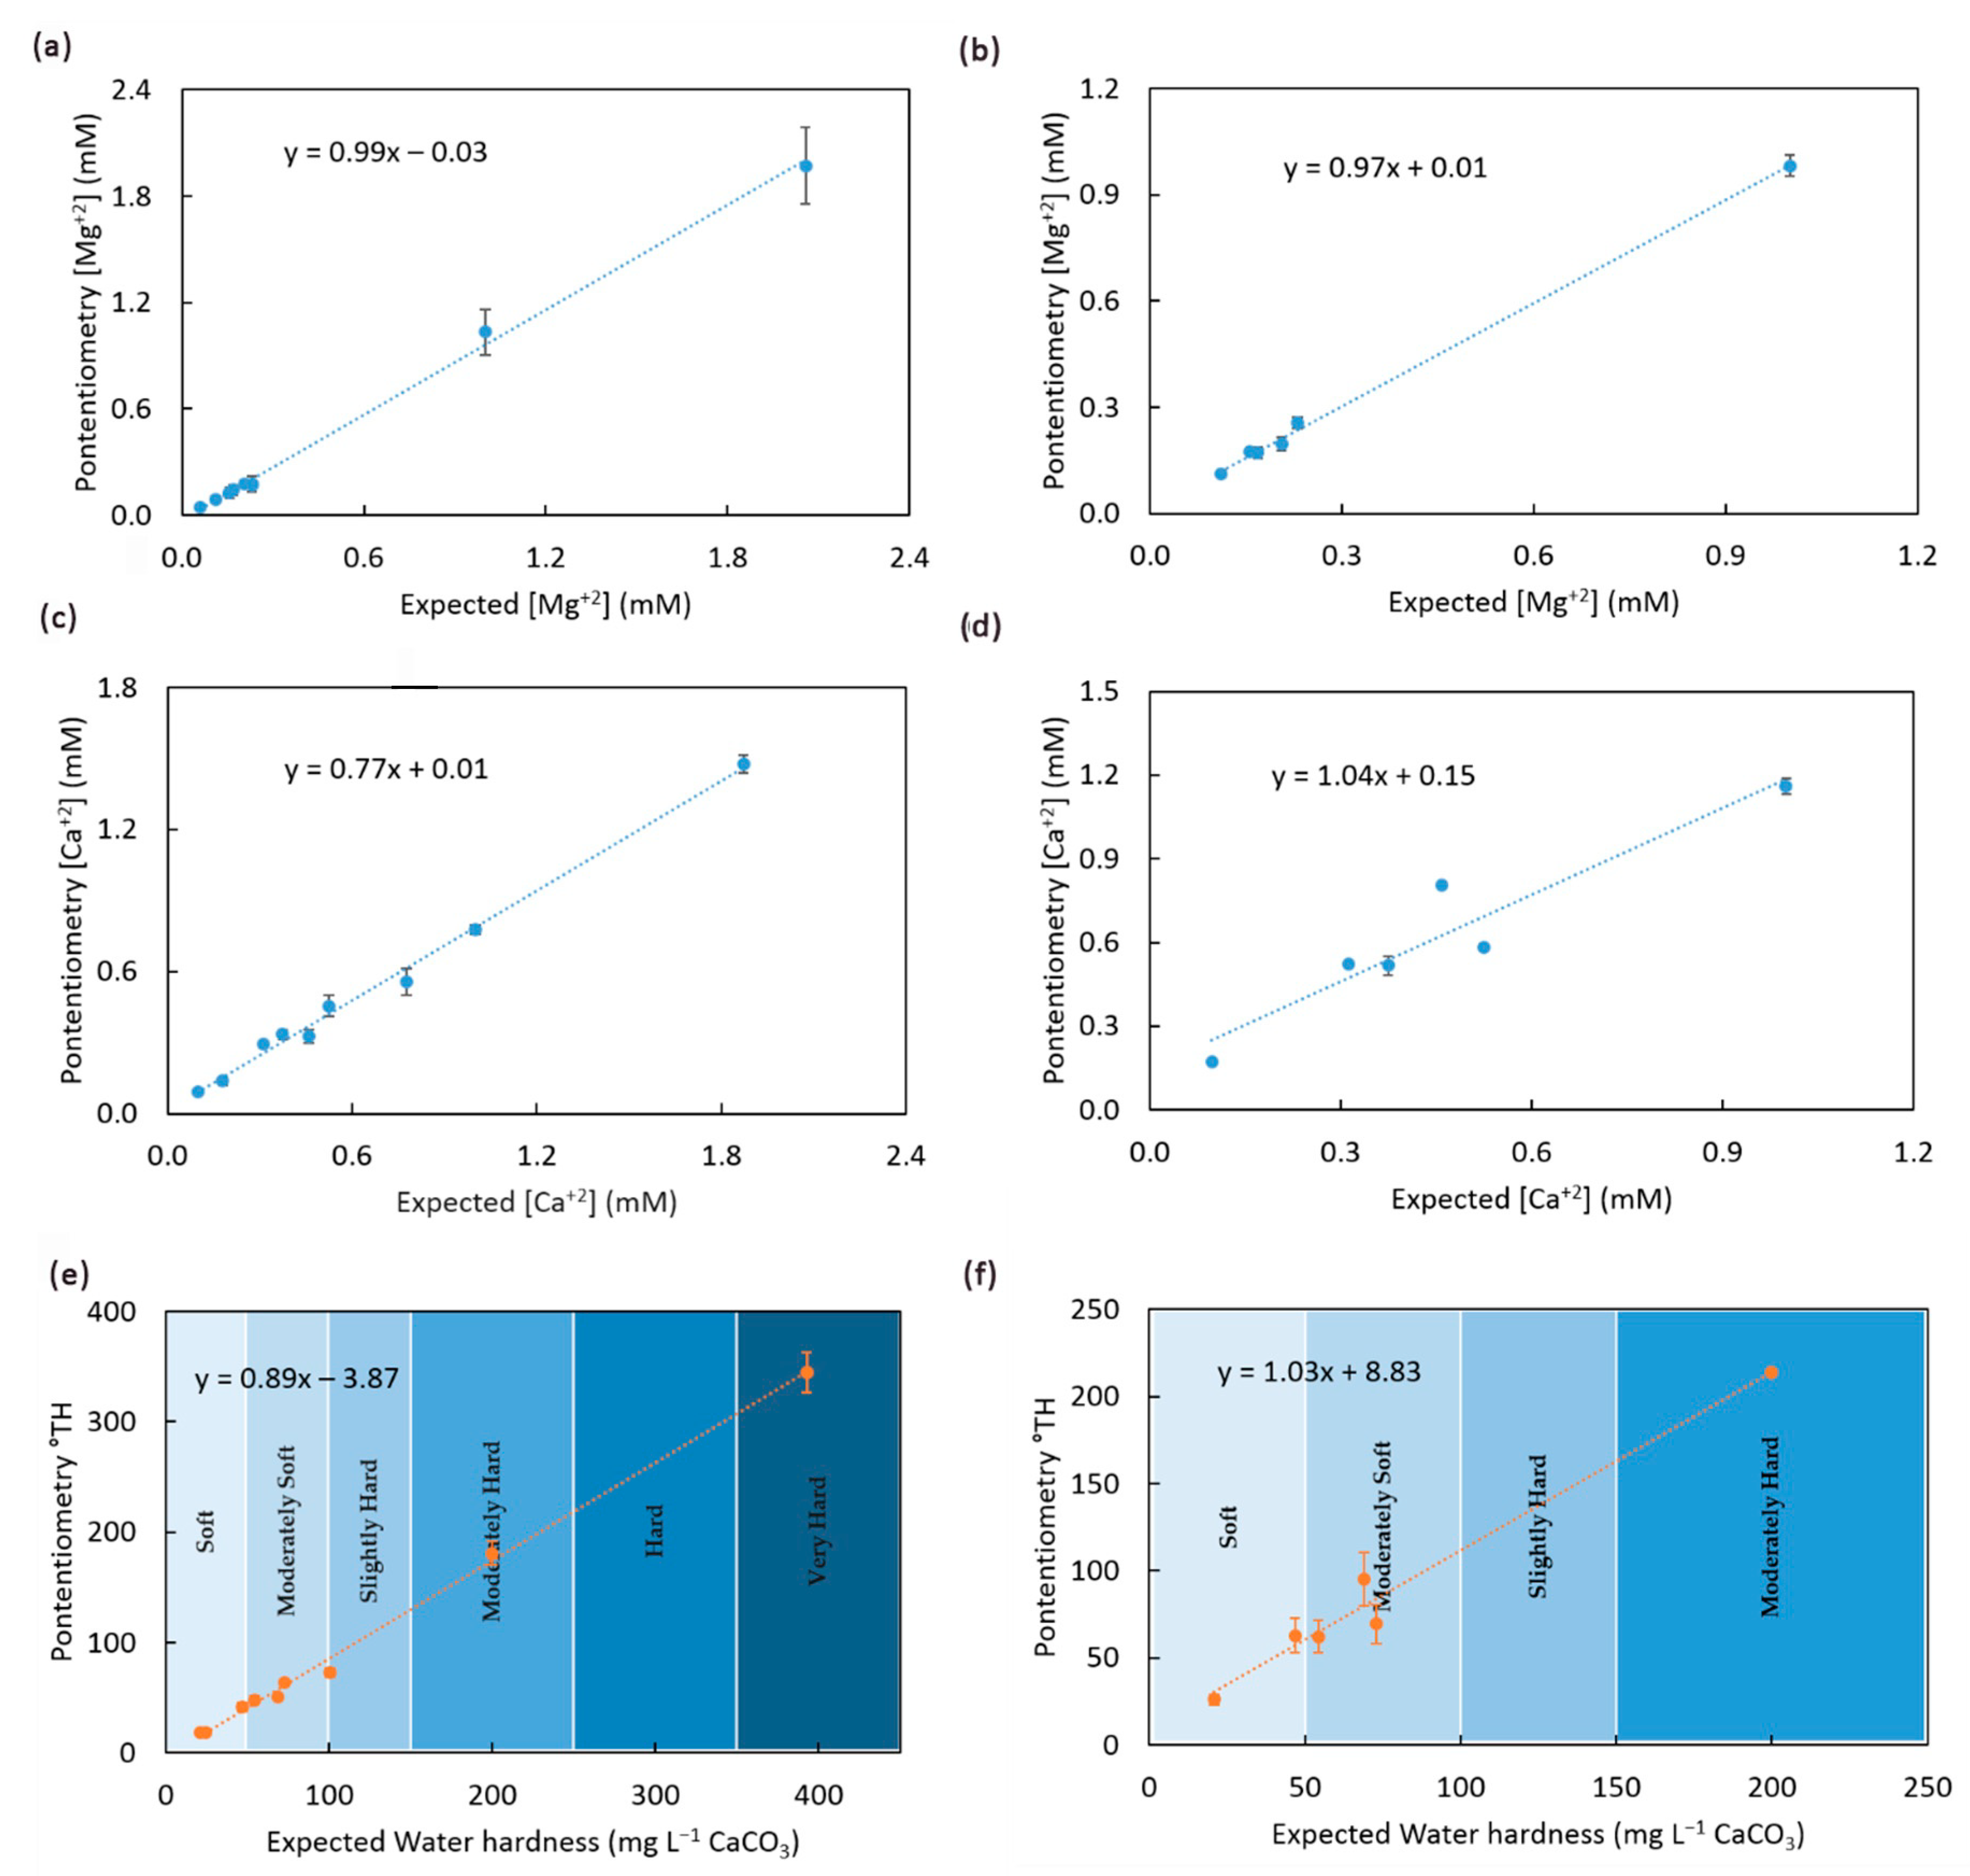
Once the paper-based ISEs were developed, we ran the determination of total hardness in several testing solutions (Figure 3 with N = 9 and N = 6 for separate and simultaneous measurements). Total hardness (°TH) will be expressed as mg L−1 of CaCO3.
In view of truly decentralized measurements, the influence of the dilution of the sample was first assessed. Measurements were first performed in two undiluted samples, and then in consecutive dilutions with factors of 2, 10 and 50 (Figure S1). The results show that while dilution has some impact on the accuracy, the effect is not significant when aiming to classify the samples in terms of their hardness. Therefore, the following determinations were performed in undiluted samples with no pre-treatment. A total of 11 testing solutions (Table S4) were prepared based on reported levels in order to assess the performance of the sensors over a wide range of water hardness, from 0 to 50, since 50 is considered very hard water [31]. Again, determinations were first run separately and then simultaneously (Figure 3). The standard deviation corresponds to the measurements of three different sensors (N = 3). Here, the data were compared to the expected values given by the weighted amount. The concentrations of calcium and magnesium obtained are summarized in Table S5.
Figure 3 shows the results of the validation for the separate and simultaneous determinations of ions. The individual determination of Mg2+ (Figure 3a) shows very good results when compared to the standard method. In the case of the individual determination of Ca2+ (Figure 3c), a certain degree of bias is observed. We could not pinpoint yet the exact nature of this error (although it could be corrected if needed). In any case, in the final calculation of hardness, this problem is rectified. The results are more promising when the two ions are determined simultaneously. In this case, the determination of both Mg2+ in the presence of Ca2+ (Figure 3b) and Ca2+ in the presence of Mg2+ (Figure 3d) show relatively good performance and no detectable biases. What is more relevant, the water hardness can be predicted with a good degree of accuracy, as shown in Figure 3f. In this last case, the standard deviation and recovery for the ISEs were comparable to the values given by the separated method (Table S5). While it is true that a higher number of samples may improve the correlation and reduce deviation and bias, these results are encouraging from a proof-of-principle perspective. Therefore, the performance of the working electrodes was considered appropriate, and the incorporation of the reference electrode in order to build a whole potentiometric cell was performed.
3.3. Development of the Potentiometric Cell and Determinations in Real Samples
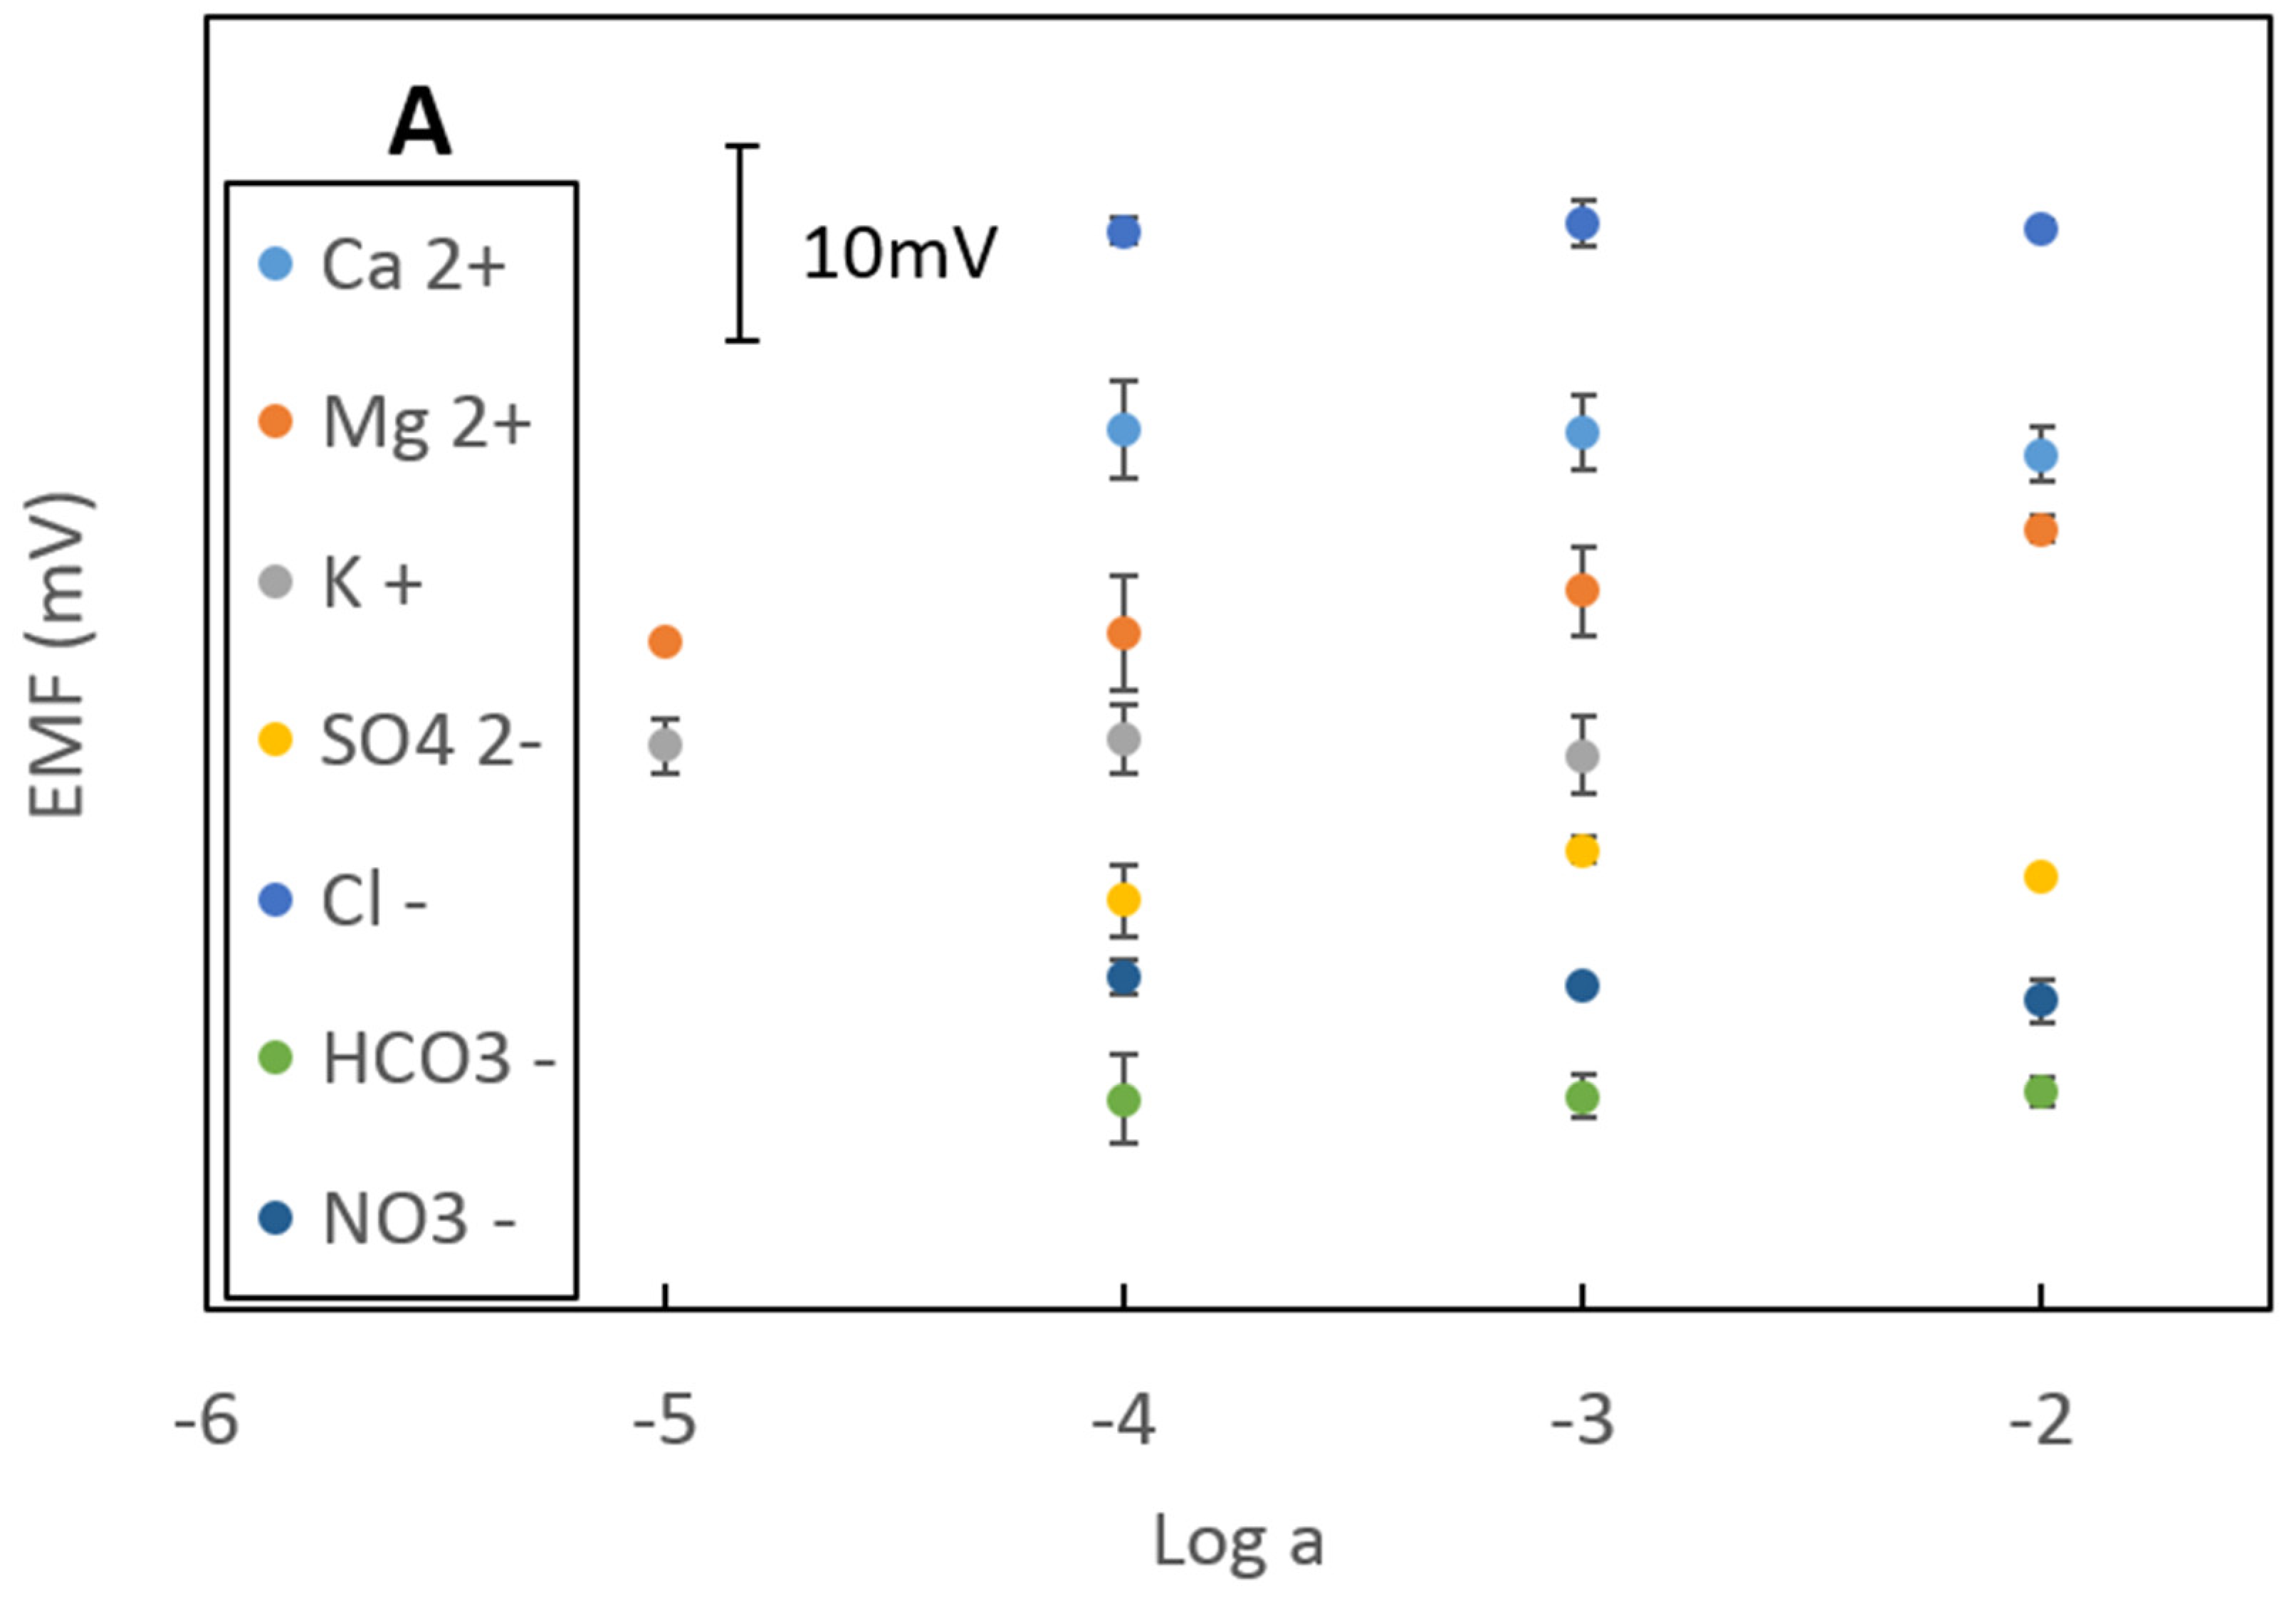
A whole potentiometric cell was built by incorporating a paper-based reference electrode to the calcium and magnesium electrode arrangement, a necessary step when developing a truly decentralized tool. This reference electrode was made as described previously [15,16]. For this work, the performance was also tested for several species presents in drinking water at different concentration ranges. The response of the reference electrode to increasing concentration of different salts is displayed in Figure 4A. The results show no significant response in the whole concentration range, suggesting that the reference electrode can be safely used in these measurements.
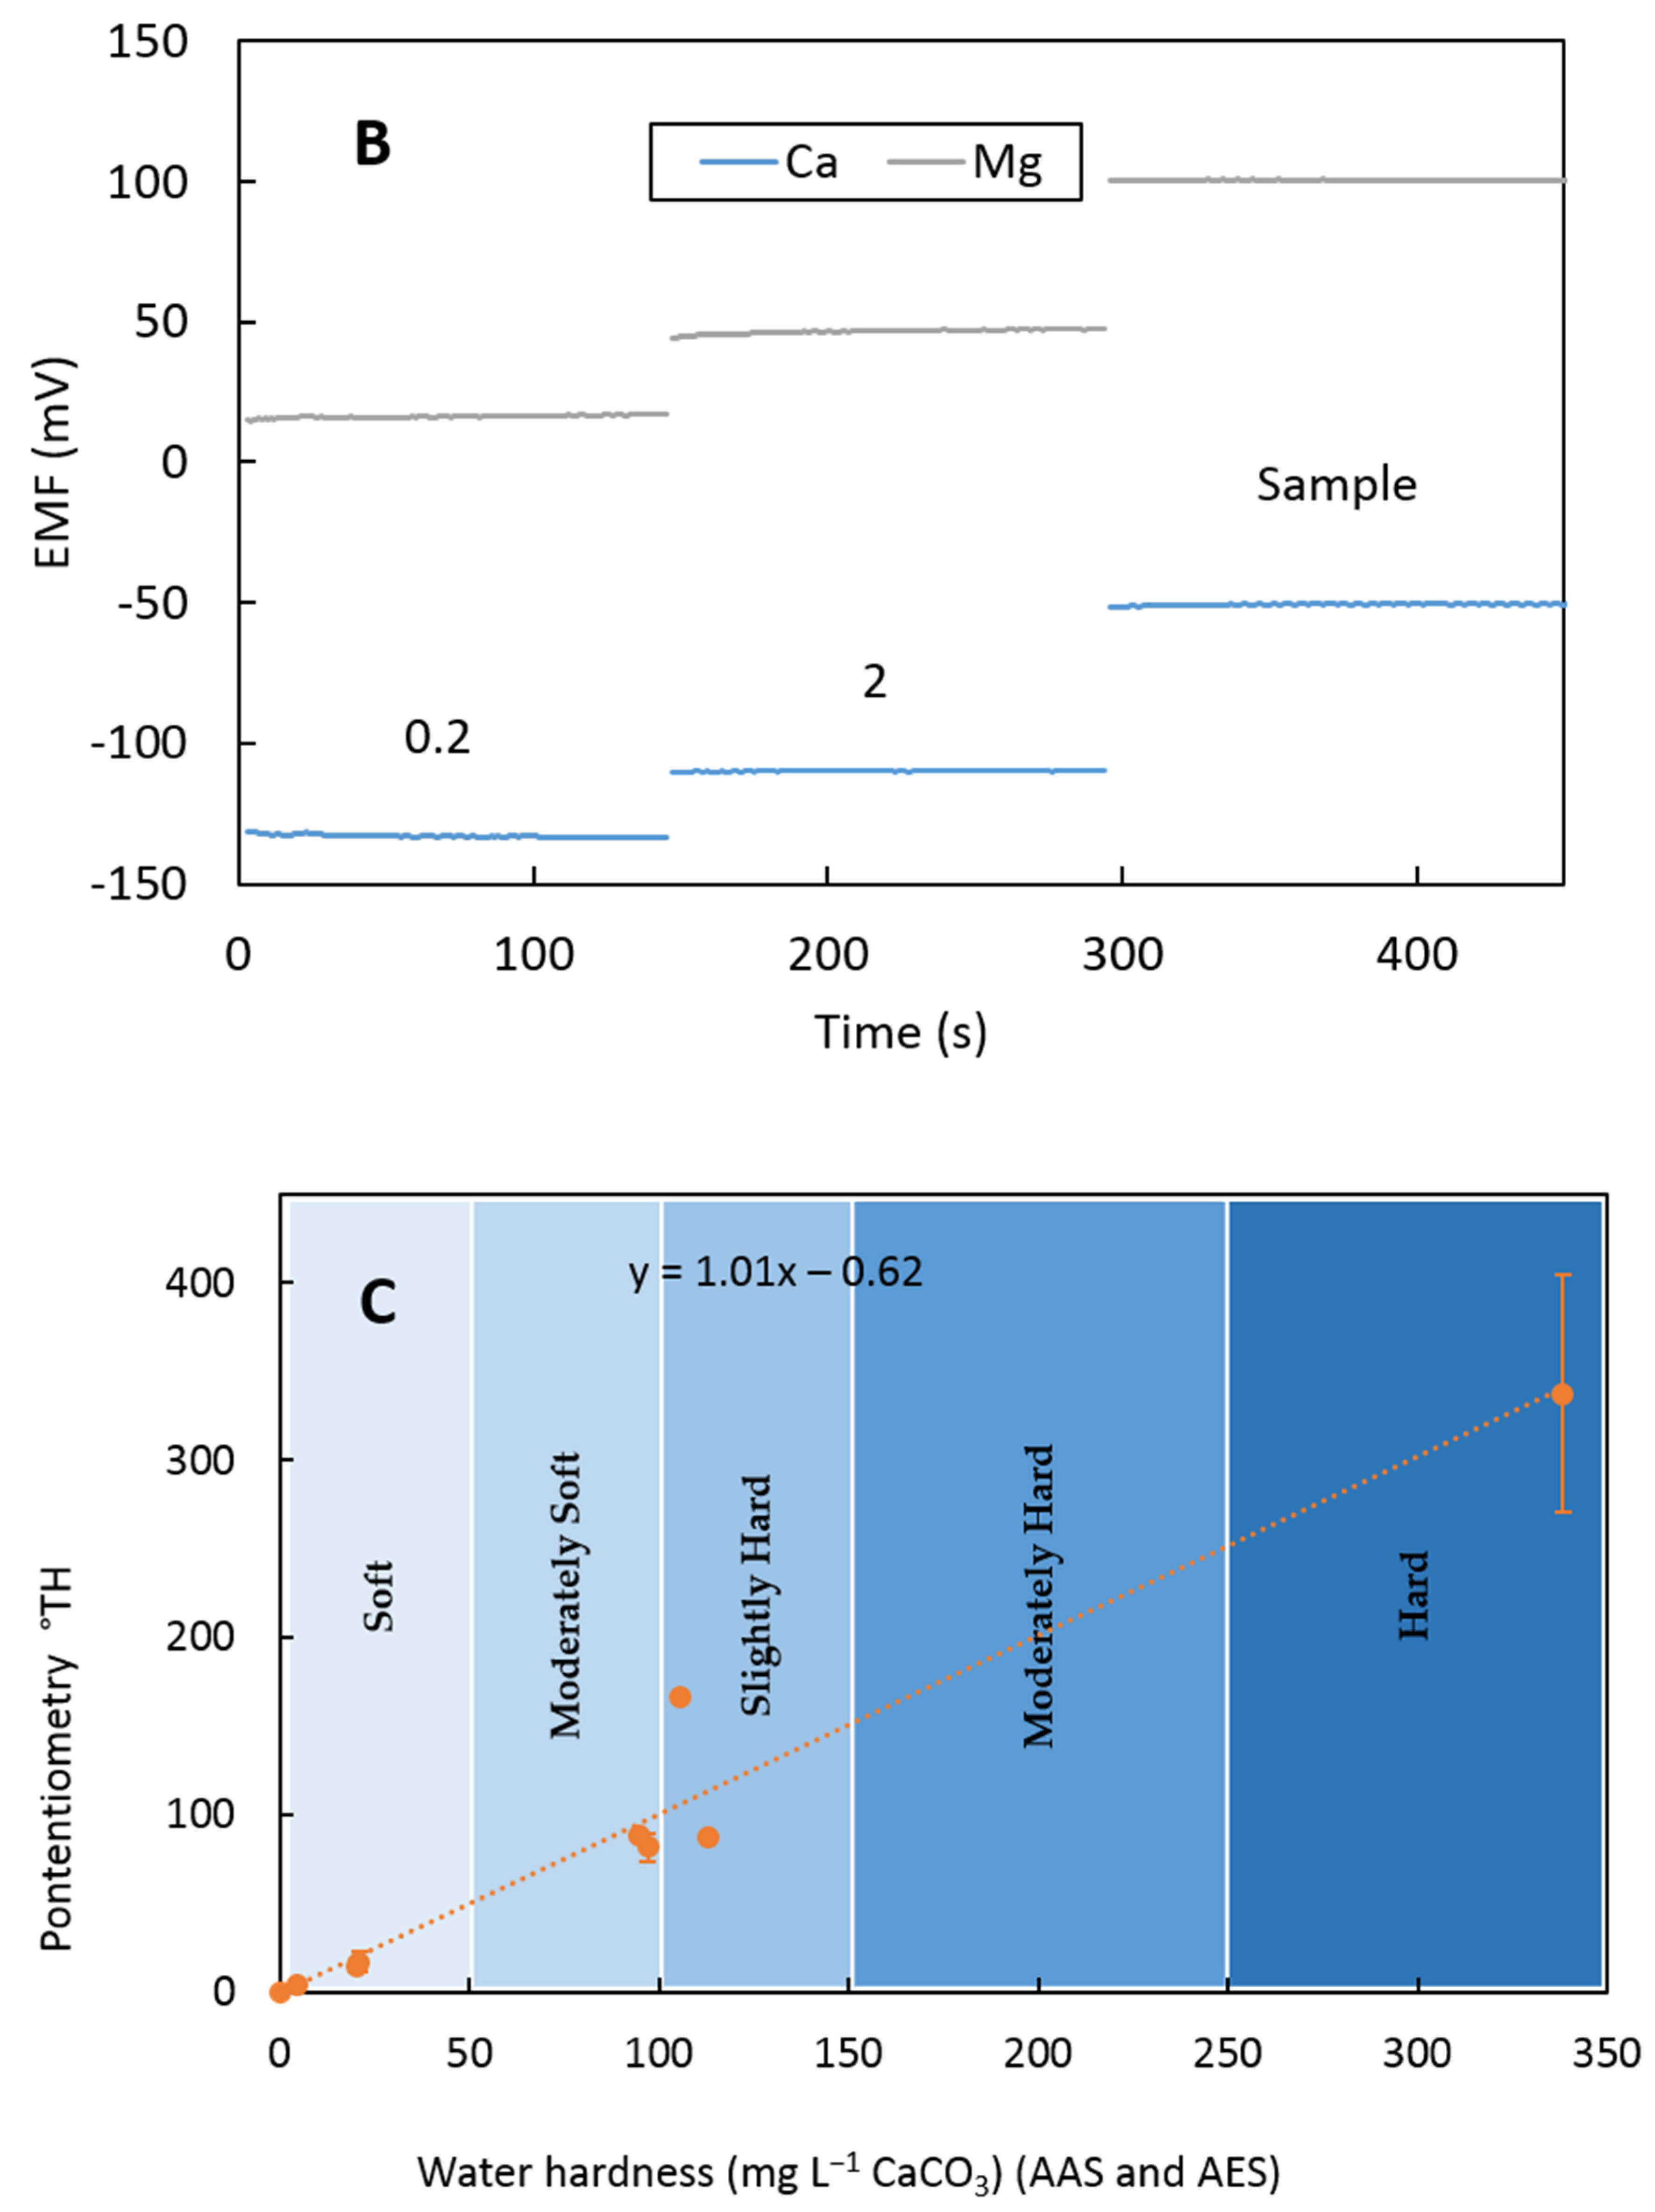
For the determination of hardness in real samples, first a two-point calibration was performed before measuring the sample (Figure 4b). Standards of 10−6 M and 10−5 M (−6 and −5 in log scale) of Mg2+ and Ca2+ (corresponding to 0.2 and 2 as total hardness) were selected in order to verify the sensitivity in a concentration range lower than that of the samples, thus reducing the risk of cross-contamination. Figure 4b shows a typical time trace for a single measurement. The measurement was extended for a total of approximately 6 min (2 min per measurement) to illustrate the stability of the system. From this plot, it is clear that the signal is stable enough to reduce significantly the measuring time, as it will be shown in the next section.
A total of 9 samples were therefore measured (mineral waters and tap water). With the optimized paper-based cell, the prediction was compared to the standard method (AAS and AES). Figure 4c shows an outstanding correlation without bias (y = 1.01x − 0.06). At this stage, the methodology is suitable for a demo in a real case scenario.
3.4. Proof-of-Concept of Decentralized Water Hardness Measurement
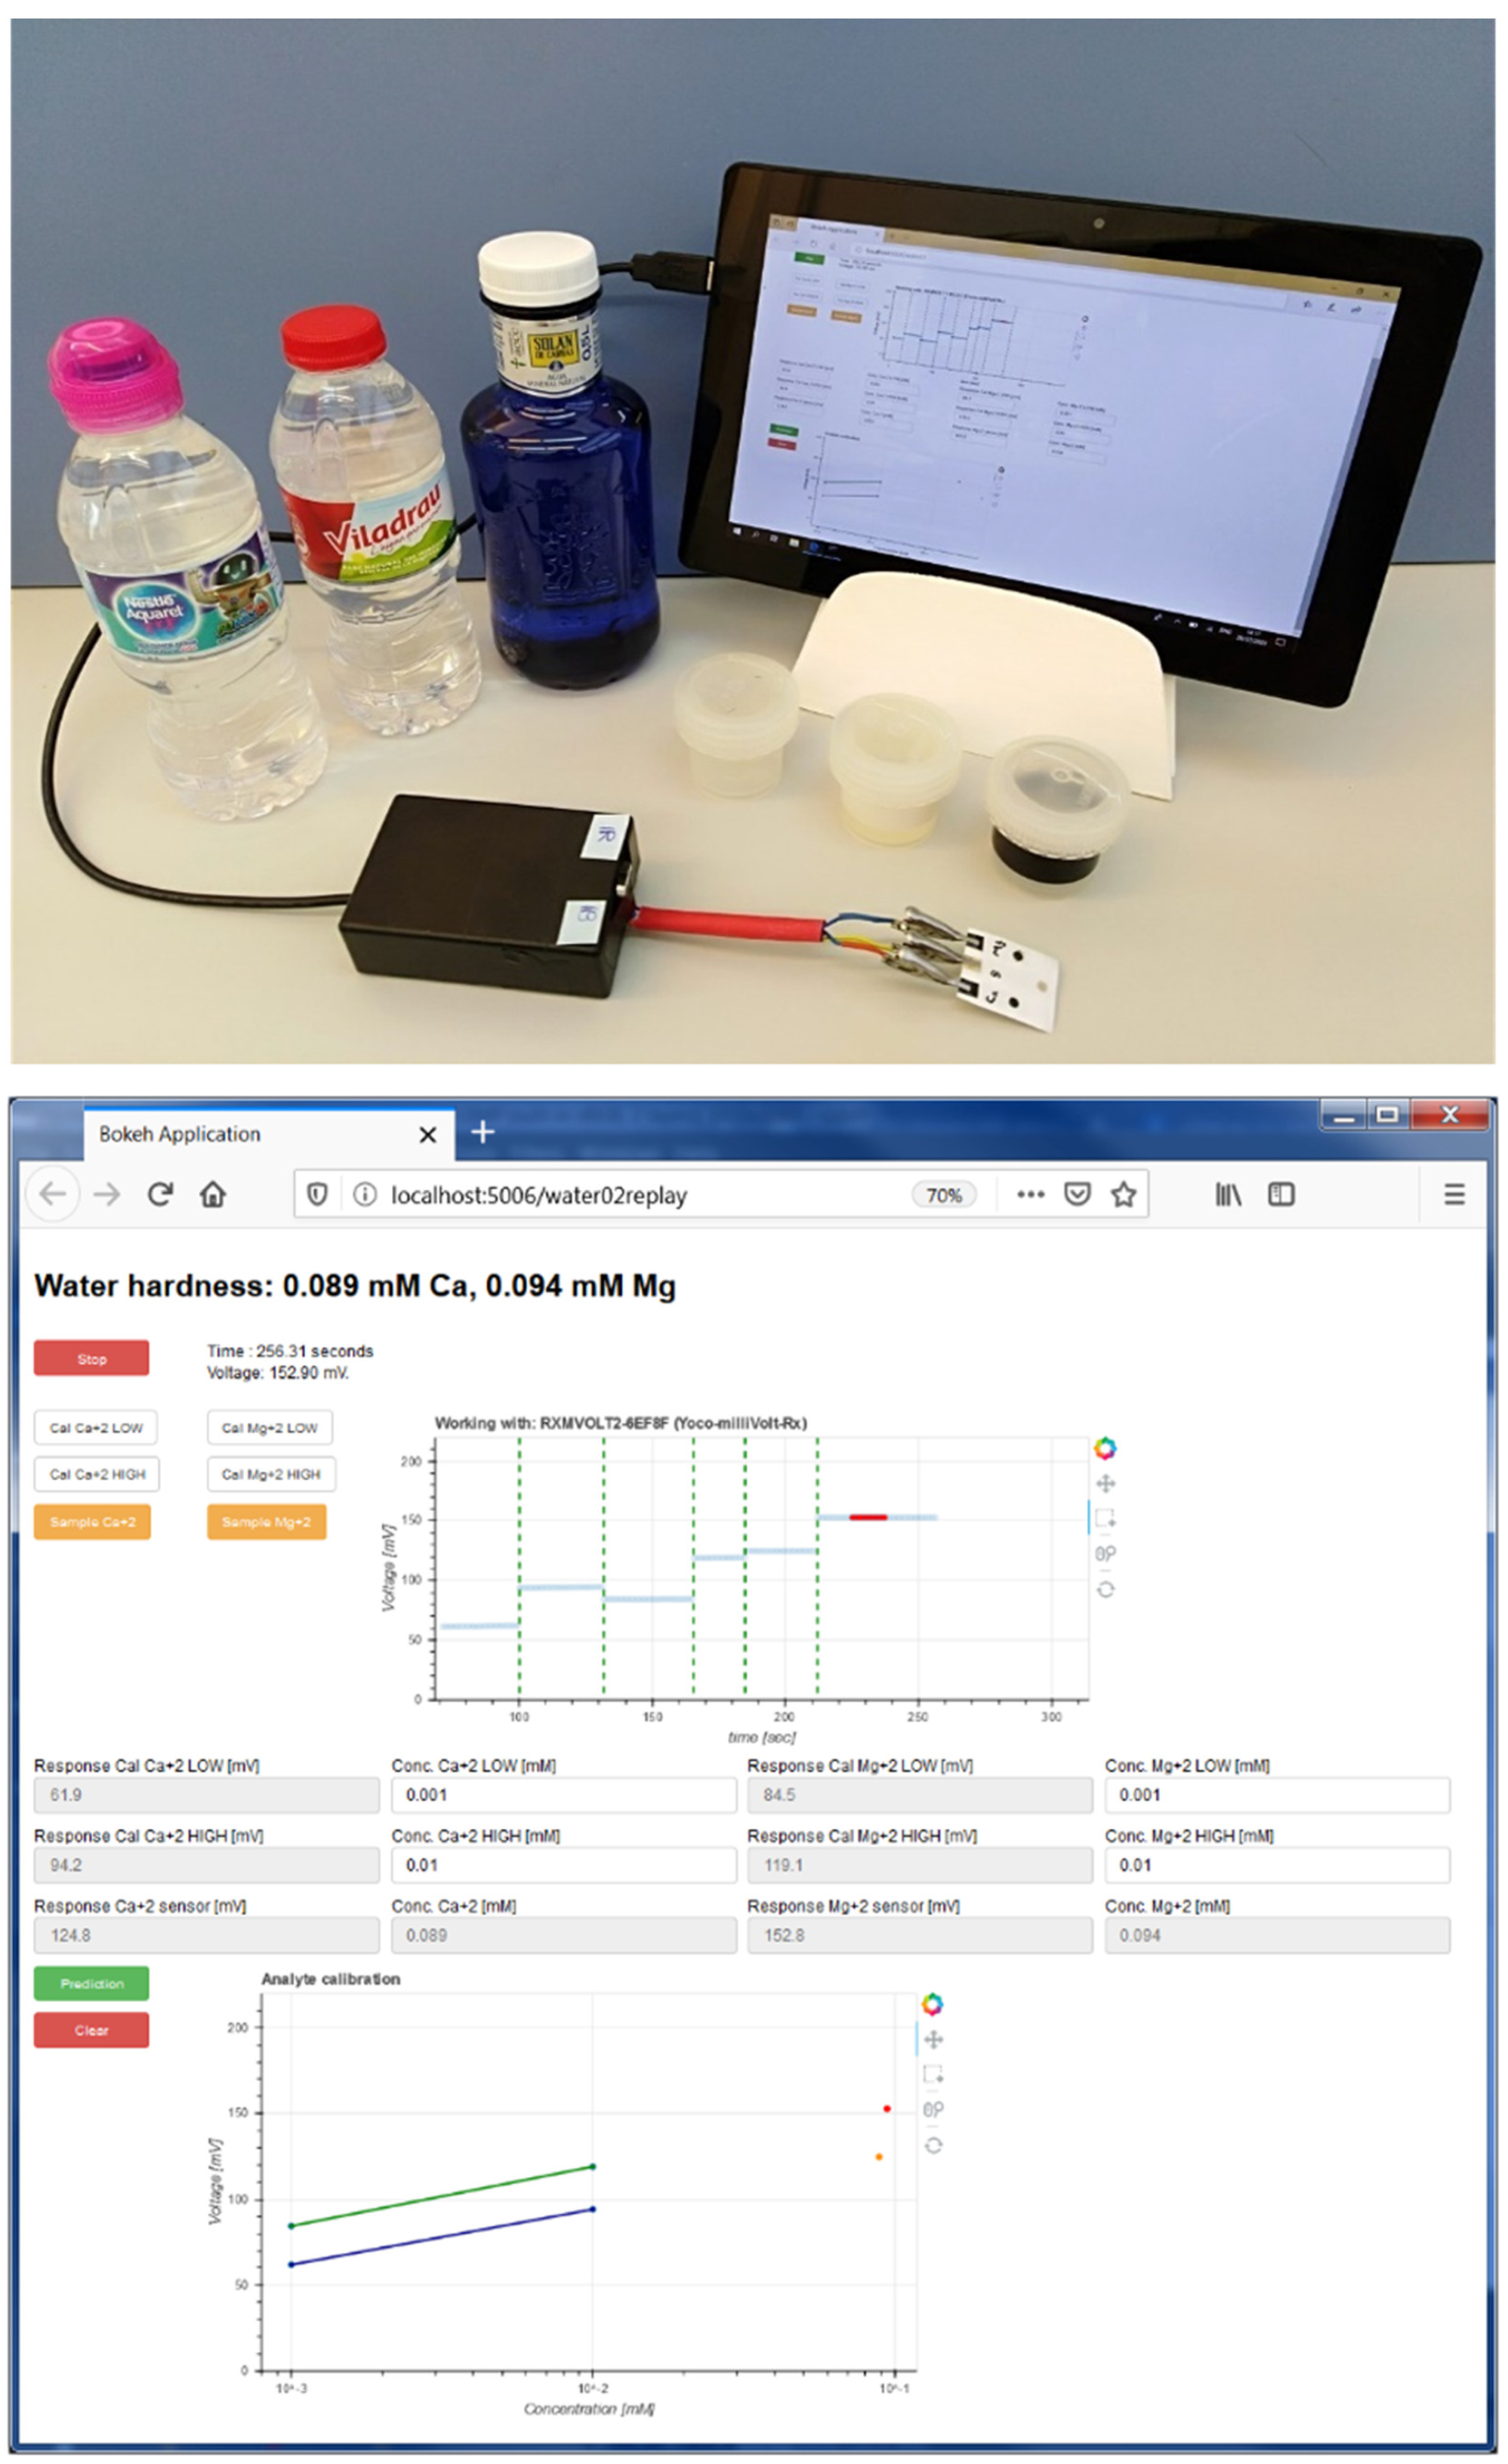
The full potential of the integrated paper-based water hardness device for its use out of the lab can be realized when determinations can be performed with very simple operations and user-friendly instrumentation and software. Figure 5 displays the whole set-up: first, two standard solutions are required for a two-point calibration; second, the instrumentation used here is a miniaturized voltmeter connected to a tablet; third, software was developed to run the calibration and execute the prediction. Eventually, in two minutes, the whole operation is run, and the result is given in the tablet (see Video S1 for illustration).
The measurements did not require any pre-treatment, dilution nor manipulation of liquids apart from the standards and the sample. The stability of the potentiometric is excellent and allows for running measurements quickly. The sensitivity is calculated automatically as well as the concentration of the samples (see experimental section). We have developed not only a paper-based potentiometric platform but a whole portable device to determine the hardness degree in drinking waters.
4. Conclusions
A paper-based potentiometric platform was constructed and fully characterized for hardness degree determination. Calcium and magnesium ion-selective electrodes reported a near-Nernstian response in the range of interest. The analytical performance is comparable to conventional sensors with the advantages of cost and domestic use. Real-samples validation was demonstrated, and a demo out of the lab with portable instrumentation and data analysis was effectively reported. Compared to standard methods, such as atomic absorption spectroscopy, outstanding correlation was obtained. This system requires low power, is simple to use, is cost effective and is stable.
Supplementary Materials
The following are available online at https://0-www-mdpi-com.brum.beds.ac.uk/article/10.3390/chemosensors9050096/s1, Figure S1, Tables S1–S5. Table S1: Classification of water quality according to the total hardness. Table S2: Mg2+, Ca2+ Ion selective and reference membranes composition respectively. Table S3: Analytical parameters of calcium and magnesium paper-based ISEs in a separate calibration. Table S4: The chemical composition of the artificial water samples with chloride as counter anion. Table S5: Prediction of Ca2+ and Mg2+ in artificial water samples. Figure S1: The dilution effect on the prediction of Mg2+ and Ca2+ sensors respectively (N = 3).
Author Contributions
Conceptualization, P.B. and F.J.A.; methodology, M.L.B.; P.B. and F.J.A.; investigation, M.L.B., P.B., F.J.A.; resources, Y.L. and F.J.A.; writing—original draft preparation, M.L.B. and P.B.; writing—review and editing, supervision, F.J.A.; project administration, Y.L. and F.J.A.; funding acquisition, Y.L. and F.J.A. All authors have read and agreed to the published version of the manuscript.
Funding
The authors would like to acknowledge the financial support from the Spanish ministry of Economy and Competitiveness and European Regional Development Fund (ERDF) (Project CTQ2016-77128-R and PID2019-106862RB-I00). MLB would like to thank the financial support from Ministry of Higher Education and Scientific Research of Algeria under the “Programme National Exceptionnel, P.N.E 2019-2020”.
Institutional Review Board Statement
Not applicable.
Informed Consent Statement
Not applicable.
Data Availability Statement
The data presented in this study are available on request from the corresponding author.
Acknowledgments
The authors would like to acknowledge the financial support from the Spanish ministry of Economy and Competitiveness and European Regional Development Fund (ERDF) (Project CTQ2016-77128-R and PID2019-106862RB-I00). MLB would like to thank the financial support from Ministry of Higher Education and Scientific Research of Algeria under the “Programme National Exceptionnel, P.N.E 2019-2020”.
Conflicts of Interest
The authors declare no conflict of interest.
References
- Gray, N.F. Drinking water quality: Problems and solutions. Choice Rev. Online 1995, 32, 32–5102. [Google Scholar] [CrossRef]
- Nerbrand, C.; Agréus, L.; Lenner, R.A.; Nyberg, P.; Svärdsudd, K. The influence of calcium and magnesium in drinking water and diet on cardiovascular risk factors in individuals living in hard and soft water areas with differences in cardiovascular mortality. BMC Public Health 2003, 3, 21. [Google Scholar] [CrossRef] [Green Version]
- Nerbrand, C.H.; Svärdsudd, K.; Ek, J.; Tibblin, G. Cardiovascular mortality and morbidity in seven counties in Sweden in relation to water hardness and geological settings: The project: Myocardial infarction in mid-sweden. Eur. Heart J. 1992, 13, 721–727. [Google Scholar] [CrossRef]
- Vinet, L.; Zhedanov, A. Water Analysis; Fresenius, W., Quentin, K.E., Schneider, W., Eds.; Springer: Berlin/Heidelberg, Germany, 1988; Volume 44, ISBN 9783642726125. [Google Scholar]
- Available online: https://www.amazon.com/s?k=water+hardness+strips+test (accessed on 1 March 2021).
- Dalmieda, J.; Kruse, P. Metal cation detection in drinking water. Sensors 2019, 19, 5134. [Google Scholar] [CrossRef] [PubMed] [Green Version]
- Saurina, J.; López-Aviles, E.; Le Moal, A.; Hernández-Cassou, S. Determination of calcium and total hardness in natural waters using a potentiometric sensor array. Anal. Chim. Acta 2002, 464, 89–98. [Google Scholar] [CrossRef]
- Capitán-Vallvey, L.F.; Fernández-Ramos, M.D.; De Cienfuegos Gálvez, P.A.; Santoyo-González, F. Characterisation of a transparent optical test strip for quantification of water hardness. Anal. Chim. Acta 2003, 481, 139–148. [Google Scholar] [CrossRef]
- Veríssimo, M.I.S.; Oliveira, J.A.B.P.; Gomes, M.T.S.R. Determination of the total hardness in tap water using acoustic wave sensors. Sens. Actuators B Chem. 2007, 127, 102–106. [Google Scholar] [CrossRef]
- Tsogas, G.Z.; Giokas, D.L.; Vlessidis, A.G. A fast assay of water hardness ions based on alkaline earth metal induced coacervation (HALC). Talanta 2010, 80, 2049–2056. [Google Scholar] [CrossRef] [PubMed]
- Dey, D.; Bhattacharjee, D.; Chakraborty, S.; Hussain, S.A. Development of hard water sensor using fluorescence resonance energy transfer. Sens. Actuators B Chem. 2013, 184, 268–273. [Google Scholar] [CrossRef] [Green Version]
- Shariati-Rad, M.; Heidari, S. Classification and determination of total hardness of water using silver nanoparticles. Talanta 2020, 219, 121297. [Google Scholar] [CrossRef]
- Vahl, K.; Kahlert, H.; Scholz, F. Rapid Automatic Determination of Calcium and Magnesium in Aqueous Solutions by FIA Using Potentiometric Detection. Electroanalysis 2010, 22, 2172–2178. [Google Scholar] [CrossRef]
- Bhattacharjee, T.; Member, S.; Jiang, H.; Member, S. A Fluidic Colorimetric Sensor Design for Water Hardness Detection. IEEE Sens. J. 2015, 15, 819–826. [Google Scholar] [CrossRef]
- Awad Ali, T.; Abd El Salam, H.M.; Ali, H.R.; Moustafa, Y.M. Evaluation behavior for the asorption of Ca(II) and Mg(II) ions (hardness of water) from water by modified copper based on metal organic frameworks and potentiometric sensors. Russ. J. Electrochem. 2019, 55, 621–636. [Google Scholar] [CrossRef]
- Novell, M.; Parrilla, M.; Crespo, A.; Rius, F.X.; Andrade, F.J. Paper-Based Ion-Selective Potentiometric Sensors. Anal. Chem. 2012, 84, 4695–4702. [Google Scholar] [CrossRef] [PubMed]
- Cánovas, R.; Parrilla, M.; Blondeau, P.; Andrade, F.J. A novel wireless paper-based potentiometric platform for monitoring glucose in blood. Lab Chip 2017, 17, 2500–2507. [Google Scholar] [CrossRef] [PubMed] [Green Version]
- Novell, M.; Guinovart, T.; Blondeau, P.; Rius, F.X.; Andrade, F.J. A paper-based potentiometric cell for decentralized monitoring of Li levels in whole blood. Lab Chip 2014, 14, 1308–1314. [Google Scholar] [CrossRef]
- Novell, M.; Rico, N.; Blondeau, P.; Blasco, M.; Maceira, A.; Bedini, J.L.; Andrade, F.A.; Maduell, F. A novel point-of-care device for blood potasium detection of patients on dialysis: Comparison with a reference method. Nefrología 2020, 40, 363–364. [Google Scholar] [CrossRef] [PubMed]
- Mensah, S.T.; Gonzalez, Y.; Calvo-Marzal, P.; Chumbimuni-Torres, K.Y. Nanomolar Detection Limits of Cd2+, Ag+, and K+ Using Paper-Strip Ion-Selective Electrodes. Anal. Chem. 2014, 86, 7269–7273. [Google Scholar] [CrossRef] [PubMed]
- Hu, J.; Stein, A.; Bühlmann, P. A Disposable Planar Paper-Based Potentiometric Ion-Sensing Platform. Angew. Chem. 2016, 128, 7670–7673. [Google Scholar] [CrossRef]
- Ruecha, N.; Chailapakul, O.; Suzuki, K.; Citterio, D. Fully Inkjet-Printed Paper-Based Potentiometric Ion-Sensing Devices. Anal. Chem. 2017, 89, 10608–10616. [Google Scholar] [CrossRef]
- Bell, J.G.; Mousavi, M.P.S.; Abd El-Rahman, M.K.; Tan, E.K.W.; Homer-Vanniasinkam, S.; Whitesides, G.M. Paper-based potentiometric sensing of free bilirubin in blood serum. Biosens. Bioelectron. 2019, 126, 115–121. [Google Scholar] [CrossRef]
- Cánovas, R.; Blondeau, P.; Andrade, F.J. Modulating the mixed potential for developing biosensors: Direct potentiometric determination of glucose in whole, undiluted blood. Biosens. Bioelectron. 2020, 163, 112302. [Google Scholar] [CrossRef]
- Guinovart, T.; Crespo, G.A.; Rius, F.X.; Andrade, F.J. A reference electrode based on polyvinyl butyral (PVB) polymer for decentralized chemical measurements. Anal. Chim. Acta 2014, 821, 72–80. [Google Scholar] [CrossRef] [PubMed]
- Bakker, E.; Pretsch, E.; Bühlmann, P. Selectivity of potentiometric ion sensors. Anal. Chem. 2000, 72, 1127–1133. [Google Scholar] [CrossRef] [PubMed]
- Novell, M.; Guinovart, T.; Steinberg, I.M.; Steinberg, M.; Rius, F.X.; Andrade, F.J. A novel miniaturized radiofrequency potentiometer tag using ion-selective electrodes for wireless ion sensing. Analyst 2013, 138, 5250–5257. [Google Scholar] [CrossRef] [PubMed]
- Zhang, W.; Jenny, L.; Spichiger, U.E. A comparison of neutral Mg 2+ -selective ionophores in solvent polymeric membranes: Complex stoichiometry and lipophilicity. Anal. Sci. 2000, 16, 11–18. [Google Scholar] [CrossRef] [Green Version]
- Bedlechowicz-Śliwakowska, I.; Lingenfelter, P.; Sokalski, T.; Lewenstam, A.; Maj-Żurawska, M. Ion-selective electrode for measuring low Ca 2+ concentrations in the presence of high K +, Na + and Mg 2+ background. Anal. Bioanal. Chem. 2006, 385, 1477–1482. [Google Scholar] [CrossRef] [PubMed]
- Bakker, E. Determination of Unbiased Selectivity Coefficients of Neutral Carrier-Based Cation-Selective Electrodes. Anal. Chem. 1997, 69, 1061–1069. [Google Scholar] [CrossRef]
- Wetzel, R.G. Salinity Of Inland Waters. In Limnology; Elsevier: Amsterdam, The Netherlands, 2001; pp. 169–186. [Google Scholar] [CrossRef]
Figure 1.
Paper-based potentiometric cell with two working electrodes and a reference electrode: (a) potentiometric cell construction, (b) scheme of the complete potentiometric cell, and (c) picture of the as-built paper-based cell.
Figure 1.
Paper-based potentiometric cell with two working electrodes and a reference electrode: (a) potentiometric cell construction, (b) scheme of the complete potentiometric cell, and (c) picture of the as-built paper-based cell.

Figure 2.
Typical potentiometric time traces for paper-based (A) Ca2+ and (B) Mg2+ ISEs. The inset shows the corresponding calibration curves (error bars represents the measurements of three sensors, N = 3).
Figure 2.
Typical potentiometric time traces for paper-based (A) Ca2+ and (B) Mg2+ ISEs. The inset shows the corresponding calibration curves (error bars represents the measurements of three sensors, N = 3).

Figure 3.
Prediction of magnesium and calcium concentration as well as hardness degree obtained from separate measurements (a): [Mg2+], (c): [Ca2+], (e): °TH with 9 samples) and simultaneous measurement (b): [Mg2+], (d): [Ca2+], (f): °TH with 6 samples) N = 3. Measured °TH were obtained from potentiometry and expected °TH values were given by weighted amount.

Figure 4.
(A) Development of the reference electrode: potentiometric response to selected cations and anions (the counter cation for the anions was potassium and the counter anion for the anions was chloride). (B) Time trace of calibration of the ISEs followed by sample addition with standards of −6 and −5 (log scale) corresponding to 0.2 and 2 total hardness. (C) Prediction of hardness degree (N = 3 with 9 samples). Measured water hardness was obtained from paper-based potentiometry and expected water hardness values were determined by AAS and AES.


Figure 5.
Set-up of decentralized measurement with the paper-based potentiometric cell, portable potentiometer connected to a tablet with software for data analysis (left); screenshot of the time trace, calibration curve and prediction of the hardness degree (right).
Figure 5.
Set-up of decentralized measurement with the paper-based potentiometric cell, portable potentiometer connected to a tablet with software for data analysis (left); screenshot of the time trace, calibration curve and prediction of the hardness degree (right).

Publisher’s Note: MDPI stays neutral with regard to jurisdictional claims in published maps and institutional affiliations. |
© 2021 by the authors. Licensee MDPI, Basel, Switzerland. This article is an open access article distributed under the terms and conditions of the Creative Commons Attribution (CC BY) license (https://creativecommons.org/licenses/by/4.0/).
Share and Cite
MDPI and ACS Style
Bouhoun, M.L.; Blondeau, P.; Louafi, Y.; Andrade, F.J. A Paper-Based Potentiometric Platform for Determination of Water Hardness. Chemosensors 2021, 9, 96. https://0-doi-org.brum.beds.ac.uk/10.3390/chemosensors9050096
AMA Style
Bouhoun ML, Blondeau P, Louafi Y, Andrade FJ. A Paper-Based Potentiometric Platform for Determination of Water Hardness. Chemosensors. 2021; 9(5):96. https://0-doi-org.brum.beds.ac.uk/10.3390/chemosensors9050096
Chicago/Turabian StyleBouhoun, Mohammed L., Pascal Blondeau, Yamina Louafi, and Francisco J. Andrade. 2021. "A Paper-Based Potentiometric Platform for Determination of Water Hardness" Chemosensors 9, no. 5: 96. https://0-doi-org.brum.beds.ac.uk/10.3390/chemosensors9050096
Note that from the first issue of 2016, this journal uses article numbers instead of page numbers. See further details here.