
Photocatalytic Properties of Silver Nanospherical Arrays Driven by Surface Plasmons


The Beijing Key Laboratory for Nano-Photonics and Nano-Structure, Department of Physics, Capital Normal University, Beijing 100048, China
*
Author to whom correspondence should be addressed.
Chemosensors 2021, 9(12), 336; https://0-doi-org.brum.beds.ac.uk/10.3390/chemosensors9120336
Submission received: 25 October 2021
/
Revised: 18 November 2021
/
Accepted: 29 November 2021
/
Published: 29 November 2021
(This article belongs to the Section Optical Chemical Sensors)
Abstract
:Surface-enhanced Raman scattering (SERS) is a promising technique to study the plasma-driven photocatalytic reactions. Hemispherical alumina nanoarrays with a regular hexagonal arrangement are firstly prepared; then, silver hemispherical nanoarrays are synthesized on the surface of the arrays by silver evaporation. When a laser with a specific wavelength (633 nm) is irradiated on the silver nanoarrays, a large number of regularly arranged local surface plasmon enhancement regions (called “hot spots”) would be generated on its surface. After that, a layer of evenly distributed p-aminothiophenol (PATP) probe molecules was placed on the substrate and the photocatalytic reaction of PATP was driven by the local surface plasmon to form four 4′-di-mercaptoazobenzene (DMAB). Then, under the same experimental conditions, the later product was reversely reacted to form PATP molecule by the action of plasma in the presence of in situ sodium borohydride. SERS can be used to monitor the whole process of the photocatalytic reaction of PATP probe molecules driven by the plasma on the surface of the silver nanoarrays. This research achieves the drawing and erasing of molecular graphics in the micro- and nano-scales, as well as information encryption, reading, and erasing that have strong application value.
1. Introduction
The surface plasmon produced by the collective oscillation of conduction electrons in metal nanostructures can not only redistribute the electromagnetic field in time and space, but also redistributes the excited carriers. Various effects can be induced by the surface plasmons, including enhanced electromagnetic field, local heating, excited electrons, and excited holes that can drive many chemical reactions. Surface plasmons (SPS) originate from the collective oscillation of conduction electrons and play an important role in the optical properties of nanostructured metals and heavily doped semiconductors. Due to the deep understanding of SERS, when molecules, ions, free radicals, or other materials are adsorbed on, or near, some nanostructured metal surfaces, a significantly enhanced Raman scattering process will be generated. The application of SPS has been widely extended to spectroscopy, sensing, hyperthermia, waveguide, and so on [1,2,3,4,5]. Now, it has been found that SPS can mediate some chemical processes by producing enhanced electromagnetic near field, excited carriers, or local heating effect. There are two main types of chemical reactions mediated by the plasma, including enhancement of the downhill reaction rate and inducing uphill reaction [6,7,8,9,10].
SERS is a common spectral technique in which the inelastic light scattering of the molecules is greatly enhanced. SERS can enhance the weak Raman signal by 105–108, providing detailed structural information and binding properties of molecules on the surface [4]. Since the discovery of SERS, the interest in SERS has been growing steadily and many other spectral techniques have been found. These techniques utilize the enhanced local field generated by the surface plasmon excitation to apply in optical phenomena, such as fluorescence or nonlinearity [11,12,13]. In addition, the coupling of SERS with AFM or STM tips makes tip-enhanced Raman scattering a powerful imaging tool. For analytical applications, SERS provides abundant vibration spectrum information, which makes it different from many other technologies and achieves wide applications in many fields, such as electrochemistry, catalysis, biology, medicine, art protection, material science, etc [14,15,16]. The enhancement mechanism of SERS has been always one of the hot topics in this field. The enhancement of Raman signal of probe molecules adsorbed on metal nanostructures comes from two factors, including the enhancement of electromagnetic field on the metal surface and increasing charge transfer between the metal and molecules. These two factors are attributed to the electromagnetic enhancement and chemical enhancement mechanisms, respectively [17,18,19].
Plasma-driven surface catalytic oxidation-reduction reaction has attracted wide attention since it was first reported. From understanding its working principles to wide applications in physics, chemistry, environmental science, material science, and other fields, several reaction mechanisms of plasma-driven surface catalytic oxidation-reduction reaction are proposed and the plasma hot electrons produced through plasma decay played a key role, which not only provides electrons for reduction reaction but also provides a lot of kinetic energy for overcoming the potential energy barrier [20,21]. Recently, due to the great advantages of plasma exciton coupling interaction, the plasma exciton coupling co-driven surface catalytic reactions on the plasma metal graphene hybrid substrates are reported. The silver nanoparticles monolayer MoS2 hybrid system has been also used in plasma exciton co-driven chemical reactions that significantly improved the probability and efficiency of the surface catalytic reactions. Plasma catalysis is an important result of local surface plasmon resonance of metal nanostructures. It has been proved that this method can be an effective route to convert light energy into chemical energy in CO2 reduction, water decomposition, H2 dissociation, or decomposition of organic pollutants [22,23,24]. In order to characterize the plasma catalyst, dimerization of (PATP) to DMAB is studied. This is a typical model reaction and the reaction kinetics are observed by SERS [25,26].
In this paper, a silver hemispherical nanoarray photocatalyst was first prepared with the help of an anodic aluminum oxide template. Using PATP as a probe molecule on the silver nanoarrays, the surface plasmon-driven photocatalytic reaction under 633 nm laser was studied by means of Raman spectroscopy. In addition, sodium borohydride was introduced in situ to realize the reverse photocatalytic reaction driven by the surface plasmon. The plasma distribution on the surface of the silver hemispherical nanoarray was simulated by the finite difference time domain method (FDTD) software. Through this method, it is expected to draw specific graphics or letters at the micro- and nano-scales, and realize the functions of graphics drawing, information encryption, reading, and erasing at these scales, which have significant practical applications.
2. Materials and Methods
2.1. Preparation of the Silver Nanospherical Arrays
First, an aluminum sheet was cut into 7.5 cm pieces and cleaned ultrasonically with deionized water, alcohol, acetone, alcohol, and deionized water for 5 min. Then, the high-temperature annealing was performed at 550 °C for 4 h. After that, the surface of the annealed aluminum sheets was polished to the mirror surface by electrochemical polishing. The polishing solution was a mixture of alcohol and perchloric acid (4:1 volume ratio) at the polishing voltage of 18 V. After thoroughly cleaning the polished aluminum sheet, one-step anodizing was carried out. The anode was aluminum sheet prepared in advance, cathode was a platinum sheet, the electrolyte was 0.4 mol/L oxalic acid solution, the working voltage was 50 V, and the anodizing time was about 2 h. During the oxidation process, in order to keep the temperature and concentration of the electrolyte unchanged, a stirring magneton was added under the platinum electrode. Then, the oxidation layer was removed and the mixed solution of 6% phosphoric acid and 1.8% chromic acid was used to soak for 2 h. The whole process was put into a constant temperature water tank and the reaction temperature was set at 60 °C. After the second anodization, the specific experimental steps were the same as the first. After the second anodization, the remaining aluminum substrate can be prepared into more regular nanoarrays. The residual aluminum on the back of alumina layer was removed by a supersaturated solution of copper chloride and the regular hexagonal alumina array obtained on the back. Finally, a layer of silver with moderate thickness was deposited on the surface of the alumina arrays by the vacuum thermal evaporation technology (evaporation vacuum: 2 × 10⁻⁴ Pa; evaporation time: 35 S; evaporation current: 150A) and the hemispherical silver nanoarray substrate was obtained with a regular hexagonal arrangement.
2.2. Acquisition of SERS Spectrum
Firstly, the absolute ethanol solution of PATP with a concentration of 10−3 mol/L was prepared. Then, the silver hemispherical nanoarray substrate was placed in PATP solution and the substrate was removed for 1 h to dry naturally, so that the surface plasma driven photocatalytic SERS spectrum could be collected. The Ag nanoarray substrate with the adsorbed PATP probe molecules was placed on the Raman spectrometer. SERS spectra were collected with 633 nm excitation and 1 mW laser power at the exit of the objective lens (×50; acquisition time: 2 s; number of accumulation: 1). In order to ensure that PATP would not catalyze the reaction under natural light, the whole experimental process was performed in a dark room.
3. Results and Discussion
This paper reports the photocatalytic reaction driven by plasma on the substrate of silver nanospherical arrays by the use of PATP as a probe molecule. Figure 1a shows the Raman spectrum of PATP probe molecule. The black line is the Raman spectrum simulated by the Gaussian 09 software and the red line shows the Raman spectrum collected by the PATP solid powder excited at 633 nm. It can be seen from the figure that the theoretical and experimental values of the characteristic peaks of Raman spectrum corresponded well with each other. In the later stage, the PATP molecules were placed on the photocatalytic surface of silver nanospherical arrays. Due to the influence of the existing state of molecules and the surrounding environment of the silver surface, the peak position and relative intensity of Raman characteristic peaks will change. This phenomenon is a normal phenomenon shown by the surface enhanced Raman spectroscopy, which has no effect on the study of this paper. In this figure, the Raman characteristic peak of PATP molecule solid powder at 1084 cm−1 corresponds to the 1080 cm−1 Raman characteristic peak of this molecule on the surface of the silver nanoarray. Similarly, Figure 1b shows the characteristic Raman peaks of DMAB molecules through experimental and theoretical calculations. By comparing Figure 1a,b, it can be seen that the Raman peaks of PATP and DAMB at 1084 and 1142 cm−1, respectively, do not overlap with each other. Therefore, in the following experiments, the Raman characteristic peaks at 1084 and 1142 cm−1 can be corresponded to the existence of PATP and DMAB, respectively.
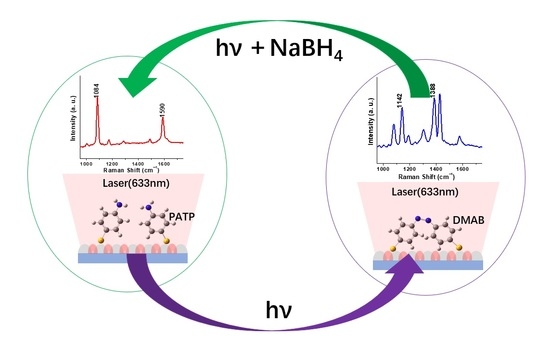
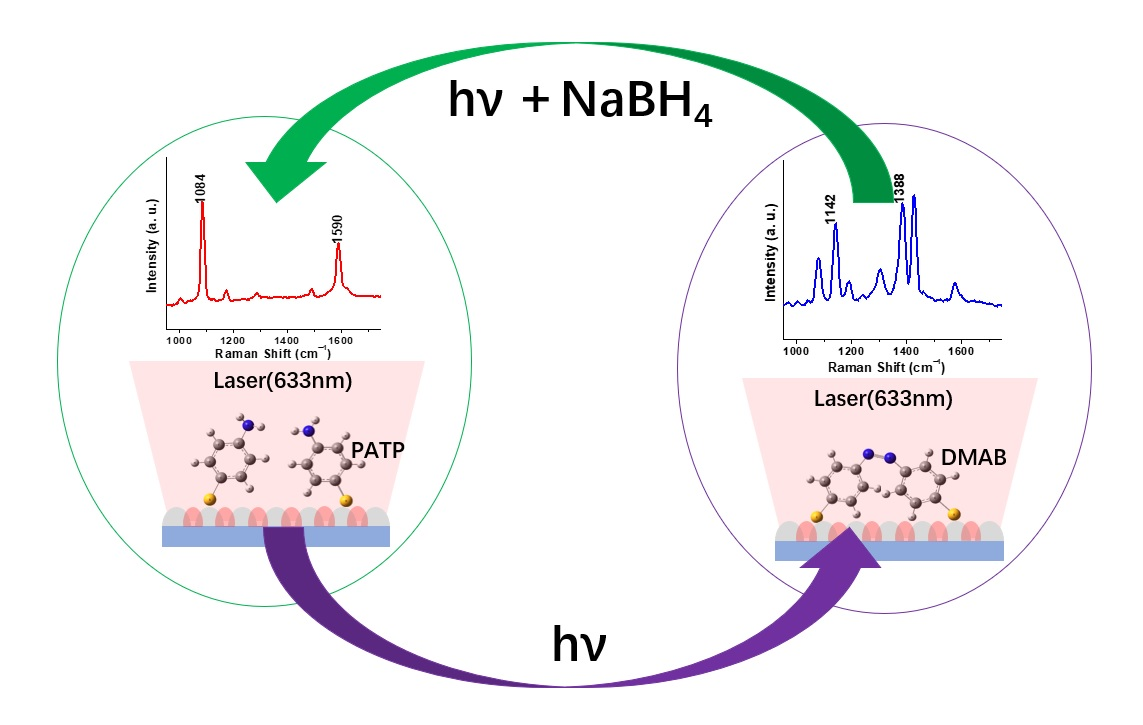
Figure 1d is a schematic diagram for the photocatalytic reaction process driven by the plasma on the surface of the silver nanospherical arrays. Firstly, the silver nanoarray substrate was immersed in the PATP solution, then the PATP molecules were evenly adsorbed on the surface of the silver ball. When the silver hemispherical nanoparticles showed a regular hexagonal arrangement on the substrate surface by the action of 633 nm laser, a very strong regular arrangement of local surface plasma enhanced hot spots were generated in the nanogap between the hemispherical particles. Compared to the excitation light itself, the intensity of the excited photoelectric magnetic field in the hot spot was greatly enhanced and the PATP probe molecule in the hot spot broke the nitrogen–hydrogen bond of the two molecules to form the nitrogen–nitrogen double bond under the dual action of surface plasma and excitation light, resulting in the photocatalytic reaction to form a new structure DMAB molecule. Then, by dropping 10−2 mol/L sodium borohydride absolute ethanol solution in situ, the DMAB molecules located on the hemispherical surface of silver nanoparticles underwent reverse photocatalytic reaction under the action of surface plasma, excitation, and sodium borohydride to form the PATP molecules.
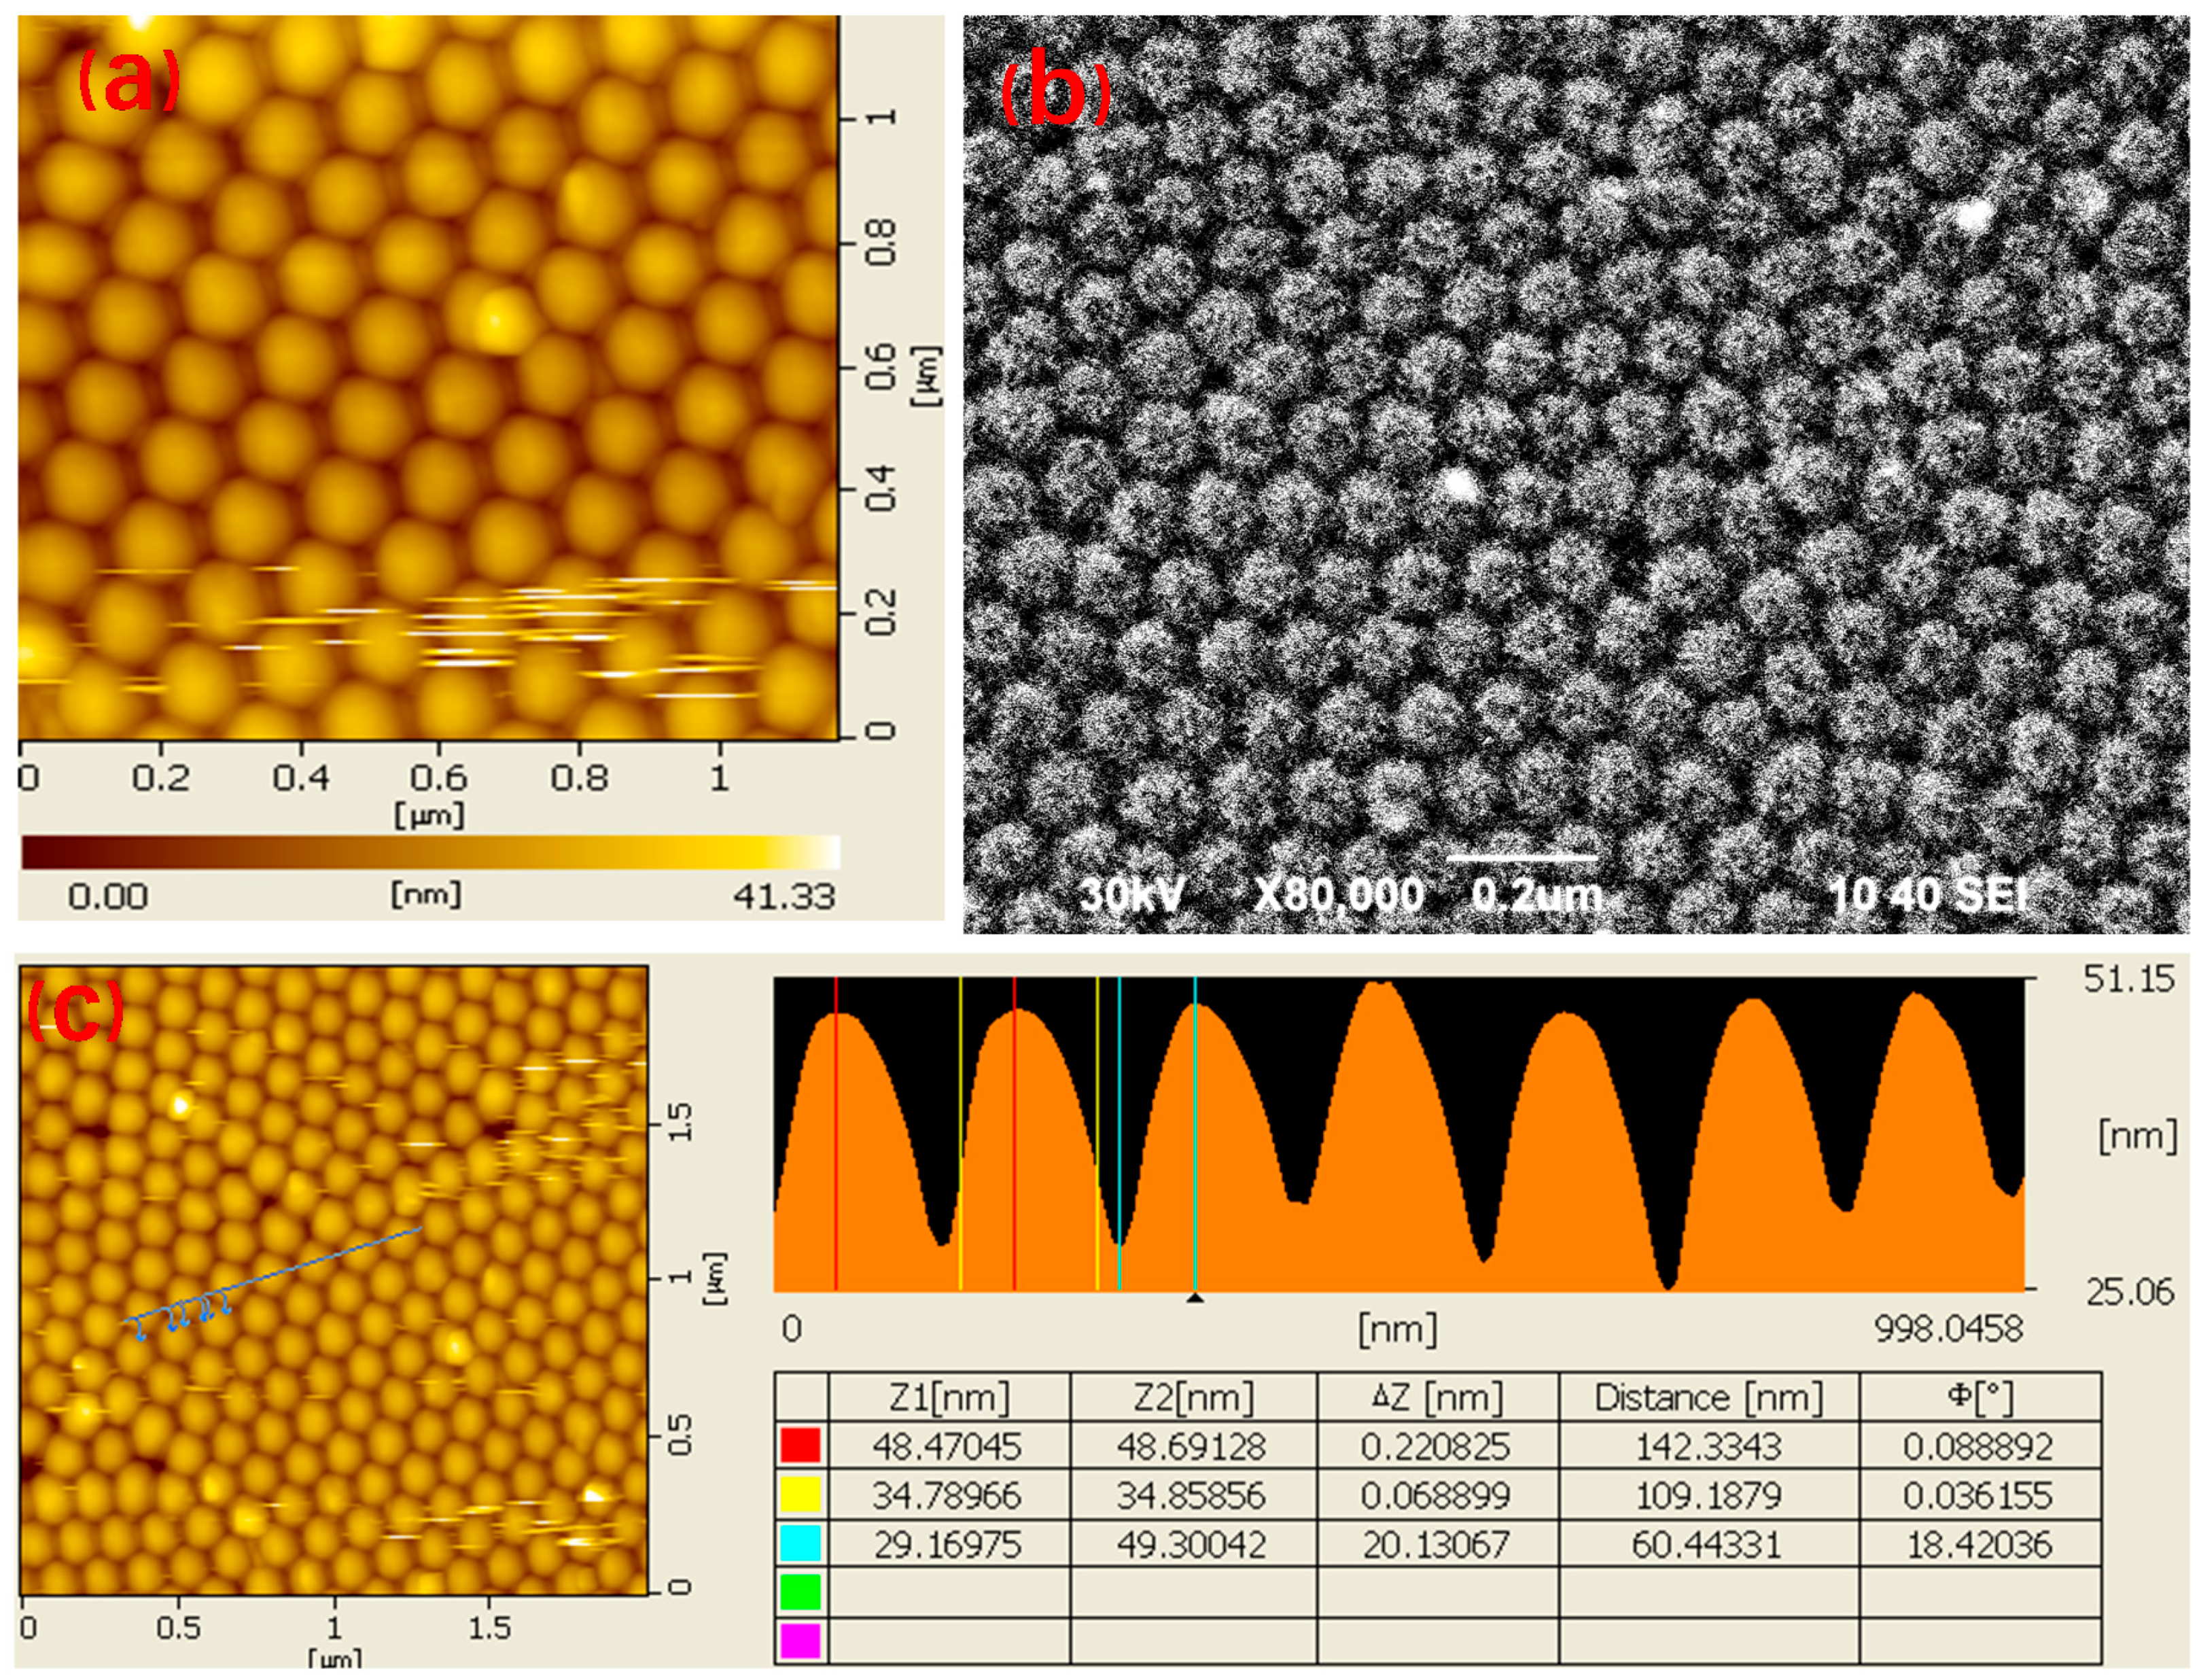
Figure 2 displays the AFM and SEM micrographs and morphology of the prepared spherical silver nanoarrays. Figure 2a is a two-dimensional atomic force microscope picture of the silver nanoarray. It can be seen from the picture that the surface of the prepared spherical silver nanoarray is generally flat and each silver nanoparticle is hemispherical, uniform in size and regularly arranged. In addition, the same verification can be obtained from the SEM image of the silver nanoarray (Figure 2b). The hemispherical nanoparticles generally show a regular hexagonal arrangement and the gap size between the particles is uniform. This regular hemispherical nanoarray structure has a large number of regularly arranged hot spots under the action of excitation. Through the linear section analysis of a group of array points in the two-dimensional picture of AFM (Figure 2c), it can be further deduced that the diameter and height of each hemispherical silver nanoarray unit are relatively uniform. The diameter of each structural unit array was about 100 nm with the height of 20 nm. The gap between particle units was gradually declined with the decrease of height, and the middle size was about 50 nm. It can be seen from the comprehensive analysis in Figure 2 that this regularly arranged silver nanoarray has a flat surface, uniform size, and monotonous distribution of the hot spots. It is an ideal catalytic substrate for the study of surface plasma-driven photocatalytic reaction.
However, does the PATP probe molecule located on the surface of the spherical silver nanoarray really have the photocatalytic ability and reverse photocatalytic reaction can occur under the action of 633 nm excitation in the presence of sodium borohydride, as shown in Figure 1c? It can be verified by the real-time acquisition of Raman spectrum and identification of the characteristic peaks.
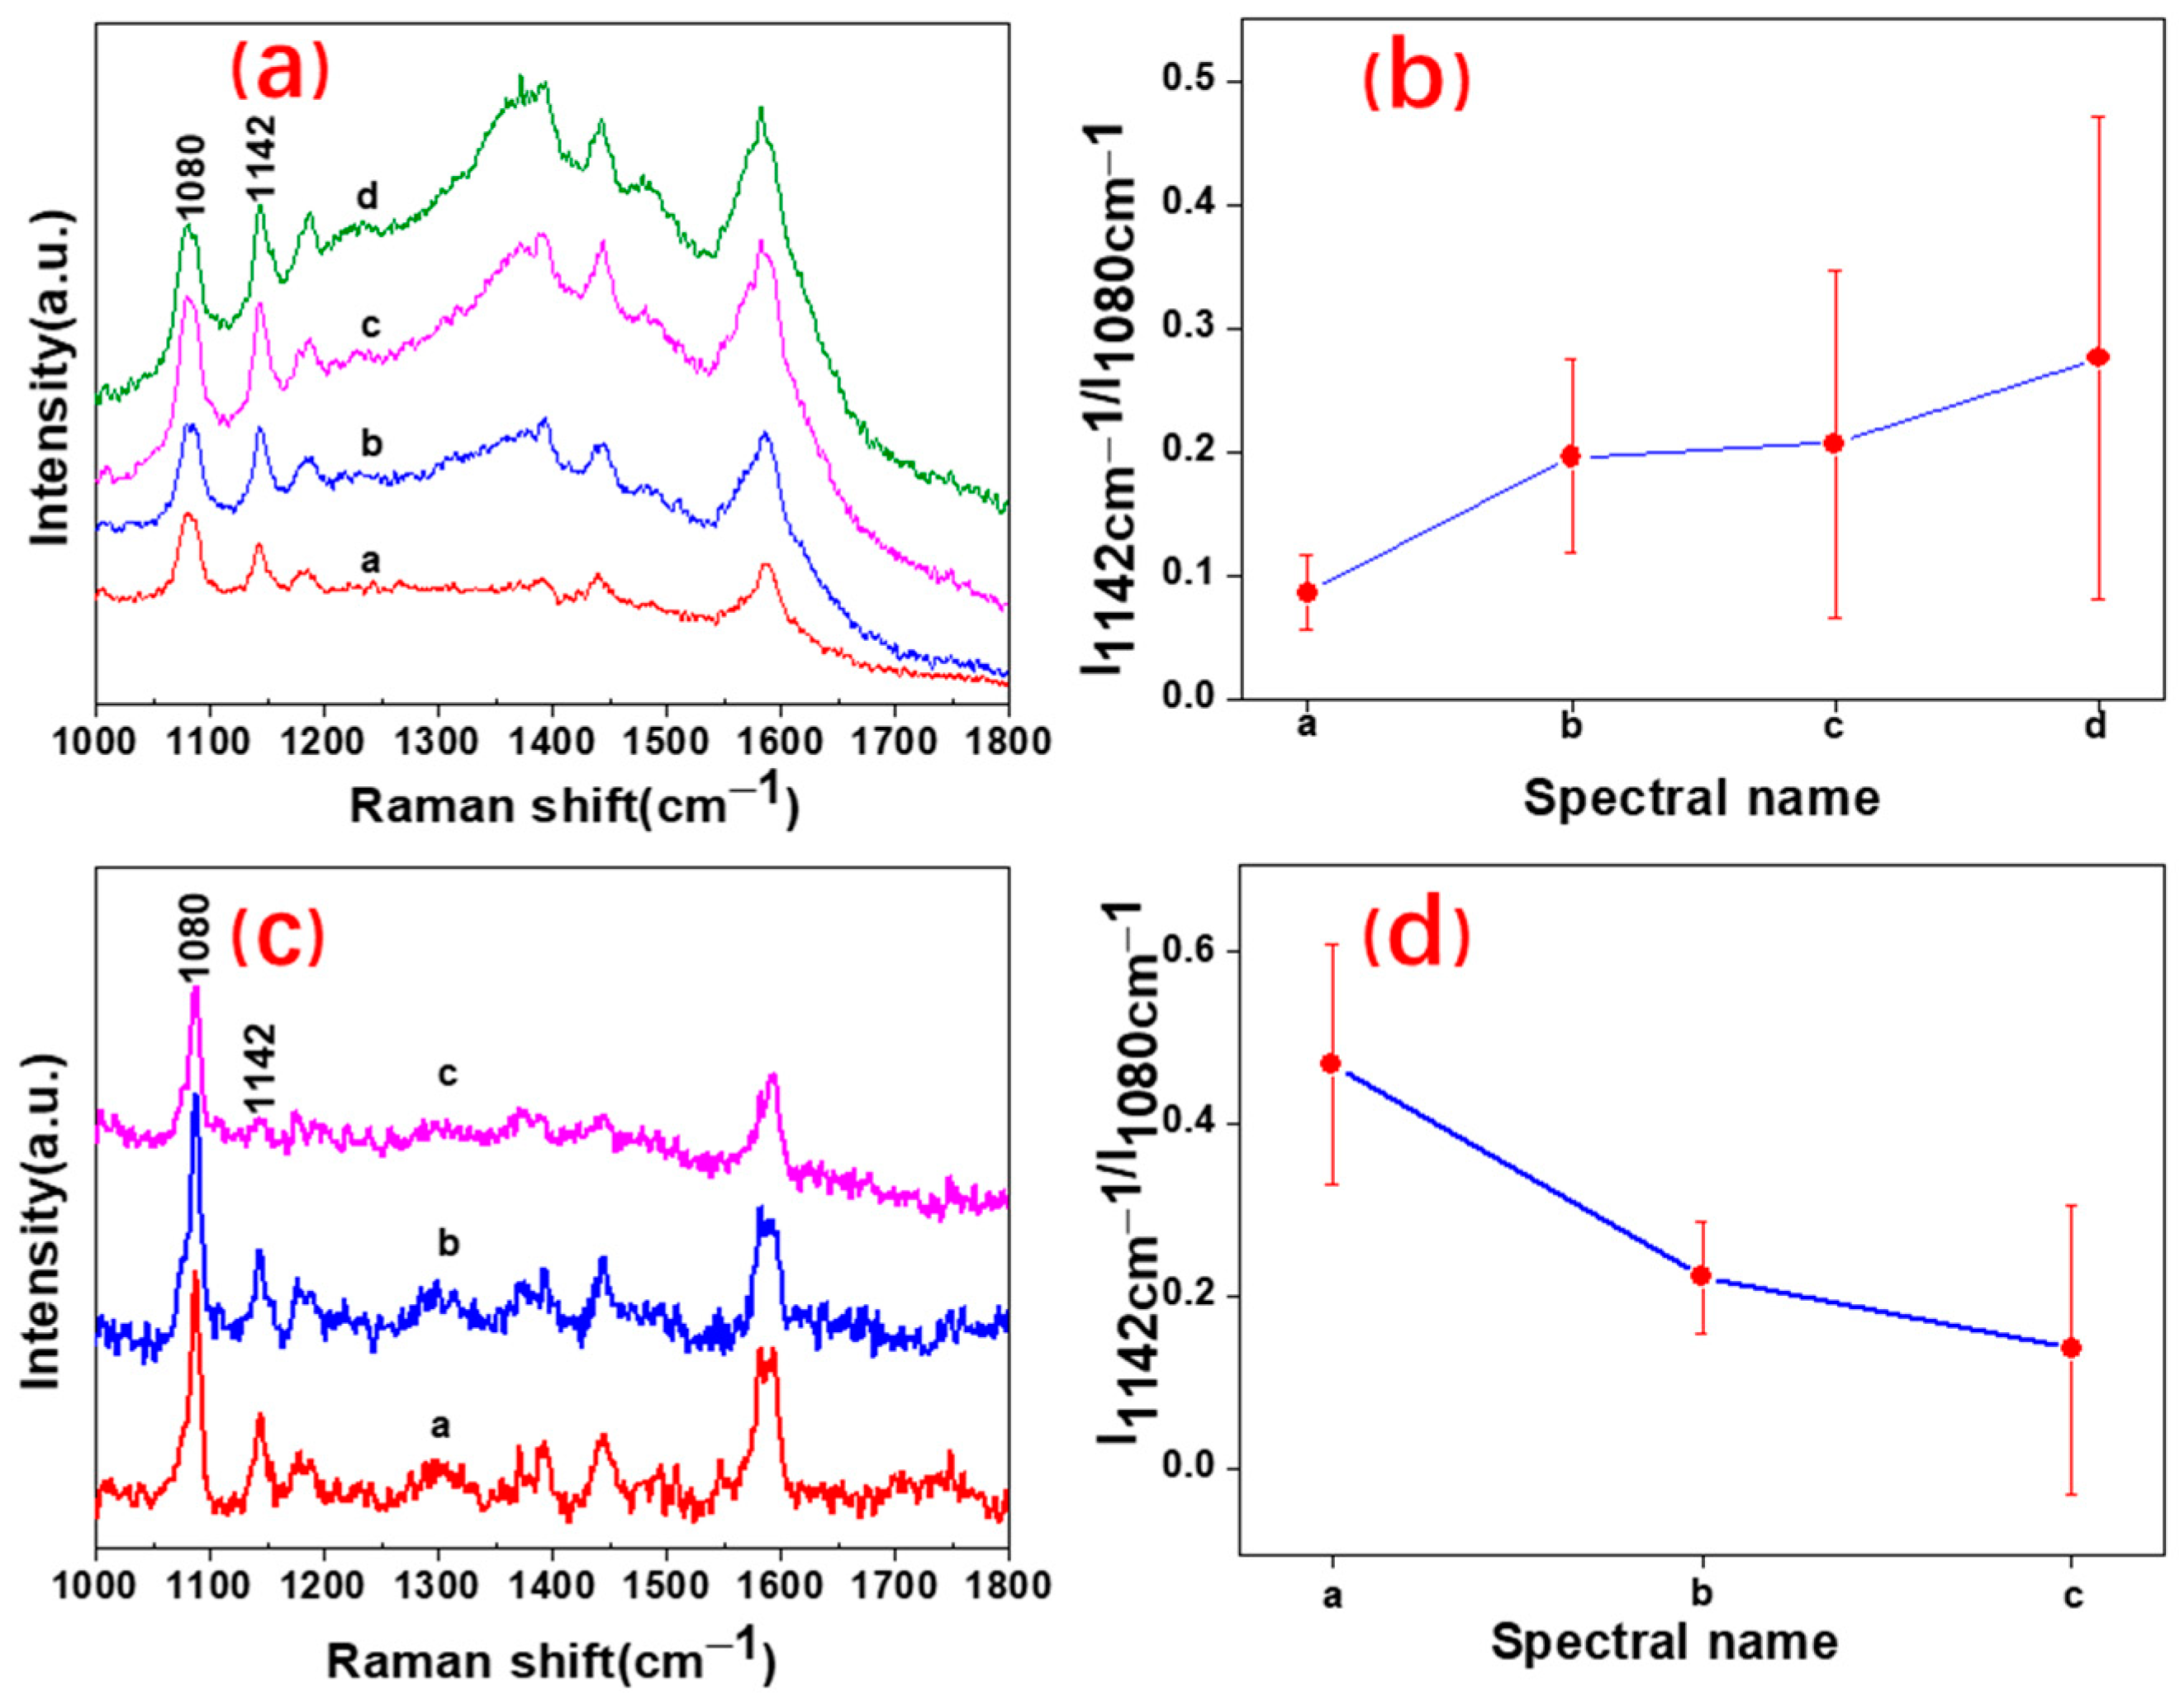
Figure 3 is the SERS spectra collected during the two-step stages of the photocatalytic reaction of PATP probe molecule based on the spherical silver nanoarray catalytic substrate under the action of 633 nm laser and reverse photocatalytic reaction caused by the in situ introduction of sodium borohydride. Figure 3a shows the SERS spectra collected in real-time in the first stage. The four spectral lines in this figure from bottom to top are the SERS spectra collected every 2 s when the 633 nm laser is focused on the substrate surface under the condition of dark room. These spectral lines originated from continuous irradiation of the laser beam on the photocatalytic system for 2 s (a), 4 s (b), 6 s (c), and 8 s (d). According to the previous analysis, the SERS peaks at 1080 and 1142 cm−1 can be attributed to the unique characteristic peaks of PATP and the photocatalytic product molecule DMAB, respectively. In Figure 3a, the 1080 cm−1 SERS characteristic peak represents the PATP molecule that always exists from the bottom to the top and proves the existence of the excessive PATP in the first stage of the photocatalytic process. The SERS peak at 1142 cm−1 has appeared when the laser acted for 2 s and its intensity increases gradually with time. It can be seen that PATP molecules can undergo a very rapid photocatalytic reaction on the silver nanoarrays under the action of a 633 nm laser to produce DMAB molecules. Figure 3b shows the changes of the integrated peak intensity ratio of 1142 and 1080 cm−1 vibrations, corresponding to each spectral line in Figure 3a. This intensity ratio can explain the change of DMAB content in the photocatalytic reaction to a certain extent. Figure 3b explains that this ratio shows an obvious increasing trend with enhancing the illumination time. This finding shows that DMAB molecules were continuously and increasingly generated in the whole photocatalytic process.
Figure 3c shows the SERS spectra collected under the same experimental conditions after the first photocatalytic step by dropping sodium borohydride solution in situ. Figure 3d depicts the changes of the integrated peak intensity ratio of 1142 and 1080 cm−1 vibrations corresponding to each spectral line in Figure 3c. From the bottom to the top of each spectral line, the variation trend of this integral peak intensity ratio in Figure 3d is analyzed and compared. The 1080 cm−1 SERS characteristic peak due to the PATP molecule always exists, which proves the existence of PATP in the whole second stage. Under the action of sodium borohydride and laser, the intensity of DMAB SERS peak at 1142 cm−1 decreases rapidly with time until complete disappearance. At the same time, there is no new SERS peak, which means that no new molecules other than PATP and DMAB are produced in this process. It can be seen that the first stage of the photocatalytic production of DMAB molecule involves a reverse photocatalytic reaction under the action of sodium borohydride and laser to form PATP molecule. Through the analysis of Figure 3, it can be concluded that the PATP probe molecule located on the surface of the spherical silver nanoarray undergoes a rapid photocatalytic reaction under the action of 633 nm excitation and hot spots on the silver nanoarray as well as DMAB product have been continuously and rapidly generated. Subsequently, DMAB molecules on the surface of the spherical silver nanoarray catalyzed the reverse photocatalytic reaction under the action of sodium borohydride, 633 nm excitation, and hot spots on the silver nanoarray to generate the PATP molecules again.
This photocatalysis driven by surface plasmon will realize the drawing and erasure of the molecular graphics on the nanoscale as well as the information encryption, reading, and erasure. The uniformly distributed probe molecule PATP was assembled on the surface of a specific catalytic substrate and irradiated with a focused laser beam with a certain wavelength to produce a new molecule DMAB. With the help of the micro- and nano-manipulation technology, the focused laser beam can be artificially controlled for the two-dimensional scanning on the catalytic substrate. Then, the PATP molecules in the region scanned by the excitation light undergo the photocatalytic reaction to generate DMAB. Noteworthy, the later molecule cannot be generated in the region not scanned. Therefore, the specific graphics or letters information can be drawn by DMAB molecular distribution on the micro- and nano-scales, thus, realizing micro- and nano-scale graphics drawing and information encryption. The two-dimensional imaging can be carried out with the characteristic peak intensity of DMAB molecules to display the drawn graphics and information decryption by using SERS spectrum scanning technology (mapping). In addition, sodium borohydride can be introduced into the encrypted substrate and the reverse photocatalytic reaction can occur under the action of surface plasma and stimulated luminescence, so as to realize the erasure of micro- and nano-scale graphics and encrypted information. To sum up, this will be a technical means with great scientific significance and practical value.
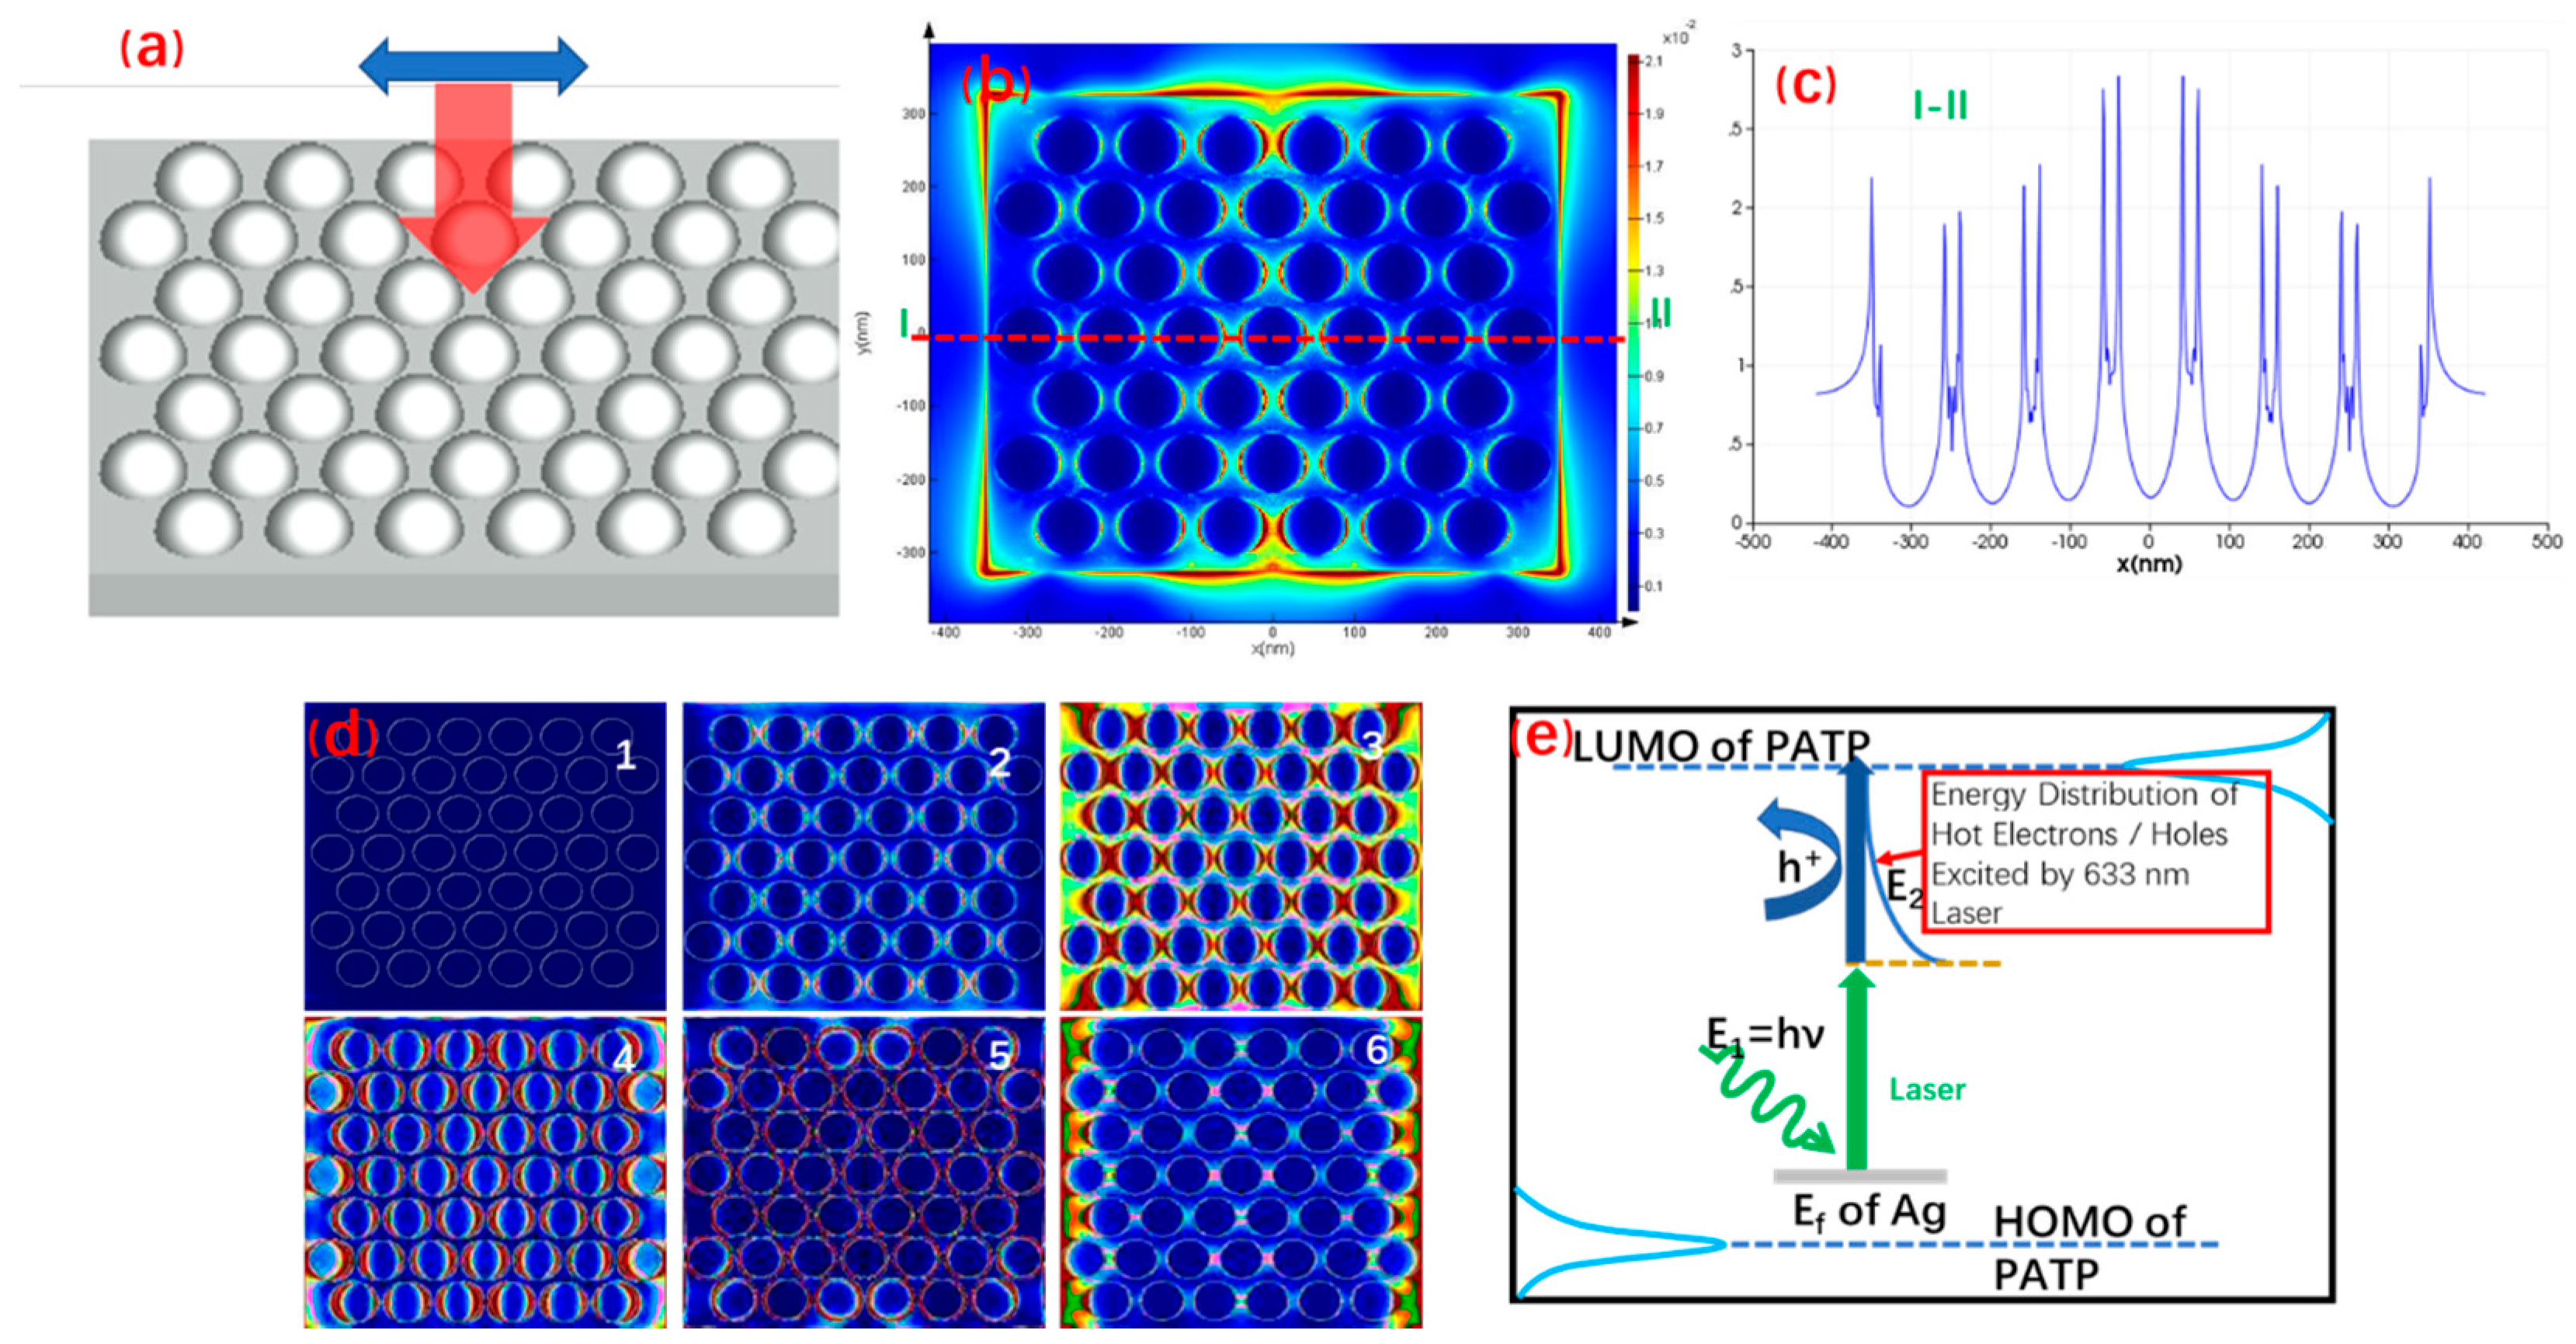
The surface plasma distribution characteristics on the substrate surface of the spherical silver nanoarray structure were calculated and simulated by the FDTD software (as shown in Figure 4). Figure 4a shows a theoretical model established according to the geometric dimensions of AFM diagrams of the prepared silver hemispherical nanoarray and the polarization direction of the stimulated luminescence stimulated by the silver nanoarray surface plasma. Figure 4b shows the FDTD software calculation results of the surface plasma intensity distribution characteristics of the spherical silver nanoarrays. It can be seen from this figure that the strong local surface plasma enhancement hot spots are generated in the region between the spherical silver nanoparticles under the action of excitation. These hot spots are regularly arranged according to the distribution of particles and are dependent on the polarization direction of excitation light. In addition, the strong local surface plasmon enhancement around the silver nanoarray model is caused by the boundary effect in the simulation calculation. Due to the limitation of computing power, size of the nanoarray model is limited and cannot be as infinite as the actual periodic array substrate relative to the focused laser spot. Figure 4c shows the variation of electromagnetic field intensity with X on the straight line at y = 0 in the calculation results. It can be seen from the figure that the electromagnetic field intensity on the surface of spherical silver nanoparticles is very low and the area close to the particle surface is very strong. At the same time, its intensity state represents a periodic distribution depending on the arrangement of hemispherical nanoparticles. Figure 4d shows the changes of the surface plasma spatial distribution characteristics of spherical silver nanoarray with time after being affected by a stimulated luminescence plane wave. It can be seen that in the whole process after excitation, the local surface plasma oscillates between the spherical silver nanoparticle units and gradually decreases until disappearance.
Figure 4e is a schematic diagram of plasma-driven photocatalytic mechanism on the surface of the spherical silver nanoarrays. It can be seen from the figure that the energy required for PATP photocatalytic reaction mainly comes from three aspects. The first is that the PATP molecule is in contact with the spherical silver nanoarray, and its electron is affected by the silver Fermi level, which improves its energy. In the second part, the energy directly comes from the absorbed 633 nm excited light photons. The third part of the energy source is to absorb the energy of hot electrons and holes generated by the decay of surface plasma emitted by the spherical silver nanoarrays under the action of 633 nm laser.
4. Conclusions
Firstly, silver hemispherical nanoarray photocatalyst with aligned gauge was prepared by using an anodic alumina template. Using PATP as a probe molecule on this nanoarray, the surface plasmon-driven photocatalytic reaction under the illumination of a 633 nm laser was studied by means of SERS spectroscopy. Furthermore, in situ introduction of sodium borohydride realized the reverse photocatalytic reaction driven by the surface plasma. The plasma distribution characteristics on the surface of the prepared spherical silver nanoarray were simulated and analyzed by FDTD software. This scientific and practical technique is expected to draw specific graphics or letters character information on the micro- and nano-scale that realize the functions of graphics drawing, information encryption, reading, and erasing.
Author Contributions
Conceptualization, methodology, writing—original draft preparation, project administration, funding acquisition, L.Z.; software, validation, formal analysis, X.W.; investigation, writing—review and editing, visualization, supervision, Y.Z. All authors have read and agreed to the published version of the manuscript.
Funding
This research was funded by the National Natural Science Foundation of China. (Grant No. 11774244, 11804237).
Institutional Review Board Statement
Not applicable.
Informed Consent Statement
Not applicable.
Data Availability Statement
The data presented in this study are available on request from the corresponding author.
Conflicts of Interest
The authors declare no conflict of interest.
References
- Fleischmann, M.; Hendra, P.J.; McQuillan, A.J. Raman spectra of pyridine adsorbed at a silver electrode. Chem. Phys. Lett. 1974, 26, 163–166. [Google Scholar] [CrossRef]
- Jeanmaire, D.L.; Van Duyne, R.P. Surface raman spectroelectrochemistry: Part I. Heterocyclic, aromatic, and aliphatic amines adsorbed on the anodized silver electrode. J. Electroanal. Chem. Interfacial Electrochem. 1977, 84, 1–20. [Google Scholar] [CrossRef]
- Liu, X.J.; Tang, L.H.; Niessner, R.; Ying, Y.B.; Haisch, C. Nitrite-Triggered Surface Plasmon-Assisted Catalytic Conversion of p-Aminothiophenol to p, p’-Dimercaptoazobenzene on Gold Nanoparticle: Surface-Enhanced Raman Scattering Investigation and Nitrite Sensing Application. Anal. Chem. 2015, 87, 499–506. [Google Scholar] [CrossRef] [PubMed]
- Zhan, C.; Chen, X.J.; Huang, Y.F.; Wu, D.Y.; Tian, Z.Q. Plasmon-mediated chemical reactions on nanostructures unveiled by surface-enhanced Raman spectroscopy. Acc. Chem. Res. 2019, 52, 2784–2792. [Google Scholar] [CrossRef] [PubMed]
- Zhang, Z.Y.; Kneipp, J. Mapping the inhomogeneity in plasmonic catalysis on supported gold nanoparticles using surface-enhanced Raman scattering microspectroscopy. Anal. Chem. 2018, 90, 9199–9205. [Google Scholar] [CrossRef] [PubMed]
- Qi, X.N.; Wei, Y.Q.; Jiang, C.X.; Zhang, L.S.; Wang, P.J.; Fang, Y. Investigate on plasma catalytic reaction of 4-nitrobenzenethiol on Ag@SiO2Core-shell substrate via Surface-enhanced Raman scattering. Spectrochim. Acta Part A Mol. Biomol. Spectrosc. 2020, 237, 118362–118369. [Google Scholar] [CrossRef]
- Lin, W.H.; Cao, Y.Q.; Wang, P.J.; Sun, M.T. Unified treatment for plasmon–exciton co-driven reduction and oxidation reactions. Langmuir 2017, 33, 12102–12107. [Google Scholar] [CrossRef]
- Sheng, S.X.; Ji, Y.F.; Yan, X.H.; Wei, H.; Luo, Y.; Xu, H.X. Azo-dimerization mechanisms of p-aminothiophenol and p-nitrothiophenol molecules on plasmonic metal surfaces revealed by tip-/surface-enhanced Raman spectroscopy. J. Phys. Chem. C 2020, 124, 11586–11594. [Google Scholar] [CrossRef]
- Jiang, C.X.; Wei, Y.Q.; Zhao, P.C.; Wang, P.J.; Fang, Y.; Zhang, L.S. Investigation of surface-enhanced Raman spectroscopy on the substrates of telluride 2D material. Eur. Phys. J. Plus 2020, 135, 671–680. [Google Scholar] [CrossRef]
- Mayer, K.M.; Hafner, J.H. Localized surface plasmon resonance sensors. Chem. Rev. 2011, 111, 3828–3857. [Google Scholar] [CrossRef]
- Zhang, Y.; He, S.; Guo, W.; Hu, Y.; Huang, J.; Mulcahy, J.R.; Wei, W.D. Surface-Plasmon-Driven Hot Electron Photochemistry. Chem. Rev. 2018, 118, 2927–2954. [Google Scholar] [CrossRef] [PubMed]
- Aslam, U.; Rao, V.G.; Chavez, S.; Linic, S. Catalytic conversion of solar to chemical energy on plasmonic metal nanostructures. Nat. Catal. 2018, 1, 656–665. [Google Scholar] [CrossRef]
- Garcia-Rico, E.; Alvarez-Puebla, R.A.; Guerrini, L. Direct surface-enhanced Raman scattering (SERS) spectroscopy of nucleic acids: From fundamental studies to real-life applications. Chem. Soc. Rev. 2018, 47, 4909–4923. [Google Scholar] [CrossRef] [PubMed]
- Hong, Y.; Zhou, X.; Xu, B.; Huang, Y.; He, W.; Wang, S.; Wang, C.; Zhou, G.; Chen, Y.; Gong, T. Optoplasmonic hybrid materials for trace detection of methamphetamine in biological fluids through SERS. ACS Appl. Mater. Interfaces 2020, 12, 24192–24200. [Google Scholar] [CrossRef]
- Yang, B.; Jin, S.; Guo, S.; Park, Y.; Chen, L.; Zhao, B.; Jung, Y.M. Recent development of SERS technology: Semiconductor-based study. ACS Omega 2019, 4, 20101–20108. [Google Scholar] [CrossRef]
- Zhang, Y.Y.; Zhao, C.P.; Wang, X.Y.; Sun, S.P.; Zhang, D.; Zhang, L.S.; Fang, Y.; Wang, P.J. Plasmon-driven photocatalytic properties based on the surface of gold nanostar particles. Spectrochim. Acta Part A Mol. Biomol. Spectrosc. 2021, 264, 120240–120248. [Google Scholar] [CrossRef]
- Sun, M.; Fang, Y.; Zhang, Z.; Xu, H. Activated vibrational modes and Fermi resonance in tip-enhanced Raman spectroscopy. Phys. Rev. E Stat. Nonlinear Soft Matter Phys. 2013, 87, 020401–020406. [Google Scholar] [CrossRef] [Green Version]
- Christopher, P.; Xin, H.; Linic, S. Visible-light-enhanced catalytic oxidation reactions on plasmonic silver nanostructures. Nat. Chem. 2011, 3, 467–472. [Google Scholar] [CrossRef]
- Cai, W.; Tang, X.; Sun, B.; Yang, L. Highly sensitive in situ monitoring of catalytic reactions by surface enhancement Raman spectroscopy on multifunctional Fe3O4/C/Au NPs. Nanoscale 2014, 6, 7954–7958. [Google Scholar] [CrossRef]
- Xu, P.; Kang, L.L.; Mack, N.H.; Schanze, K.S.; Han, X.J.; Wang, H.L. Mechanistic understanding of surface plasmon assisted catalysis on a single particle: Cyclic redox of 4-aminothiophenol. Sci. Rep. 2013, 3, 2997–3003. [Google Scholar] [CrossRef] [Green Version]
- Kang, L.L.; Han, X.J.; Chu, J.Y.; Xiong, J.; He, X.; Wang, H.L.; Xu, P. In Situ Surface-Enhanced Raman Spectroscopy Study of Plasmon-Driven Catalytic Reactions of 4-Nitrothiophenol under a Controlled Atmosphere. Chem. Cat. Chem. 2015, 7, 1004–1010. [Google Scholar] [CrossRef]
- Sun, M.; Xu, H. A Novel Application of Plasmonics: Plasmon-Driven Surface-Catalyzed Reactions. Small 2012, 8, 2777–2786. [Google Scholar] [CrossRef] [PubMed]
- Aslam, U.; Chavez, S.; Linic, S. Controlling energy flow in multimetallic nanostructures for plasmonic catalysis. Nat. Nanotechnol. 2017, 12, 1000–1005. [Google Scholar] [CrossRef]
- Zayats, A.V.; Maier, S. Hot-Electron Effects in Plasmonics and Plasmonic Materials. Adv. Opt. Mater. 2017, 5, 1700508. [Google Scholar] [CrossRef] [Green Version]
- Huang, Y.F.; Wang, W.; Guo, H.Y.; Zhan, C.; Duan, S.; Zhan, D.P.; Wu, D.Y.; Ren, B.; Tian, Z.Q. Microphotoelectrochemical surface-enhanced Raman spectroscopy: Toward bridging hot-electron transfer with a molecular reaction. J. Am. Chem. Soc. 2020, 142, 8483–8489. [Google Scholar] [CrossRef] [PubMed]
- Liu, Y.Q.; Zhao, L.J.; Li, X.J.; Zeng, Z.; Wang, P.J.; Zhang, L.S.; Fang, Y. Investigation of plasmon properties of silver microsphere array demonstrated experimentally by tip-enhanced Raman spectroscopy. Appl. Surf. Sci. 2018, 428, 900–905. [Google Scholar] [CrossRef]
Figure 1.
The photocatalytic formation process of DMAB from PATP surface plasma driven: (a) PATP Raman characteristic peaks; (b) DMAB Raman characteristic peaks; (c) comparison of Raman spectra of PATP and DMAB; and (d) the schematic diagram of the plasma driven photocatalytic reaction.
Figure 1.
The photocatalytic formation process of DMAB from PATP surface plasma driven: (a) PATP Raman characteristic peaks; (b) DMAB Raman characteristic peaks; (c) comparison of Raman spectra of PATP and DMAB; and (d) the schematic diagram of the plasma driven photocatalytic reaction.

Figure 2.
Surface topography of spherical silver nanoarrays: (a) 2D AFM image; (b) SEM image; and (c) geometric dimension analysis.
Figure 2.
Surface topography of spherical silver nanoarrays: (a) 2D AFM image; (b) SEM image; and (c) geometric dimension analysis.

Figure 3.
SERS spectrum of plasma-driven photocatalysis based on spherical silver nanoarrays: (a) SERS spectrum of PATP photocatalysis generating DMAB; (b) changes of the integrated peak intensity ratio of 1142 and 1080 cm−1 vibrations corresponding to each spectral line in (a); (c) SERS spectrum of DMAB reverse reaction generating PATP; and (d) changes of the integrated peak intensity ratio of 1142 and 1080 cm−1 vibrations corresponding to each spectral line in (c).

Figure 4.
The mechanism of spherical silver nanoarrays plasma driven photocatalysis including: (a) the theoretical model and polarization direction of the stimulated luminescence simulated by the surface plasmon; (b) calculation results of the intensity distribution characteristics of the surface plasmon of the spherical silver nanoarrays; (c) analysis of intensity distribution simulated by the surface plasmon of the spherical silver nanoarrays; (d) surface plasmon distribution of the spherical silver nanoarrays; and (e) the mechanism of the spherical silver nanoarrays plasma-driven photocatalysis.

Publisher’s Note: MDPI stays neutral with regard to jurisdictional claims in published maps and institutional affiliations. |
© 2021 by the authors. Licensee MDPI, Basel, Switzerland. This article is an open access article distributed under the terms and conditions of the Creative Commons Attribution (CC BY) license (https://creativecommons.org/licenses/by/4.0/).
Share and Cite
MDPI and ACS Style
Zhang, L.; Wang, X.; Zhang, Y. Photocatalytic Properties of Silver Nanospherical Arrays Driven by Surface Plasmons. Chemosensors 2021, 9, 336. https://0-doi-org.brum.beds.ac.uk/10.3390/chemosensors9120336
AMA Style
Zhang L, Wang X, Zhang Y. Photocatalytic Properties of Silver Nanospherical Arrays Driven by Surface Plasmons. Chemosensors. 2021; 9(12):336. https://0-doi-org.brum.beds.ac.uk/10.3390/chemosensors9120336
Chicago/Turabian StyleZhang, Lisheng, Xueyan Wang, and Yiyuan Zhang. 2021. "Photocatalytic Properties of Silver Nanospherical Arrays Driven by Surface Plasmons" Chemosensors 9, no. 12: 336. https://0-doi-org.brum.beds.ac.uk/10.3390/chemosensors9120336
Note that from the first issue of 2016, this journal uses article numbers instead of page numbers. See further details here.