Article

Macrocycle-Functionalized RGO for Gas Sensors for BTX Detection Using a Double Transduction Mode

1
Clermont Auvergne INP, CNRS, Institut Pascal, Université Clermont Auvergne, F-63000 Clermont-Ferrand, France
2
CNRS, SIGMA Clermont, ICCF, Université Clermont Auvergne, F-63000 Clermont-Ferrand, France
3
CNRS, Institut Pascal, Université Clermont Auvergne, F-63000 Clermont-Ferrand, France
*
Author to whom correspondence should be addressed.
Submission received: 30 October 2021 / Revised: 2 December 2021 / Accepted: 3 December 2021 / Published: 7 December 2021

Abstract

:
To fabricate mass and resistive sensors based on reduced graphene oxide (RGO), we investigated the functionalization of RGO by tetra tert-butyl phthalocyanine (PcH2tBu), which possesses a macroring and tert-butyl peripheral groups. Herein, we present the gas sensor responses of the functionalized RGO toward benzene, toluene, and xylene (BTX) vapors. The RGO was obtained by the reduction of graphene oxide (GO) using citrate as a reducing agent, while the functionalization was achieved non-covalently by simply using ultrasonic and heating treatment. The sensor devices based on both QCM (quartz crystal microbalance) and resistive transducers were used simultaneously to understand the reactivity. Both the GO and the RGO showed less sensitivity to BTX vapors, while the RGO/PcH2tBu presented enhanced sensor responses. These results show that the p-network plays a very important role in targeting BTX vapors. The resistive response analysis allowed us to state that the RGO is a p-type semiconductor and that the interaction is governed by charge transfer, while the QCM response profiles allowed use to determine the differences between the BTX vapors. Among BTX, benzene shows the weakest sensitivity and a reactivity in the higher concentration range (>600 ppm). The toluene and xylene showed linear responses in the range of 100–600 ppm.

1. Introduction

In the last decade, an unprecedented amount of research on graphene derivatives has been carried out owing to its unique nature and properties [1,2]. Graphene, which presents a hexagonal lattice that resembles a honeycomb structure, is an allotrope of carbon that presents a two-dimensional (2D) structure. Since its discovery by Geim and Noveselov [3], there has been great enthusiasm among the scientific community and graphene has never stopped being of interest to many researchers.
For use in the gas sensor field, the high surface area of graphene combined with the transfer of charge between the molecules adsorbed to its surface are its principal advantages [4,5]. In practice, graphene oxide (GO), which is obtained through the oxidation of graphene, is mainly used for practical applications. This is because many technical resources—such as solution processing, surface modification, functionalization, etc.—extrapolated from carbon nanotubes’ surface chemistry are available for the use of graphene oxide (GO) as an allotrope of carbon. These possibilities open unlimited possibilities relating to liquid-phase chemical processing. Another advantage of the solution phase is that it provides reactants that can be easily incorporated in graphene surfaces to allow for their successful functionalization. As a result, graphene can be oxidized into GO, and this transformation will generate many oxygenated groups on the basal planes of the graphene surface [6].
This transformation/oxidation allows the manipulation of graphene derivatives (GO in this case) but is not without consequences, since some of their properties can be altered [7]. This is the case for the electronic properties, since, depending on the oxidation level, GO’s electronic properties can be altered from weakly conducting to isolating material [7,8]. Highly oxidized GO is therefore not always useful for detecting gases when carbon nanostructures are intended for application in the sensors field. However, mild oxidation, when conducted in a controlled way, can prevent the conduction properties from being altered [8]. Another solution to this problem is a reduction process that can be achieved chemically or physically [9,10,11,12,13]. For this reason, GO must often be reduced to form RGO for many applications [14]. Through this reduction, most electronic properties can be restored. However, this restoration is often not complete, since oxygenated groups will still be present on the surface in RGO [12,15]. For our investigation, we used citrate as a reducing agent to produce the RGO in our study [9].
To make the RGO material more attractive for applications in sensors, functionalization or decoration are often used to prepare graphene-based sensing materials [16,17,18,19,20]. Many functionalization units—from metal oxide [21,22], organics material [23,24], nanoparticles [25], conducting polymers [26,27], etc.—are available for preparing graphene-based sensing materials. We have previously investigated the functionalization of carbon nanotubes by phthalocyanine derivatives and found that such macrocycles are efficient functionalization tools and good candidates for the detection of BTX gases [28,29]. BTX are toxic gases that are mainly produced by automobile traffic, and their potential dangerousness and toxicological or carcinogenic effects are well established [30]. Methods for controlling and monitoring these for health purposes are still in demand, since their similar properties complicate detection.
Using phthalocyanine derivatives, which present an aromatic π-system to target BTX, is relevant, since π−π interaction can be initiated to enhance BTX detections [31,32]. Graphene materials also present these potentialities, but the functionalization of graphene materials with phthalocyanine seems to provide more sensitivity regarding the π–π interaction. As an example of such an association, the use of graphene and phthalocyanine has been reported for the detection of chlorine [33,34], glucose [35], NO2 [36], NH3 [37], etc. In this article, we aimed to use a free phthalocyanine—namely, tetra tert-butyl phthalocyanine (PcH2tBu)—to functionalize RGO. Such a combination has never been tested for BTX detection and this will be the first time that a graphene-based material will be combined with a π-extended molecular system and tested for BTX detection. The hybrid materials formed (RGO/PcH2tBu) will be investigated regarding BTX using both mass and resistive transducers. The hybrid nanostructure will be characterized and evaluated regarding its sensing performance.

2. Materials and Methods

2.1. Materials and Solvents

Anhydrous chloroform (purity grade > 99%), acetone (ACOH), hexane, and ethanol (purity grade > 99%) were obtained from Aldrich and used without further purification. As-produced GO (modified Hummer’s method) was purchased from ACS. Materials were used as received (purity grade ~ 99%). 2,9,16,23-tetra-tert-butyl-29H,31H-phthalocyanine (purity 97%), denoted PcH2tBu, was obtained from Aldrich and used without further purification. Sodium citrate tribasic dihydrate (purity grade > 99.0%) was obtained from Aldrich and used as received.

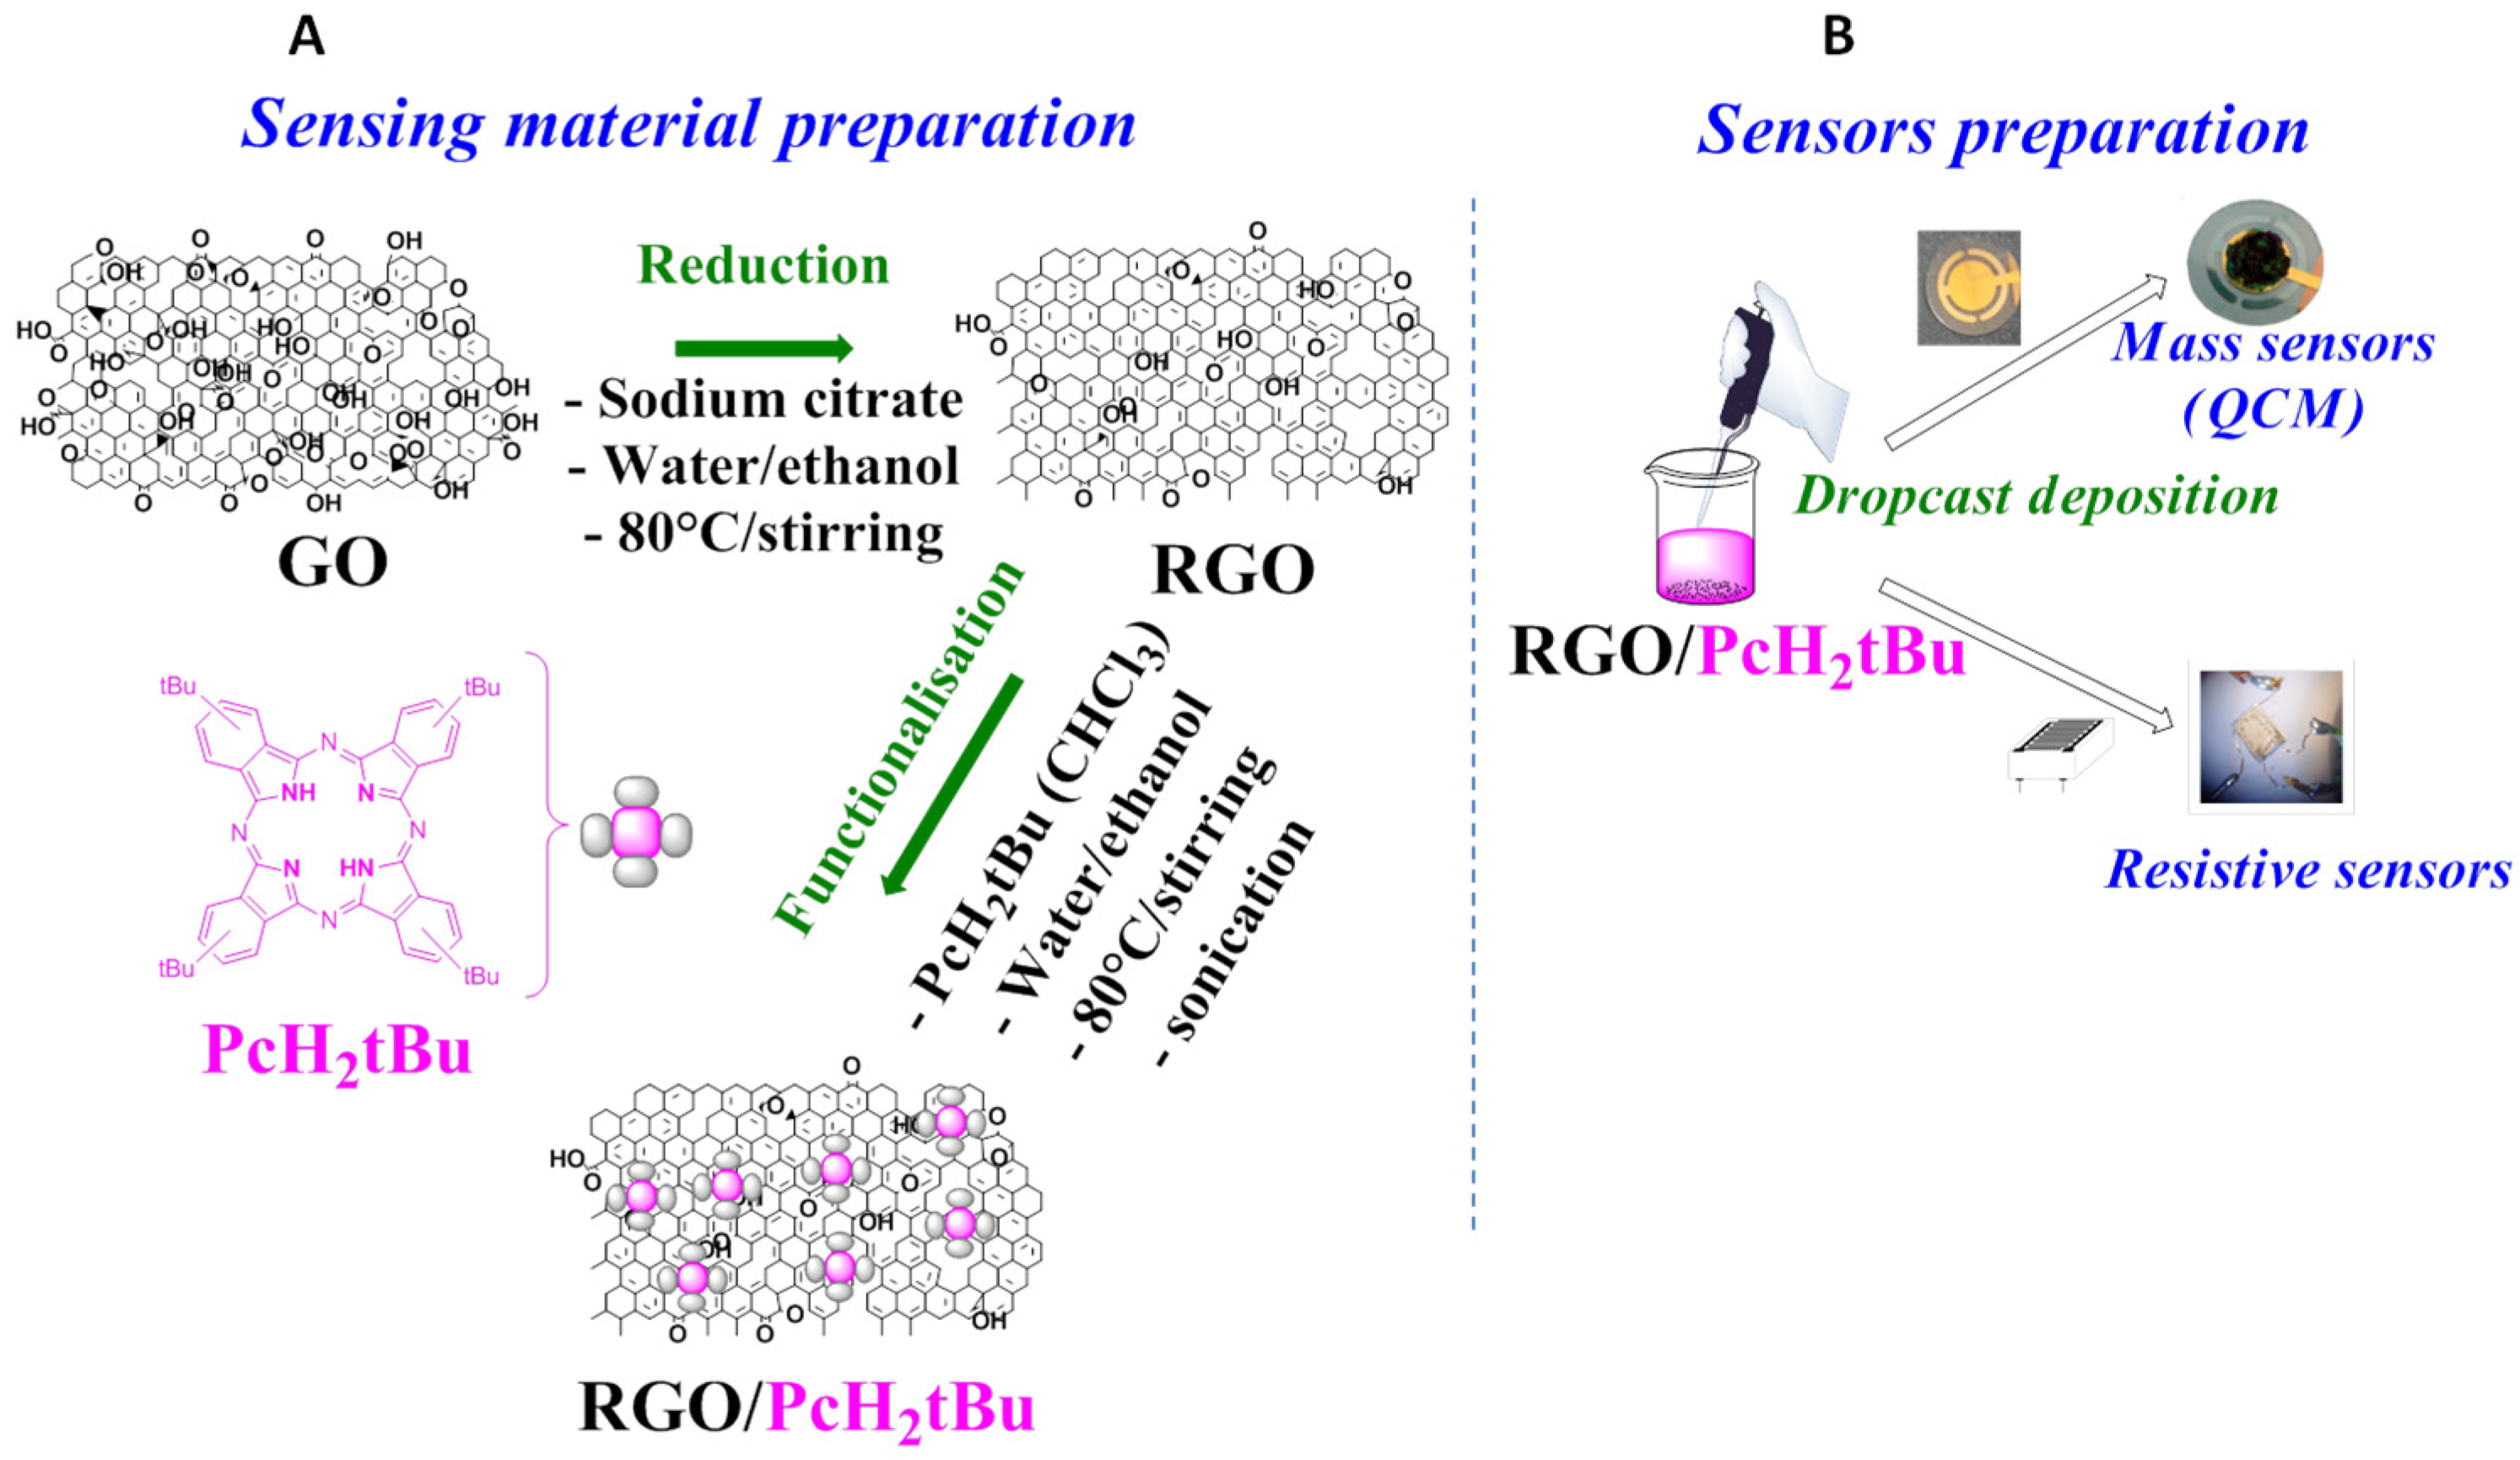
2.2. RGO Preparation

The reduction of GO was achieved chemically through the use of sodium citrate as a reducing agent [9]. Following a typical procedure, a dispersion was prepared by adding 50 mg of GO to a mix of solvent (100 mL) containing ethanol and water in a volume ratio of 1v/1v. The mixture was homogenized through alternating heating on a hot plate (80 °C) and ultrasonic treatment in a bath-type sonicator (Fisher Scientific France, Fisherbrand, Illkirch Cedex, France, FB15047, 60 W) for 30 min. A freshly prepared reducing solution based on 5 mg of citrate in 20 mL water was then dropwise added to the mixture, which was further heated under stirring. The grey mixture turned slightly black and was maintained at a constant level under heating and stirring for 90 min. The obtained dispersion was stirred overnight at room temperature. Finally, the mixture (slightly viscous) was filtered and washed several times with water (90 mL), before finally being allowed to dry at room temperature.

2.3. RGO/Pch2tbu Preparation

The preparation of the RGO/PcH2tBu was achieved using our ultrasonic-assisted non-covalent functionalization method [32], which we modified to enable the compatibility of solvents. In fact, RGO is scarcely dispersed in water or water/ethanol (forming a suspension), while PcH2tBu is most soluble in chloroform. However, the alternation of heating and sonication can facilitate the combination of these two immiscible mixtures. Following a typical procedure, the RGO (5.0 mg) was dispersed in a water/ethanol (10 mL/20 mL) solution and subjected to ultrasonic treatment for 20 min. Then, the dispersion was heated at 80 °C under stirring for 20 min and then a 5 mL chloroform solution of the PcH2tBu (0.001 M) was added dropwise to the mixture, resulting in the appearance of a two-phase solution. The mixture was then treated by alternating ultrasonic treatment and heating every 15 min for 1 h. The resulting mixture was then allowed to cool down at room temperature under stirring. The mixture was finally filtered, washed thoroughly to remove excess of PcH2tBu, and dried at room temperature.

2.4. Characterization Methods

UV−visible spectra were recorded on a Shimadzu 2600 plus spectrophotometer using a 1 cm path length glass cell, and a mixture of ethanol/water was used as a solvent. The solutions were prepared by dispersing the materials in the solvent mixture followed by ultrasonic treatment for 5 min. Fourier transform infrared spectrometry (FTIR) spectra are recorded in the attenuated total reflection (ATR) mode using a Thermo Electron spectrometer. Spectra were acquired in the mid-IR region of 4000–400 cm−1 and for all spectra, 64 scans at a 4 cm−1 resolution were applied. Raman spectra were recorded with a Jobin Yvon T64000 spectrometer using a charge-coupled device multichannel detector. Raman spectra were acquired at room temperature using an excitation wavelength of 514 nm from an argon laser. For electrical characterization, the current (I) versus voltage (V) measurement—i.e., I−V characteristic of the sensing device—was performed in a two-point configuration in ambient air employing a Keithley 2636 System Source Meter controlled by the Labview software. Typically, the I−V graphs were obtained in the −1 V to +1 V range with a step voltage of 0.01 V.
SEM micrographs were acquired from a Carl Zeiss Supra scanning electron microscope (SEM) with an acceleration voltage of 3 kV. For SEM analysis, the samples were prepared by the drop-cast deposition of a solution containing the materials on a copper foil before being air-dried. Transmission electron micrographs were obtained with a HITACHI H-7650 transmission electron microscope (TEM) operating at 80 kV. For TEM analysis, the samples were prepared by the drop-cast deposition of a solution containing the materials on a carbon-coated copper TEM grid and then air-dried.

2.5. Sensor Devices and Sensor Preparation and Test Bench

For both devices (QCM and resistive), the sensor layers were obtained by the drop-cast deposition of a dispersion containing the material and followed by heating at 80 °C for solvent evaporation. The resistive sensor substrate consisted of screen-printed interdigitated electrodes (IDEs, with an interelectrode distance of 125 μm) made of platinum. We used a Keithley 2000 for the resistance measurement. For the QCM sensors, we used commercially available 5 MHz AT-cut (a MAXTEK 5 MHz polished Cr/Au, with a sensitivity factor Cf of 0.056 Hz/ng/cm2 and area of 1.37 cm2) quartz crystals with gold electrodes on both sides purchased from INFICON (USA) and measured the frequency with an Agilent 53131A (with a 1 Hz precision). In the QCM sensor experiment, the resonance frequency of the QCM decreased according to Sauerbrey’s equation relating the frequency variation to mass variation Equation (1):
Δf = −Cf Δm
where Δf is the frequency variation (Hz), Cf is the sensitivity factor (Hz/ng/cm2), and Δm is the mass variation per unit area (g/cm2). For mass sensing experiments, the response can be directly given as the frequency variation in hertz (Hz).
However, by measuring the frequency of the QCM before and after deposition, the amount of sensing material deposited was calculated. This calculation allowed to give the response in frequency correlated to the amount of material deposited and then given in Hz/ng. This response representation (Hz/ng) is more powerful for comparing different sensors with different deposited masses.
The sensor test bench used in this study was adapted from our previous setups [28,29] and equipped with a BTX gas source (see the experimental setup Figure S1 in the Supplementary Materials file). For each gas, the concentrations were obtained by diluting vapor from a permeation oven (50 °C) with dry synthetic air as the carrier gas and using computer-assisted mass flow controllers (MCFs) and solenoid valves for controlling the opening and closing of the system. Depending on the permeation rate and the required concentration, the oven could be equipped with either a permeation tube for lower concentrations or a diffusion tube for higher concentrations. For the experiments, the sensors were exposed to analyte for 20 min and recovered in air for 60 min. For the mass sensor responses, an Agilent 53131A was used for frequency measurement (with a 1 Hz precision). For the resistive sensors, a Keithley digital multimeter was used. The responses were given either in ΔR (Ω) or ΔR/R0 (%).
ΔR = Rgas − R0 given in Ω and ΔR/R0 (%) = 100 × (Rgas − R0)/R0 given in %

3. Results

3.1. Preparation of the RGO/PcH2tBu: Utility of the Hydro-Alcoholic Dispersion

In our case, the idea was to associate PcH2tBu, which is mainly soluble in chloroform, with RGO. Knowing that RGO is not soluble in chloroform [38] unless there is the addition of a surfactant [39], the use of other solvents or solvent mixtures has been attempted. It has been proven that GO is soluble in water, but at a higher concentrations of GO the dispersion can turn more viscous [40,41]. The same situation is also valid for RGO, even it is less soluble than pure GO. During the reduction, without mixing with proper additives, the RGO formed can agglomerate and precipitate irreversibly. This situation therefore limits the benefit of restoring the properties through reduction [42] and a gain in surface area.
Due to the high number of oxygenated groups, one could expect GO or RGO to be soluble in alcohol, but studies have shown the opposite, since GO does not directly disperse in alcohols [43]. However, adding alcohol to an aqueous dispersion of GO or RGO mixture of can be an intermediate solution for transferring the GO or RGO into the alcoholic phase [44] and obtaining a kind of hydroalcoholic dispersion. This solution has been implemented in our studies, since chloroform seems to be the best solvent for PcH2tBu, our reactant. Therefore, having a hydro-alcoholic dispersion is a better approach than mixing the aqueous dispersion with chloroform, which failed in almost all of our attempts. The preparation method is presented in the Scheme 1.

3.2. Characterization of the RGO/PcH2tBu

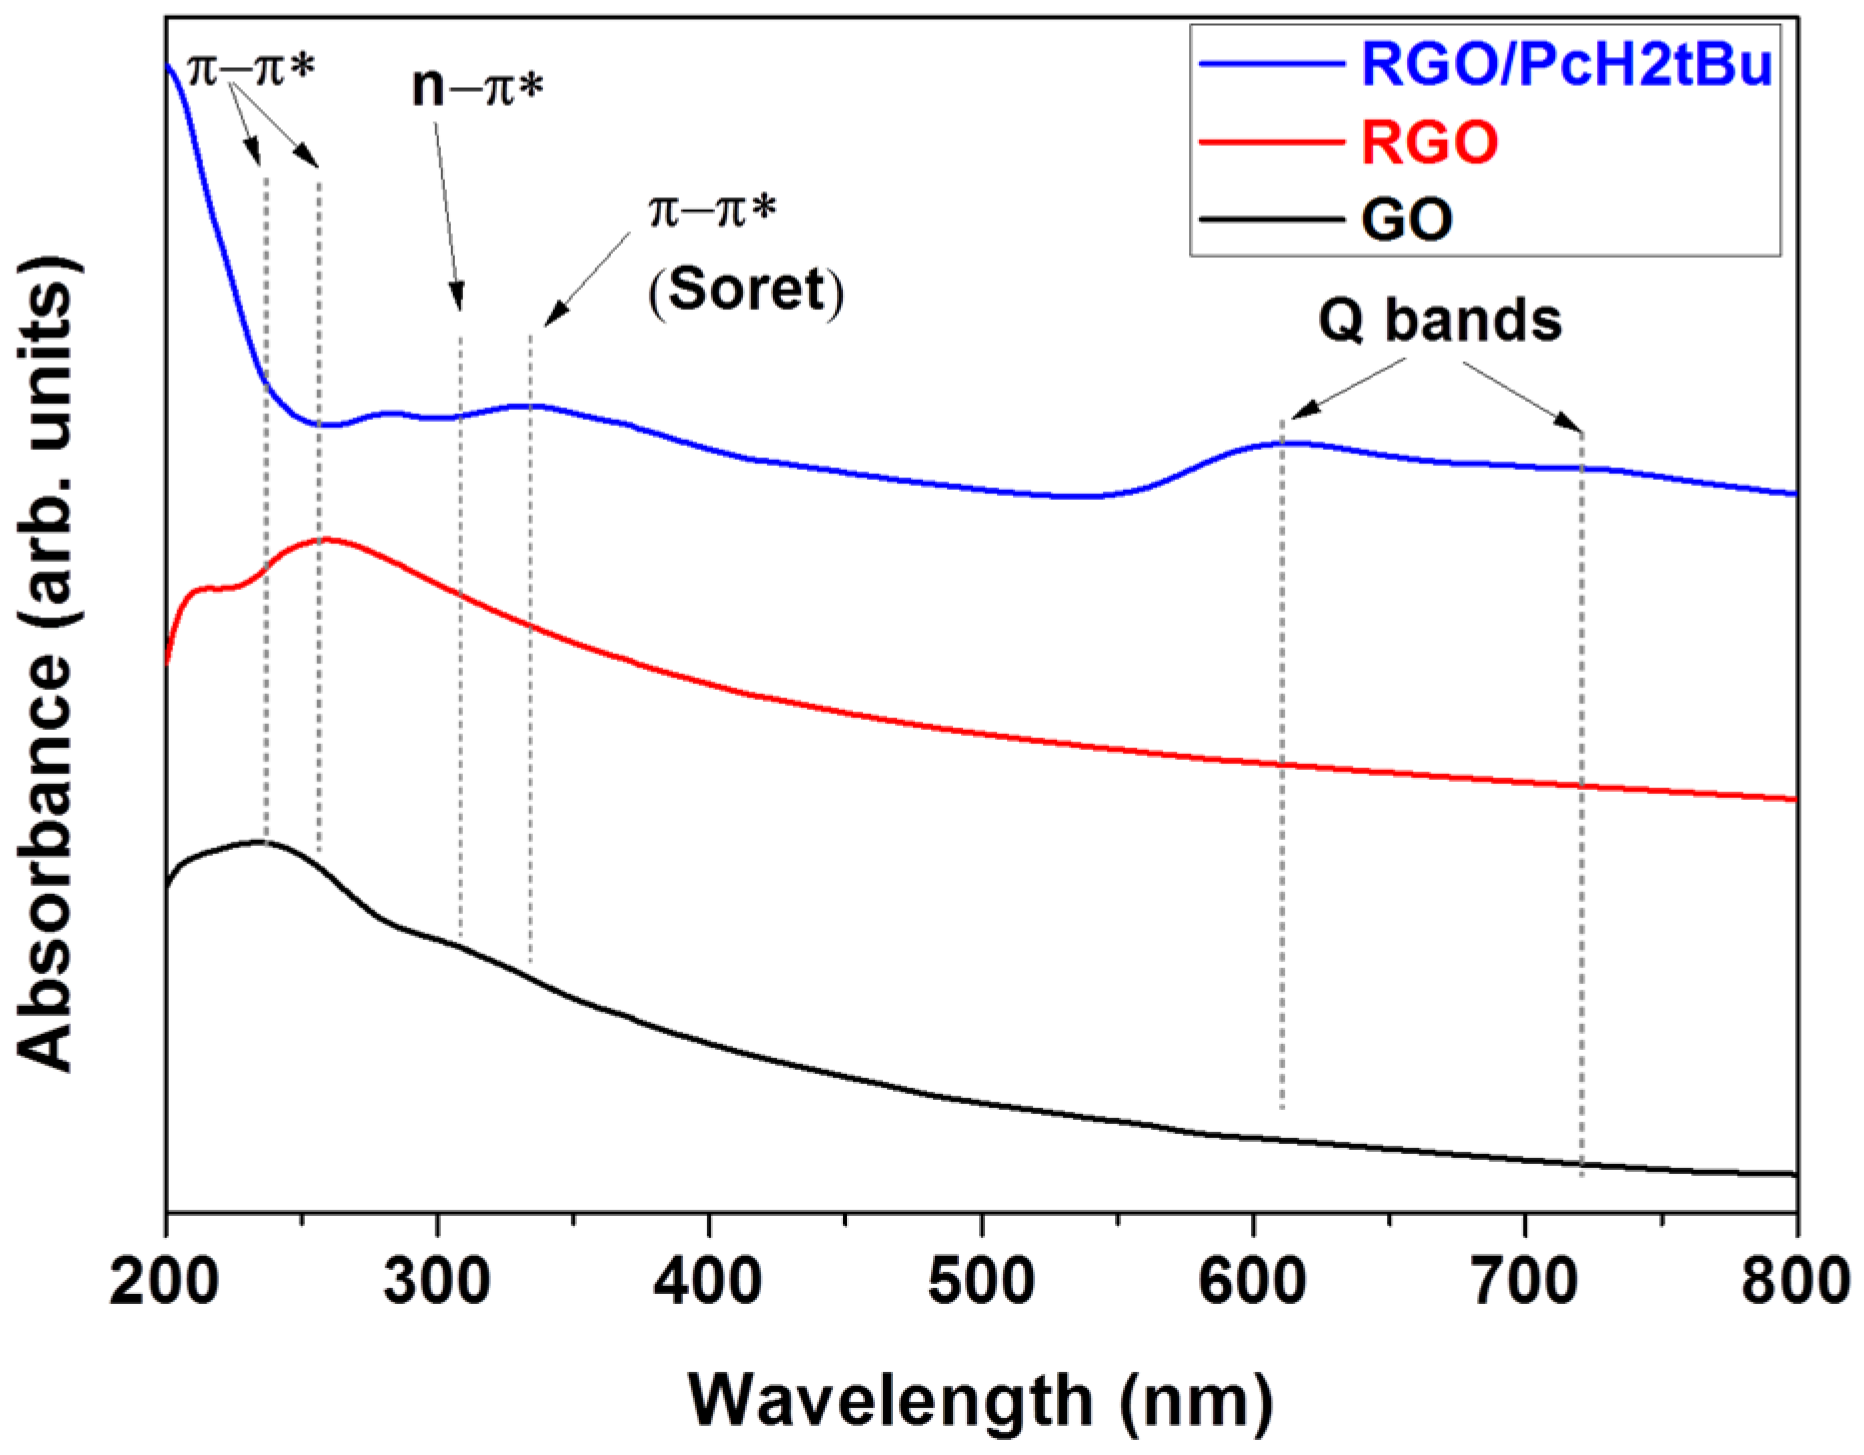
3.2.1. UV–Vis Characterization

The UV–Vis spectra of GO, RGO, and RGO PcH2tBu are presented in Figure 1. The GO present a featureless spectrum with an absorption maxima at 230 nm and a shoulder at 300 nm. These peaks are attributed to π-π* transition and n-π* transitions, respectively [45,46]. These transitions are associated with the aromatic C-C bonds and the C=O [47,48]. The RGO presents a maximum absorption peak at 260 nm, which is red-shifted by 30 nm compared to the GO peak.
This shift is mainly associated with the restoration of the π-conjugated network, as observed after the reduction of GO [49,50,51]. In the RGO/PcH2tBu, the presence of more peaks is manifest. In fact, the peak at 277 nm corresponds to the red-shift of the 260 nm peak (π-π* transition) of the RGO, while that at 329 nm corresponds to the Soret band of the PcH2tBu. Such a redshift within is commonly attributed to the stacking interaction between the RGO and the free phthalocyanine moieties. The other peaks and shoulders in the 550–750 nm range correspond to the Q bands of the PcH2tBu [52].

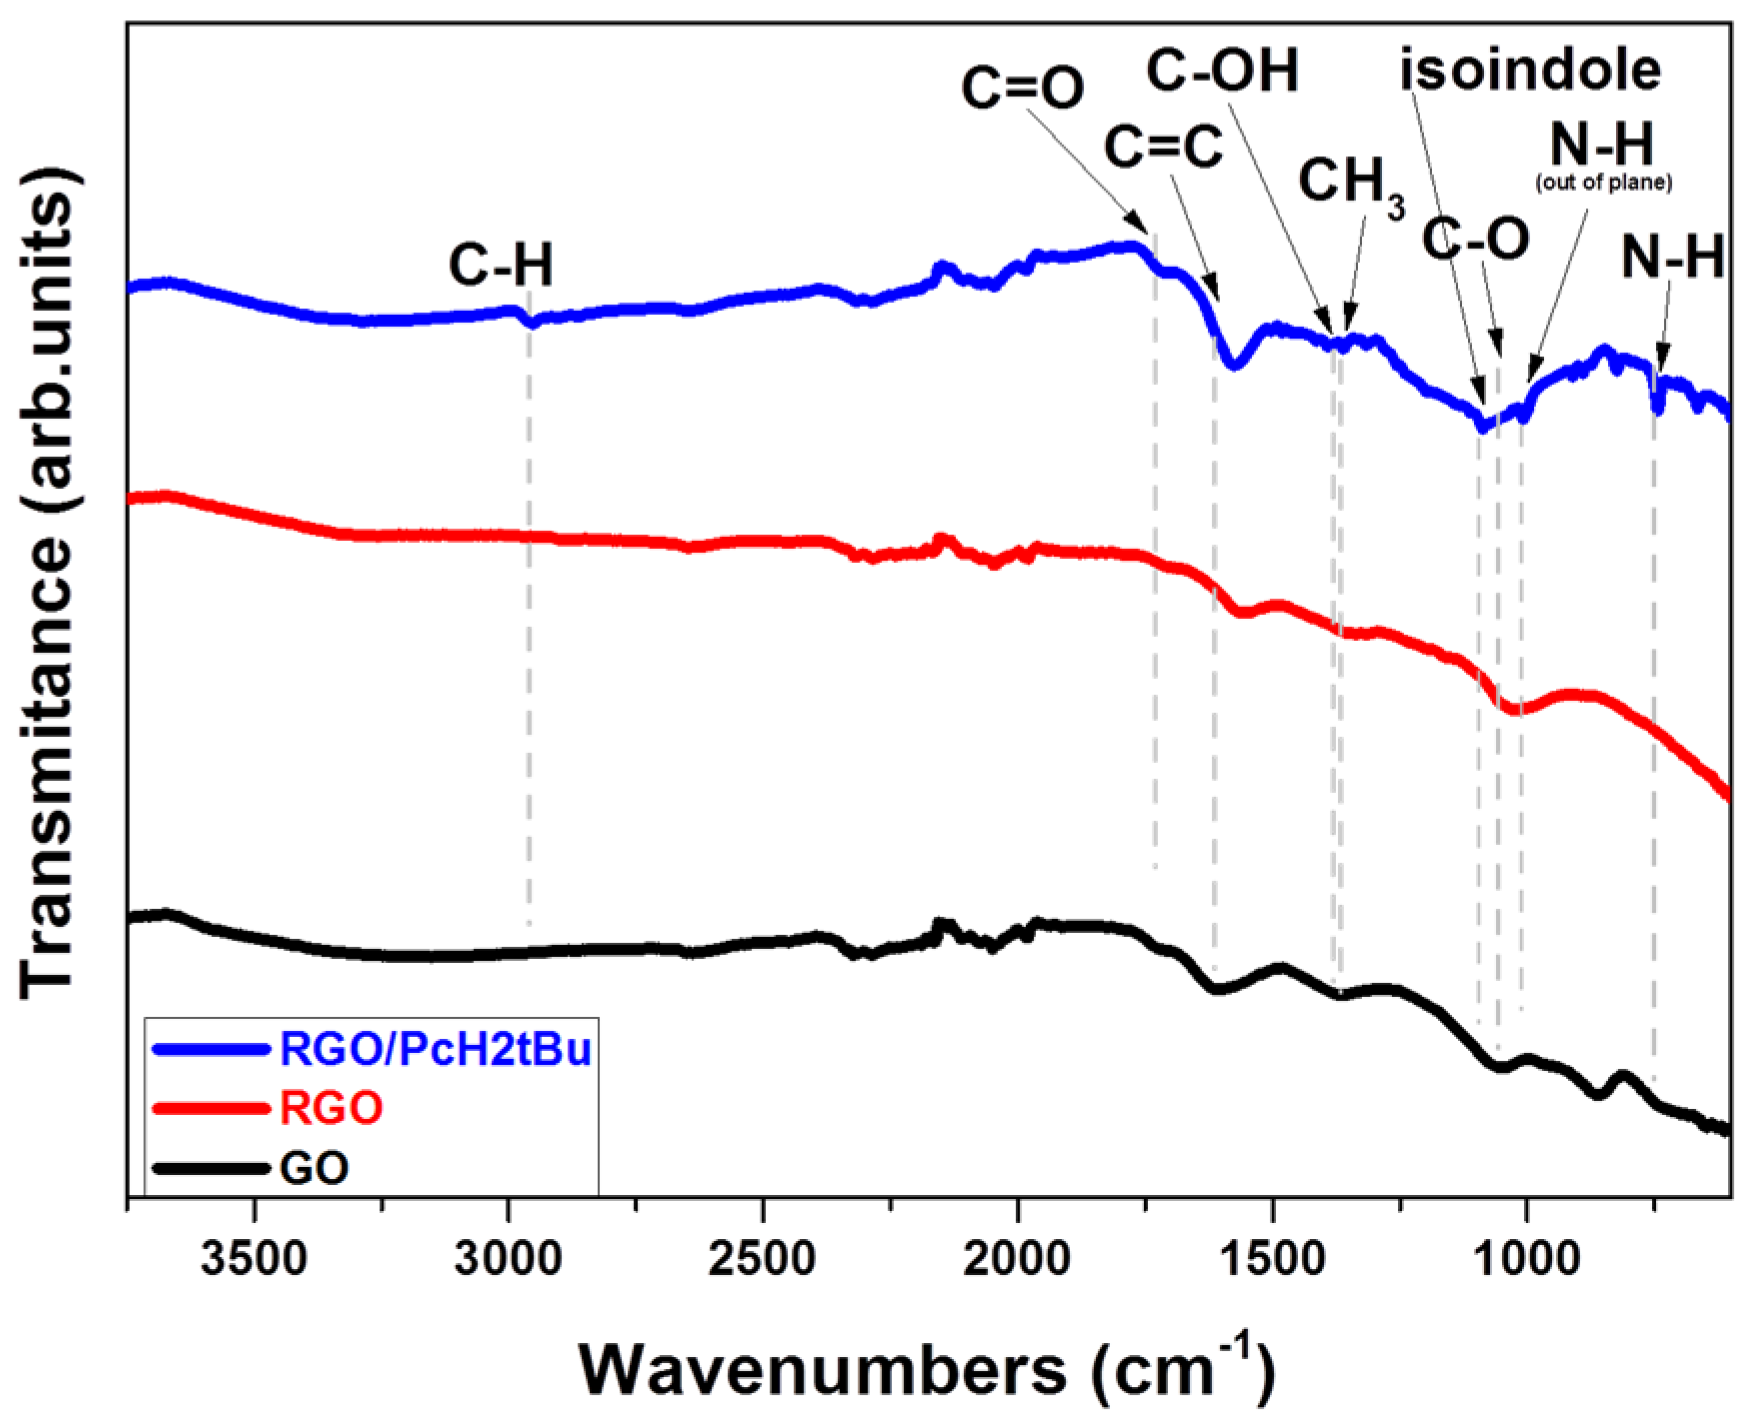
3.2.2. Infrared Characterization

The graphene oxide IR spectrum (Figure 2) presents features that are characteristic of graphene oxide [53,54,55]. These are expressed in terms of vibrations peaks in the 600–1700 cm−1 range and a broad band in the 2700–3000 cm−1 region. The broad band centered at 3300 cm−1 is representative of OH bonds [55], while the vibration bands at 1600, 1360, and 1050 cm−1 can be attributed to the C=C, C-OH, and C-O bonds, respectively [56]. In the RGO spectrum, the intensity of the characteristic peaks corresponding to the OH bonds is slightly reduced as a result of the chemical reduction.
The other vibration bands are slightly shifted toward 1555 and 1030 cm−1, indicative of a mild reduction [54]. Additionally, very small peaks appear at 1200 and 1160 cm−1, and these can be attributed to C-O-C and C-O stretching. Most of these peaks showed a concomitant decrease with the reduction of the oxygenated groups [47]. In the RGO/PcH2tBu spectrum, the broad band representing the OH is still present, indicating that after reduction and functionalization the sensing matrix always presents OH functional groups. However, taking into account the means of preparation, when using alcohol the presence of OH bonds from the residual solvents cannot be excluded. There is also the appearance of new bands in addition to the RGO vibration bands. The vibration bands at 2940 cm−1 can be attributed to the tert-butyl (-(C-CH3)3) groups of the PcH2tBu. The vibrations bands at 1010, 1090, and 1360 cm−1 are, respectively, assigned to the out-of-plane bending of the N-H, bending from the isoindole groups, and the aliphatic CH3 [57]. The strong band at 1570 can be attributed to C=C bonds from both the RGO and the PcH2tBu, while the 744 cm−1 peak can be assigned to N-H bending [58]. All these characterizations (UV–Vis and IR) confirmed the successful functionalization of RGO by PcH2tBu. The Raman characterization (Figure S1 in the Supplementary Materials file) also confirmed this effective functionalization.

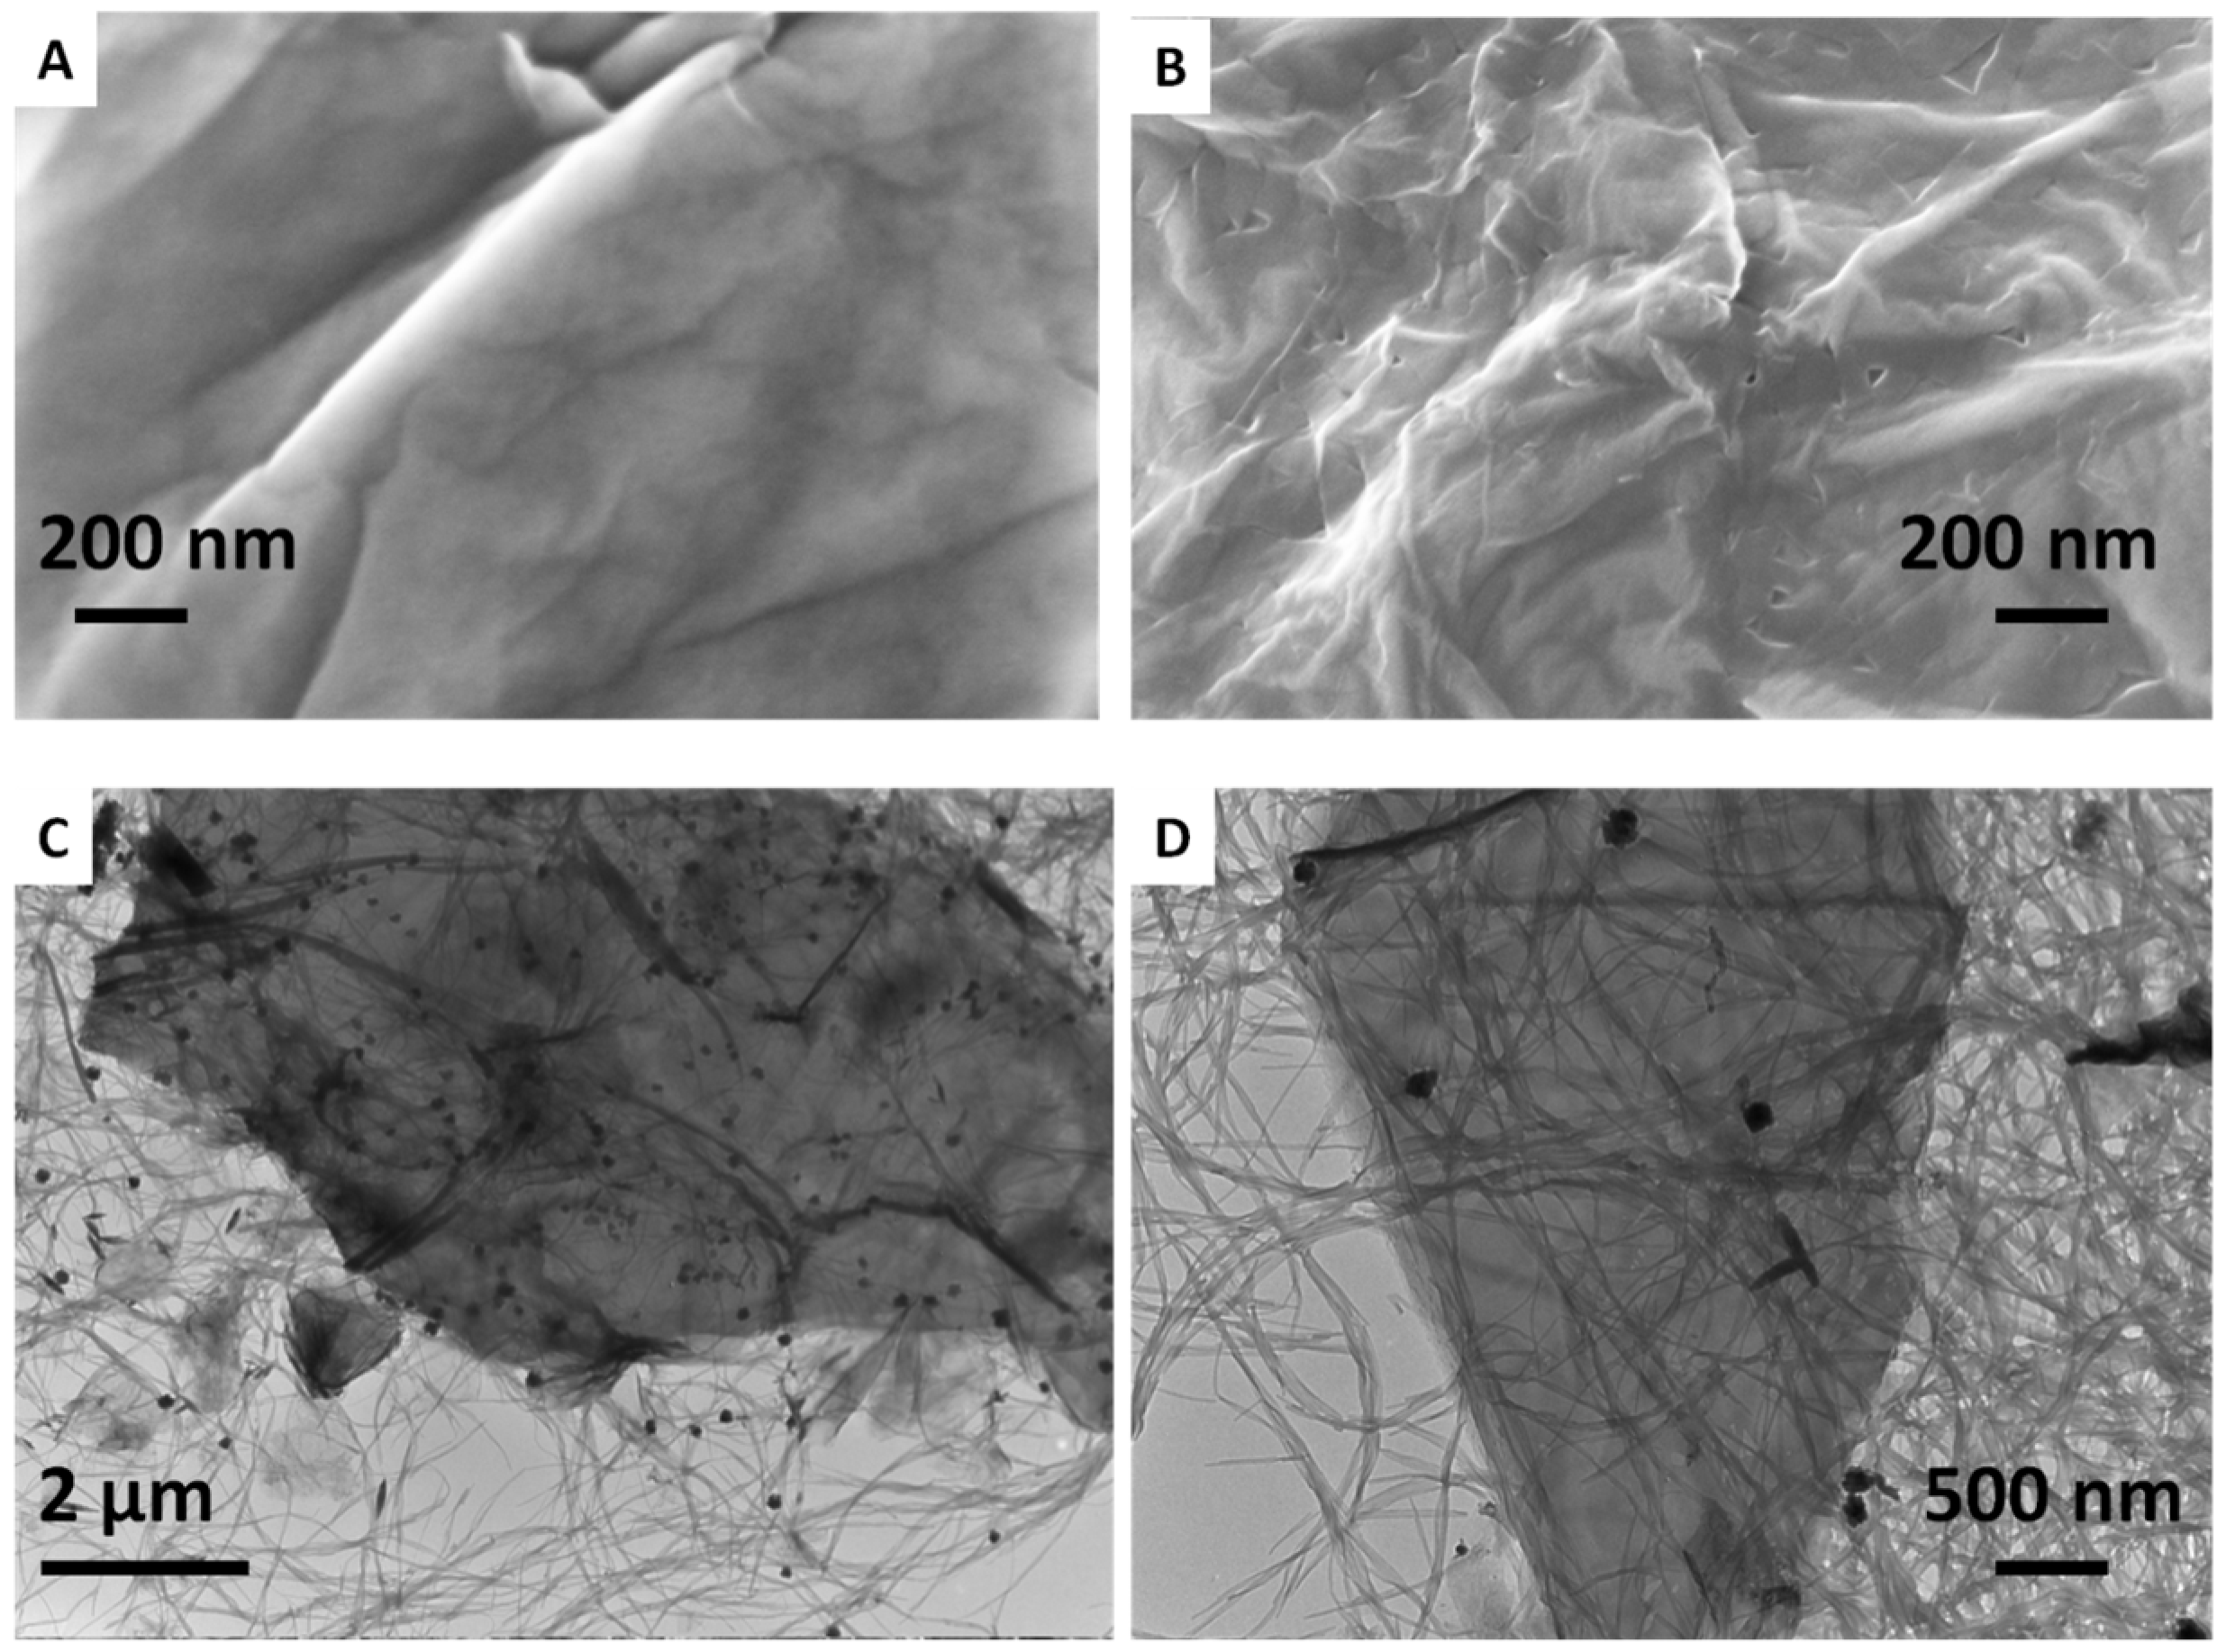
3.2.3. SEM and TEM Characterization

Figure 3 shows scanning electron microscopy and transmission electron microscopy images obtained from a dispersion of materials in an alcoholic solution. The PcH2tBu appeared as a small tiny long wire-like structure on the surface of the graphene and this is more visible in the TEM images. Such a wire-like formation is a result of the solvent preparation. Of course, the use of a higher magnification would help us to determine more about the structure, but the resolution of our apparatus is limits further investigations.
Both SEM and TEM images of both the RGO (Figure 3A) and RGO/PcH2tBu (Figure 3B–D) showed the folding of the graphene layer, forming ripples. Such a typical organization is attributed to the folding tendency observed in graphene sheets [59,60,61]. The origins of such a folding are diverse, since they can be attributed to stabilization through Van Der Waals interactions [60] or rapid solvent evaporation [62] and seem to be more likely to occur in larger sheets [60]. The fact that folding also occurs after functionalization confirms the occurrence of a natural phenomenon, since the functionalization occurring at the surface cannot prevent this folding organization from happening. However, a reorganization of folding following solvent evaporation can be also envisaged.

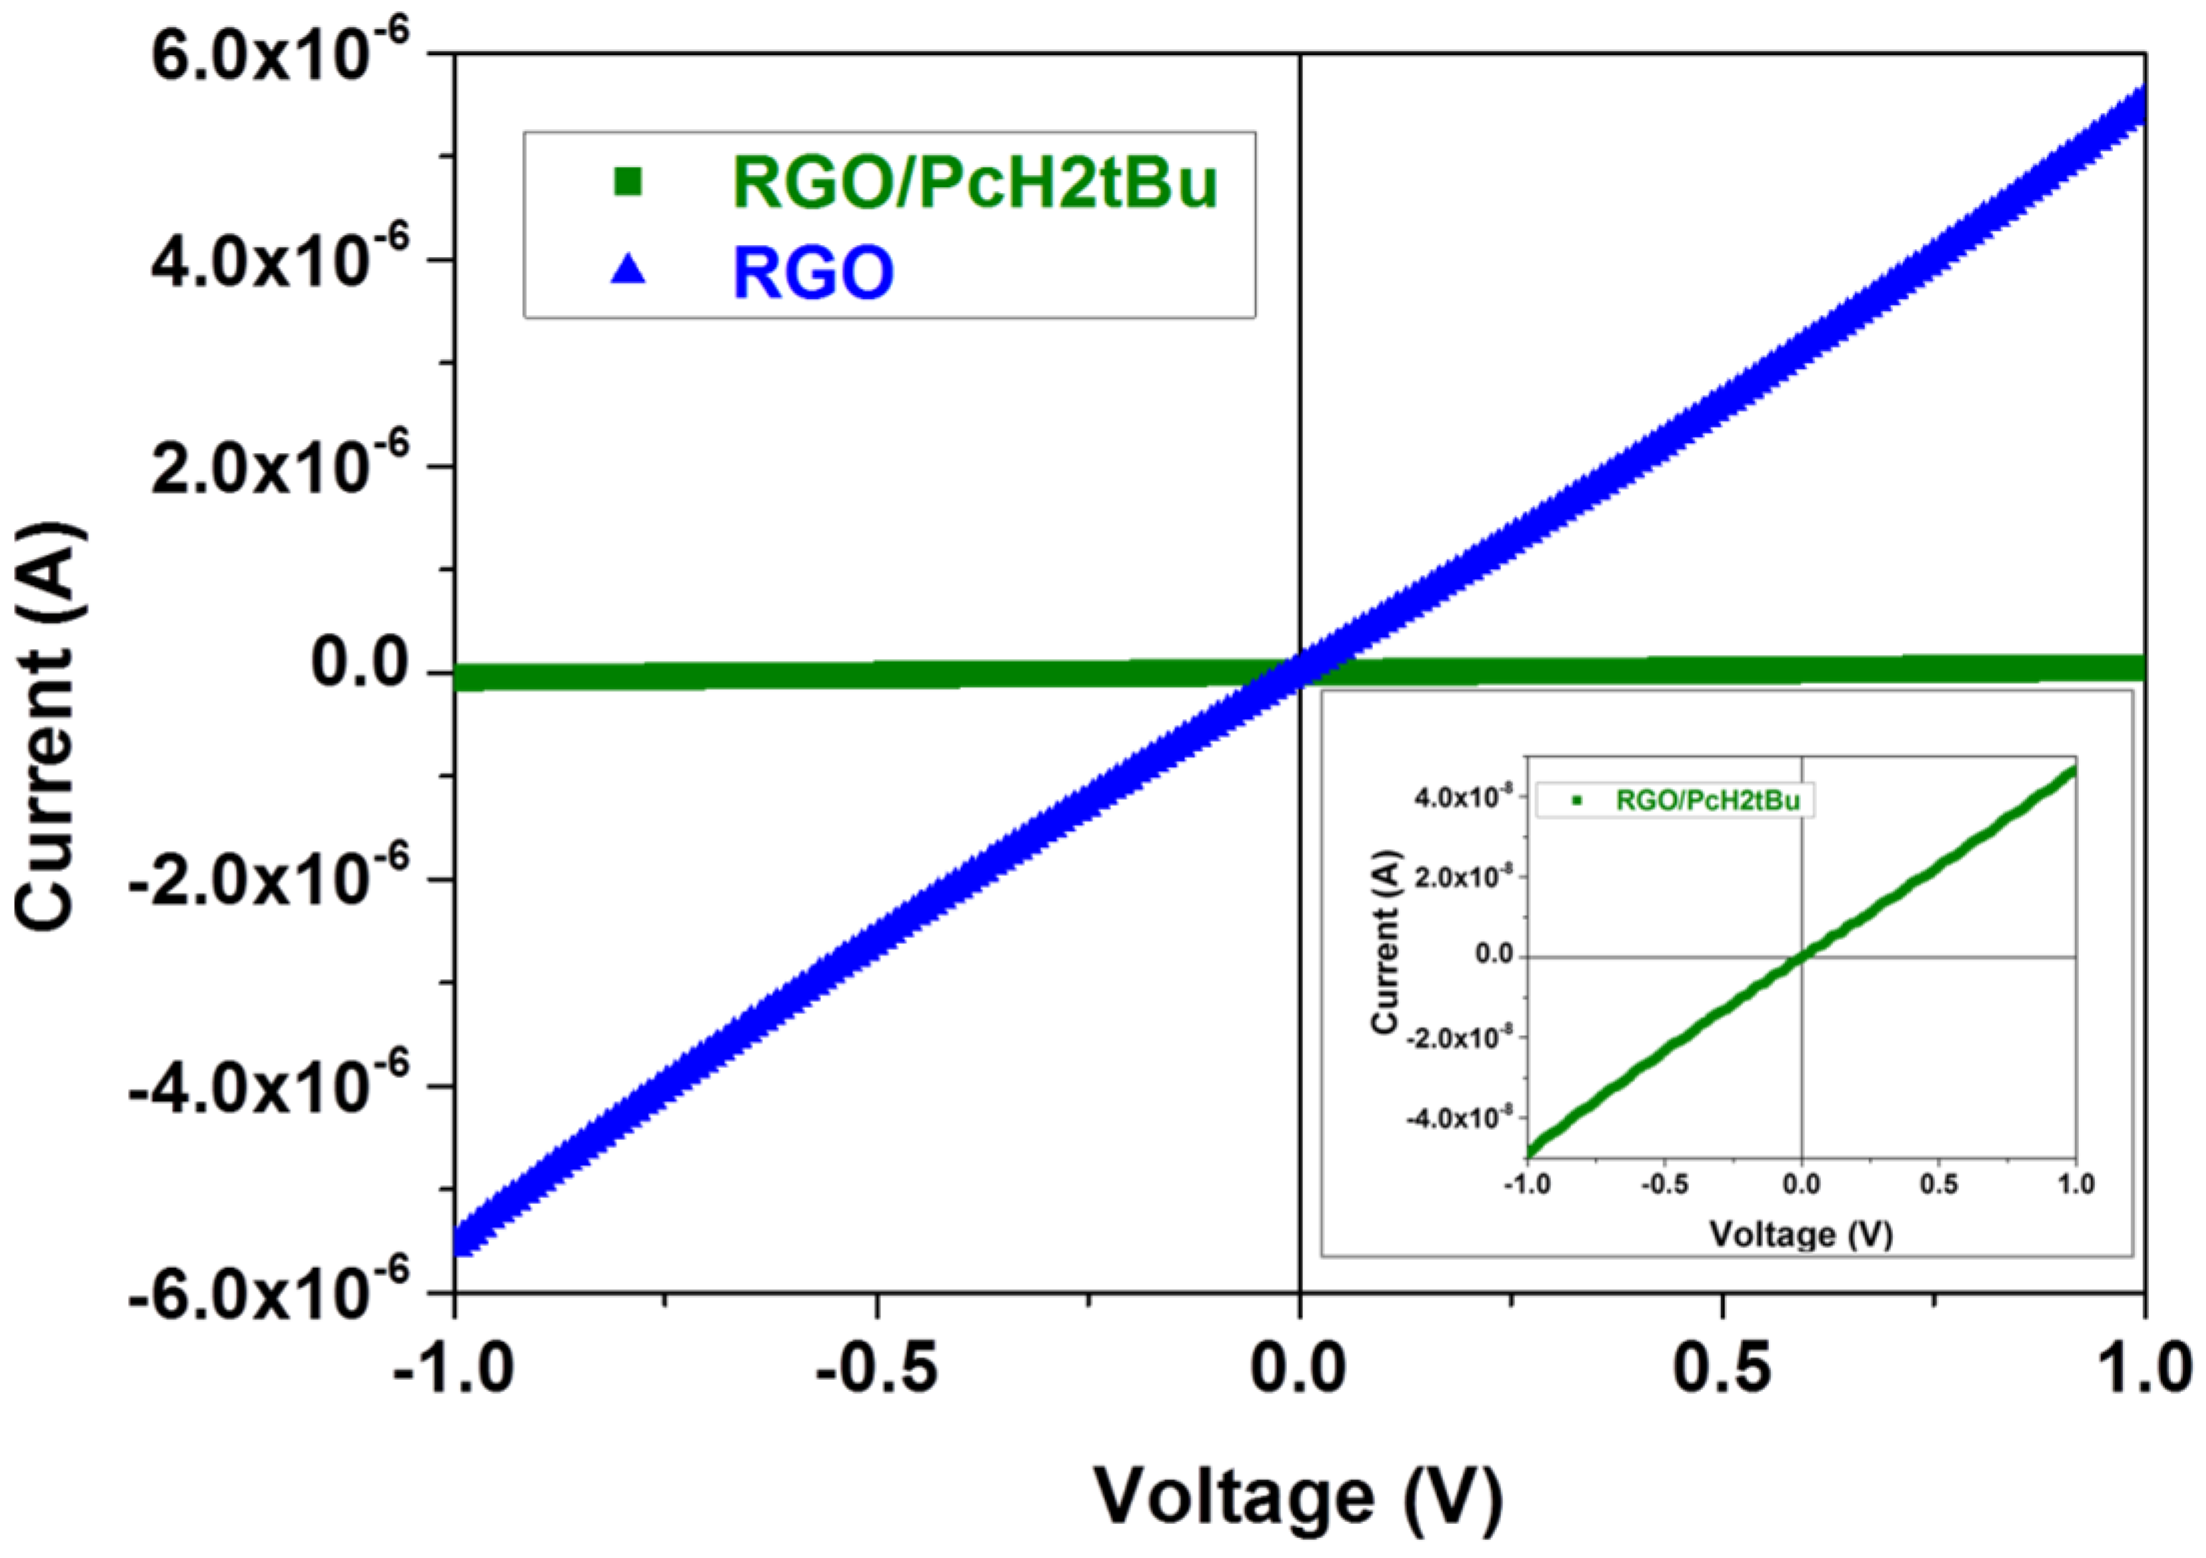
3.2.4. Electrical Characterization

For their use as resistive sensors, sensing devices must be electrically characterized. This was achieved using current–voltage measurements; the curves shown in Figure 4 present the results. The electrical characterization shows also the perfect ohmic character of the RGO/PcH2tBu and RGO. The RGO/PcH2tBu presents a more resistive character compared to the RGO, as presented in the inset.
Such behavior has been observed previously when higher-resistance materials such as phthalocyanine are combined with a conductive material such as RGO. In fact, incorporating phthalocyanine molecules into the RGO matrix creates less conducting paths through these insulating phthalocyanine and results in a lower conductivity.

3.3. Sensor Responses to BTX Exposure

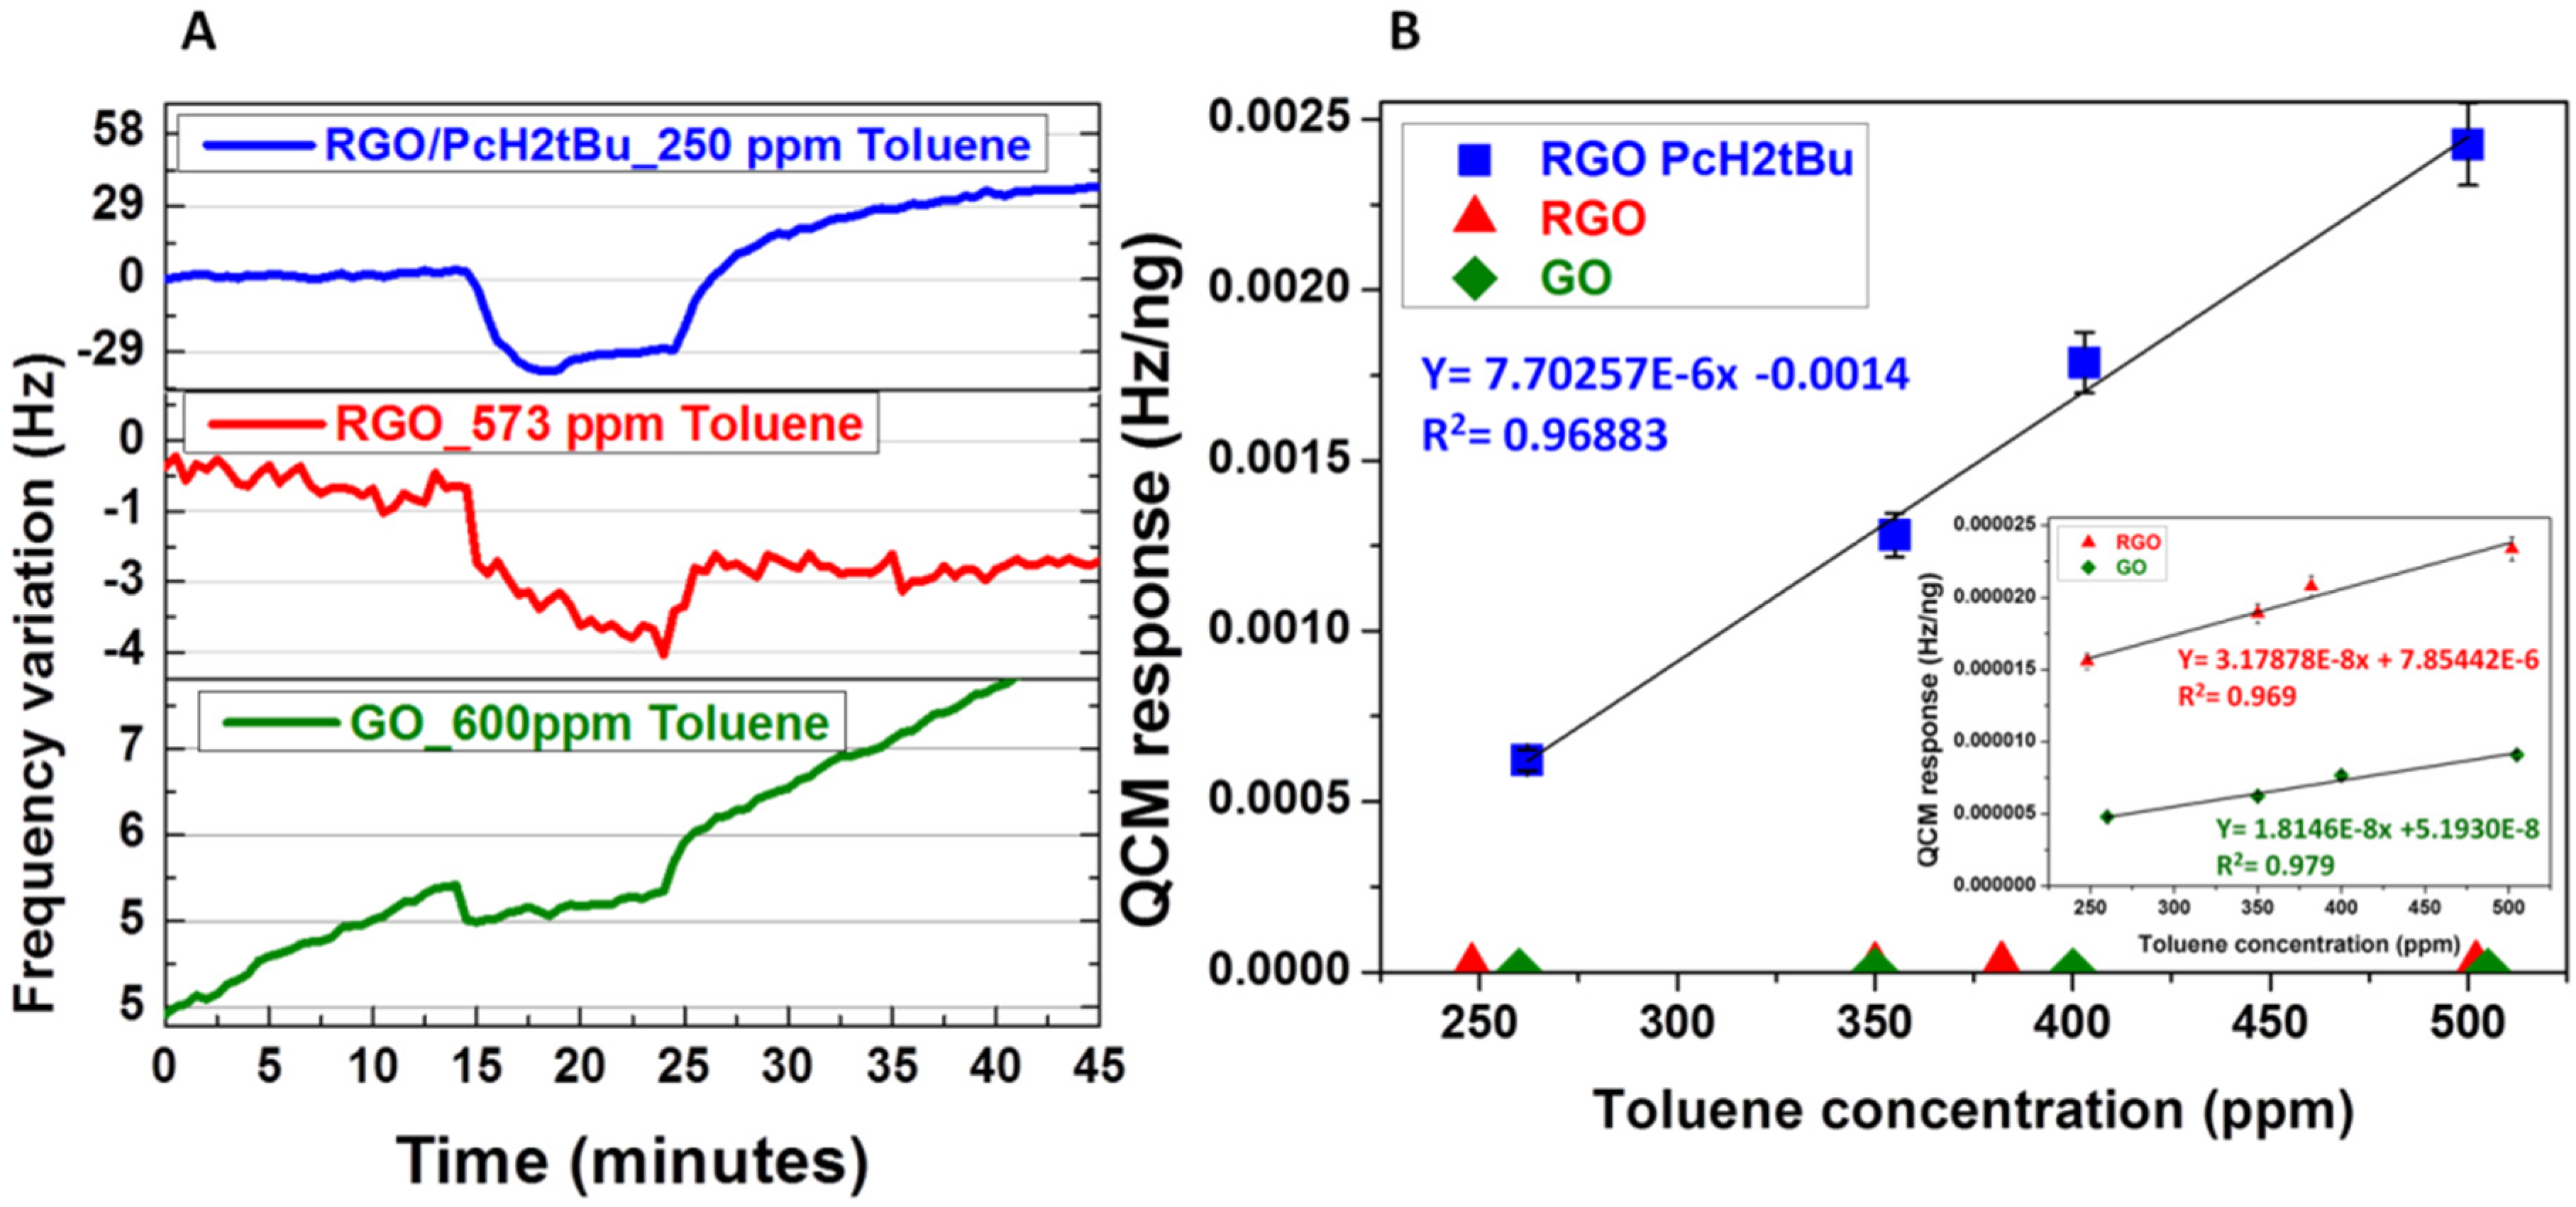
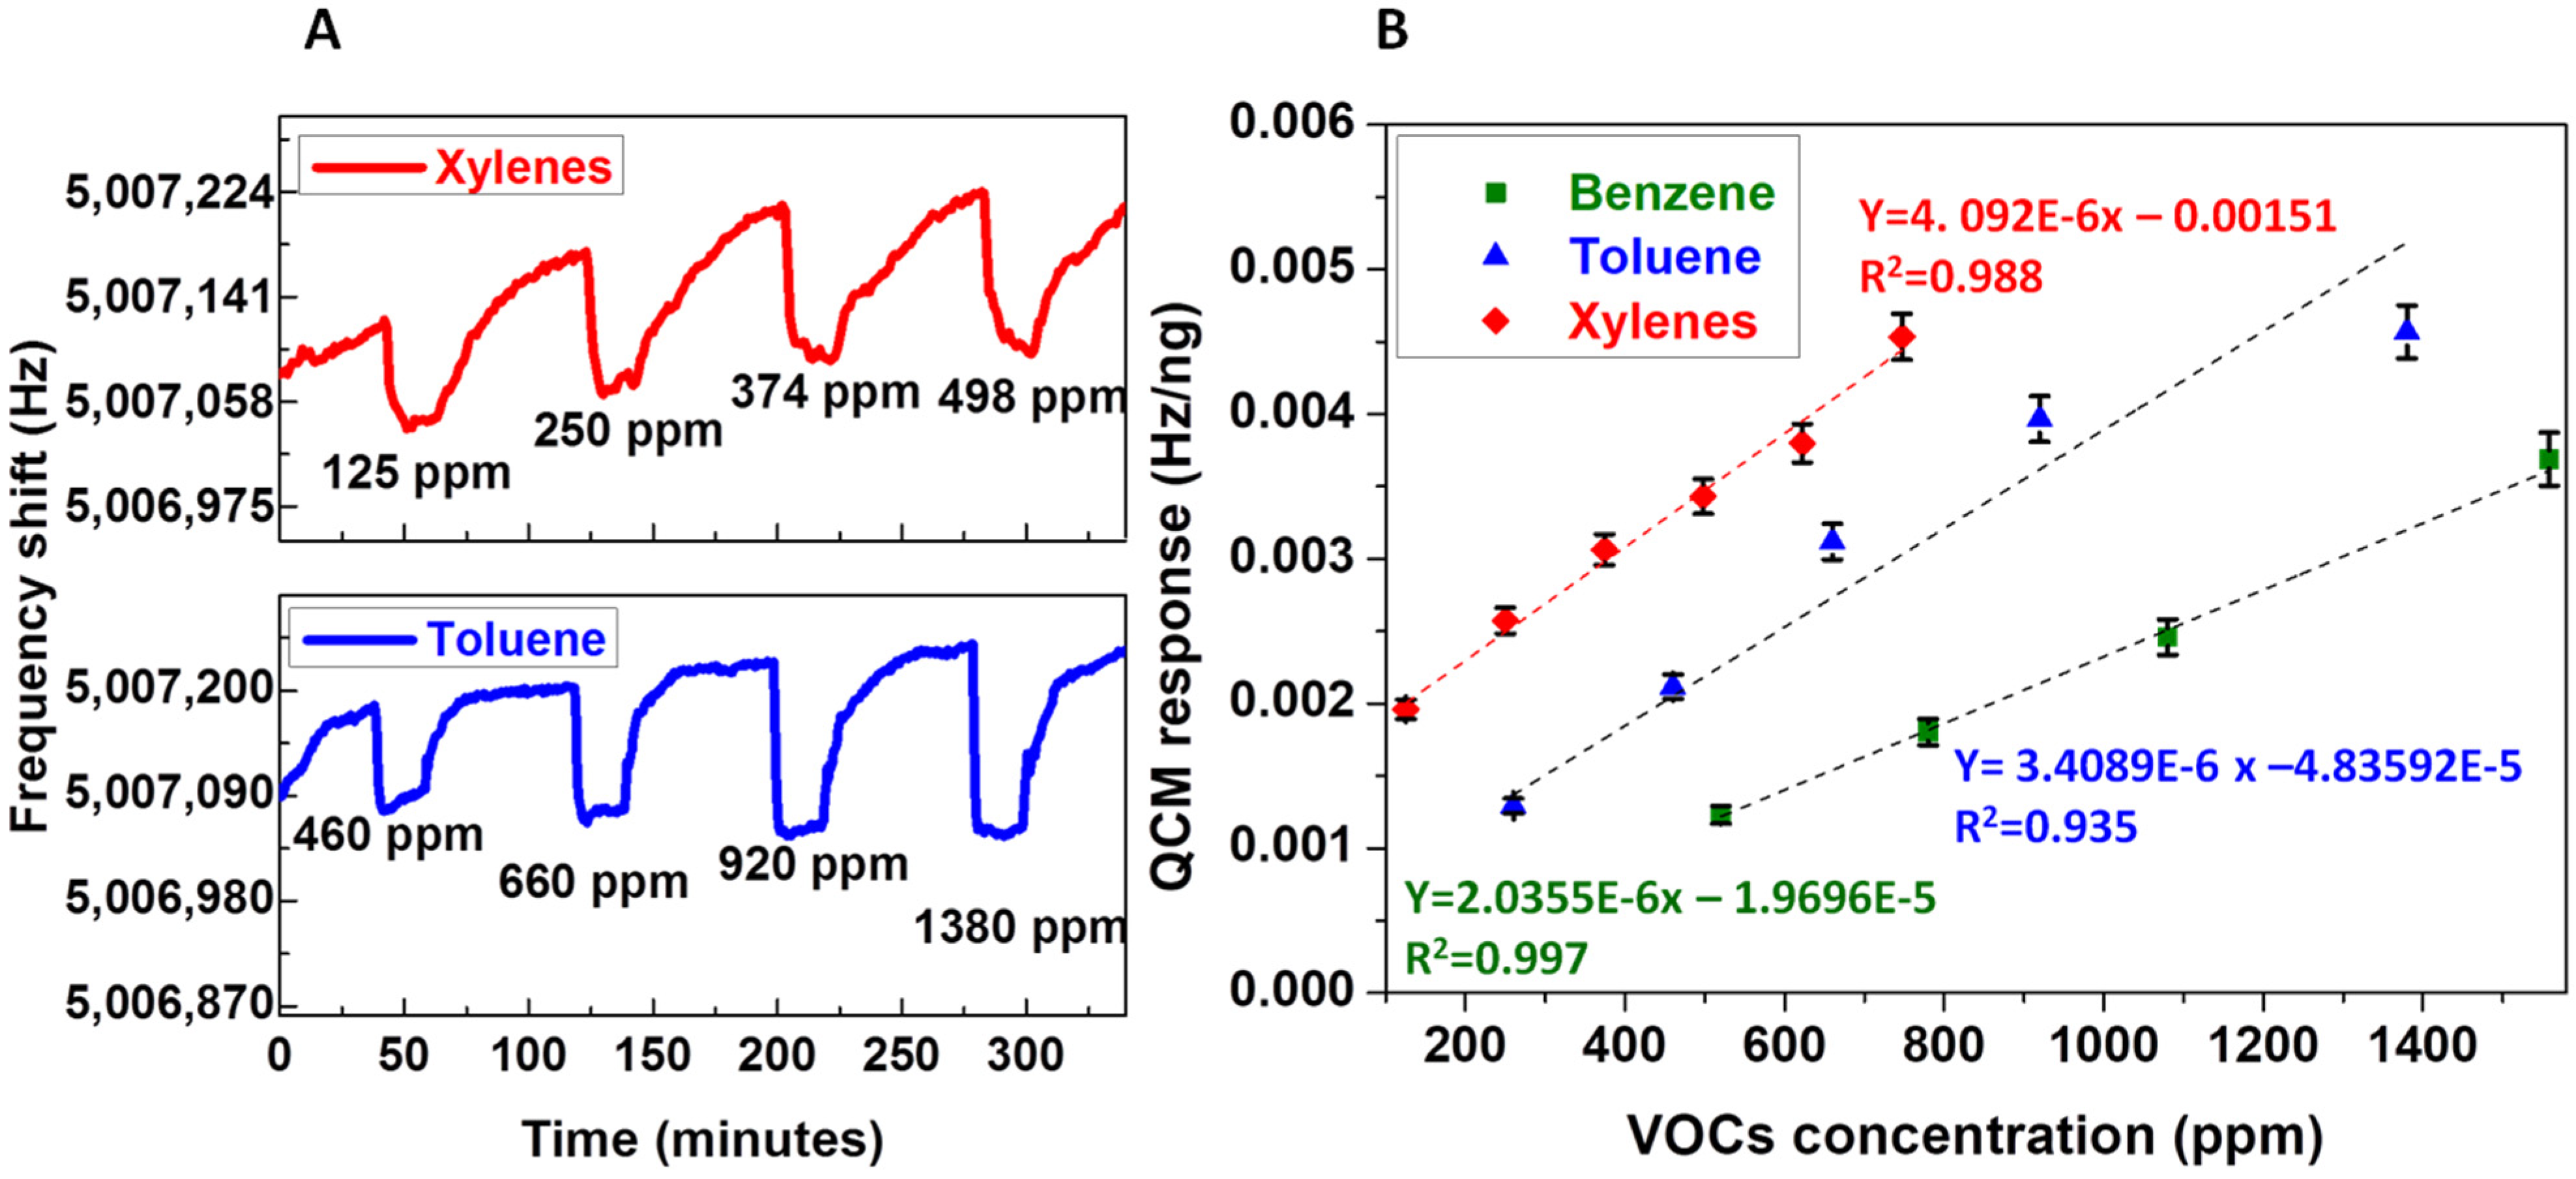
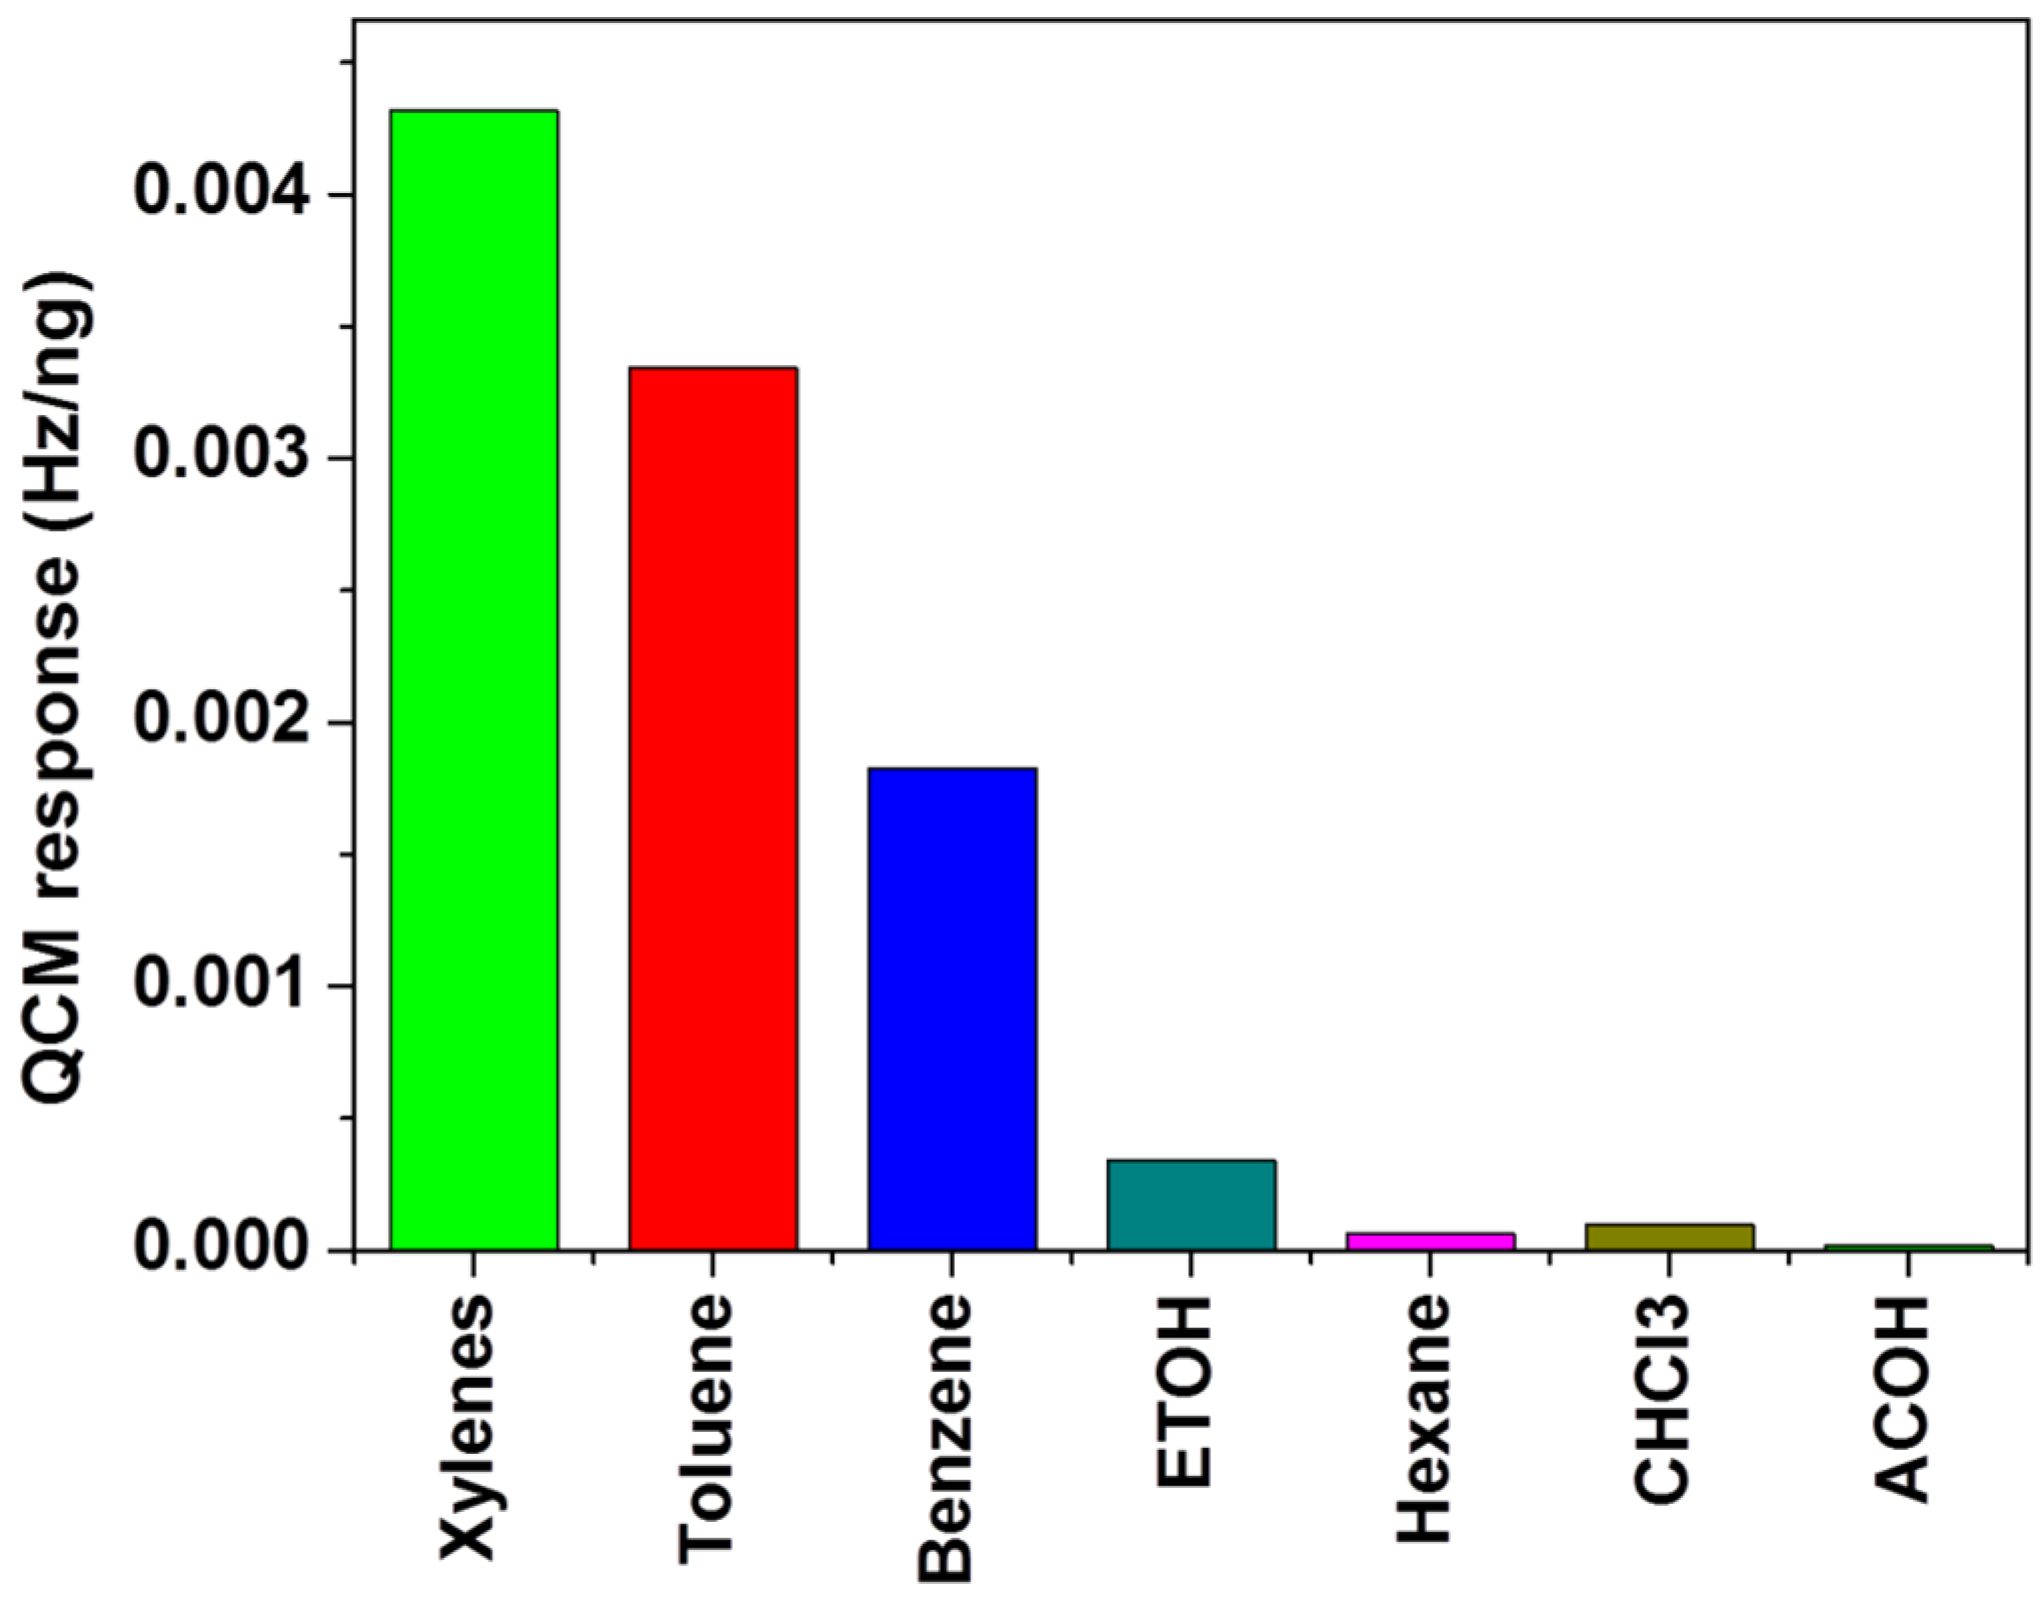
3.3.1. QCM Sensor Response

Figure 5 represents the preliminary exposure sequences where all prepared materials (GO, RGO, and RGO/PcH2tBu) are exposed to toluene vapor in the same conditions. As predicted by the Sauerbrey equation given above, upon exposure to gases the frequency shifts to lower values due to the adsorption of molecules on the sensing layer. As a consequence, the frequency decreases, as observed in Figure 5A. The results showed that the RGO/PcH2tBu is more sensitive than the GO and RGO alone. The lower response of these two materials is visible in the curves in Figure 5B, since the responses of these sensors are so weak that they can be considered as completely absent. Zooming in the GO and RGO given in the inset allowed us to take into account the reality of the lack of a response. The response shown in the range 250–500 ppm is represented in Figure 5B, and this representation enabled us to realize the size of the RGO/PcH2tBu response compared to that of GO and RGO. From the figures, one can see that even the response of the RGO was five times higher than that of GO, while the RGO/PcH2tBu presented a response to toluene four times higher than that of RGO.
These results show that the functionalization of RGO, as confirmed in the characterization details above, by phthalocyanine moieties is efficient for targeting the detection of BTX. Taking into account the fact that graphene oxide bears oxygenated groups, we can say that these functional groups are not the only surface groups inducing interactions with toluene. The same conclusion can be drawn regarding the RGO response, since after reduction some oxygenated groups still remain on the surface of the RGO. However, in the case of RGO, in contrast to GO the π-network is partially restored. The slightly better response of RGO compared to that of GO can be then attributed to the partial restoration of the π-network. By incorporating the functional moieties (PcH2tBu) into the RGO/PcH2tBu, the PcH2tBu itself brings specifically an advantage related to its highly delocalized conjugated π-system to promote the interaction with toluene. This can explain the better response given by the RGO/PcH2tBu. The same tendency can also be observed under exposure to xylene and benzene, meaning that the RGO/PcH2tBu is the most sensitive material and that the functionalization fulfills this role. In the following part of the article, the focus will be on the RGO/PcH2tBu and its reactivity to BTX exposure.
In Figure 6, the RGO/PcH2tBu material is exposed to toluene and xylene at different concentrations. Exposure to benzene starts to show responses only in higher concentration ranges (see Figure S3 in the Supplementary Materials file), and these are therefore not included in this figure. Figure 6 shows the response of the sensors under exposition to BTX in the 100–1500 ppm range.
The fact that the benzene does not present a response in the lower concentrations range is a manifest of a weaker interaction between the vapor and the materials. The xylenes response was three times higher than the toluene response, and this tendency resembles that already observed in the case of macrocycle-functionalized CNTs [29,63]. Such a sensitivity towards xylenes can be attributed to an additional CH–π interaction provided by the presence of methyl groups (of xylene) that reinforce the π–π interaction between the π-network of the RGO, the PcH2tBu, and xylene [29,64]. As presented previously, the RGO matrix itself seems to be less sensitive than RGO/PcH2tBu, which means that upon functionalization the incorporation of PcH2tBu groups in the RGO/PcH2tBu matrix is beneficial for adsorption and creates more interactions sites for gas adsorption.
For all the vapors, the responses followed a linear isotherm in the 100–1000 ppm zone, therefore delimiting the region where the sensors show a linear response. However, once the higher concentration region was incorporated into the response, the situation was different and a plateau appeared upon exposure to benzene and toluene in the higher concentration range (Figure S5, Supplementary Materials). In the case of xylene, the maximum concentrations with our setup were below 1500 ppm; therefore, xylene was not included in the discussion. The RGO/PcH2tBu upon exposure to benzene and toluene in the higher concentration range presented a plateau. This observed plateau can be mainly attributed to a saturation regime occurring in the higher concentration range as a result of the lower available interaction sites. In terms of size, benzene was smaller compared to toluene, but in terms of saturation (plateau) benzene was equally impacted to toluene. This observation shows that the occurrence of the plateau was not a diffusion-dependent phenomenon. We suggest the fewer available interaction sites at higher concentrations of VOCs to be responsible for the saturation phenomenon.
Table 1 gathers the performances of the sensors for both the QCM and restive transduction mode. The response time, recovery time, limit of detection (LOD), and sensitivity are given in Table 1. The LOD was estimated using the 3S method [28] based on the slope of the calibration curve and the standard deviation (SD) of the blank, which is given in the following formula:
LOD = 3 SD/slope
The LOD calculated from this formula gave values (contained in Table 1 and Table 2) for all three gases as well as corresponding concentration ranges. In terms of kinetics, the response time was shorter than the recovery time for all gases. An overall lower response time was recorded for benzene. This lower response time for benzene can be attributed to the weaker interaction, since no additional interactions (CH–π or alkyl–alkyl interactions) are needed to settle the adsorption of benzene onto the matrix. As already observed, the fast desorption kinetics recorded for benzene presented the weakest sensitivity as compared to toluene and xylenes [29].
LOD values of 78, 30, and 7 ppm were estimated for benzene, toluene, and xylenes, respectively (Table 1). The LOD values confirm the better sensitivity of the RGO/PcH2tBu when exposed to xylene. Such a tendency shows that xylene is more sensitive than toluene and benzene, and this tendency is often observed in QCM-based sensors coated with carbon material [32] or polymer materials [65].
Figure 7 presents cross-sensitivity studies carried out against other interfering gases. The results show that the RGO/PcH2tBu is more sensitive to benzene, toluene, and xylene exposure (750 ppm) than exposure to other VOCs. It is also worth noting that the other VOCs did not present exploitable responses under 500 ppm. Ethanol (EtOH) seems to be the most sensitive among the interfering gases. This can be also attributed to the remaining oxygenated groups being capable of inducing hydrogen bonds with the -OH of the ethanol molecules. It should also be noted that exposing the materials to chloroform leads to a partial deterioration of the sensing layer, probably due to the solubility of PcH2tBu on chloroform. The lower response at such a high concentration of VOCs (interfering) allows us to state that the sensors are partially selective for xylene and toluene. This means that if the sensing applications are extended to toluene or xylene at a concentration lower than 500 ppm, these sensing layers will be well adapted.

3.3.2. Resistive Sensors Response

As announced at the beginning of the article, in this study the sensing layers on both resistive and QCM transducers were developed and the resistive responses will now be presented. Unfortunately, the RGO and GO did not present responses when exposed to BTX; therefore, they could not be included in this section. It is worth noting that the RGO/PcH2tBu was more resistive than the RGO (Figure 4). Such behavior can be explained by the insulating nature of the PcH2tBu, as many phthalocyanines presenting too high a resistance value [66]. The resistance responses of the RGO/PcH2tBu exposed to toluene and xylene are presented in Figure 8. As previously, the benzene response was not included for the same reasons (see Supplementary Materials; Figure S4). Here, the sensors experience a very significant baseline drift which seems to be dependent on the RGO material, as already observed for carbon material-based sensors [67,68]. The origin of this drift is difficult to explain, but both intrinsic and extrinsic factors can affect it [68]. In this figure, it is depicted that upon gas exposure the resistance increases. This behavior suggests the p-type semiconducting behavior of the sensing layer caused by a reducing gas (BTX).
For a better comparison, the resistance variation observed in Figure 8 was then represented in the form of ΔR/R0 (%) for RGO/PcH2tBu exposed to benzene, toluene, and xylenes in Figure 8B. The obtained calibration curves show that the sensing layer is again more sensitive to xylenes than toluene. However, in the case of a resistive transducer, the sensing mechanism is different from that of QCM one. In fact, in this resistive transduction mode both adsorption and efficient charge transfer are necessary to observe a readable signal. In terms of sensitivity, the results follow that of the QCM response, since the xylene presents a higher response compared to toluene. Such a tendency is not surprising, since xylene, because of its peripheral groups, has more interaction possibilities and therefore can obtain to a higher sensitivity. This result is confirmed by the values given in Table 2, where the sensitivity values show that xylene 0.0018%/ppm is 3 times more sensitive than toluene (0.00068 %/ppm) and 10 times more sensitive than benzene (0.00018 %/ppm).

4. Discussion

Upon functionalization, the two entities (matrix and the functionalizing unit) must be correctly associated to ensure their adequate functionality. In the present case, the optical and spectroscopic characterization allowed us to gain an insight into the functionalization. In fact, through the analysis of the sensing materials by these methods, the combination of RGO and PcH2tbu was found to be beneficial. In the UV–Vis characterization method, the broadening and shift of both bands are characteristic of a strong interaction between RGO and the PcH2tBu [34,69]. From the microscope image, it seems that the non-covalent functionalization did not significantly change the morphology [35], which means that in the present case, the actual resolution does not allow us to identify elements that are evidence of functionalization. The electrical characterization allowed us to state that even combined with phthalocyanine molecules, the sensing material presents a good ohmic behavior, indicating a good association regarding the building of resistive sensors. It is surprising the GO does not show a higher response. Oxygenated groups are considered as anchoring groups on a surface, meaning that any gaseous molecules approaching the surface should find favorable conditions for becoming attached to the surface. However, remembering the aromatic structure of the BTX (p-system), one can suppose that BTX will be involved in π-interaction and that not only the oxygenated groups are of great concern. When considering the materials analyzed, the following statements can be made: Starting from GO, which seems to be a less sensitive material, one can question whether the oxygenated groups are favorable for enhancing the interaction with BTX. Tested on BTX, it was found that GO was not sensitive at all. Considering that the main difference between GO and RGO is the high number of oxygenated groups, the response seems clear: BTX adsorption seems not to be highly dependent on the presence of such surface groups. Once the reduction happens, there is an improvement compared to graphene oxide, since the RGO shows a better interaction with BTX. Taking into account that, in RGO, the π-network is restored and while oxygenated groups are simultaneously reduced, we can state that the combination of these two effects favors the adsorption of BTX. Considering that in RGO the π-network is restored and that the oxygenated groups are simultaneously reduced, we can state that the combination of these two effects favors the adsorption of BTX. When the functionalization further continues by combining RGO and PcH2tBu, a clear advantage concerning the interaction with BTX can be highlighted. This is the impact of functionalization, which enables new interaction sites to be created on the sensing matrix. This study is unique in the sense that it is the only one where RGO functionalized by PcH2tBu is used for BTX detection with a double transduction mode. For this reason, it is difficult to find real and reliable examples for comparison in the literature.

5. Conclusions

This study shows, for the first time, a combination of graphene-based materials associated with phthalocyanine for BTX detection using both QCM and resistive transducers simultaneously. The functionalization of RGO by PcH2tBu has been achieved using a solution-based specific technique, yielding a hybrid material (RGO/PcH2tBu) that has been exposed to the targeted gases. Both GO and RGO show little response to toluene and xylene compared to RGO/PcH2tBu. The hybrid material showed a relatively weaker response to benzene as a result of a weaker interaction and demonstrated that π–π interactions are not the only force governing the interaction with BTX. Analyzing the responses allows us to state that functional groups are important for creating interaction sites, but for CNTs the π–π interactions seem to collectively work in synergy with the π–alkyl interaction to ensure a strong interaction. The resistive responses confirm the same tendency and show that charge transfer occurs between BTX and RGO/PcH2tBu. This study will pave the way for the use of other generations of phthalocyanines molecules associated with graphene materials for BTX detection.

Supplementary Materials

The following are available online at https://0-www-mdpi-com.brum.beds.ac.uk/article/10.3390/chemosensors9120346/s1, Figure S1: Experimental test bench used for the BTX sensing experiment. Figure S2: Raman spectra of GO, RGO, PcH2tBu and RGO/PcH2tBu. Figure S3: QCM sensor response RGO/PcH2tBu exposed to Benzene at a higher concentration. Figure S4: Resistive sensor response RGO/PcH2tBu exposed to Benzene at a higher concentration. Figure S5: calibration curves corresponding to QCM sensor response of RGO/PcH2tBu exposed to benzene, toluene and xylenes in the higher concentrations regimes.

Author Contributions

Conceptualization and Writing, A.L.N. and A.P.; Methodology and Experiments, E.R., T.G. and C.M.; formal analysis, J.B., C.V. and A.P.; Investigation, E.R., T.G. and C.M.; writing—original draft preparation, A.L.N.; writing—review and editing, J.B, C.V., C.M. and A.P.; Supervision, A.L.N. and J.B. All authors have read and agreed to the published version of the manuscript.

Funding

This work was sponsored by a public grant overseen by the French National Research Agency as part of the “Investissements d’Avenir” through the IMobS3 Laboratory of Excellence (ANR-10-LABX-0016) and the IDEX-ISITE initiative CAP 20–25 (ANR-16-IDEX-0001).

Institutional Review Board Statement

Not applicable.

Informed Consent Statement

Not applicable.

Data Availability Statement

Not applicable.

Acknowledgments

We would like to thank Christelle Blavignac, Claire Szczepaniak, Lorraine Novais Gameiro, Centre Imagerie Cellulaire Sante (CICS)—Université Clermont Auvergne—for their technical support for TEM experiments. The authors thank 2MATECH for the SEM sample analysis.

Conflicts of Interest

The authors declare no conflict of interest.

References

  1. Castro Neto, A.H.; Guinea, F.; Peres, N.M.R.; Novoselov, K.S.; Geim, A.K. The electronic properties of graphene. Rev. Mod. Phys. 2009, 81, 109–162. [Google Scholar] [CrossRef] [Green Version]
  2. Sahu, D.; Sutar, H.; Senapati, P.; Murmu, R.; Roy, D. Graphene, graphene-Derivatives and composites: Fundamentals, synth_sis approaches to applications. J. Compos. Sci. 2021, 5, 181. [Google Scholar] [CrossRef]
  3. Geim, A.K.; Novoselov, K.S. The rise of graphene. Nat. Mater. 2007, 6, 183–191. [Google Scholar] [CrossRef] [PubMed]
  4. Wang, T.; Huang, D.; Yang, Z.; Xu, S.; He, G.; Li, X.; Hu, N.; Yin, G.; He, D.; Zhang, L. A review on graphene-based gas/vapor sensors with unique properties and potential applications. Nano. Micro. Lett. 2016, 8, 95–119. [Google Scholar] [CrossRef] [Green Version]
  5. Cao, G.; Liu, X.; Liu, W.; Li, Q.; Li, X.; Wang, X. Chemical environment dominated fermi level pinning of a graphene gas sensor. Carbon 2017, 124, 57–63. [Google Scholar] [CrossRef]
  6. Phan, D.-T.; Chung, G.-S. P–N junction characteristics of graphene oxide and reduced graphene oxide on n-Type si (111). J. Phys. Chem. Solids 2013, 74, 1509–1514. [Google Scholar] [CrossRef]
  7. Dreyer, D.R.; Park, S.; Bielawski, C.W.; Ruoff, R.S. The chemistry of graphene oxide. Chem. Soc. Rev. 2010, 39, 228–240. [Google Scholar] [CrossRef]
  8. Xu, Y.; Sheng, K.; Li, C.; Shi, G. Highly conductive chemically converted graphene prepared from mildly oxidized graphene oxide. J. Mater. Chem. 2011, 21, 7376–7380. [Google Scholar] [CrossRef]
  9. Zhang, Z.; Chen, H.; Xing, C.; Guo, M.; Xu, F.; Wang, X.; Gruber, H.J.; Zhang, B.; Tang, J. Sodium citrate: A universal reducing agent for reduction/decoration of graphene oxide with au nanoparticles. Nano Res. 2011, 4, 599–611. [Google Scholar] [CrossRef]
  10. Aunkor, M.T.H.; Mahbubul, I.M.; Saidur, R.; Metselaar, H.S.C. The green reduction of graphene oxide. RSC Adv. 2016, 6, 27807–27828. [Google Scholar] [CrossRef]
  11. Zhou, Y.; Lin, X.; Huang, Y.; Guo, Y.; Gao, C.; Xie, G.; Jiang, Y. Impact of further thermal reduction on few-Layer reduced graphene oxide film and its n-P transition for gas sensing. Sens. Actuators B Chem. 2016, 235, 241–250. [Google Scholar] [CrossRef]
  12. Pei, S.; Cheng, H.-M. The reduction of graphene oxide. Carbon 2012, 50, 3210–3228. [Google Scholar] [CrossRef]
  13. Chen, C.-M.; Huang, J.-Q.; Zhang, Q.; Gong, W.-Z.; Yang, Q.-H.; Wang, M.-Z.; Yang, Y.-G. Annealing a graphene oxide film to produce a free standing high conductive graphene film. Carbon 2012, 50, 659–667. [Google Scholar] [CrossRef]
  14. Tarcan, R.; Todor-Boer, O.; Petrovai, I.; Leordean, C.; Astilean, S.; Botiz, I. Reduced graphene oxide today. J. Mater. Chem. C 2020, 8, 1198–1224. [Google Scholar] [CrossRef]
  15. Bagri, A.; Mattevi, C.; Acik, M.; Chabal, Y.J.; Chhowalla, M.; Shenoy, V.B. Structural evolution during the reduction of chemi_cally derived graphene oxide. Nat. Chem. 2010, 2, 581–587. [Google Scholar] [CrossRef]
  16. Casanova-Cháfer, J.; García-Aboal, R.; Atienzar, P.; Llobet, E. Gas sensing properties of perovskite decorated graphene at room temperature. Sensors 2019, 19, 4563. [Google Scholar] [CrossRef] [Green Version]
  17. Xu, C.; Wang, X.; Wang, J.; Hu, H.; Wan, L. Synthesis and photoelectrical properties of β-cyclodextrin functionalized graphene materials with high bio-recognition capability. Chem. Phys. Lett. 2010, 498, 162–167. [Google Scholar] [CrossRef]
  18. Lu, J.; Do, I.; Drzal, L.T.; Worden, R.M.; Lee, I. Nanometal-Decorated exfoliated graphite nanoplatelet based glucose biosensors with high sensitivity and fast response. ACS Nano 2008, 2, 1825–1832. [Google Scholar] [CrossRef]
  19. Basu, S.; Bhattacharyya, P. Recent developments on graphene and graphene oxide based solid state gas sensors. Sens. Actuators B Chem. 2012, 173, 1–21. [Google Scholar] [CrossRef]
  20. Tian, W.; Liu, X.; Yu, W. Research progress of gas sensor based on graphene and its derivatives: A review. Appl. Sci. 2018, 8, 1118. [Google Scholar] [CrossRef] [Green Version]
  21. de Lima, B.S.; Komorizono, A.A.; Silva, W.A.S.; Ndiaye, A.L.; Brunet, J.; Bernardi, M.I.B.; Mastelaro, V.R. Ozone detection in the ppt-level with rgo-Zno based sensor. Sens. Actuators B Chem. 2021, 338, 129779. [Google Scholar] [CrossRef]
  22. Song, Z.; Wei, Z.; Wang, B.; Luo, Z.; Xu, S.; Zhang, W.; Yu, H.; Li, M.; Huang, Z.; Zang, J.; et al. Sensitive room-Temperature h2s gas sensors employing sno2 quantum wire/reduced graphene oxide nanocomposites. Chem. Mater. 2016, 28, 1205–1212. [Google Scholar] [CrossRef]
  23. Geng, J.; Jung, H.-T. Porphyrin functionalized graphene sheets in aqueous suspensions: From the preparation of graphene sheets to highly conductive graphene films. J. Phys. Chem. C 2010, 114, 8227–8234. [Google Scholar] [CrossRef]
  24. Wang, S.; Li, Y.; Fan, X.; Zhang, F.; Zhang, G. B-Cyclodextrin functionalized graphene oxide: An efficient and recyclable ad_sorbent for the removal of dye pollutants. Front. Chem. Sci. Eng. 2015, 9, 77–83. [Google Scholar] [CrossRef]
  25. Mishra, R.K.; Murali, G.; Kim, T.-H.; Kim, J.H.; Lim, Y.J.; Kim, B.-S.; Sahay, P.P.; Lee, S.H. Nanocube in2o3@rgo heterostructure based gas sensor for acetone and formaldehyde detection. RSC Adv. 2017, 7, 38714–38724. [Google Scholar] [CrossRef] [Green Version]
  26. Huang, X.; Hu, N.; Gao, R.; Yu, Y.; Wang, Y.; Yang, Z.; Siu-Wai Kong, E.; Wei, H.; Zhang, Y. Reduced graphene ox_ide–Polyaniline hybrid: Preparation, characterization and its applications for ammonia gas sensing. J. Mater. Chem. 2012, 22, 22488–22495. [Google Scholar] [CrossRef]
  27. Al-Mashat, L.; Shin, K.; Kalantar-Zadeh, K.; Plessis, J.D.; Han, S.H.; Kojima, R.W.; Kaner, R.B.; Li, D.; Gou, X.; Ippolito, S.J.; et al. Graphene/polyaniline nanocomposite for hydrogen sensing. J. Phys. Chem. C 2010, 114, 16168–16173. [Google Scholar] [CrossRef]
  28. Ndiaye, A.L.; Brunet, J.; Varenne, C.; Pauly, A. Functionalized cnts-Based gas sensors for btx-Type gases: How functional peripheral groups can affect the time response through surface reactivity. J. Phys. Chem. C 2018, 122, 21632–21643. [Google Scholar] [CrossRef]
  29. Pauly, A.; Brunet, J.; Varenne, C.; Ndiaye, A.L. Insight in the interaction mechanisms between functionalized cnts and btx vapors in gas sensors: Are the functional peripheral groups the key for selectivity? Sens. Actuators B Chem. 2019, 298, 126768. [Google Scholar] [CrossRef]
  30. Dezest, M.; Le Bechec, M.; Chavatte, L.; Desauziers, V.; Chaput, B.; Grolleau, J.-L.; Descargues, P.; Nizard, C.; Schnebert, S.; Lacombe, S.; et al. Oxidative damage and impairment of protein quality control systems in keratinocytes exposed to a volatile organic compounds cocktail. Sci. Rep. 2017, 7, 10707. [Google Scholar] [CrossRef]
  31. Wang, W.; Zhang, Y.; Wang, Y.-B. Noncovalent π⋅π interaction between graphene and aromatic molecule: Structure, energy, and nature. J. Chem. Phys. 2014, 140, 094302. [Google Scholar] [CrossRef]
  32. Bearzotti, A.; Macagnano, A.; Papa, P.; Venditti, I.; Zampetti, E. A study of a qcm sensor based on pentacene for the detection of btx vapors in air. Sens. Actuators B Chem. 2017, 240, 1160–1164. [Google Scholar] [CrossRef]
  33. Kumar, S.; Kaur, N.; Sharma, A.K.; Mahajan, A.; Bedi, R.K. Improved cl2 sensing characteristics of reduced graphene oxide when decorated with copper phthalocyanine nanoflowers. RSC Adv. 2017, 7, 25229–25236. [Google Scholar] [CrossRef] [Green Version]
  34. Kumar, S.; Sharma, A.K.; Sohal, M.K.; Sharma, D.P.; Debnath, A.K.; Aswal, D.K.; Mahajan, A. Room temperature highly sensi_tive chlorine sensor based on reduced graphene oxide anchored with substituted copper phthalocyanine. Sens. Actuators B Chem. 2021, 327, 128925. [Google Scholar] [CrossRef]
  35. Zhang, Y.-Q.; Fan, Y.-J.; Cheng, L.; Fan, L.-L.; Wang, Z.-Y.; Zhong, J.-P.; Wu, L.-N.; Shen, X.-C.; Shi, Z.-J. A novel glucose biosensor based on the immobilization of glucose oxidase on layer-By-Layer assembly film of copper phthalocyanine functionalized graphene. Electrochim. Acta 2013, 104, 178–184. [Google Scholar] [CrossRef]
  36. Zhu, P.; Li, S.; Zhao, C.; Zhang, Y.; Yu, J. 3d synergistical rgo/eu(tpyp)(pc) hybrid aerogel for high-Performance no2 gas sensor with enhanced immunity to humidity. J. Hazard. Mater. 2020, 384, 121426. [Google Scholar] [CrossRef] [PubMed]
  37. Li, X.; Wang, B.; Wang, X.; Zhou, X.; Chen, Z.; He, C.; Yu, Z.; Wu, Y. Enhanced nh3-Sensitivity of reduced graphene oxide modified by tetra-α-Iso-Pentyloxymetallophthalocyanine derivatives. Nanoscale Res. Lett. 2015, 10, 373. [Google Scholar] [CrossRef] [PubMed] [Green Version]
  38. Zhang, X.; Feng, Y.; Tang, S.; Feng, W. Preparation of a graphene oxide-Phthalocyanine hybrid through strong π-π interactions. Carbon 2010, 48, 211–216. [Google Scholar] [CrossRef]
  39. Liang, Y.; Wu, D.; Feng, X.; Müllen, K. Dispersion of graphene sheets in organic solvent supported by ionic interactions. Adv. Mater. 2009, 21, 1679–1683. [Google Scholar] [CrossRef]
  40. Naficy, S.; Jalili, R.; Aboutalebi, S.H.; Gorkin Iii, R.A.; Konstantinov, K.; Innis, P.C.; Spinks, G.M.; Poulin, P.; Wallace, G.G. Graphene oxide dispersions: Tuning rheology to enable fabrication. Mater. Horiz. 2014, 1, 326–331. [Google Scholar] [CrossRef] [Green Version]
  41. Vallés, C.; Young, R.J.; Lomax, D.J.; Kinloch, I.A. The rheological behaviour of concentrated dispersions of graphene oxide. J. Mater. Sci. 2014, 49, 6311–6320. [Google Scholar] [CrossRef] [Green Version]
  42. Jo, K.; Lee, T.; Choi, H.J.; Park, J.H.; Lee, D.J.; Lee, D.W.; Kim, B.-S. Stable aqueous dispersion of reduced graphene nanosheets via non-Covalent functionalization with conducting polymers and application in transparent electrodes. Langmuir 2011, 27, 2014–2018. [Google Scholar] [CrossRef] [PubMed]
  43. Konios, D.; Stylianakis, M.M.; Stratakis, E.; Kymakis, E. Dispersion behaviour of graphene oxide and reduced graphene oxide. J. Colloid Interface Sci. 2014, 430, 108–112. [Google Scholar] [CrossRef] [PubMed]
  44. Gudarzi, M.M.; Moghadam, M.H.M.; Sharif, F. Spontaneous exfoliation of graphite oxide in polar aprotic solvents as the route to produce graphene oxide-Organic solvents liquid crystals. Carbon 2013, 64, 403–415. [Google Scholar] [CrossRef]
  45. Shahriary, L.; Nair, R.; Sabharwal, S.; Athawale, A.A. One-Step synthesis of ag-Reduced graphene oxide-Multiwalled carbon nanotubes for enhanced antibacterial activities. New J. Chem. 2015, 39, 4583–4590. [Google Scholar] [CrossRef]
  46. Kaur, M.; Kaur, H.; Kukkar, D. Synthesis and characterization of graphene oxide using modified hummer’s method. AIP Conf. Proc. 2018, 1953, 030180. [Google Scholar]
  47. Wazir, A.H.; Kundi, I.W. Synthesis of graphene nano sheets by the rapid reduction of electrochemically exfoliated graphene oxide induced by microwaves. J. Chem. Soc. Pak. 2016, 38, 11–16. [Google Scholar]
  48. Saxena, S.; Tyson, T.A.; Shukla, S.; Negusse, E.; Chen, H.; Bai, J. Investigation of structural and electronic properties of graphene oxide. Appl. Phys. Lett. 2011, 99, 013104. [Google Scholar] [CrossRef] [Green Version]
  49. Li, D.; Müller, M.B.; Gilje, S.; Kaner, R.B.; Wallace, G.G. Processable aqueous dispersions of graphene nanosheets. Nat. Nanotechnol. 2008, 3, 101–105. [Google Scholar] [CrossRef]
  50. Chen, I.W.P.; Huang, C.-Y.; Jhou, S.-H.S.; Zhang, Y.-W. Exfoliation and performance properties of non-Oxidized graphene in water. Sci. Rep. 2014, 4, 3928. [Google Scholar] [CrossRef] [Green Version]
  51. Shi, H.; Wang, C.; Sun, Z.; Zhou, Y.; Jin, K.; Redfern, S.A.T.; Yang, G. Tuning the nonlinear optical absorption of reduced graphene oxide by chemical reduction. Opt. Express 2014, 22, 19375–19385. [Google Scholar] [CrossRef] [Green Version]
  52. Kobayashi, N.; Nakajima, S.-i.; Ogata, H.; Fukuda, T. Synthesis, spectroscopy, and electrochemistry of tetra-Tert-Butylated tetraazaporphyrins, phthalocyanines, naphthalocyanines, and anthracocyanines, together with molecular orbital calculations. Chem. A Eur. J. 2004, 10, 6294–6312. [Google Scholar] [CrossRef] [PubMed]
  53. Fan, B.; Guo, H.; Shi, J.; Shi, C.; Jia, Y.; Wang, H.; Chen, D.; Yang, Y.; Lu, H.; Xu, H.; et al. Facile one-Pot preparation of silver/reduced graphene oxide nanocomposite for cancer photodynamic and phototheral therapy. J. Nanosci. Nanotechnol. 2016, 16, 7049–7054. [Google Scholar] [CrossRef]
  54. Lu, J.; Li, Y.; Li, S.; Jiang, S.P. Self-Assembled platinum nanoparticles on sulfonic acid-Grafted graphene as effective electrocatalysts for methanol oxidation in direct methanol fuel cells. Sci. Rep. 2016, 6, 21530. [Google Scholar] [CrossRef]
  55. Rochman, R.A.; Wahyuningsih, S.; Ramelan, A.H.; Hanif, Q.A. Preparation of nitrogen and sulphur co-Doped reduced graphene oxide (rgo-ns) using n and s heteroatom of thiourea. IOP Conf. Ser. Mater. Sci. Eng. 2019, 509, 012119. [Google Scholar] [CrossRef]
  56. Le, V.H.; Nguyen, T.H.; Nguyen, H.H.; Huynh, L.T.N.; Vo, A.L.; Nguyen, T.K.T.; Nguyen, D.T.; Lam, V.Q. Fabrication and electrochemical behavior investigation of a pt-Loaded reduced graphene oxide composite (pt@rgo) as a high-performance cathode for dye-Sensitized solar cells. Int. J. Photoenergy 2020, 2020, 8927124. [Google Scholar] [CrossRef] [Green Version]
  57. Harbeck, S.; Göçmen, S.; Emirik, Ö.F.; Öztürk, Z.Z.; Ahsen, V.; Gürek, A.G. Synthesis of branched alkoxy side chains con_tain_ing phthalocyanine derivates and their application in mass sensitive qcm sensors. Sens. Actuators B Chem. 2016, 233, 55–62. [Google Scholar] [CrossRef]
  58. Denekamp, I.M.; Veenstra, F.L.P.; Jungbacker, P.; Rothenberg, G. A simple synthesis of symmetric phthalocyanines and their respective perfluoro and transition-Metal complexes. Appl. Organomet. Chem. 2019, 33, e4872. [Google Scholar] [CrossRef] [Green Version]
  59. Cox, B.J.; Baowan, D.; Bacsa, W.; Hill, J.M. Relating elasticity and graphene folding conformation. RSC Adv. 2015, 5, 57515–57520. [Google Scholar] [CrossRef] [Green Version]
  60. Cranford, S.; Sen, D.; Buehler, M.J. Meso-Origami: Folding multilayer graphene sheets. Appl. Phys. Lett. 2009, 95, 123121. [Google Scholar] [CrossRef]
  61. Kim, K.; Lee, Z.; Malone, B.D.; Chan, K.T.; Alemán, B.; Regan, W.; Gannett, W.; Crommie, M.F.; Cohen, M.L.; Zettl, A. Multiply folded graphene. Phys. Rev. B 2011, 83, 245433. [Google Scholar] [CrossRef] [Green Version]
  62. Liu, Q.; Gao, Y.; Xu, B. Liquid evaporation-Driven folding of graphene sheets. Appl. Phys. Lett. 2016, 108, 141906. [Google Scholar] [CrossRef]
  63. Kumar, A.; Brunet, J.; Varenne, C.; Ndiaye, A.; Pauly, A. Room temperature measurements of aromatic hydrocarbons by qcm-Based gas sensors: Intercomparison between phthalocyanines and phthalocyanine/cnts hybrid material. Procedia Eng. 2015, 120, 594–597. [Google Scholar] [CrossRef] [Green Version]
  64. Lee, E.C.; Kim, D.; Jurečka, P.; Tarakeshwar, P.; Hobza, P.; Kim, K.S. Understanding of assembly phenomena by aro_matic−aromatic interactions:  Benzene dimer and the substituted systems. J. Phys. Chem. A 2007, 111, 3446–3457. [Google Scholar] [CrossRef]
  65. Rianjanu, A.; Hasanah, S.A.; Nugroho, D.B.; Kusumaatmaja, A.; Roto, R.; Triyana, K. Polyvinyl acetate film-Based quartz crystal microbalance for the detection of benzene, toluene, and xylene vapors in air. Chemosensors 2019, 7, 20. [Google Scholar] [CrossRef] [Green Version]
  66. Wang, B.; Zuo, X.; Wu, Y.Q.; Chen, Z.M. Preparation, characterization and gas sensing properties of lead tet_ra-(tert-Butyl)-5,10,15,20-Tetraazaporphyrin spin-Coating films. Sens. Actuators B Chem. 2007, 125, 268–273. [Google Scholar] [CrossRef]
  67. Chikkadi, K.; Muoth, M.; Roman, C.; Haluska, M.; Hierold, C. Advances in no2 sensing with individual single-Walled carbon nanotube transistors. Beilstein J. Nanotechnol. 2014, 5, 2179–2191. [Google Scholar] [CrossRef] [Green Version]
  68. Schober, S.A.; Carbonelli, C.; Roth, A.; Zoepfl, A.; Wille, R. Towards drift modeling of graphene-Based gas sensors using sto_chastic simulation techniques. 2020 IEEE Sens. 2020, 1–4. [Google Scholar] [CrossRef]
  69. Ragoussi, M.-E.; Malig, J.; Katsukis, G.; Butz, B.; Spiecker, E.; de la Torre, G.; Torres, T.; Guldi, D.M. Linking photo-And redoxactive phthalocyanines covalently to graphene. Angew. Chem. Int. Ed. 2012, 51, 6421–6425. [Google Scholar] [CrossRef] [PubMed]
Scheme 1. Chart showing the protocol used for the material (A) and sensor preparation (B).
Chemosensors 09 00346 sch001
Figure 1. UV–vis spectra of GO, RGO, and RGO/PcH2tBu materials.
Chemosensors 09 00346 g001
Figure 2. FTIR spectra of the GO, RGO, and RGO/PcH2tBu materials.
Chemosensors 09 00346 g002
Figure 3. SEM images of RGO (A) and RGO/PcH2tBu (B) and TEM images of RGO/PcH2tBu at lower (C) and higher (D) levels of magnification.
Chemosensors 09 00346 g003
Figure 4. Current-voltage characteristic curves for RGO and RGO/PcH2tBu. The inset shows a magnification of the RGO/PcH2tBu, showing a higher resistance value.
Chemosensors 09 00346 g004
Figure 5. QCM sensor response of the GO, RGO, and RGO/PcH2tBu exposed to toluene (A); calibration curves corresponding to exposure sequences in the 250–500 ppm range (B).
Chemosensors 09 00346 g005
Figure 6. QCM sensor response of RGO/PcH2tBu exposed to toluene and xylene (A) and calibration curves corresponding to the QCM sensor response of RGO/PcH2tBu exposed to benzene, toluene, and xylene (B).
Chemosensors 09 00346 g006
Figure 7. Cross-sensitivity result for the RGO/PcH2tBu exposed to BTX and to other VOCs at 750 ppm.
Chemosensors 09 00346 g007
Figure 8. Resistive sensor response of RGO/PcH2tBu exposed to toluene and xylene (A) and calibration curves corresponding to the resistive sensor response of RGO/PcH2tBu exposed to benzene, toluene, and xylene (B). In the case of benzene, no stable and exploitable response could be obtained under 500 ppm.
Chemosensors 09 00346 g008
Table 1. Sensor performance from the QCM responses.
QCM Mass Responses
BenzeneTolueneXylenes
Response time (τresp.; in min.)2.54.56
Recovery time (τrec.; in min.)61317
LOD (ppm)78 30 7
Concentration range (ppm)550–1500 260–1400 125–700
Sensitivity (µHz/ng/ppm)2.03 3.41 4.09
R20.997 0.935 0.988
Table 2. Sensor performance obtained from the resistive responses.
Resistives Responses
BenzeneTolueneXylenes
Response time (τresp.; in min.)457
Recovery time (τrec.; in min.)915.517
LOD (ppm)NA 144
Concentration range (ppm)550–1500 260–1400 125–700
Sensitivity (%/ppm)0.00018 0.00068 0.00184
R20.806 0.999 0.977
Publisher’s Note: MDPI stays neutral with regard to jurisdictional claims in published maps and institutional affiliations.

