
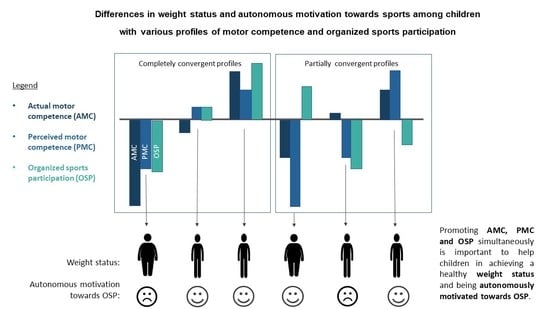
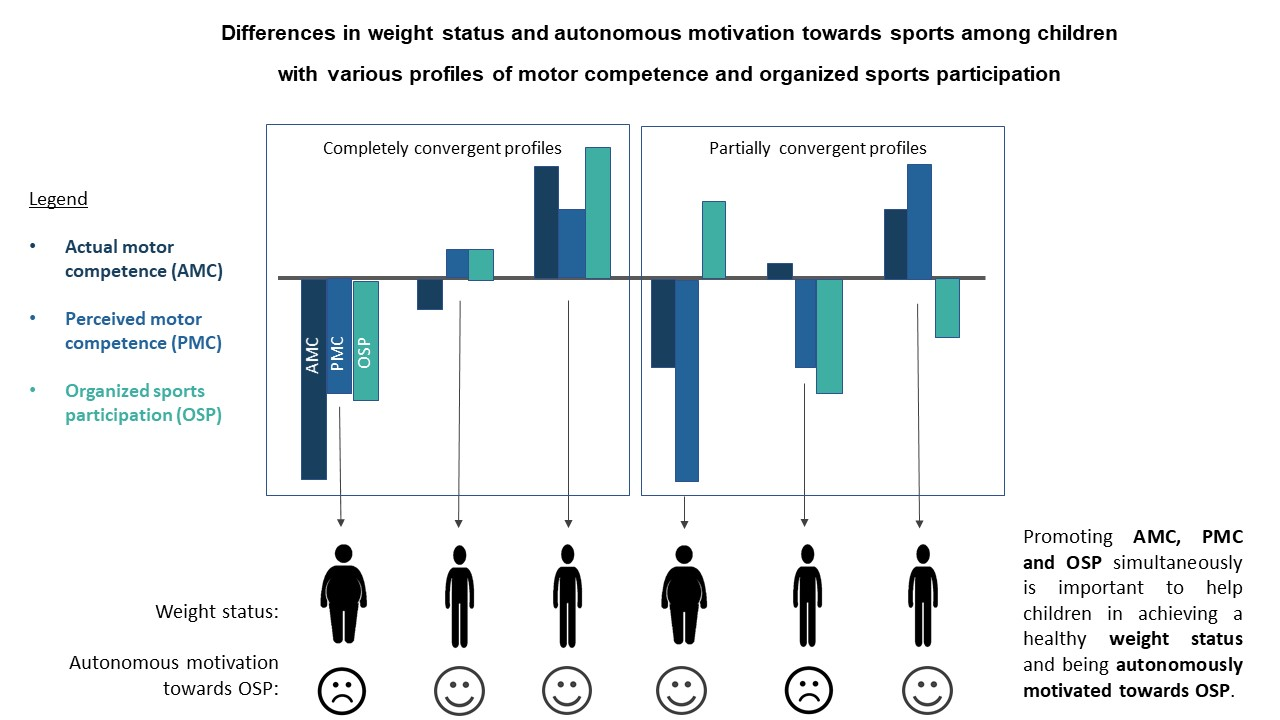
Differences in Weight Status and Autonomous Motivation towards Sports among Children with Various Profiles of Motor Competence and Organized Sports Participation

 ,
,  ,
,  ,
,  ,
,  and
and 
Abstract
:
1. Introduction
2. Materials and Methods
2.1. Participants and Procedure
2.2. Measurements
2.2.1. Actual Motor Competence
2.2.2. Perceived Motor Competence
2.2.3. Organized Sports Participation
2.2.4. Weight Status
2.2.5. Autonomous Motivation for Sports
2.3. Statistical Analysis
3. Results
3.1. Descriptives and Correlations
3.2. Identifying Profiles
3.3. Differences in Weight Status and Autonomous Motivation among Profiles
4. Discussion
4.1. AIM 1. Identifying Profiles Based on Children’s AMC, PMC, and OSP
4.2. AIM 2. Examining Differences in Weight Status and Autonomous Motivation According to AMC–PMC–OSP Profiles
4.3. Strengths and Limitations, and Recommendations for Future Research
5. Conclusions
Author Contributions
Funding
Institutional Review Board Statement
Informed Consent Statement
Data Availability Statement
Conflicts of Interest
References
- Utesch, T.; Bardid, F. Motor Competence. In Encyclopedia of Exercise Medicine in Health and Disease; Hackfort, D., Schinke, R., Strauss, B., Eds.; Elsevier: Amsterdam, The Netherlands, 2019; p. 595. [Google Scholar] [CrossRef]
- Cattuzzo, M.T.; dos Santos Henrique, R.; Ré, A.H.N.; de Oliveira, I.S.; Melo, B.M.; de Sousa Moura, M.; de Araújo, R.C.; Stodden, D. Motor Competence and Health Related Physical Fitness in Youth: A Systematic Review. J. Sci. Med. Sport 2016, 19, 123–129. [Google Scholar] [CrossRef] [PubMed]
- Barnett, L.M.; Lai, S.K.; Veldman, S.L.C.; Hardy, L.L.; Cliff, D.P.; Morgan, P.J.; Zask, A.; Lubans, D.R.; Shultz, S.P.; Ridgers, N.D.; et al. Correlates of Gross Motor Competence in Children and Adolescents: A Systematic Review and Meta-Analysis. Sports Med. 2016, 46, 1663–1688. [Google Scholar] [CrossRef] [PubMed] [Green Version]
- Lima, R.A.; Pfeiffer, K.A.; Bugge, A.; Møller, N.C.; Andersen, L.B.; Stodden, D.F. Motor Competence and Cardiorespiratory Fitness Have Greater Influence on Body Fatness than Physical Activity across Time. Scand. J. Med. Sci. Sports 2017, 27, 1638–1647. [Google Scholar] [CrossRef] [PubMed]
- Robinson, L.E.; Stodden, D.F.; Barnett, L.M.; Lopes, V.P.; Logan, S.W.; Rodrigues, L.P.; D’Hondt, E. Motor Competence and Its Effect on Positive Developmental Trajectories of Health. Sport. Med. 2015, 45, 1273–1284. [Google Scholar] [CrossRef] [PubMed]
- Stodden, D.; Goodway, J.D.; Langendorfer, S.; Roberton, M.A.; Rudisill, M. A Developmental Perspective on the Role of Motor Skill Competence in Physical Activity: An Emergent Relationship. Quest 2008, 60, 290–306. [Google Scholar] [CrossRef]
- Logan, S.W.; Webster, E.K.; Getchell, N.; Pfeiffer, K.A.; Robinson, L.E. Relationship Between Fundamental Motor Skill Competence and Physical Activity During Childhood and Adolescence: A Systematic Review. Kinesiol. Rev. 2015, 4, 416–426. [Google Scholar] [CrossRef]
- Hulteen, R.M.; Morgan, P.J.; Barnett, L.M.; Stodden, D.F.; Lubans, D.R. Development of Foundational Movement Skills: A Conceptual Model for Physical Activity across the Lifespan. Sport. Med. 2018, 48, 1533–1540. [Google Scholar] [CrossRef]
- Harter, S. The Construction of the Self: A Developmental Perspective; Guilford Press: New York, NY, USA, 1999. [Google Scholar]
- Babic, M.J.; Morgan, P.J.; Plotnikoff, R.C.; Lonsdale, C.; White, R.L.; Lubans, D.R. Physical Activity and Physical Self-Concept in Youth: Systematic Review and Meta-Analysis. Sports Med. 2014, 44, 1589–1601. [Google Scholar] [CrossRef] [PubMed]
- Marques, A.; Ekelund, U.; Sardinha, L.B. Associations between Organized Sports Participation and Objectively Measured Physical Activity, Sedentary Time and Weight Status in Youth. J. Sci. Med. Sport 2016, 19, 154–157. [Google Scholar] [CrossRef]
- De Meester, A.; Aelterman, N.; Cardon, G.; De Bourdeaudhuij, I.; Haerens, L. Extracurricular School-Based Sports as a Motivating Vehicle for Sports Participation in Youth: A Cross-Sectional Study. Int. J. Behav. Nutr. Phys. Act. 2014, 11, 1–15. [Google Scholar] [CrossRef] [Green Version]
- Crane, J.; Temple, V. A Systematic Review of Dropout from Organized Sport among Children and Youth. Eur. Phys. Educ. Rev. 2015, 21, 114–131. [Google Scholar] [CrossRef]
- Telama, R.; Yang, X.; Hirvensalo, M.; Raitakari, O. Participation in Organized Youth Sport as a Predictor of Adult Physical Activity: A 21-Year Longitudinal Study. Pediatr. Exerc. Sci. 2006, 18, 76–88. [Google Scholar] [CrossRef]
- De Meester, A.; Barnett, L.M.; Brian, A.; Bowe, S.J.; Jiménez-Díaz, J.; Van Duyse, F.; Irwin, J.M.; Stodden, D.F.; D’Hondt, E.; Lenoir, M.; et al. The Relationship Between Actual and Perceived Motor Competence in Children, Adolescents and Young Adults: A Systematic Review and Meta-Analysis. Sports Med. 2020, 50, 2001–2049. [Google Scholar] [CrossRef]
- Bardid, F.; De Meester, A.; Tallir, I.; Cardon, G.; Lenoir, M.; Haerens, L. Configurations of Actual and Perceived Motor Competence among Children: Associations with Motivation for Sports and Global Self-Worth. Hum. Mov. Sci. 2016, 50, 1–9. [Google Scholar] [CrossRef] [Green Version]
- Weiss, M.R.; Amorose, A.J. Children’s Self-Perceptions in the Physical Domain: Between-and within-Age Variability in Level, Accuracy, and Sources of Perceived Competence. J. Sport Exerc. Psychol. 2005, 27, 226–244. [Google Scholar] [CrossRef]
- Estevan, I.; García-Massó, X.; Molina García, J.; Barnett, L.M. Identifying Profiles of Children at Risk of Being Less Physically Active: An Exploratory Study Using a Self-Organised Map Approach for Motor Competence. J. Sports Sci. 2019, 37, 1356–1364. [Google Scholar] [CrossRef]
- De Meester, A.; Stodden, D.; Brian, A.; True, L.; Cardon, G.; Tallir, I.; Haerens, L. Associations among Elementary School Children’s Actual Motor Competence, Perceived Motor Competence, Physical Activity and BMI: A Cross-Sectional Study. PLoS ONE 2016, 11, e0164600. [Google Scholar] [CrossRef] [Green Version]
- Kalman, M.; Inchley, J.; Sigmundova, D.; Iannotti, R.J.; Tynjälä, J.A.; Hamrik, Z.; Haug, E.; Bucksch, J. Secular Trends in Moderate-to-Vigorous Physical Activity in 32 Countries from 2002 to 2010: A Cross-National Perspective. Eur. J. Public Health 2015, 25, 37–40. [Google Scholar] [CrossRef] [Green Version]
- Knuth, A.G.; Hallal, P.C. Temporal Trends in Physical Activity: A Systematic Review. J. Phys. Act. Heal. 2009, 6, 548–559. [Google Scholar] [CrossRef] [PubMed]
- Guagliano, J.M.; Rosenkranz, R.R.; Kolt, G.S. Girls’ Physical Activity Levels during Organized Sports in Australia. Med. Sci. Sports Exerc. 2013, 45, 116–122. [Google Scholar] [CrossRef] [PubMed]
- Henrique, R.S.; Ré, A.H.N.; Stodden, D.F.; Fransen, J.; Campos, C.M.C.; Queiroz, D.R.; Cattuzzo, M.T. Association between Sports Participation, Motor Competence and Weight Status: A Longitudinal Study. J. Sci. Med. Sport 2016, 19, 825–829. [Google Scholar] [CrossRef] [PubMed]
- Mooses, K.; Kull, M. The Participation in Organised Sport Doubles the Odds of Meeting Physical Activity Recommendations in 7–12-Year-Old Children. Eur. J. Sport Sci. 2020, 20, 563–569. [Google Scholar] [CrossRef] [PubMed]
- Timperio, A.F.; van Stralen, M.M.; Brug, J.; Bere, E.; Chinapaw, M.J.M.; De Bourdeaudhuij, I.; Jan, N.; Maes, L.; Manios, Y.; Moreno, L.A.; et al. Direct and Indirect Associations between the Family Physical Activity Environment and Sports Participation among 10-12 Year-Old European Children: Testing the EnRG Framework in the ENERGY Project. Int. J. Behav. Nutr. Phys. Act. 2013, 10. [Google Scholar] [CrossRef] [PubMed] [Green Version]
- Eime, R.M.; Harvey, J.T.; Craike, M.J.; Symons, C.M.; Payne, W.R. Family Support and Ease of Access Link Socio-Economic Status and Sports Club Membership in Adolescent Girls: A Mediation Study. Int. J. Behav. Nutr. Phys. Act. 2013, 10, 1–12. [Google Scholar] [CrossRef] [Green Version]
- Andersen, P.L.; Bakken, A. Social Class Differences in Youths’ Participation in Organized Sports: What Are the Mechanisms? Int. Rev. Sociol. Sport 2019, 54, 921–937. [Google Scholar] [CrossRef] [Green Version]
- Vella, S.A.; Cliff, D.P.; Okely, A.D.; Scully, M.L.; Morley, B.C. Associations between Sports Participation, Adiposity and Obesity-Related Health Behaviors in Australian Adolescents. Int. J. Behav. Nutr. Phys. Act. 2013, 10, 1–9. [Google Scholar] [CrossRef] [Green Version]
- Nelson, T.F.; Stovitz, S.D.; Thomas, M.; LaVoi, N.M.; Bauer, K.W.; Neumark-Sztainer, D. Do Youth Sports Prevent Pediatric Obesity? A Systematic Review and Commentary. Curr. Sports Med. Rep. 2011, 176, 360–370. [Google Scholar] [CrossRef] [Green Version]
- Dunton, G.; McConnell, R.; Jerrett, M.; Wolch, J.; Lam, C.; Gilliland, F.; Berhane, K. Organized Physical Activity in Young School Children and Subsequent 4-Year Change in Body Mass Index. Arch. Pediatr. Adolesc. Med. 2012, 166, 713–718. [Google Scholar] [CrossRef] [Green Version]
- Vansteenkiste, M.; Niemiec, C.P.; Soenens, B. The Development of the Five Mini-Theories of Self-Determination Theory: An Historical Overview, Emerging Trends, and Future Directions. Adv. Motiv. Achiev. 2010, 16, 105–165. [Google Scholar] [CrossRef] [Green Version]
- Teixeira, P.J.; Carraça, E.V.; Markland, D.; Silva, M.N.; Ryan, R.M. Exercise, Physical Activity, and Self-Determination Theory: A Systematic Review. Int. J. Behav. Nutr. Phys. Act. 2012, 9. [Google Scholar] [CrossRef] [Green Version]
- De Meester, A.; Maes, J.; Stodden, D.; Cardon, G.; Goodway, J.; Lenoir, M.; Haerens, L. Identifying Profiles of Actual and Perceived Motor Competence among Adolescents: Associations with Motivation, Physical Activity, and Sports Participation. J. Sports Sci. 2016, 34, 2027–2037. [Google Scholar] [CrossRef]
- Rottensteiner, C.; Tolvanen, A.; Laakso, L.; Konttinen, N. Youth Athletes’ Motivation, Perceived Competence, and Persistence in Organized Team Sports. J. Sport Behav. 2015, 38, 432–449. [Google Scholar]
- Kiphard, E.J.; Schilling, F. Körperkoordinationstest Für Kinder: KTK. Überarbeitete Und Ergänzte Auflage; Beltz Test Gmbh: Göttingen, Germany, 2007. [Google Scholar]
- Kiphard, E.J.; Schilling, F. Körperkoordinationstest Für Kinder: KTK.; Beltz Test Gmbh: Weinheim, Germany, 1974. [Google Scholar]
- Bardid, F.; Huyben, F.; Deconinck, F.J.A.; Seghers, J.; De Martelaer, K.; Lenoir, M. Convergent and Divergent Validity Between the KTK and MOT 4-6 Motor Tests in Early Childhood. Adapt. Phys. Act. Q. 2016, 33–48. [Google Scholar] [CrossRef] [Green Version]
- Smits-Engelsman, B.C.M.; Henderson, S.E.; Michels, C.G.J. The Assessment of Children with Developmental Coordination Disorders in the Netherlands: The Relationship between the Movement Assessment Battery for Children and the Körperkoordinations Test Für Kinder. Hum. Mov. Sci. 1998, 17, 699–709. [Google Scholar] [CrossRef]
- Fransen, J.; D’Hondt, E.; Bourgois, J.; Vaeyens, R.; Philippaerts, R.M.; Lenoir, M. Motor Competence Assessment in Children: Convergent and Discriminant Validity between the BOT-2 Short Form and KTK Testing Batteries. Res. Dev. Disabil. 2014, 35, 1375–1383. [Google Scholar] [CrossRef]
- McGrane, B.; Belton, S.; Powell, D.; Woods, C.B.; Issartel, J. Physical Self-Confidence Levels of Adolescents: Scale Reliability and Validity. J. Sci. Med. Sport 2016, 19, 563–567. [Google Scholar] [CrossRef] [PubMed]
- Ulrich, D.A. Test of Gross Motor Development, 2nd ed.; Pro-ed Publishers: Austin, TX, USA, 2000. [Google Scholar]
- Ulrich, D.A.; Sanford, C.B. Test of Gross Motor Development; Pro-ed Publishers: Austin, TX, USA, 1985. [Google Scholar]
- Walkley, J.; Holland, B.V.; Treloar, R.; O’Connor, J. Fundamental Motor Skills: A Manual for Classroom Teachers; Victoria. Department of Education: Melbourne, Australia, 1996.
- Fox, K.R.; Corbin, C.B. The Physical Self-Perception Profile—Development and Preliminary Validation. J. Sport Exerc. Psychol. 1989, 11, 408–430. [Google Scholar] [CrossRef]
- Estevan, I.; Barnett, L.M. Considerations Related to the Definition, Measurement and Analysis of Perceived Motor Competence. Sports Med. 2018, 48, 2685–2694. [Google Scholar] [CrossRef]
- Philippaerts, R.M.; Matton, L.; Wijndaele, K.; Balduck, A. Validity of a Physical Activity Computer Questionnaire in 12- to 18-Year-Old Boys and Girls. Int. J. Sports Med. 2006. [Google Scholar] [CrossRef]
- Roelants, M.; Hauspie, R.; Hoppenbrouwers, K. References for Growth and Pubertal Development from Birth to 21 Years in Flanders, Belgium. Ann. Hum. Biol. 2009, 36, 680–694. [Google Scholar] [CrossRef]
- Sebire, S.J.; Jago, R.; Fox, K.R.; Edwards, M.J.; Thompson, J.L. Testing a Self-Determination Theory Model of Children’s Physical Activity Motivation: A Cross-Sectional Study. Int. J. Behav. Nutr. Phys. Act. 2013, 10, 1–9. [Google Scholar] [CrossRef] [PubMed] [Green Version]
- Everitt, B.S.; Landau, S.; Leese, M. Cluster Analysis; Arnold. A Memb. Hodder Headl. Group: London, UK, 2001. [Google Scholar]
- Gore, P. Handbook of Applied Multivariate Statistics and Mathematical Modeling; Tinsley, H.E.A., Brown, S.D., Eds.; Academic Press: San Diego, CA, USA, 2000. [Google Scholar]
- Milligan, G.W.; Cooper, M.C. An Examination of Procedures for Determining the Number of Clusters in a Data Set. Psychometrika 1985, 50, 159–179. [Google Scholar] [CrossRef]
- Asendorpf, J.B.; Borkenau, P.; Ostendorf, F.; Van Aken, M.A.G. Carving Personality Description at Its Joints: Confirmation of Three Replicable Personality Prototypes for Both Children and Adults. Eur. J. Pers. 2001, 15, 169–198. [Google Scholar] [CrossRef]
- Breckenridge, J.N. Validating Cluster Analysis: Consistent Replication and Symmetry. Multivar. Behav. Res. 2000, 35, 261–285. [Google Scholar] [CrossRef]
- De Meester, A.; Wazir, M.R.W.N.; Lenoir, M.; Bardid, F. Profiles of Physical Fitness and Fitness Enjoyment Among Children: Associations With Sports Participation. Res. Q. Exerc. Sport 2020, 1–10. [Google Scholar] [CrossRef] [PubMed]
- True, L.; Brian, A.; Goodway, J.; Stodden, D. Relationships between Product-and Process-Oriented Measures of Motor Competence and Perceived Competence. J. Mot. Learn. Dev. 2017, 5, 319–335. [Google Scholar] [CrossRef]
- Pesce, C.; Masci, I.; Marchetti, R.; Vannozzi, G.; Schmidt, M. When Children’s Perceived and Actual Motor Competence Mismatch: Sport Participation and Gender Differences. J. Mot. Learn. Dev. 2018, 6, S440–S460. [Google Scholar] [CrossRef]
- Niemistö, D.; Finni, T.; Cantell, M.; Korhonen, E.; Sääkslahti, A. Individual, Family, and Environmental Correlates of Motor Competence in Young Children: Regression Model Analysis of Data Obtained from Two Motor Tests. Int. J. Environ. Res. Public Health 2020, 17, 2548. [Google Scholar] [CrossRef] [Green Version]
- Niemistö, D.; Barnett, L.M.; Cantell, M.; Finni, T.; Korhonen, E.; Sääkslahti, A. Socioecological Correlates of Perceived Motor Competence in 5- to 7-Year-Old Finnish Children. Scand. J. Med. Sci. Sports 2019, 29, 753–765. [Google Scholar] [CrossRef]
- Vandendriessche, J.B.; Vandorpe, B.F.R.; Vaeyens, R.; Malina, R.M.; Lefevre, J.; Lenoir, M.; Philippaerts, R.M. Variation in Sport Participation, Fitness and Motor Coordination with Socioeconomic Status among Flemish Children. Pediatr. Exerc. Sci. 2012, 24, 113–128. [Google Scholar] [CrossRef]
- Estevan, I.; Bardid, F.; Utesch, T.; Menescardi, C.; Barnett, L.M.; Castillo, I. Examining Early Adolescents’ Motivation for Physical Education: Associations with Actual and Perceived Motor Competence. Phys. Educ. Sport Pedagog. 2020, 1–16. [Google Scholar] [CrossRef]
- Cairney, J.; Dudley, D.; Kwan, M.; Bulten, R.; Kriellaars, D. Physical Literacy, Physical Activity and Health: Toward an Evidence-Informed Conceptual Model. Sports Med. 2019, 49, 371–383. [Google Scholar] [CrossRef] [PubMed]
- Iivonen, S.; Sääkslahti, A.; Laukkanen, A. A Review of Studies Using t He Körperkoordinationstest Für Kinder (KTK). Eur. J. Adapt. Phys. Act. 2015, 8, 18–36. [Google Scholar] [CrossRef] [Green Version]


| Mean | SD | Min | Max | 1 | 2 | 3 | 4 | ||
|---|---|---|---|---|---|---|---|---|---|
| Cluster Variables | |||||||||
| 1 | AMC (MQ) | 107.32 | 14.44 | 60 | 138 | ||||
| 2 | PMC (scale 1–10) | 7.32 | 1.44 | 1 | 10 | 0.502 ** | |||
| 3 | OSP (hours/week) | 2.52 | 1.24 | 0 | 6.25 | 0.308 ** | 0.137 | ||
| Outcome Variables | |||||||||
| 4 | BMI z-score | −0.14 | 0.95 | −2.29 | 2.52 | −0.292 ** | -0.197 * | 0.057 | |
| 5 | Autonomous motivation (scale 1–5) | 4.31 | 0.73 | 1 | 5 | 0.302 ** | 0.333 ** | 0.405 ** | −0.079 |
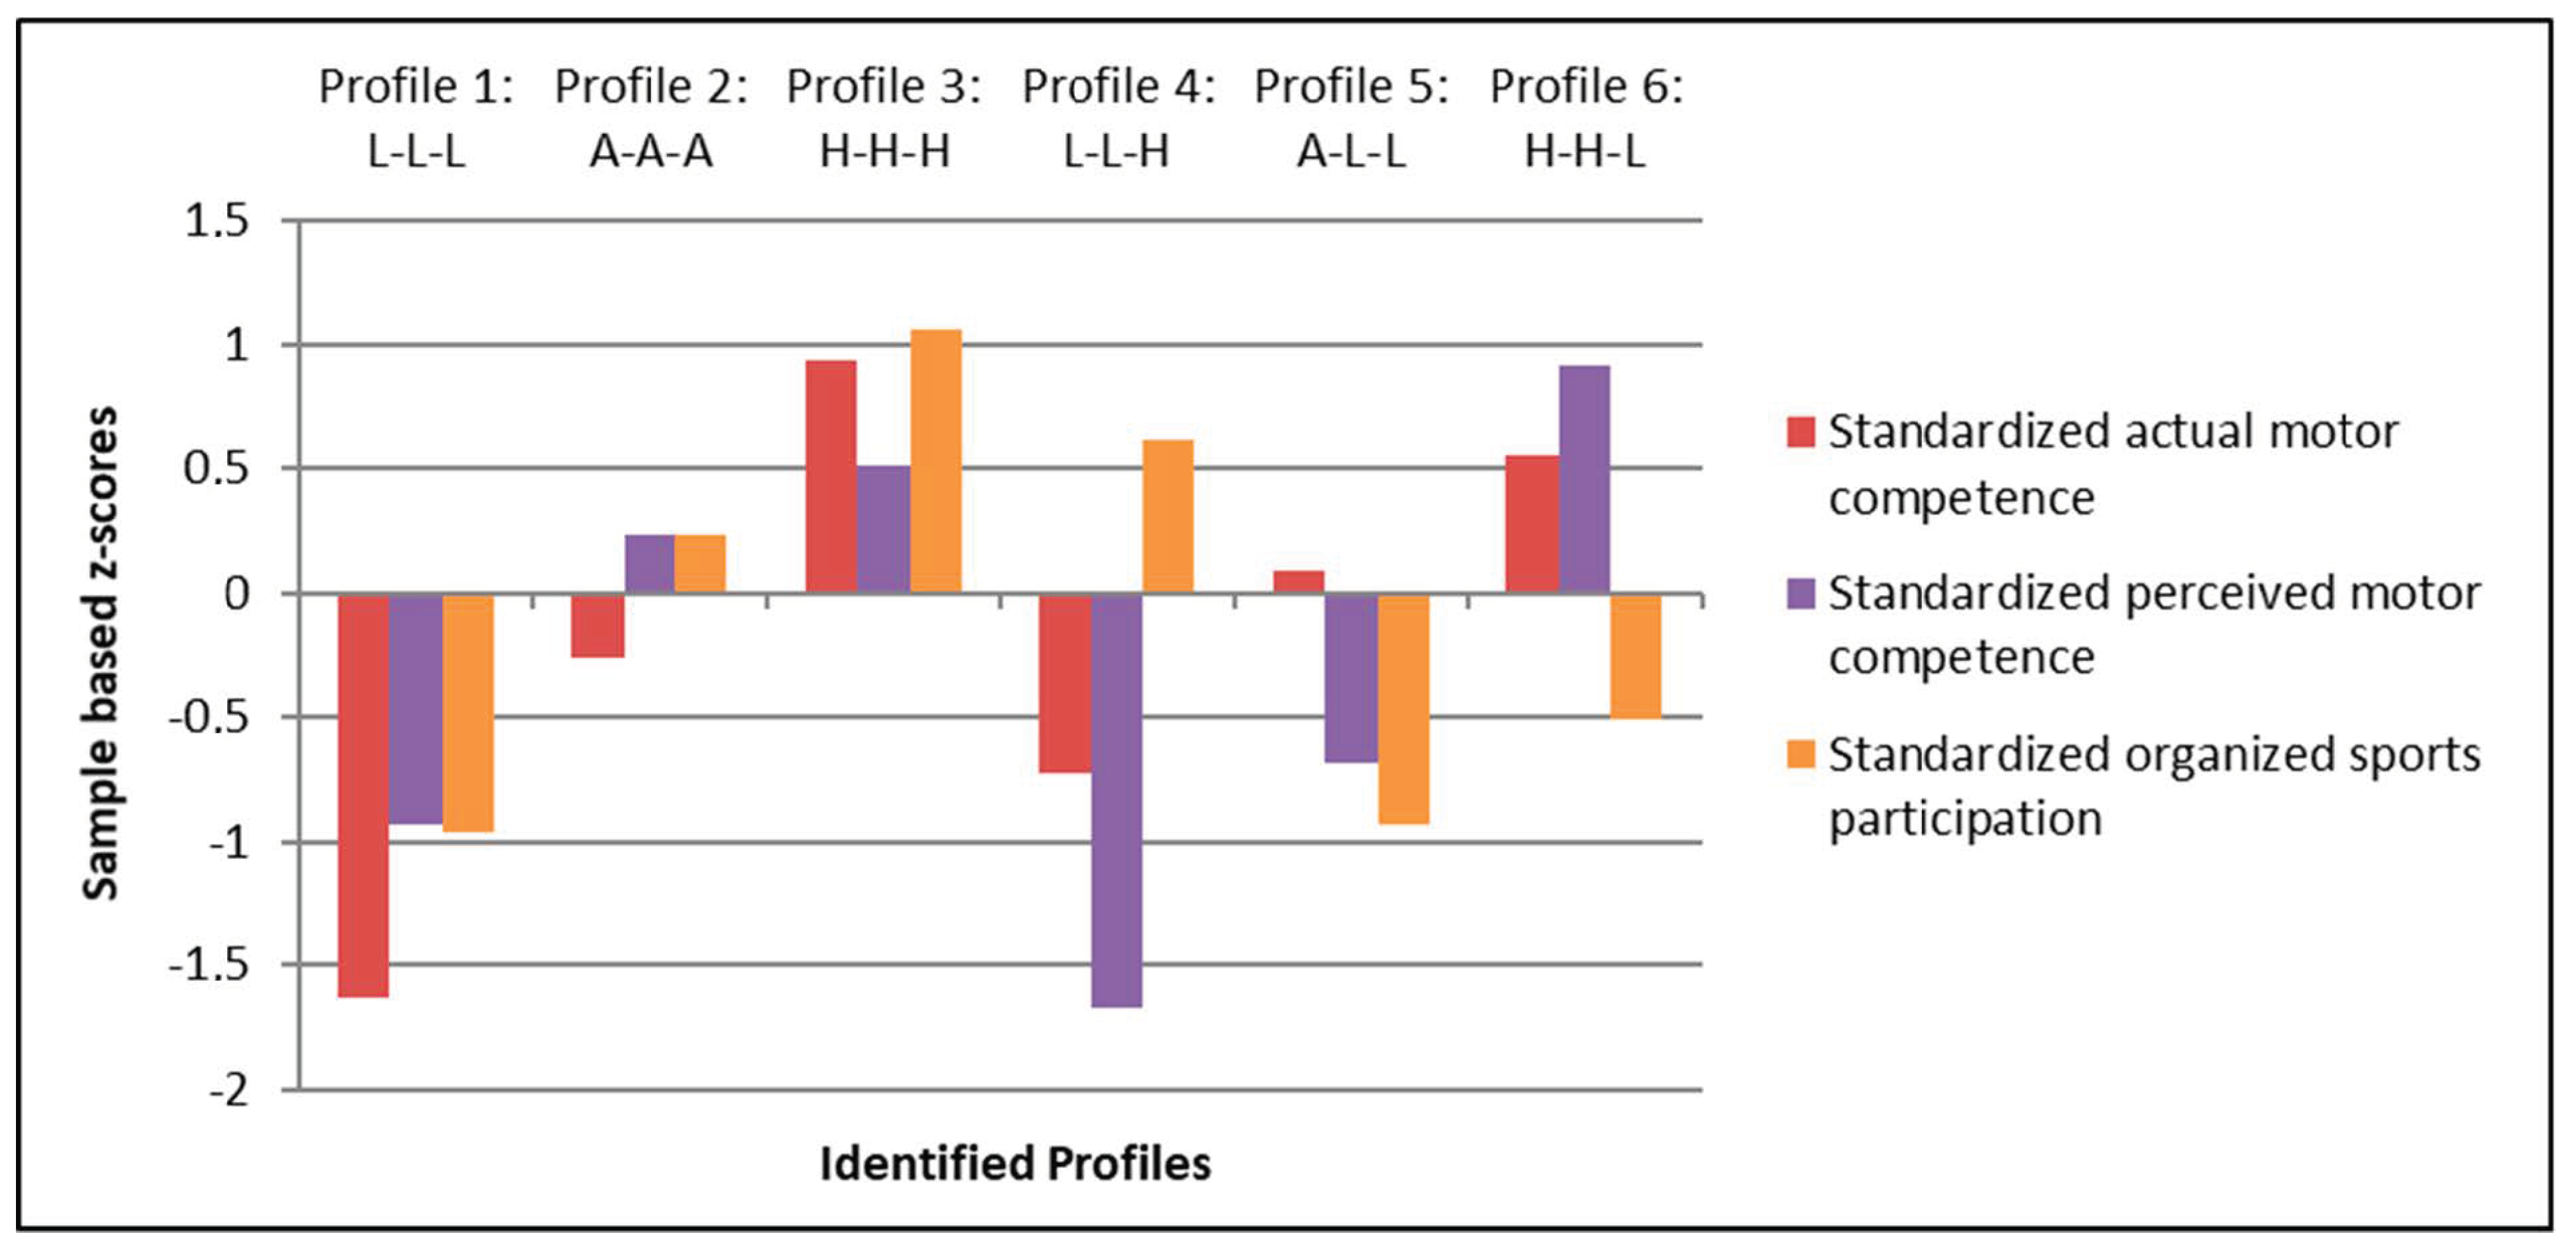
| Profile 1 L-L-L | Profile 2: A-A-A | Profile 3 H-H-H | Profile 4 L-L-H | Profile 5 A-L-L | Profile 6 H-H-L | |
|---|---|---|---|---|---|---|
| n = 20 8 Boys | n = 43 30 Boys | n = 41 24 Boys | n = 17 10 Boys | n = 32 18 Boys | n = 46 19 Boys | |
| Cluster variables (z-scores) | ||||||
| Actual motor competence | −1.63 ± 0.56 a | −0.26 ± 0.49 c | 0.93 ± 0.42 f | −0.73 ± 0.61 b | 0.09 ± 0.39 d | 0.55 ± 0.46 e |
| Perceived motor competence | −0.93 ± 0.61 b | 0.23 ± 0.42 c | 0.51 ± 0.66 c | −1.67 ± 0.52 a | −0.68 ± 0.66 b | 0.91 ± 0.41 d |
| Organized sports participation | −0.96 ± 0.63 a | 0.23 ± 0.44 c | 1.06 ±0.58 d | 0.61 ± 0.68 c,d | −0.93 ± 0.48 a | −0.51 ± 0.49 b |
| Cluster variables (raw scores) | ||||||
| Actual motor competence | 80.10 ± 0.91 a | 102.26 ±7.92 c | 121.59 ± 6.80 f | 94.71 ± 9.81 b | 107.94 ± 6.29 d | 115.39 ± 7.45 e |
| Perceived motor competence | 5.91 ± 0.91 b | 7.64 ± 0.76 c | 8.04 ± 0.98 c | 4.81 ± 0.77 a | 6.28 ± 0.97 b | 8.64 ± 0.62 d |
| Organized sports participation | 1.29 ± 0.86 a | 2.90 ± 0.60 c | 4.02 ± 0.79 d | 3.41 ± 0.91 c,d | 1.31 ± 0.65 a | 1.90 ± 0.66 b |
| Outcome variables | ||||||
| Body mass index (BMI) z-score | 0.50 ± 1.25 b,c | 0.02 ± 0.89 a,b,c | −0.39 ± 0.66 a | 0.57 ± 1.17 c | −0.45 ± 0.79 a | −0.39 ± 0.82 a |
| Autonomous motivation for sports | 3.72 ± 0.82 a | 4.56 ± 0.44 c,d,e | 4.70 ± 0.38 e | 4.13 ± 0.70 a,b | 3.99 ± 0.72 a,b | 4.27 ± 0.87 b,c |
Publisher’s Note: MDPI stays neutral with regard to jurisdictional claims in published maps and institutional affiliations. |
© 2021 by the authors. Licensee MDPI, Basel, Switzerland. This article is an open access article distributed under the terms and conditions of the Creative Commons Attribution (CC BY) license (http://creativecommons.org/licenses/by/4.0/).
Share and Cite
Coppens, E.; De Meester, A.; Deconinck, F.J.A.; De Martelaer, K.; Haerens, L.; Bardid, F.; Lenoir, M.; D’Hondt, E. Differences in Weight Status and Autonomous Motivation towards Sports among Children with Various Profiles of Motor Competence and Organized Sports Participation. Children 2021, 8, 156. https://0-doi-org.brum.beds.ac.uk/10.3390/children8020156
Coppens E, De Meester A, Deconinck FJA, De Martelaer K, Haerens L, Bardid F, Lenoir M, D’Hondt E. Differences in Weight Status and Autonomous Motivation towards Sports among Children with Various Profiles of Motor Competence and Organized Sports Participation. Children. 2021; 8(2):156. https://0-doi-org.brum.beds.ac.uk/10.3390/children8020156
Chicago/Turabian StyleCoppens, Eline, An De Meester, Frederik J. A. Deconinck, Kristine De Martelaer, Leen Haerens, Farid Bardid, Matthieu Lenoir, and Eva D’Hondt. 2021. "Differences in Weight Status and Autonomous Motivation towards Sports among Children with Various Profiles of Motor Competence and Organized Sports Participation" Children 8, no. 2: 156. https://0-doi-org.brum.beds.ac.uk/10.3390/children8020156