
Changes in Body Composition and Anthropomorphic Measurements in Children Participating in Swimming and Non-Swimming Activities

Abstract
:1. Introduction
2. Materials and Methods
2.1. Participants
2.2. Measurements
2.3. Ethical Clearance
2.4. Statistics
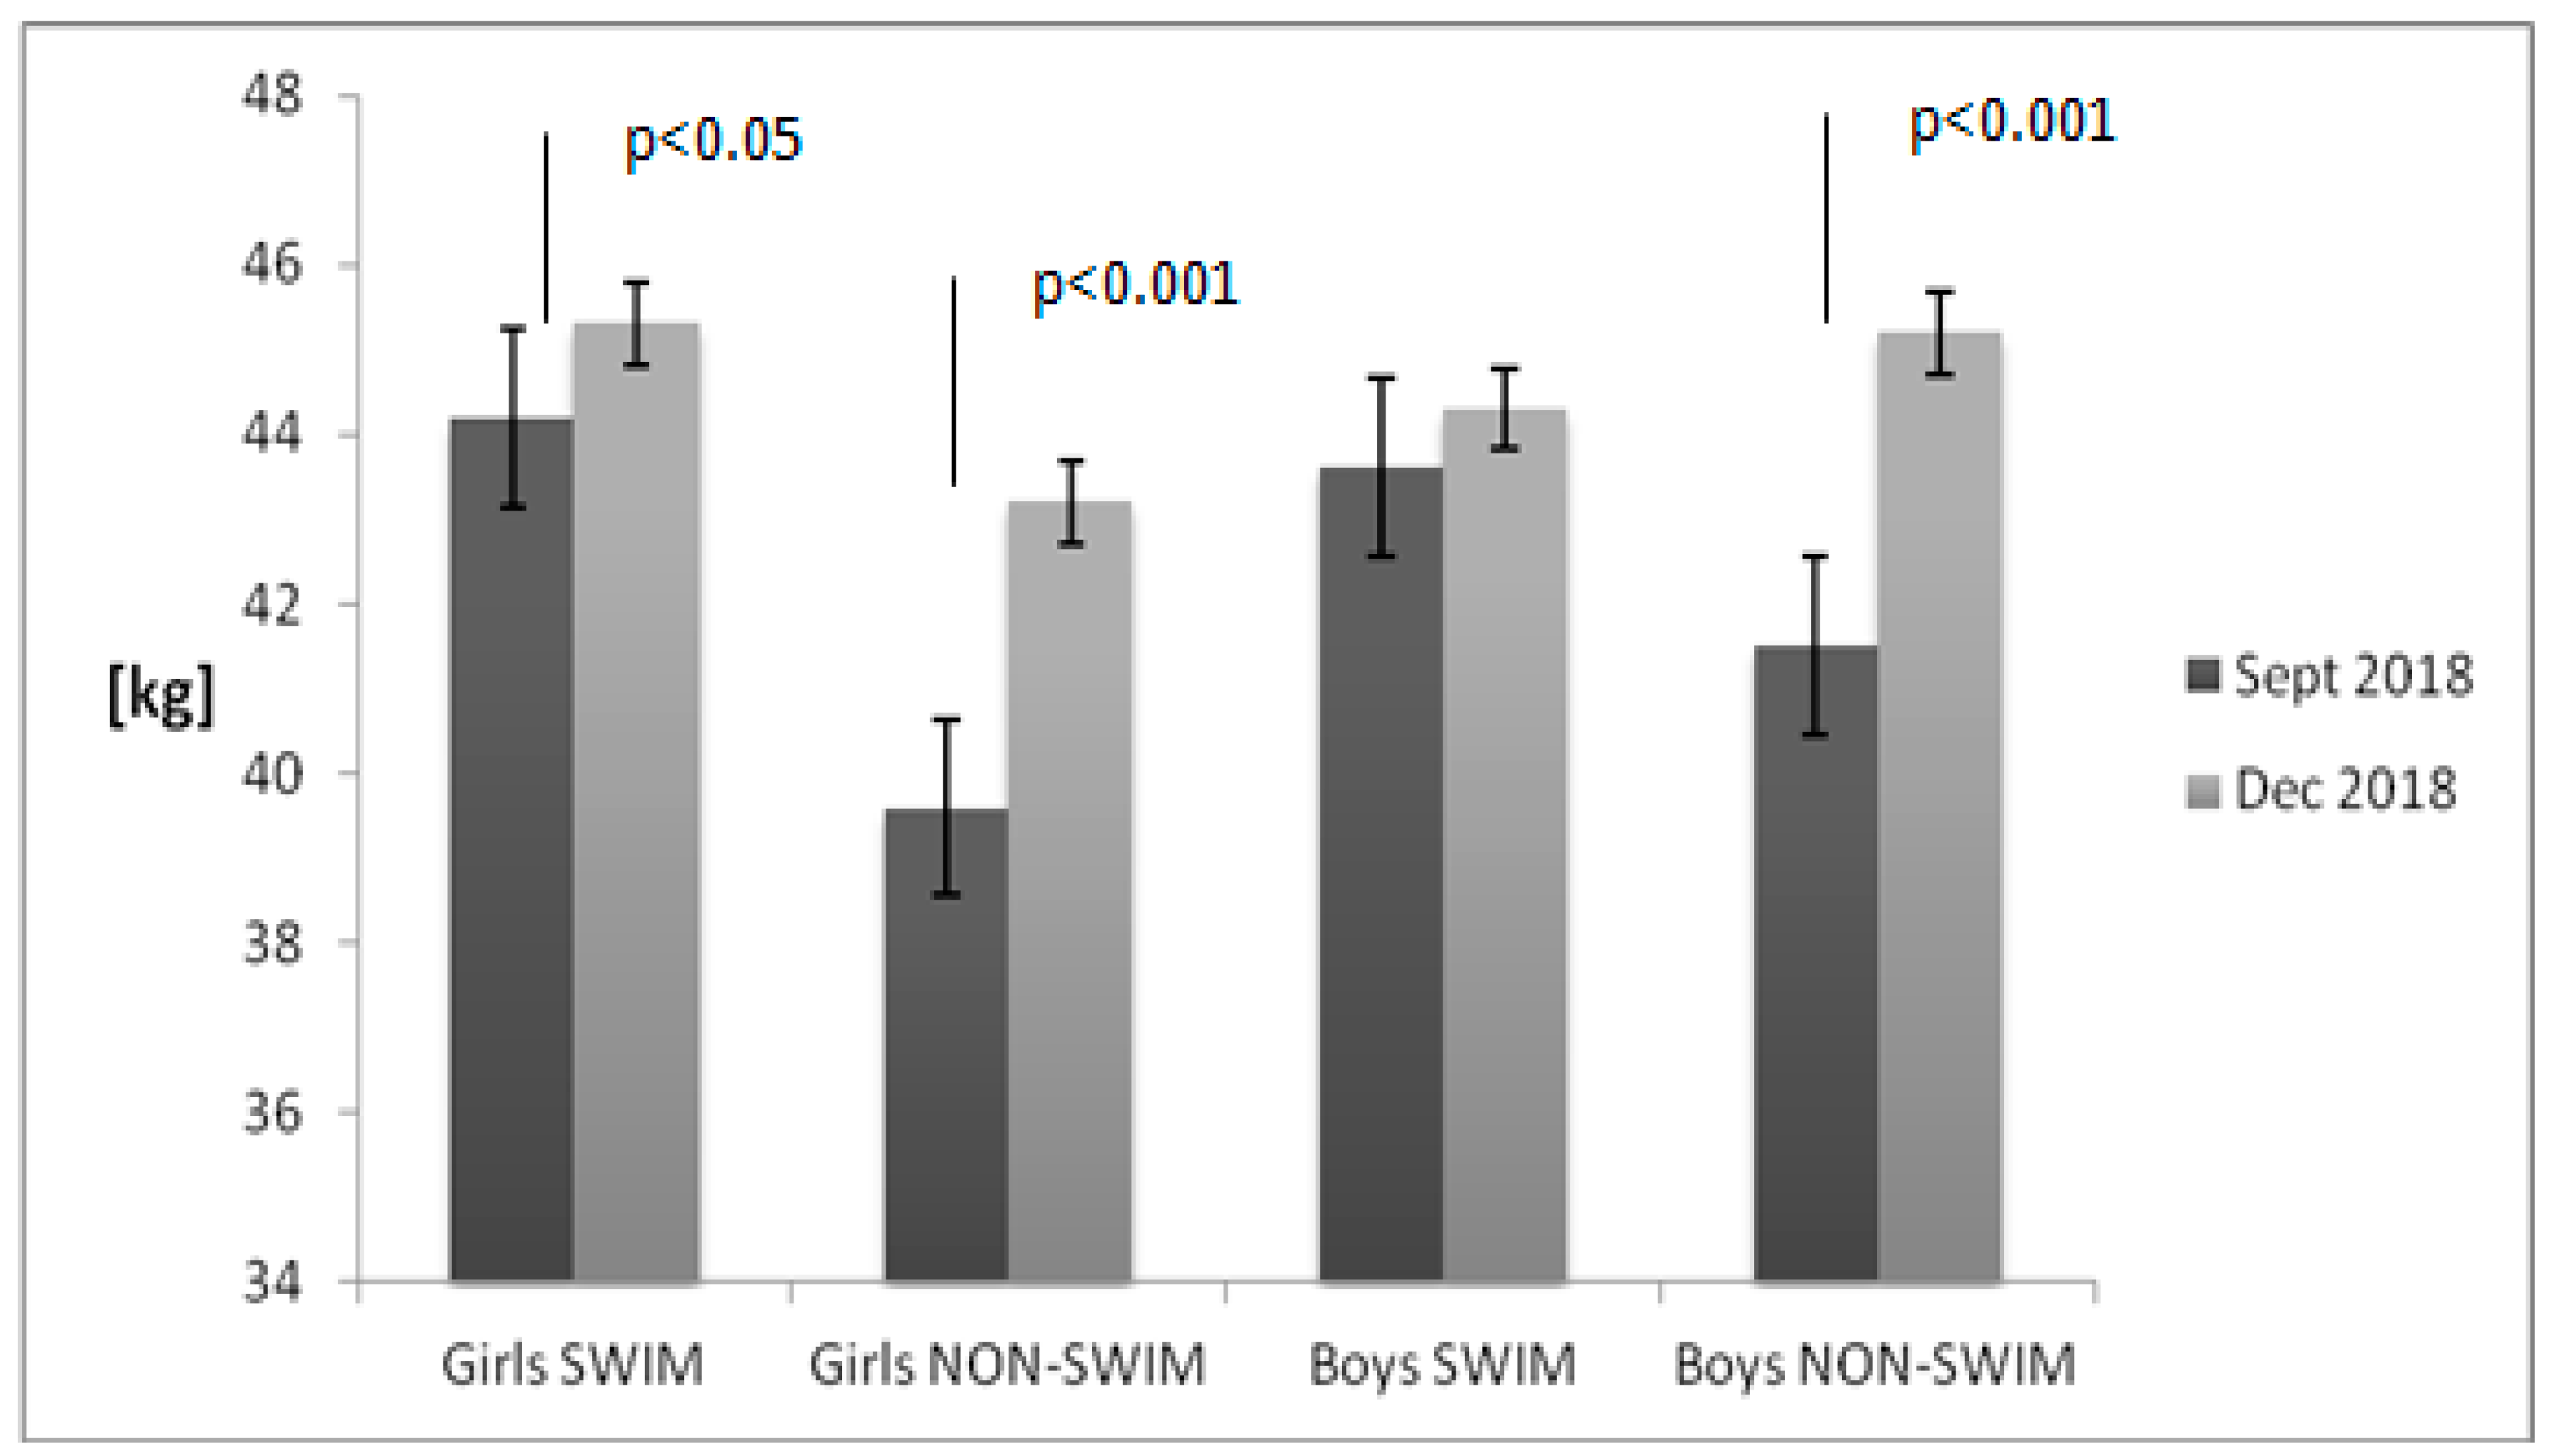
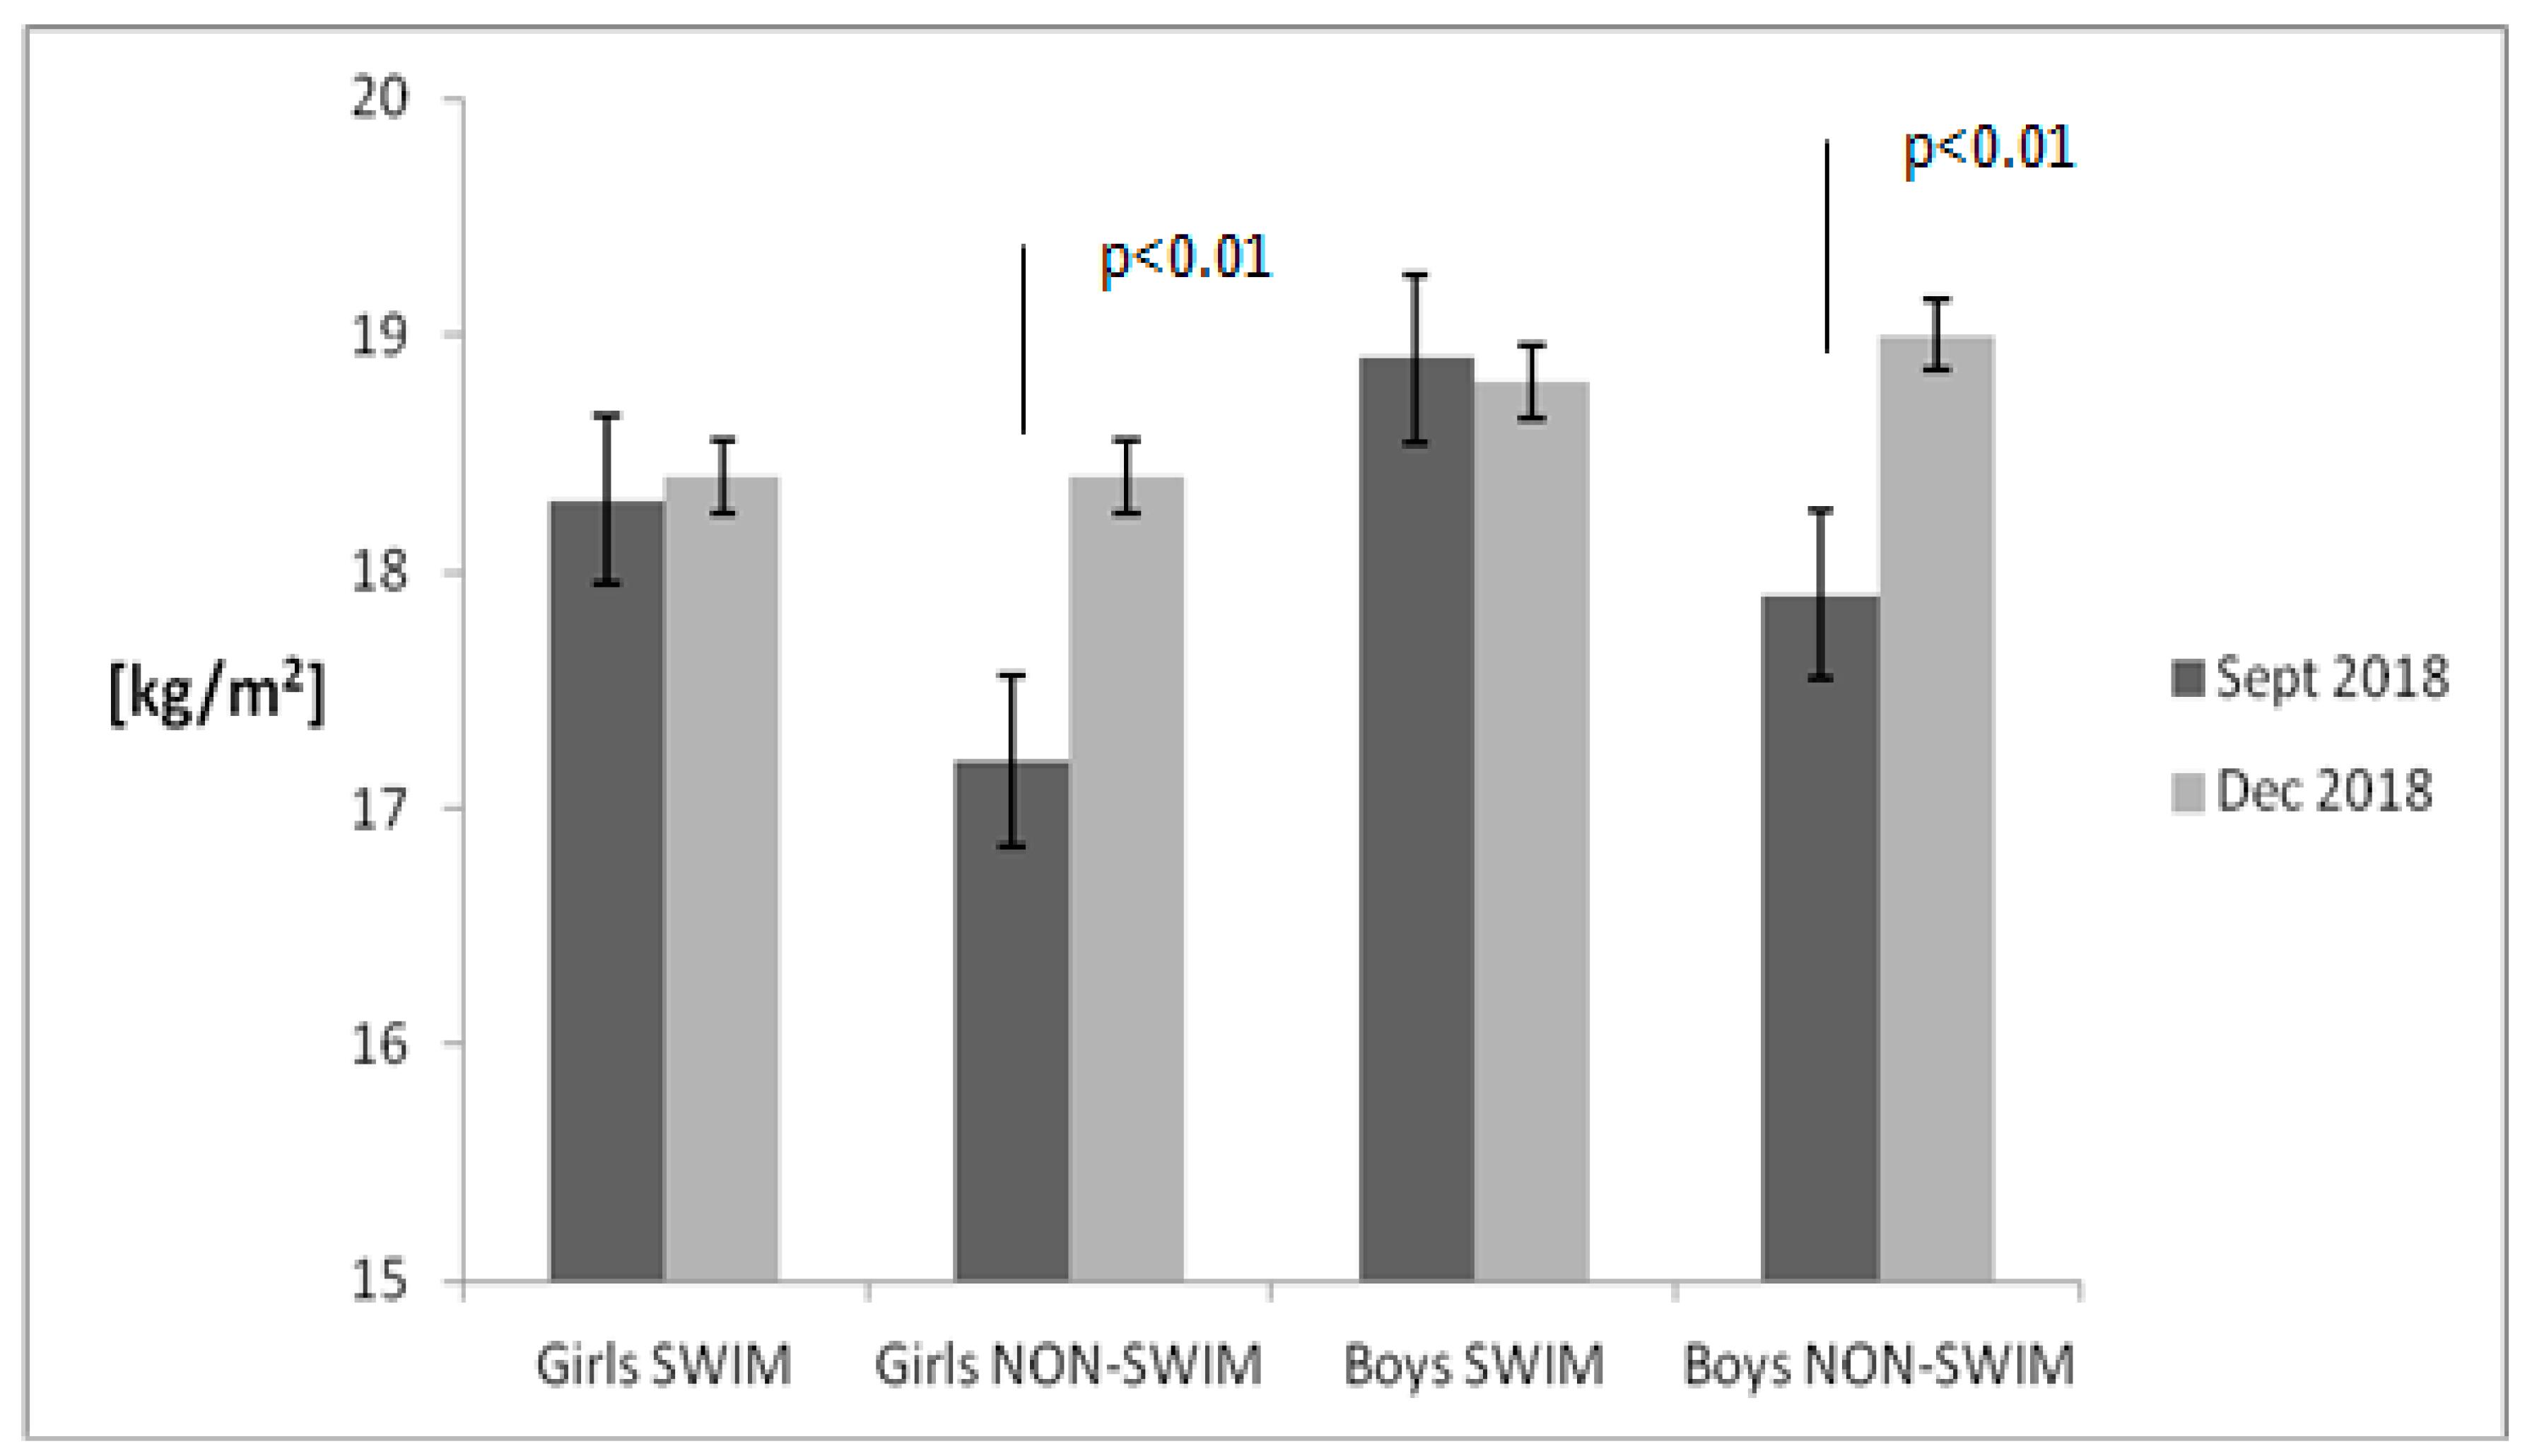
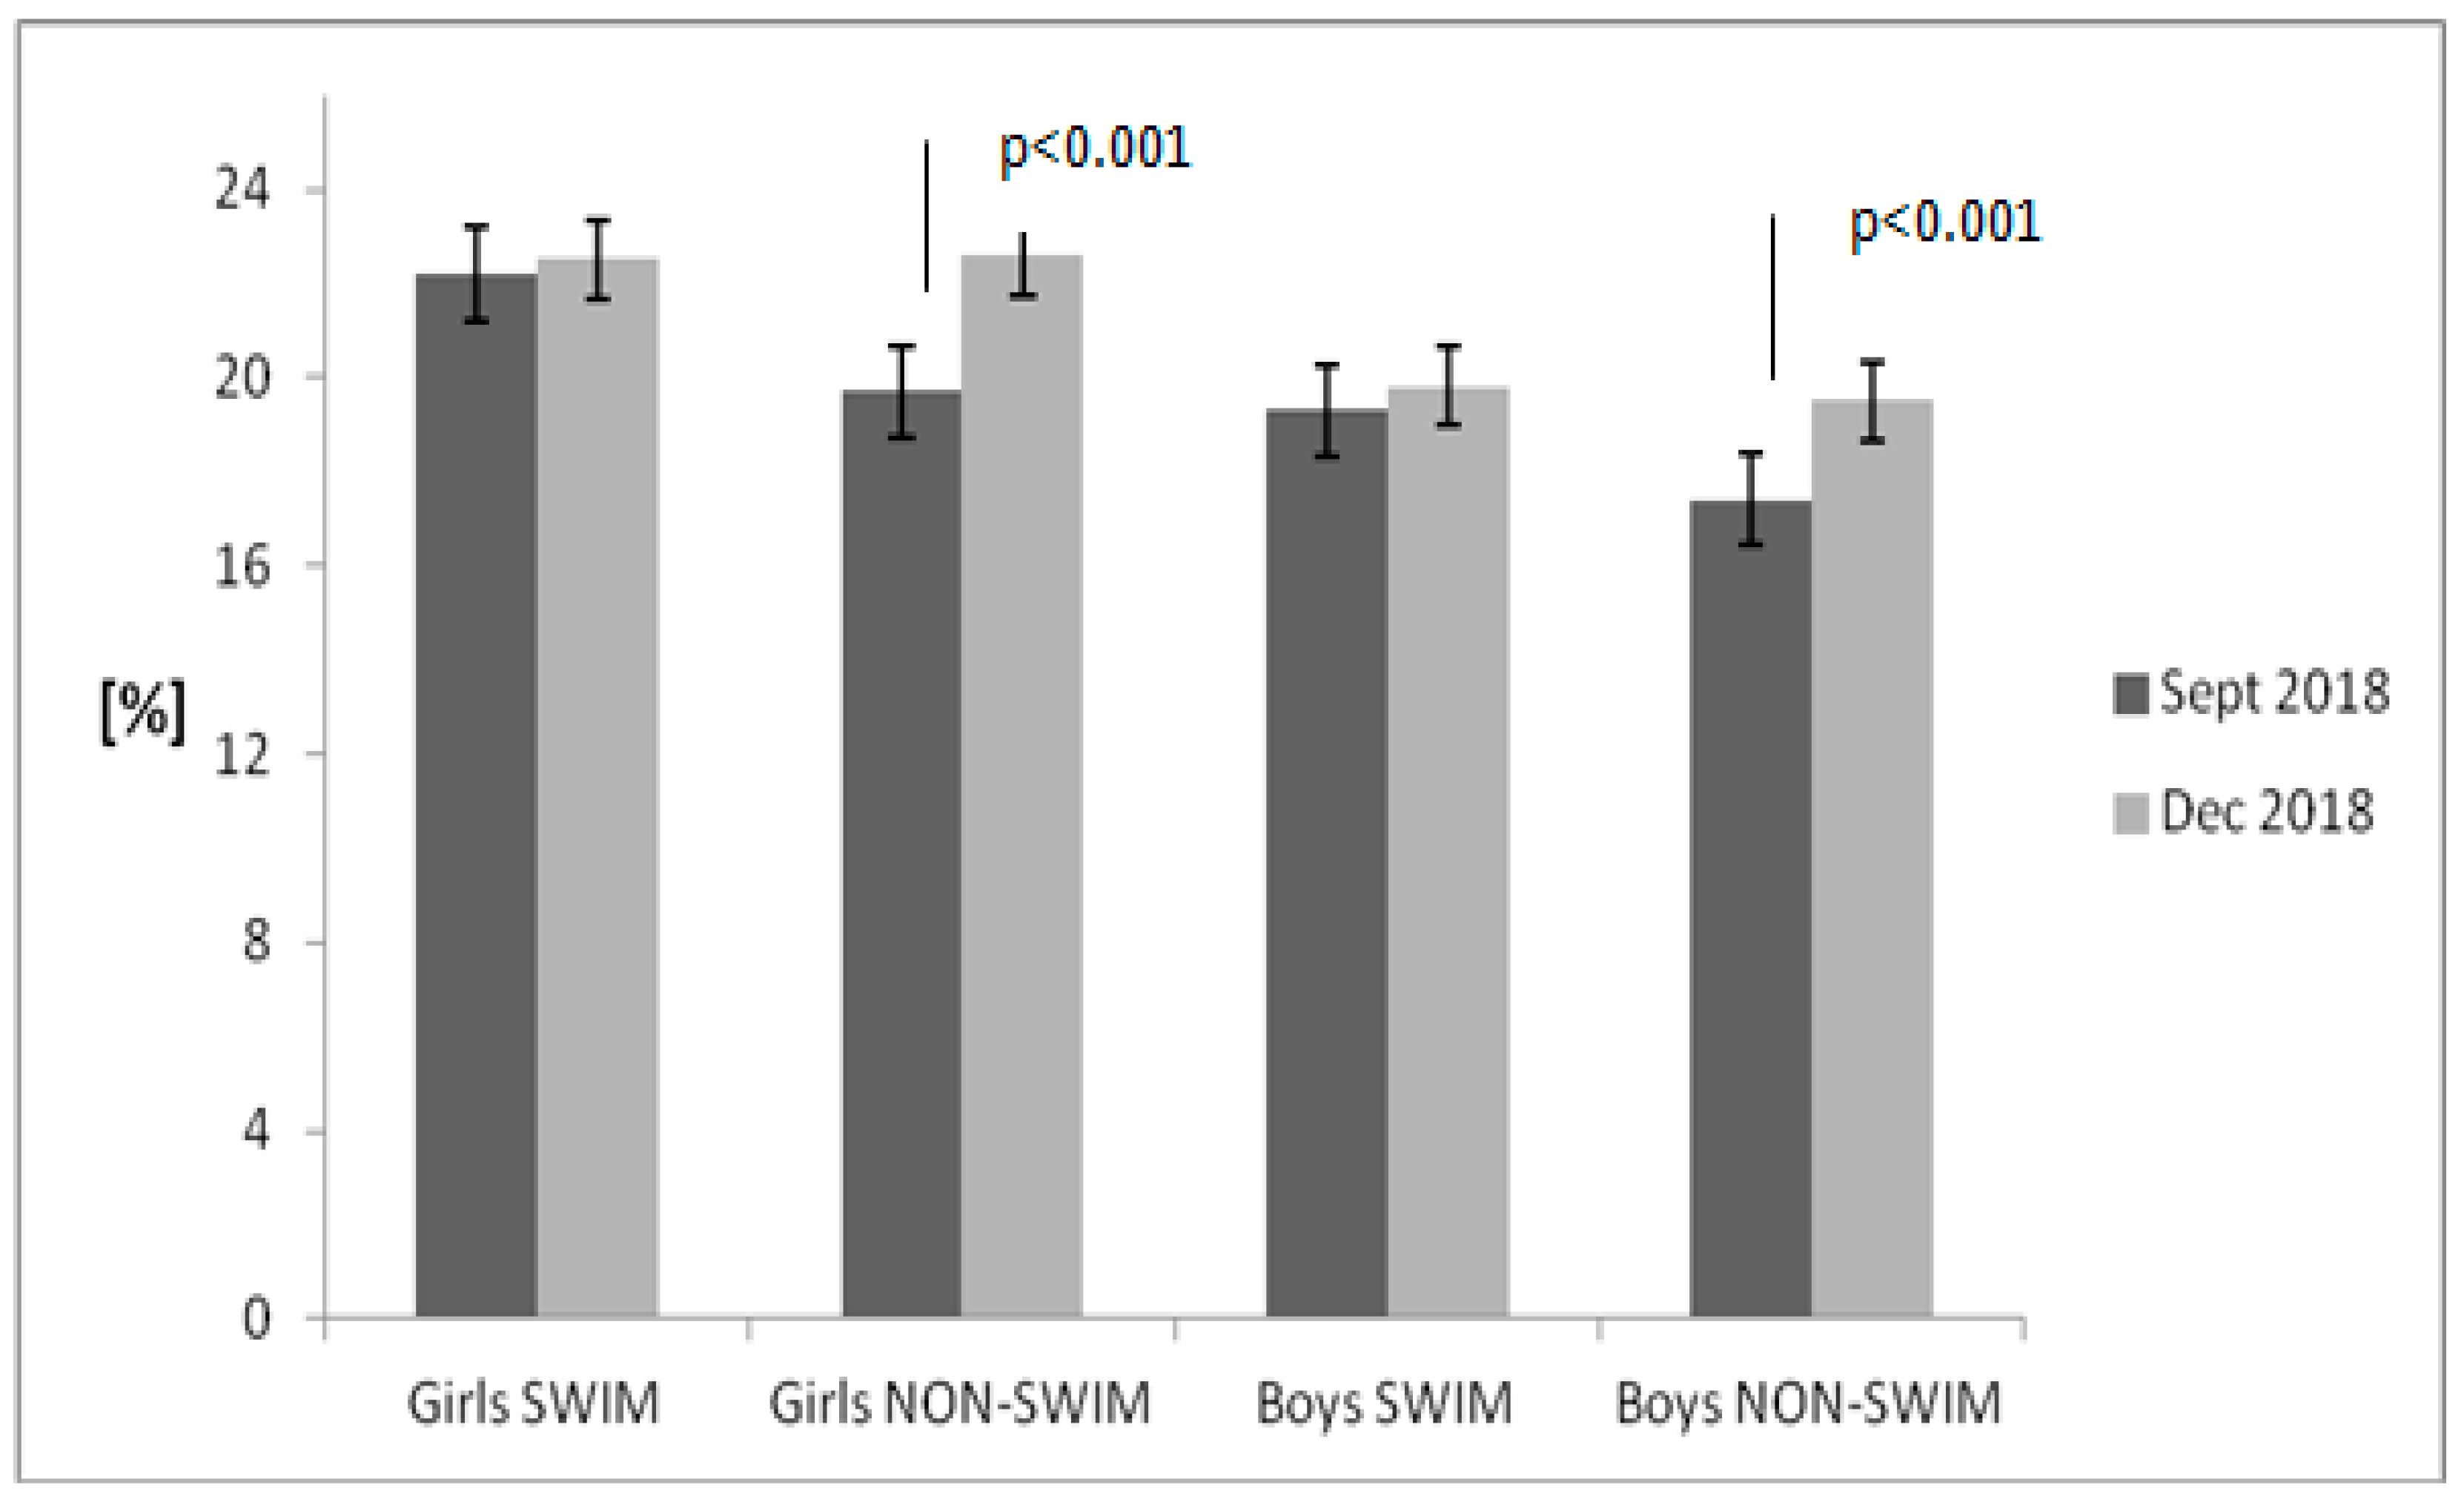
3. Results
4. Discussion
Strengths and Limitations
5. Conclusions
Author Contributions
Funding
Institutional Review Board Statement
Informed Consent Statement
Data Availability Statement
Acknowledgments
Conflicts of Interest
References
- Strong, W.B.; Malina, R.M.; Blimkie, C.J.; Daniels, S.R.; Dishman, R.K.; Gutin, B.; Hergenroeder, A.C.; Must, A.; Nixon, P.A.; Pivarnik, J.M.; et al. Evidence based physical activity for school-age youth. J. Pediatr. 2005, 146, 732–737. [Google Scholar] [CrossRef]
- Dencker, M.; Thorsson, O.; Karlsson, M.K.; Linden, C.; Wollmer, P.; Andersen, L.B. Daily physical activity related to aerobic fitness and body fat in an urban sample of children. Scand. J. Med. Sci. Sports 2008, 18, 728–735. [Google Scholar] [CrossRef]
- Ostojic, S.M.; Stojanovic, M.D.; Stojanovic, V.; Maric, J.; Njaradi, N. Correlation between fitness and fatness in 6-14-year old Serbian school children. J. Health Popul. Nutr. 2011, 29, 53–60. [Google Scholar] [CrossRef] [PubMed] [Green Version]
- Carlson, J.A.; Crespo, N.C.; Sallis, J.F.; Patterson, R.E.; Elder, J.P. Dietary-related and physical activity related predictors of obesity in children: A 2-year prospective study. Child Obes. 2012, 8, 110–115. [Google Scholar] [CrossRef] [PubMed] [Green Version]
- World Health Organization. Global Recommendations on Physical Activity for Health; WHO: Geneve, Switzerland, 2010. [Google Scholar]
- Janssen, I. Physical activity guidelines for children and youth. J. Appl. Physiol. Nutr. Metab. 2007, 32, S109–S121. [Google Scholar] [CrossRef] [Green Version]
- Kahlmeier, S.; Wijnhoven, T.M.; Alpiger, P.; Schweizer, C.; Breda, J.; Martin, B.W. National physical activity recommendations: Systematic overview and analysis of the situation in European countries. BMC Public Health 2015, 15, 133. [Google Scholar] [CrossRef] [PubMed] [Green Version]
- Ridley, K.; Olds, T.S. Assigning energy costs to activities in children: A review and synthesis. Med. Sci. Sports Exerc. 2008, 40, 1439–1446. [Google Scholar] [CrossRef] [Green Version]
- Ribeiro, E.H.C.; Guerra, P.H.; De Oliveira, A.C.; Da Silva, K.S.; Santos, P.; Santos, R.; Okely, A.; Florindo, A.A. Latin American interventions in Children and adolescents’ sedentary behavior: A systematic review. Rev. Saude Publ. 2020, 54, 59. [Google Scholar] [CrossRef]
- Aguilar-Farias, N.; Martino-Fuentealba, P.; Carcamo-Oyarzun, J.; Cortinez-O’Ryan, A.; Cristi-Montero, C.; von Oetinger, A.; Sadarangani, K.P. A regional vision of physical activity; sedentary behavior; and physical education in adolescents from Latin America and the Carribean: Results from 26 countries. Int. J. Epidemiol. 2018, 47, 976–986. [Google Scholar] [CrossRef] [PubMed] [Green Version]
- Katzmarzyk, P.T.; Denstel, K.D.; Beals, K.; Carlson, J.; Crouter, S.E.; McKenzie, T.L.; Pate, R.R.; Sisson, S.B.; Staiano, A.E.; Stanish, H.; et al. Results from the United States Report Card on Physical Activity for Children and Youth. J. Phys. Act. Health 2018, 15 (Suppl. S2), S422–S424. [Google Scholar] [CrossRef] [Green Version]
- Draper, C.E.; Tomaz, S.A.; Bassett, S.H.; Burnett, C.; Christie, C.J.; Cozett, C.; De Milander, M.; Krog, S.; Monyeki, M.A.; Naidoo, N.; et al. Results from South Africa’s 2018 Report Card on Physical Activity for Children and Youth. J. Phys. Act. Health 2018, 15 (Suppl. S2), S406–S408. [Google Scholar] [CrossRef] [Green Version]
- Ruch, N.; Melzer, K.; Mader, U. Duration, frequency and types of children’s activities: Potential of a classification procedure. J. Exerc. Sci. Fit. 2013, 11, 85–94. [Google Scholar] [CrossRef] [Green Version]
- Van Sluijs, E.M.; Skidmore, P.M.; Mwanza, K.; Jones, A.P.; Callaghan, A.M.; Ekelund, U.; Harrison, F.; Harvey, I.; Panter, J.; Wareham, N.J.; et al. Physical activity and dietary behaviour in a population-based sample of British 10-year old children: The SPEEDY study. BMC Public Health 2008, 8, 388. [Google Scholar] [CrossRef] [PubMed]
- Riso, E.M.; Kull, M.; Mooses, K.; Hannus, A.; Jurimae, J. Objectively measured physical activity levels and sedentary time in 7-9-year-old Estonian schoolchildren: Independent associations with body composition parameters. BMC Public Health 2016, 16, 346. [Google Scholar] [CrossRef] [PubMed] [Green Version]
- Jago, R.; MacDonald-Wallis, C.; Solomon-Moore, E.; Thompson, J.L.; Lawlor, D.A.; Sebire, S.J. Associations between participation in organized physical activity in the school or community outside school hours and neighbourhood play with child physical activity and sedentary time: A cross-sectional analysis of primary school-aged children from the UK. BMJ Open 2017, 7, e017588. [Google Scholar] [CrossRef] [PubMed]
- Wiium, N.; Safvenbom, R. Participation in organized sport and self-organized physical activity: Associations and developmental factors. Int. J. Environ. Res. Public Health 2019, 16, 585. [Google Scholar] [CrossRef] [Green Version]
- Roberts, C. Tanner’s Puberty Scale: Exploring the historical entanglements of children; scientific photography and sex. Sexualities 2016, 19, 328–346. [Google Scholar] [CrossRef] [Green Version]
- Yelling, M.; Lamb, K.L.; Swaine, I. Validity of a pictorial perceived exertion scale for effort estimation and effort production during stepping exercise in adolescent children. Eur. Phys. Educ. Rev. 2002, 8, 157–175. [Google Scholar] [CrossRef] [Green Version]
- Calyniuk, B.; Ambrozy, J.; Bester, J.; Czuchraj, W.; Dostal, K.; Dubiel, M. Eating habits and frequency of consumption of selected products among children aged 10–13 years residing in urban and rural areas. Ann. Acad. Med. Siles 2013, 67, 231–237. (In Polish) [Google Scholar]
- Stupnicki, R.; Tomaszewski, P.; Milde, K. Body Mass Index—Proposed norms for children and youths. Pap. Anthropol. 2013, 22, 203–213. [Google Scholar] [CrossRef] [Green Version]
- Janjic, J.; Baltic, Z.M.; Glisic, M.; Ivanovic, J.; Boskovic, M.; Popovic, M.; Lovrenovic, M. Relationship between body mass index and body fat percentage among adolescents from Serbian Republic. J. Child Obes. 2016, 1, 10. [Google Scholar] [CrossRef]
- Duarte, M.O.; Ruelas, Y.F.; Lopez-Alcaraz, F.; del Toro-Equihua, M.; Sanchez-Ramirez, C.A. Correlation between percentage of body fat measured by Slaughter equation and bio impendance analysis technique in Mexican schoolchildren. Nutr. Hosp. 2014, 29, 88–93. [Google Scholar] [CrossRef]
- Laframboise, M.A.; de Graauw, C. The effects of aerobic physical activity on adiposity in schoolaged children and youth: A systematic review of randomized controlled trials. J. Can. Chirop. Assoc. 2011, 55, 256–268. [Google Scholar]
- Ness, A.R.; Leary, S.D.; Mattocks, C.; Blair, S.N.; Reilly, J.J.; Wells, J.; Ingle, S.; Tilling, K.; Smith, G.D.; Riddoch, C. Objectively measured physical activity and fat mass in a large cohort of children. PLoS Med. 2007, 4, e97. [Google Scholar] [CrossRef] [Green Version]
- Sanchez, G.F.L.; Suarez, A.D.; Radziminski, L.; Jastrzebski, Z. Effects of a 12-week physical education program on the body composition of 10- and 11-year-old children. Sci. Sports 2017, 32, e155–e161. [Google Scholar] [CrossRef]
- De Moraes Ferrari, G.L.; Oliveira, L.C.; Araujo, T.L.; Matsudo, V.; Barreira, T.V.; Tudor-Locke, C.; Katzmarzyk, P. Moderate-to-vigorous physical activity and sedentary behavior: Independent associations with body composition variables in Brazilian children. Pediatr. Exerc. Sci. 2015, 27, 380–389. [Google Scholar] [CrossRef]
- Pastuszak, A.; Lewandowska, J.; Buśko, K.; Charzewska, J. Effects of elevated physical activity on changes in body composition and subcutaneous fat distribution in boys aged 10 to 16 years: A longitudinal study. Anthrop. Rev. 2014, 77, 45–55. [Google Scholar] [CrossRef] [Green Version]
- Kubusiak-Slonina, A.; Grzegorczyk, J.; Mazur, A. The assessment of fitness and physical activity in school children with excessive and normal weight. Endokrynol. Otylosc. 2012, 8, 16–23. (In Polish) [Google Scholar]
- Hendricks, S.; Uys, M.; Broyles, S.T.; Naidoo, N.; Katzmarzyk, P.T.; Lambert, E.V. Factors associated with team sport participation in South African children. BMJ Paediatr. Open 2019, 3, e000495. [Google Scholar] [CrossRef] [Green Version]
- Jürimäe, J.; Haljaste, K.; Cicchella, A.; Lätt, E.; Purge, P.; Leppik, A.; Jürimäe, T. Analysis of swimming performance from physical; physiological and biomechanical parameters in young swimmers. Pediatr. Exerc. Sci. 2007, 19, 70–81. [Google Scholar] [CrossRef]
- Nikitakis, I.S.; Paradisis, G.P.; Bogdanis, G.C.; Toubekis, A.G. Physiological responses of continuous and intermittent swimming at critical speed and maximum lactate steady state in children and adolescent swimmers. Sports 2019, 7, 25. [Google Scholar] [CrossRef] [PubMed] [Green Version]
- Zhao, K.; Hohmann, A.; Faber, I.; Chang, Y.; Binghong, G. A 2-year longitudinal follow-up of performance characteristics in Chinese male elite youth athletes from swimming and racket sports. PLoS ONE 2020, 15, e0239155. [Google Scholar] [CrossRef]
- Greco, C.C.; Denadai, B.S.; Pellegrinotti, I.L.; Freitas, A.B.; Gomide, E. Limiar anaeróbio e velocidade crítica determinada com diferentes distâncias em nadadores de 10 a 15 anos: Relações com a performance e a resposta do lactato sanguíneo em testes de endurance. Rev. Bras. Med. Esporte 2003, 9, 2–8. [Google Scholar] [CrossRef]
- Kapczuk, K. Elite athletes and pubertal delay. Minerva Pediatr. 2017, 69, 415–426. [Google Scholar] [CrossRef] [PubMed]
- Damsgaard, R.; Bencke, J.; Matthiesen, G.; Petersen, J.H.; Muller, J. Body proportions, body composition and pubertal development of children in competitive sport. Scan. J. Med. Sci. Sports 2001, 11, 54–60. [Google Scholar] [CrossRef] [Green Version]
- Opstoel, K.; Pion, J.; Elferink-Gemser, M.; Hartman, E.; Willemse, B.; Philippaerts, R.; Visscher, C.; Lenoir, M. Anthropometric characteristics; physical fitness and motor coordination of 9 to 11 year old children participating in a wide range of sports. PLoS ONE 2015, 10, e0126282. [Google Scholar] [CrossRef] [Green Version]
- Harris, K.C.; Kuramoto, L.K.; Schulzer, M.; Retallack, J.E. Effect of school-based physical activity intervenions on body mass index in children: A meta-analysis. CMAJ 2009, 180, 719–726. [Google Scholar] [CrossRef] [PubMed] [Green Version]
- Martinez-Gomez, D.; Ruiz, J.R.; Ortega, F.B.; Veiga, O.L.; Moliner-Urdiales, D.; Mauro, B.; Galfo, M.; Manios, Y.; Widhalm, K.; Béghin, L.; et al. Recommended levels of physical activity to avoid an excess of body fat in European adolescents: The HELENA study. Am. J. Prev. Med. 2010, 39, 2003–2011. [Google Scholar] [CrossRef]
- Reichert, F.F.; Wells, J.C.W.; Ekelund, U.; Menezes, A.M.; Victora, C.G.; Hallal, P.C. Prospective associations between physical activity level and body composition in adolescence: 193 Pelotas (Brazil) cohort study. J. Phys. Act. Health 2015, 12, 834–839. [Google Scholar] [CrossRef] [Green Version]
- Telford, R.M.; Telford, R.D.; Cochrane, T.; Cunningham, R.B.; Olive, L.S.; Davey, R. The influence of sport club participation on physical activity; fitness and body fat during childhood and adolescence: The LOOK longitudinal study. J. Sci. Med. Sport 2016, 19, 400–406. [Google Scholar] [CrossRef] [Green Version]
- Collins, A.; Ward, K.D.; Mirza, B.; Slawson, D.; McClanahan, B.; Vukadinovich, C. Comparison of nutritional intake in US adolescent swimmers and non-athletes. Health 2012, 4, 873–880. [Google Scholar] [CrossRef] [PubMed] [Green Version]


| Number of Training Sessions per Week Mean (SD) | Number of Training Hours per Week Mean (SD) | Puberty Stage (Tanner Scale) Mean (SD) | Rate of Perceived Exertion (PCERT Scale) Mean (SD) | |
|---|---|---|---|---|
| Swimmers (n = 46) | 8.2 (1.4) ** | 12.3 (2.2) ** | 2.0 (0.6) | 7.1 (0.7) ** |
| Non-swimmers (n = 42) | 3.5 (0.9) | 5.2 (1.8) | 2.0 (0.7) | 5.8 (0.8) |
Publisher’s Note: MDPI stays neutral with regard to jurisdictional claims in published maps and institutional affiliations. |
© 2021 by the authors. Licensee MDPI, Basel, Switzerland. This article is an open access article distributed under the terms and conditions of the Creative Commons Attribution (CC BY) license (https://creativecommons.org/licenses/by/4.0/).
Share and Cite
Bielec, G.; Gozdziejewska, A.; Makar, P. Changes in Body Composition and Anthropomorphic Measurements in Children Participating in Swimming and Non-Swimming Activities. Children 2021, 8, 529. https://0-doi-org.brum.beds.ac.uk/10.3390/children8070529
Bielec G, Gozdziejewska A, Makar P. Changes in Body Composition and Anthropomorphic Measurements in Children Participating in Swimming and Non-Swimming Activities. Children. 2021; 8(7):529. https://0-doi-org.brum.beds.ac.uk/10.3390/children8070529
Chicago/Turabian StyleBielec, Grzegorz, Anna Gozdziejewska, and Piotr Makar. 2021. "Changes in Body Composition and Anthropomorphic Measurements in Children Participating in Swimming and Non-Swimming Activities" Children 8, no. 7: 529. https://0-doi-org.brum.beds.ac.uk/10.3390/children8070529