Statistical Evaluation of the Perpendicularity of Boreholes in Concrete for Post-Installed Fasteners


Institute of Structural Engineering, Department of Civil Engineering and Natural Hazards, University of Natural Resources and Life Science (BOKU), Vienna 1190, Austria
*
Author to whom correspondence should be addressed.
CivilEng 2020, 1(3), 253-263; https://0-doi-org.brum.beds.ac.uk/10.3390/civileng1030016
Submission received: 8 October 2020
/
Revised: 29 October 2020
/
Accepted: 30 October 2020
/
Published: 31 October 2020
(This article belongs to the Special Issue Connections in Concrete)
Abstract
:The form and the perpendicularity of boreholes influence the ultimate behaviour of post-installed fasteners and are restricted with regard to the concrete surface to 5° in Europe and to 6° in the United States in various regulations (e.g., EAD 330232-00-0601 resp. ACI 355.2-19). It is assumed that the deviation of the borehole from the vertical axis has an effect on the load transfer behaviour of an anchorage. This article investigates on the perpendicularity of vertically downward drilled boreholes using different drilling tools considering hammer drilling, hollow drilling and diamond core drilling. It can be shown that the requirements of e.g., EAD 330232-00-0601 of a maximum deviation to the concrete surface of 5° can be fulfilled for approximately 95% of the determined values for different drilling methods. This is based on a considerable number of measurements (generated from drilled boreholes) in different concrete types. As a result, a detailed statistical evaluation is provided to describe the borehole perpendicularity by means of statistical methods.
1. Introduction
1.1. General
In all relevant technical specifications for post-installed fasteners, there are recommendations for the perpendicularity of the drill holes. In Europe for post-installed fasteners EAD 330232-00-0601 [1] and EAD 330499-00-0601 [2] a maximum aberration of ± 5° to the surface of the concrete member is recommended, whereas in the United States ACI 355.2-19 [3] allows a maximum variance of ±6° for drilled boreholes.
There are several publications dealing peripherally with this topic, such as [4,5] but the documented data are not comparable to the here shown results.
Nowadays, different drilling methods as hammer drilling with different drill bit types [6], hollow drilling and diamond drilling with different drilling tools are used for drilling the boreholes into concrete to place post-installed anchorages.
On a various number of different experimental data, this study shows on the one hand whether the required limits are met and on the other hand the statistical distribution of the aberration of drilled boreholes in different concrete specimens in a vertical downward direction.
For the first time the following article a statistical characterisation is made when the deviation of drilling holes to the perpendicular axis is made, resulting in a general probability distribution function which can be determined for this variable.
1.2. Current Status of Regulations
The harmonised technical specification EAD 330232-00-0601 [1] for post-installed anchors defines the scope in Section 1.1 by means of the following: ‘This EAD covers post-installed mechanical fasteners placed into pre-drilled holes perpendicular to the surface (maximum deviation 5°)’. EAD 330499-00-0601 [2], which is in usage for bonded anchors, shows similar regulations.
The fib bulletin 58 [7] dealing with the design of anchorages in concrete defines that the holes should be drilled perpendicular to the surface. A specification in greater detail cannot be found.
In the United States, ACI 355.2-19 [3] defines the requirements for boreholes resp. drill bits in Section 5.2.2 as follows: ‘Drill holes for anchors perpendicular (within a tolerance of ±6 degrees) to the surface of the concrete member’.
1.3. Definiton of Deviation from Perpendicularity
Drill holes are drilled as perpendicular as possible into the concrete to ensure optimal load transmission. The deviation of the drilled borehole from a perfect perpendicular direction to the concrete surface φ is defined by the positioning of the middle axis of the cylindrical shape of the drill hole to the vertical axis. Figure 1a shows this definition of the deviation φ in detail. Additionally, the total deviation of the drilling hole and as a result of the post-installed fastener itself is one of the contributions to the uncertainty which is inherent to an anchorage in concrete [8].
Under laboratory conditions, this can be achieved by the usage of a drilling rig, which is depicted exemplarily in Figure 1b. This rig enables a more or less vertical positioning of the corresponding drilling tool in relation to the concrete surface. In the considered study, most of the tests were performed without using a rig, some were rig-based drilling.
2. Materials and Methods
2.1. Drilling Tools and Methods
Drilling methods in concrete generally can be divided into rotational, impact and diamond drilling methods. Most of the methods for drilling concrete combine grinding, scraping and chiselling effects [6]. Because of the high requirements on fastening technology and the advantage of a flexible positioning, a variety of drilling systems are available. In accordance to [1,2], post-installed fasteners (which are not casted into the concrete before the installation) are based on three different working principles: (a) mechanical interlock, (b) friction and (c) bond. The drill holes themselves are drilled as the initial step of the later anchorage installation. Possible drilling methods are the impact drilling method, the hammer drilling method, the compressed air drilling method and the diamond drilling method. For these drilling methods different drilling tools can be used, having more or less impact on the concrete due to their inherent transmitted drilling energy. Some of the tools also have a rig or a circular level for a vertical positioning of the drilling tool.
The currently most used method in drilling cylindrical boreholes is hammer drilling, which induces impact forces releasing energy on the concrete surface. Hard metal drills for hammer drilling are exemplarily used as double-edged, three-edged, or four-edged drills, see Figure 2a–c. Dust is transported out of the hole via the spindle-shaped drilling bit.
Hollow drilling consists of hammer drilling (usually 2-cutting edge drill or 4-cutting edge drill) with a different drill hole cleaning. The drilling dust is not conveyed out of the borehole via a spindle, but it is sucked into the hollow shaft of the drill by a vacuum and sucked out of it at the rear end, see Figure 2d. Diamond drilling is realised as core drilling on the construction site. The working principle of diamond drilling is based on a pure rotation and a water-based cooling. The drill bit is hollow, and the tip consists of diamonds embedded into metal segments, see Figure 2e.
Various drill tool configurations were considered in the investigations conducted, as listed in Table 1. For each drilling method and each concrete class (see Section 2.2) test series of five test specimens were evaluated. Additional investigations were done for free hand drilling and rig-based drilling. The drillings were performed by the same person and drilled vertically downwards into the concrete to a drilling depth of 70–100 mm.
2.2. Concrete Strength Classes
The investigations of the drilling parameters were done in five different concrete mixtures. For each drilling configuration and diameter, test series of five specimens each were considered in the evaluation. Altogether 70 test series with at least five tests each with size Ø10 and size Ø16 were performed. The most important information about the concrete specifications is listed in Table 2, which is provided according to the manufacturer’s specifications [9] resp. [10,11].
2.3. Visualisation Method
The possibility of displaying the geometry of a borehole negative by means of 3D-scanning was already shown in a previous contribution [12]. Considering these preliminary investigations, the actual evaluation is based on a large number of test samples (n > 350) for both nominal borehole diameter sizes Ø10 and Ø16. The drilled boreholes were cleaned by vacuum cleaning and then filled with an elastic compound to create a copy of the drilled borehole. These three-dimensional negatives were scanned by a 3D-scanner eviXscan (Heavy Dutoy Quadro 3D scanner) of the company Evatronix S.A., see Figure 3a. The structured light technology provides measurement of 0.013 mm and a paint density of up to 50 pt/mm2. The scanning of one single negative of the borehole is depicted in Figure 3b. Additionally, the evaluation procedure used GOM Inspect 2019 software (GOM GmbH, Braunschweig, Germany), which inscribed a best-fit cylinder into the scatterplot scanned from the drilled borehole and referred to the reference axes, see Figure 3c. The result is the degree deviation of the axis of the cylinder from the vertical direction with reference to the concrete surface as a horizontal plane. Further detailed information on the visualisation method is provided in [13].
3. Test Results and Statistical Evaluation
3.1. General Overview of the Test Results
As a result of the evaluation of the scans, the angle φ as a measure for the deviation of the drill hole from the vertical axis is depicted in Figure 4 as random absolute value. Within this picture, no distinction between rig-based drilling methods and those without rig is made in a first step. The following evaluation in the Section 3.3, 3.4 and 3.5 might address a difference in the behaviour.
As can easily be seen in Figure 4, out of a total of 352 samples, 333 test results are below the limit of ±5° to the vertical direction, which corresponds to a value of 95%.
A numerical overview of the determined aberrations in vertical direction based on the absolute values is provided in Table 3.
3.2. Transformation of Data in the Cartesian Plane and Proof of Normal Distribution
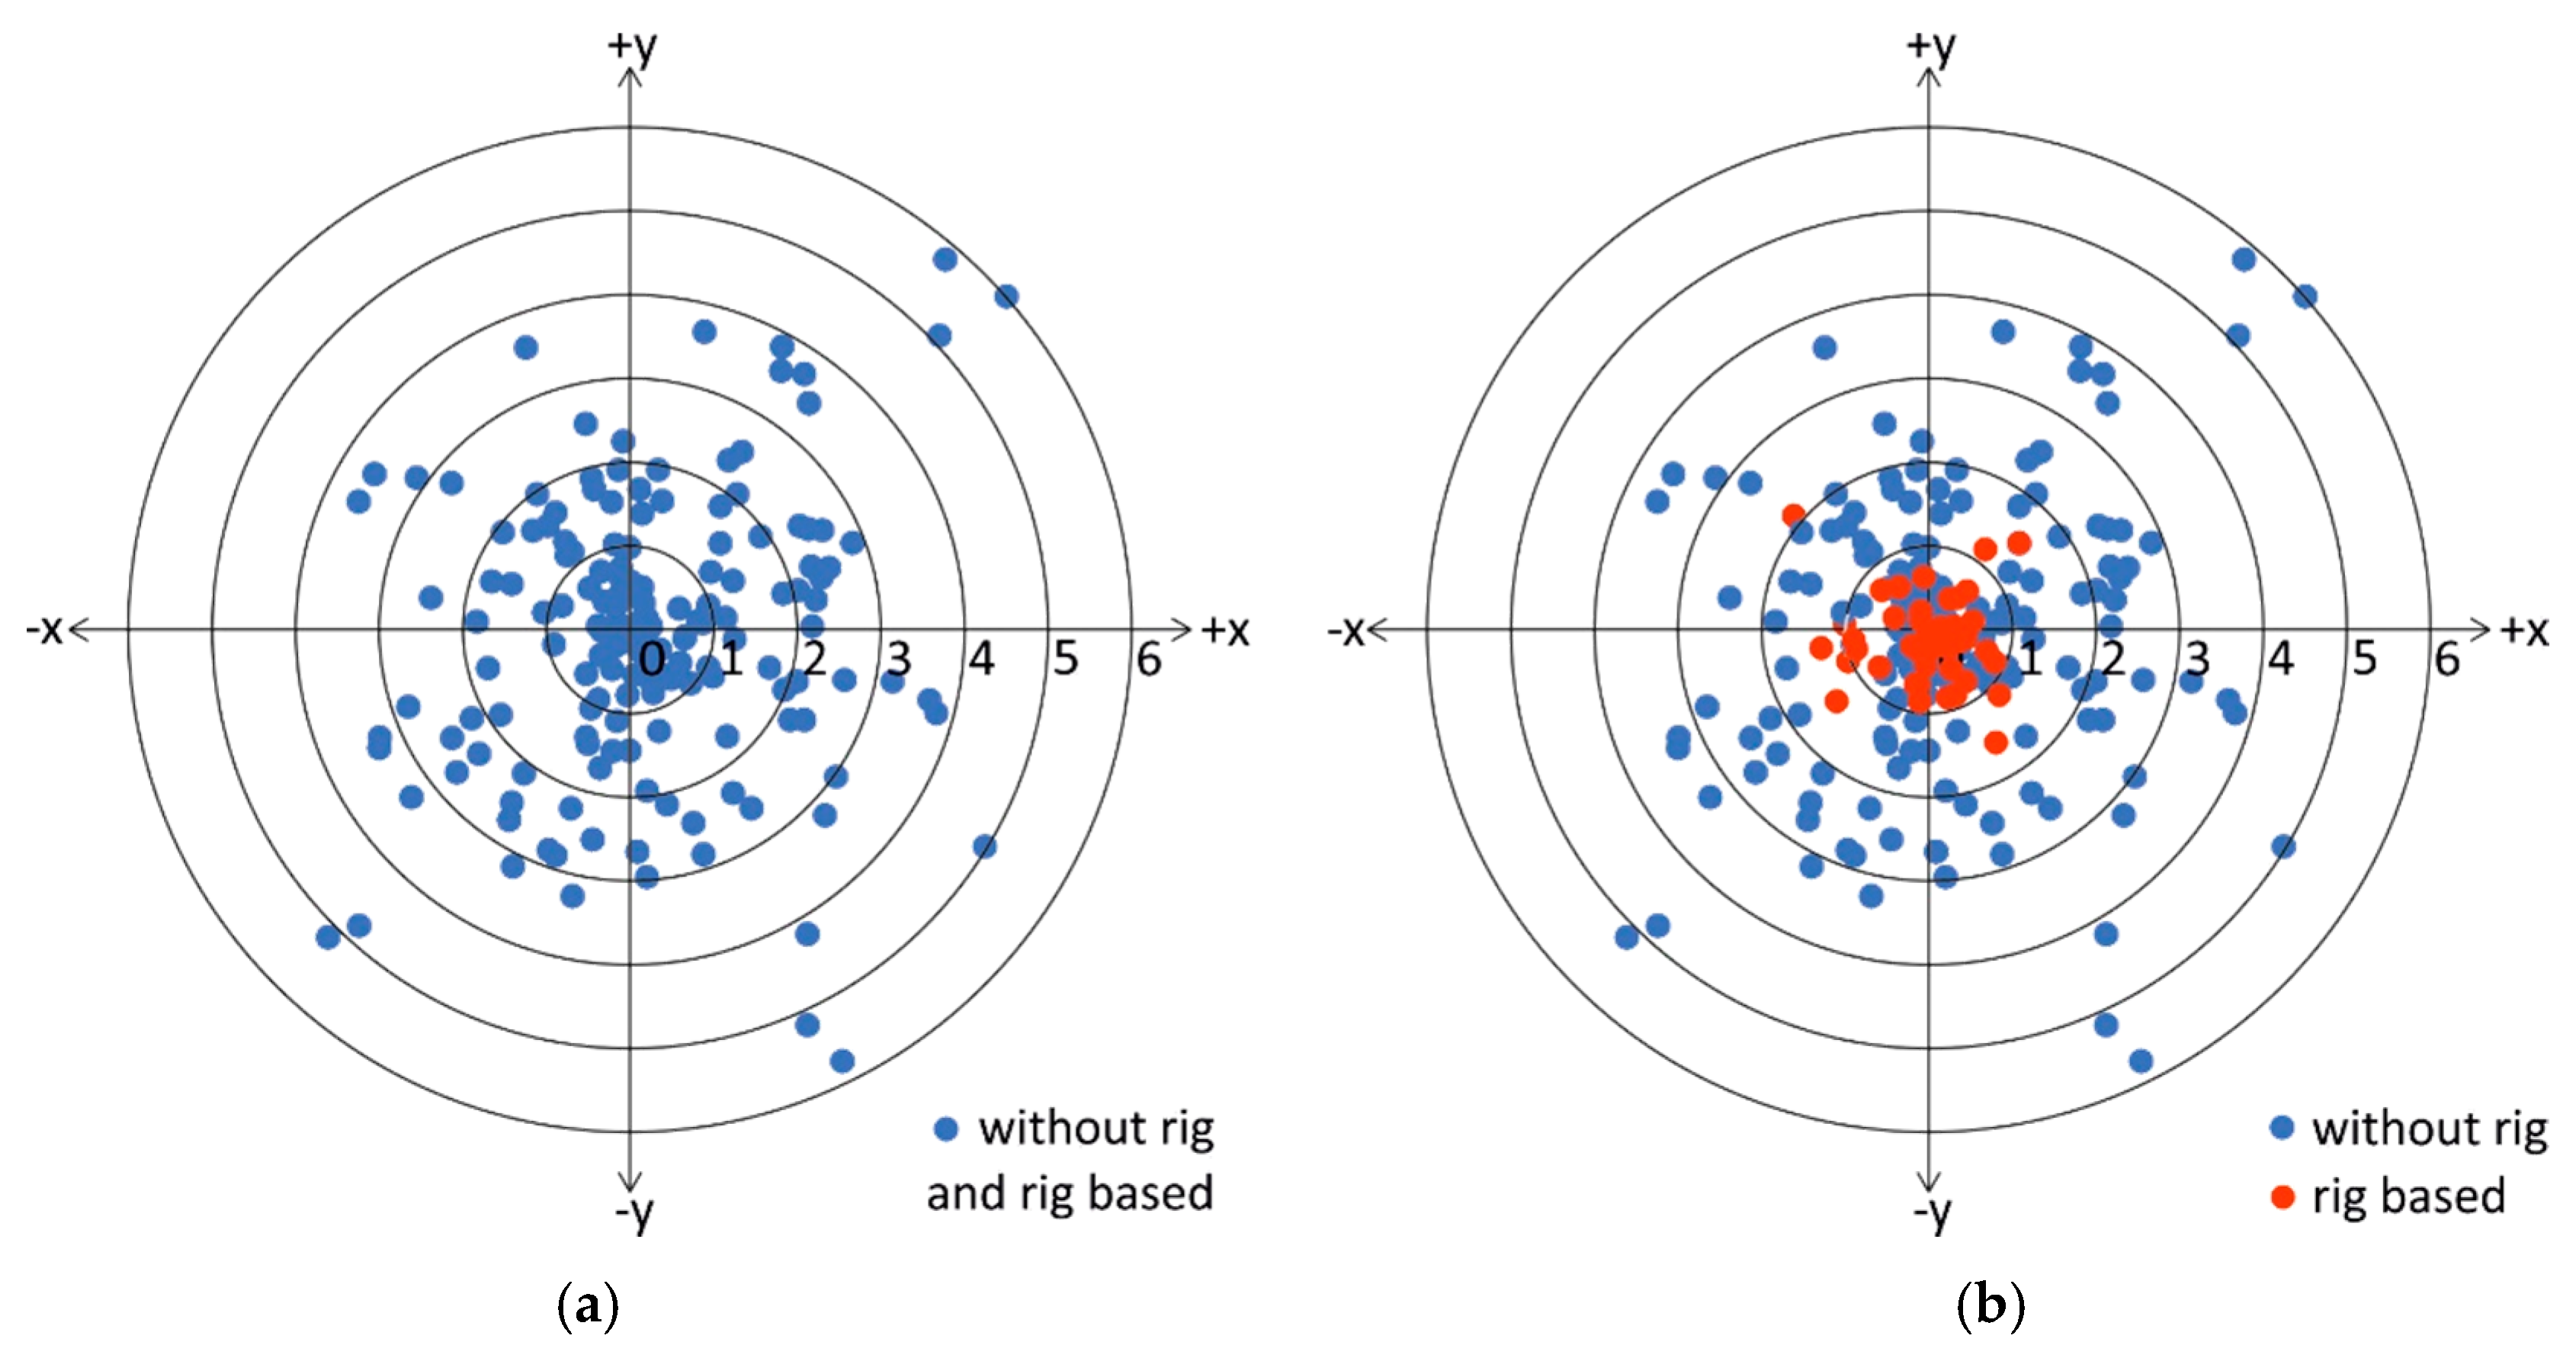
The obtained test results for the angle φ from Figure 4 are within the polar plane. In a first step they must be transformed to a Cartesian plane for proving the assumptions of a normal distribution, which is valid for the distance of the single values surrounding the centre of a fixed target. This must be done to prove the usability of the provided statistical Rayleigh-distribution in Section 3.3 and Section 3.4. As a preliminary condition, the values in the cartesian plane (x, y) must follow a normal distribution [14].
Calculating random numbers between the values 0° ≤ α ≤ 360°, they are considered as following for the determination of the Cartesian coordinates:
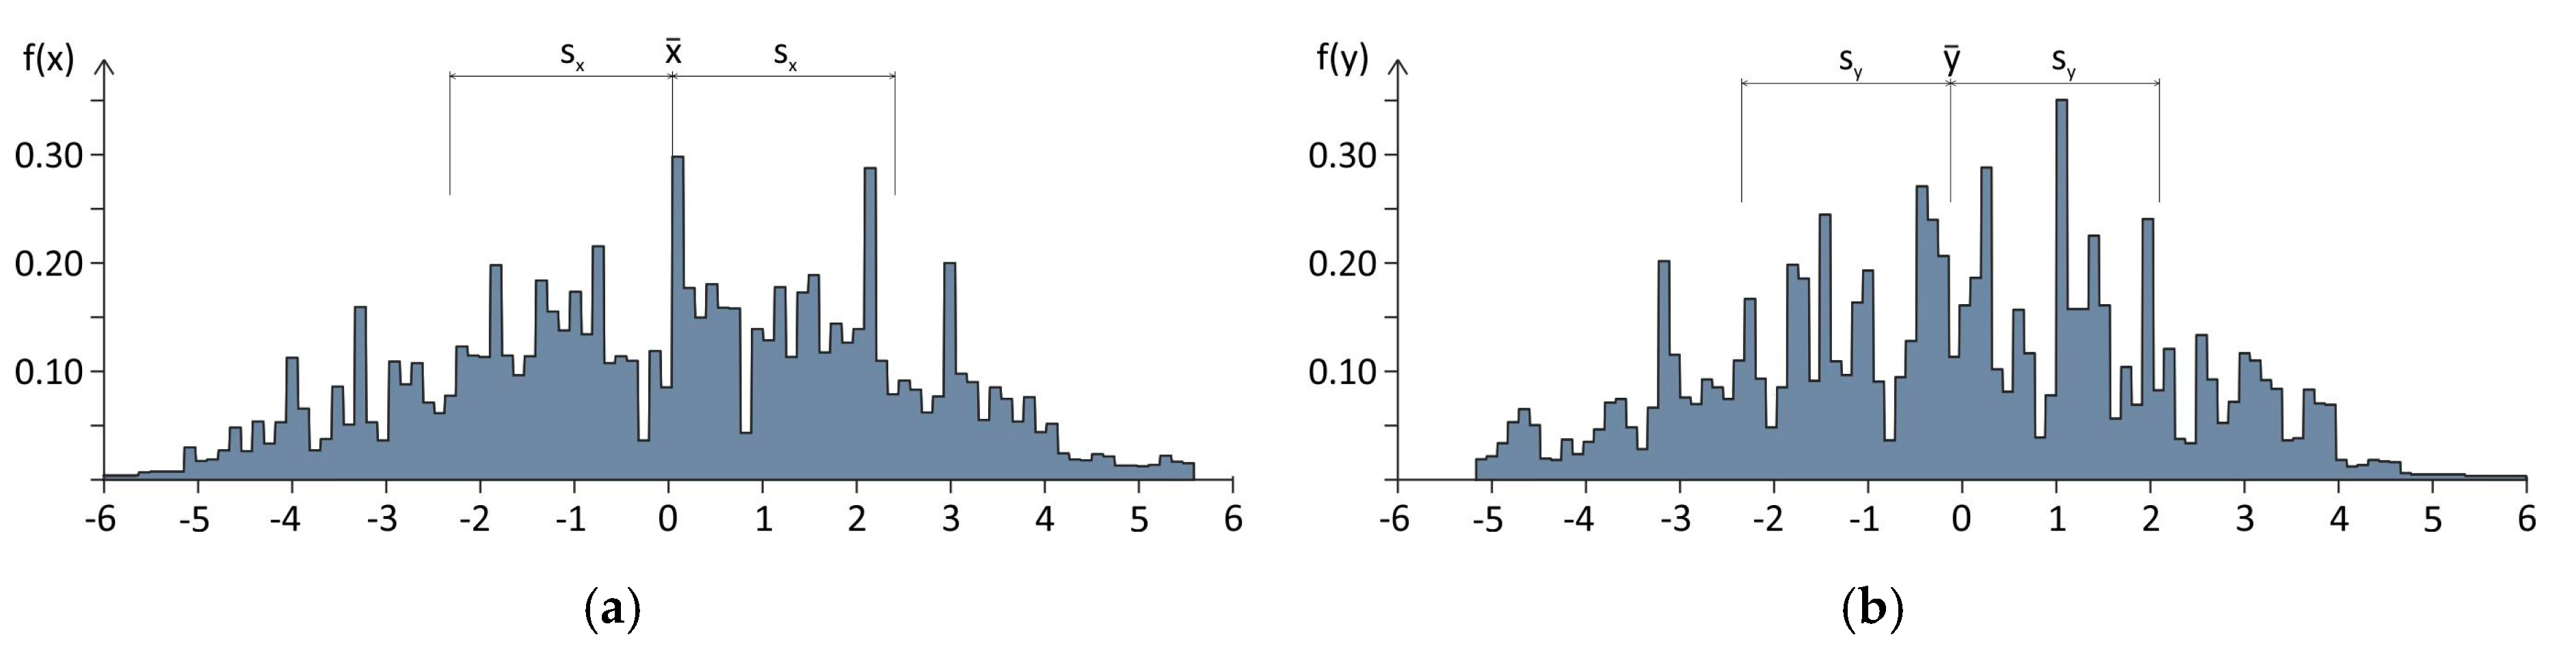
The data based on the Cartesian coordinates are shown in Figure 5 on the principle of calculations using equally distributed random numbers generated by the software MS Excel. Since an equal distribution reflects the random distribution of the angle φ between 0 and 360 degrees best, this distribution was considered as suitable for this case. The values for the deviations (angle φ) in the Cartesian plane (x, y) are shown in Figure 6 in vertical bars of the frequency distribution, separately for the x-value and the y-value, as determined from Equations (1) and (2). These histograms show the validity of the assumption of a normal distribution for the spreading of the x- and the y-values. For both coordinate distributions a data fitting degree of more than 0.5 can be reached.
3.3. Statistical Description of the Data
In a first step in Section 2.2, the normal distribution based on the Cartesian plane was proven, see Figure 6. Within this section, the data are discussed within the polar plane, describing the determined angle by the absolute value of the vector |φ|, as proposed in [14].
The combined probability distribution function for the x-values and y-values can be determined as shown in Equation (3), and the random distance φ → z is calculated in accordance with Equation (4).
As a result, the distribution function for the variable φ → z is derived from the above equations as provided in Equation (5).
Therefore, if Equations (1) and (2) are considered for the transformation of the variables x and y, and the integration in the Cartesian plane over the whole circular surface defined by is seen as equivalent to the integration in the polar plane, if the following conditions are fulfilled:
Hence, the distribution function for the random distance φ → z can be derived as the distribution function of a Rayleigh-Distribution as defined in Equation (8).
Based on this theoretical function, the following statistical information is provided [14].
cumulative distribution function (CDF)
probability density function (PDF)
standard deviation
(maximum likelihood estimator)
expected value (estimator)
3.4. Empirical Relative Frequency Distribution
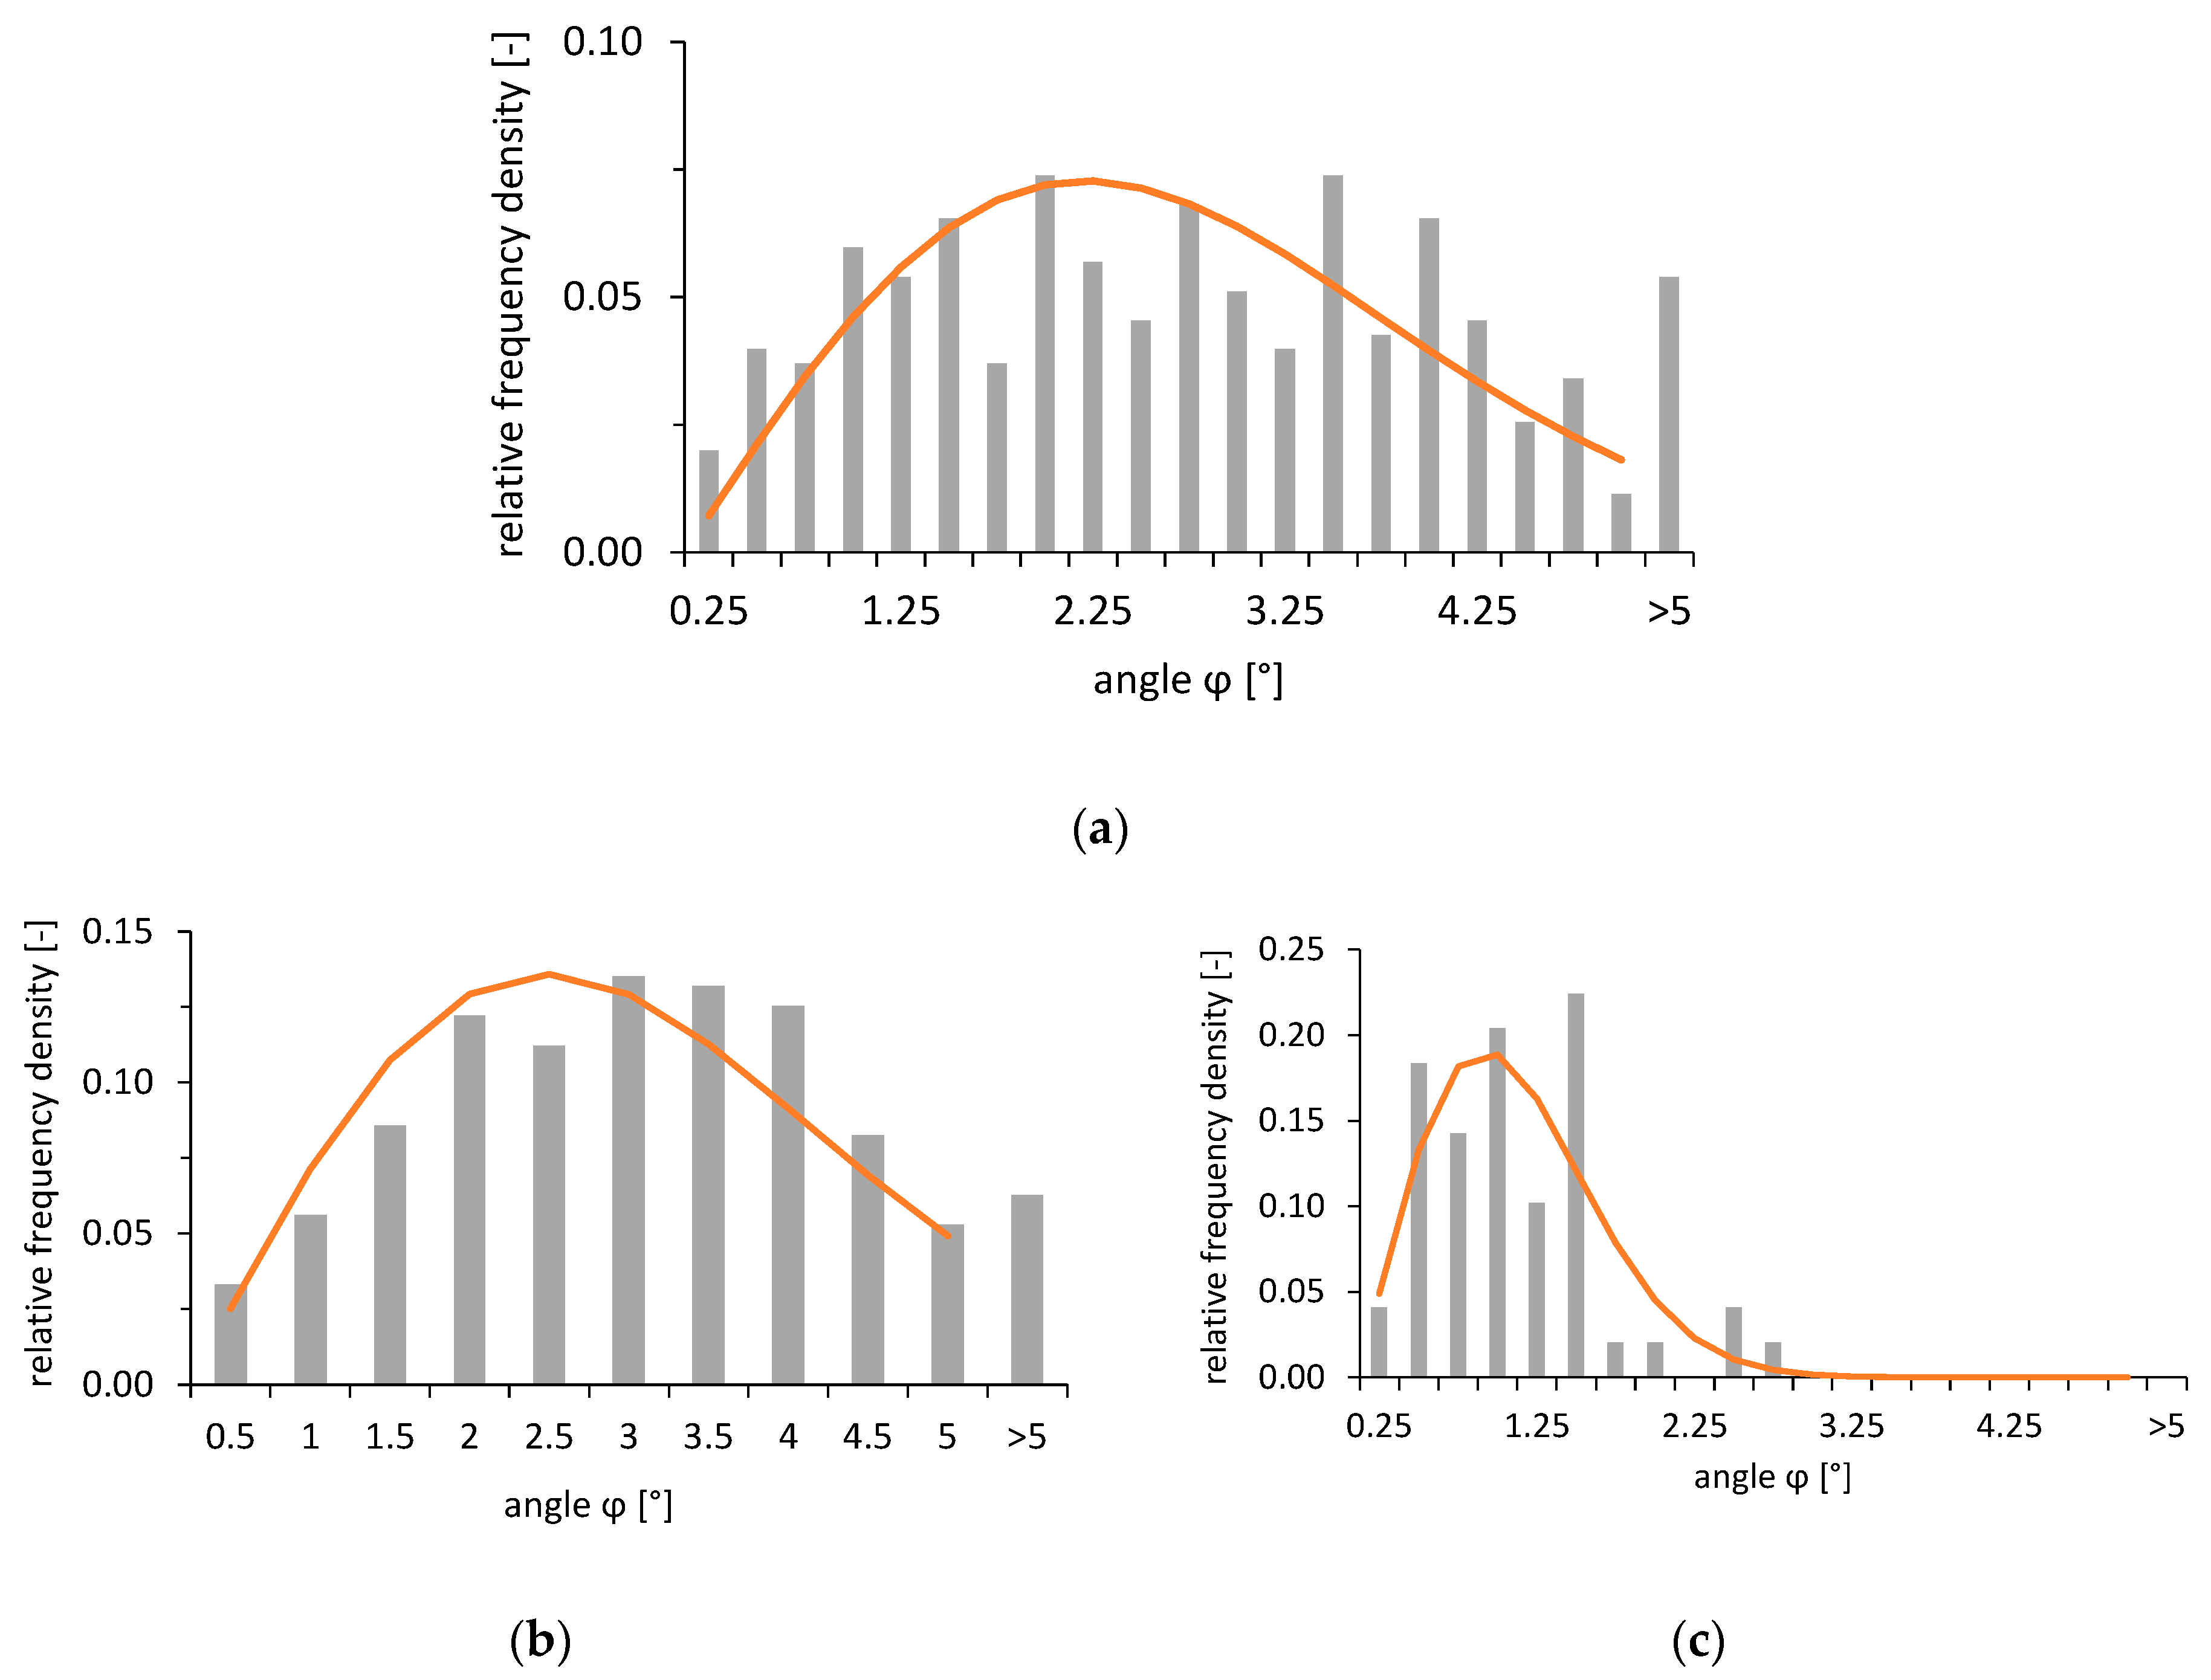
For a statistical estimation, the raw data of the deviations from the vertical axis (angle φ) were interpreted empirically by grouping and determining the empirical relative frequency distribution by displaying vertical bar graphs. The bar graphs are presented in Figure 7a for all the considered angles (free hand and rig-based drilled boreholes) as derived from Figure 5a. Figure 7b shows the boreholes drilled without any rig, whereas Figure 7c depicts the tests performed with rigs. Both the relative densities based on the bar graphs and the resulting frequencies in each individual class are shown in Figure 7.
The empirical frequency density (density function in Figure 7) is calculated based on Equation (9), which is transferred to a class-based calculation as shown in Equation (13) and shows high conformity to the empirical values (grey bars in Figure 7). The relative empiric frequencies are presented in non-cumulative form (coloured line in Figure 7). In the following Equation (13), φi is the central value of the single class and k the absolute value of the class width.
For the combined evaluation of the free hand drilled holes without rig and rig-based drilled holes, only a determination coefficient of the empiric frequency density function to the empirical values of cd ≈ 0.5 is obtained. For the separate evaluation of drilling methods, values for cd ≈ 0.8 can be reached. Therefore, it appears that the values from free hand drilling and rig-based drilling may not be considered in the same combined statistical evaluation as they do not originate from the same basic population.
3.5. Probability Density Function and Cumulative Distribution Function
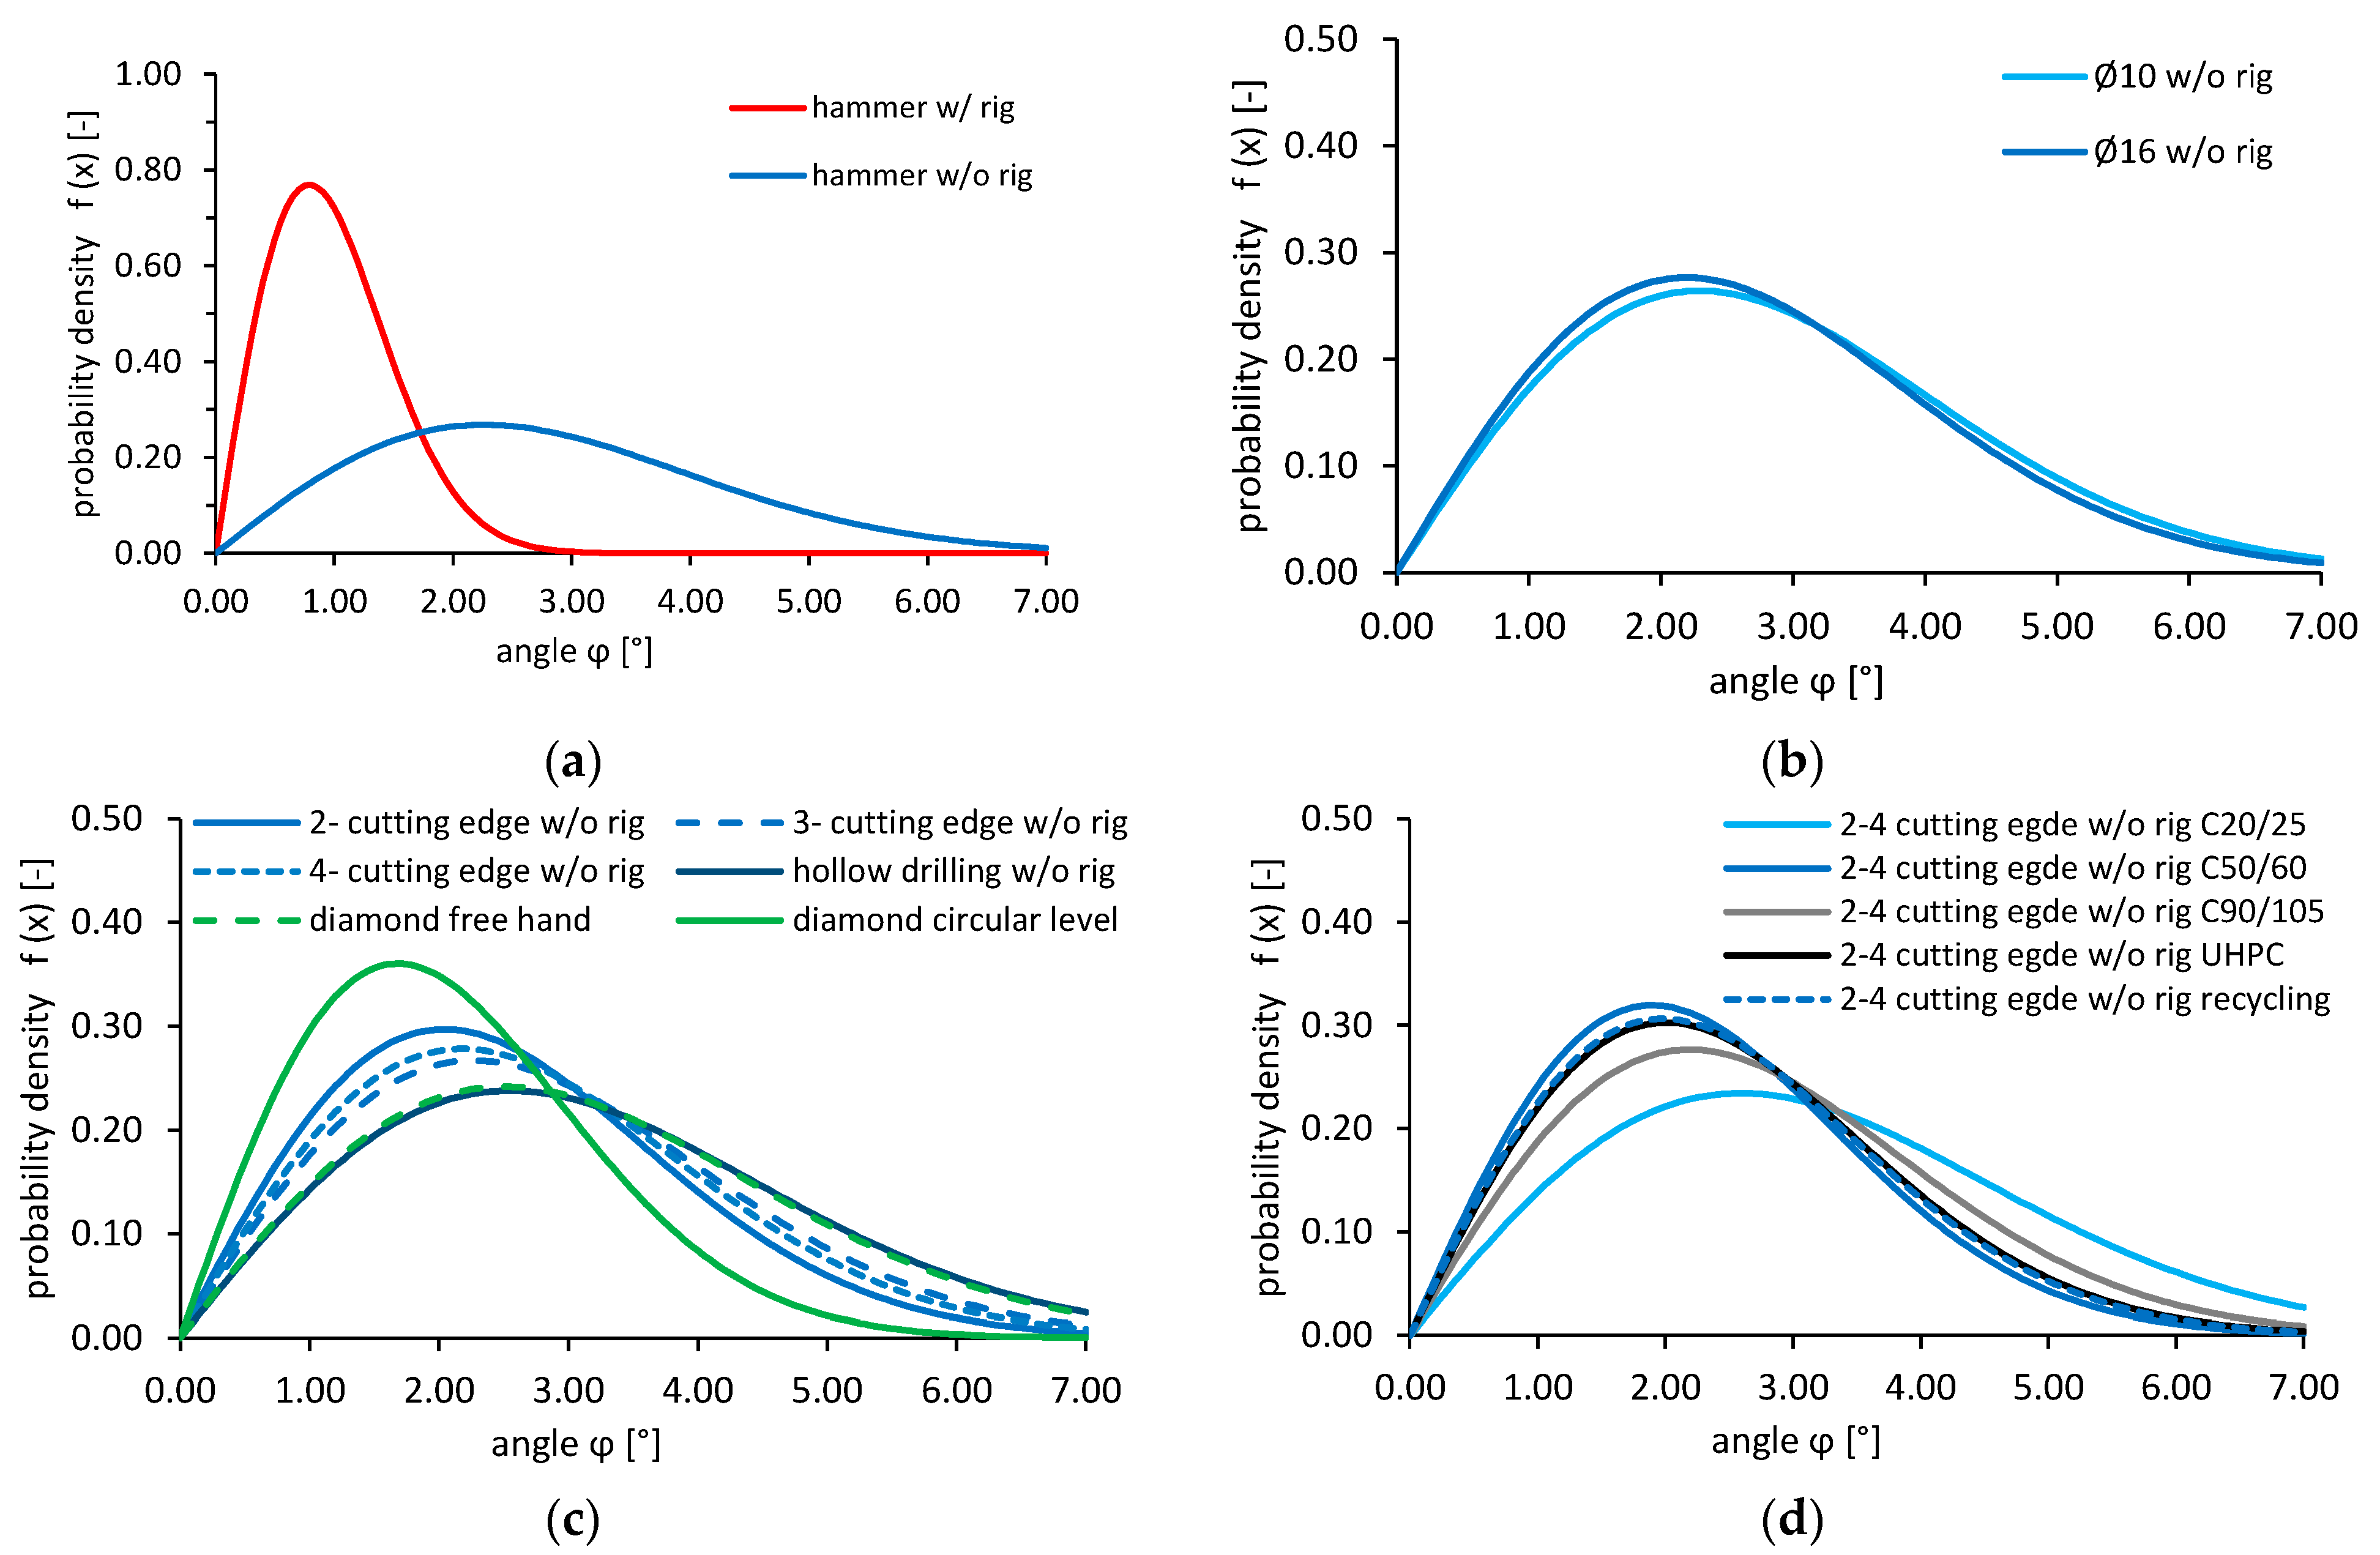
By means of the statistical derivation provided in Section 3.3, the statistical distributions based on a Rayleigh-Distribution can be formulated based on the determined values for the deviation from the vertical axis (angle φ), as listed in Table 4 and shown in Figure 8 for different configuration concerning free hand and rig-based drilling, drilling methods, sizes and concrete strength classes.
The depicted probability density function (PDF) in Figure 8 for the variable φ → z as shown in Equation (10) (Section 3.3) is deduced from the standard deviation as a maximum likelihood estimator in accordance with Equation (11) and the expected value E(φ) estimator in accordance with Equation (11). In Figure 8 the description w/o rig denominates free hand drilling, whereas w/rig denominates rig-based drilling.
As can be derived from the results in Table 4, there is a significant difference between the density functions for rig-based drilling and free hand drilling, see both density functions in Figure 8a. No significant difference is visible for both considered sizes Ø10 and Ø16 as depicted in Figure 8b.
The behaviour of different drilling methods is shown in Figure 8c. As pointed out there, the different drilling tools for hammer drilling (2-/3- and 4-cutting edge) behave comparably. Hollow drilling and free hand diamond drilling show a similar deviation to the perpendicular axis. As can clearly be seen, diamond drilling with circular level results in a density function which is different to the other drilling methods.
Figure 8d depicts the influence of the concrete type on the deviation (angle φ) of the drilled boreholes. Obviously, all considered concretes behave similarly except for the lowest concrete strength C20/25, which seems to cause slightly higher deviation angles φ of the boreholes.
4. Discussion and Conclusions
The relevant technical specifications for post-installed fasteners recommend maximum values for the deviation for the perpendicularity of the drilling holes (±5° resp. ±6°).
This paper uses a large number of samples to show how an evaluation of the perpendicularity of vertically downward drilled holes can be developed. Different drilling methods—as hammer drilling with 2-cutting, 3-cutting and 4-cutting-edges, hollow drilling and two types of diamond drilling tools (with using a circular level and without)—have been investigated. Additionally, a separate investigation using a drilling rig for hammer drilling has been conducted.
The statistical reflection shows that a formal derivation can be made based on a non-negative Rayleigh-Distribution with determination coefficients up to cd ≈ 0.8.
Summarizing, the following findings can be stated, considering that all test results were performed under laboratory conditions:
- (1)
- It can be proven that the regulations specified in the relevant documents EAD 330232-00-0601 [1] resp. EAD 330499-00-0601 [2] (deviation of ±5 from the surface of the concrete member) can be proven for 95% of the considered samples for a not inconsiderable number of test specimens drilled vertically downwards.
- (2)
- The Rayleigh-Distribution can be fitted with a determination coefficient of 0.8, if rig-based drilling and free hand drilling are evaluated separately.
- (3)
- There is a significant difference between the density functions for rig-based drilling and free hand drilling as shown in the evaluated tests.
- (4)
- No difference in the evaluation of the deviation (angle φ) can be derived from considering different sizes of drill holes.
- (5)
- Hammer drilling with different shapes of the drillers (2-cutting, 3-cutting, 4-cutting) results in a similar behaviour in the resulting deviation (angle φ) to the perpendicular axis and can be evaluated together.
- (6)
- Hollow drilling and free hand diamond drilling show similar deviation to the perpendicular axis on the basis of a Rayleigh-Distribution.
- (7)
- Diamond drilling with a circular level shows a slightly different behaviour, i.e., lower values for the angle φ.
It is still an open issue whether there is a different behaviour in the statistical deviation of the angle φ when the boreholes are drilled horizontally, vertically upwards, or even in an inclined manner. This should be the subject of ongoing research.
Other open research questions include whether the influence of different people drilling, different manufacturers and other sizes of drills can be determined.
Differences between laboratory conditions and drilling out in the field are also not considered in this article. The results of this article should be verified under real conditions.
Author Contributions
Conceptualisation, O.Z. and M.S.; methodology, O.Z. and M.S.; software, J.S. and M.S.; validation, O.Z., M.S. and J.S.; formal analysis, O.Z., M.S. and J.S.; investigation, O.Z., M.S. and J.S.; resources, K.B. and O.Z.; data curation, J.S. and M.S.; writing—original draft preparation, O.Z. and M.S.; writing—review and editing, O.Z., M.S. and K.B.; visualisation, J.S., O.Z. and M.S.; supervision, K.B.; project administration, O.Z. and M.S.; funding acquisition, K.B. All authors have read and agreed to the published version of the manuscript.
Funding
This research received no external funding.
Acknowledgments
The authors want to express their gratitude to the company Evatronix S.A. for the technical support in performing the 3D-scans. Also, thanks to company WESTCAM for providing the evaluation software licence.
Conflicts of Interest
The authors declare no conflict of interest.
References
- European Organisation for Technical Assessment. EAD 330232-00-0601: Mechanical Fasteners for Use in Concrete; European Commission: Brussels, Belgium, 2016. [Google Scholar]
- European Organisation for Technical Assessment. EAD 330499-00-0601: Bonded Fasteners for Use in Concrete; European Commission: Brussels, Belgium, 2017. [Google Scholar]
- American Concrete Institute. Qualification of Post-Installed Mechanical Anchors in Concrete and Commentary; American Concrete Institute: Farmington Hills, MI, USA, 2019. [Google Scholar]
- Unterweger, R. Experimentelle und numerische Untersuchungen zum Tragverhalten von Chemischen Verankerungen. Master’s Thesis, Universität für Bodenkultur, Wien, Austria, 1999. [Google Scholar]
- Schunnesson, H. Drill Process Monitoring in Percussive Drilling. A Multivariate Approach to Data Analysis. Licentiate Thesis, Luleå University of Technology, Luleå, Sweden, 1990. Available online: http://ltu.diva-portal.org/smash/get/diva2:990596/FULLTEXT01.pdf (accessed on 29 October 2020).
- Prüfgemeinschaft Mauerbohrer e. V. Available online: www.pgm-online.org/ (accessed on 29 October 2020).
- Fib Bulletin 58. Design of Anchorages in Concrete. Guide to Good Practise; International Federation for Structural Concrete: Lausanne, Switzerland, 2011; p. 282. ISBN 978-2-88394-098-7. [Google Scholar]
- Zeman, O.; Schwenn, M.; Bergmeister, K. Uncertainty of Measurement and Their Influence on Essential Characteristics of Post-Installed Fasteners. Beton Stahlbetonbau 2018, 113, 201–209. [Google Scholar] [CrossRef]
- Rau-Betonfertigteilwerk GmbH &, Co. KG: Beton Montageplatten C20/25, C50/60, C90/105—Rezeptur, Lieferschein und Prüfzeugnisse zu Auftrag; Rau-Betonfertigteilwerk GmbH & Co.: Ebhausen, Germany, 2018. [Google Scholar]
- Schwenn, M.; Voit, K.; Zeman, O.; Bergmeister, K. Post-installed mechanical fasteners in high strength and ultra-high strength performance concrete. Civ. Eng. Des. 2019, 1, 161–167. [Google Scholar] [CrossRef]
- Dengg, F.; Zeman, O.; Voit, K.; Bergmeister, K. Fastening application in concrete using recycled tunnel excavation material. Struct. Concr. 2017, 19, 374–386. [Google Scholar] [CrossRef]
- Schwenn, M.; Lamplmair, S.; Zeman, O.; Bergmeister, K. Innovative Bohrverfahren und ihr Einfluss auf die Beschaffenheit und Geometrie von Bohrlöchern. Bautechnik 2017, 94, 829–841. [Google Scholar] [CrossRef]
- Schorn, J. 3D-Analyse der Geometrie und Beschaffenheit von Bohrlöchern; Universität für Bodenkultur, Masterarbeit: Wien, Austria, 2020. [Google Scholar]
- Beichelt, F. Stochastik für Ingenieure; B.G. Teubner: Stuttgart, Germany, 1995. [Google Scholar]
Figure 1.
Definition of the axis φ and the drilling rig. (a) Definition of the deviation to the perpendicular axis (angle φ); (b) drilling rig for rig-based drilling.
Figure 1.
Definition of the axis φ and the drilling rig. (a) Definition of the deviation to the perpendicular axis (angle φ); (b) drilling rig for rig-based drilling.

Figure 2.
Examples of hammer drilling bits: (a) 2-cutting edge drill; (b) 3-cutting edge drill; (c) 4-cutting edge drill; (d) hollow drill bit; (e) diamond core bit.
Figure 2.
Examples of hammer drilling bits: (a) 2-cutting edge drill; (b) 3-cutting edge drill; (c) 4-cutting edge drill; (d) hollow drill bit; (e) diamond core bit.

Figure 3.
(a) Used 3D-scanner eviXscan, (b) original of scanned negative of drilled borehole, (c) definition of reference plane and reference axis of the borehole.
Figure 3.
(a) Used 3D-scanner eviXscan, (b) original of scanned negative of drilled borehole, (c) definition of reference plane and reference axis of the borehole.

Figure 4.
Scatter diagram of the determined absolute values of the angle.

Figure 5.
Values of the deviations (angle φ) in the Cartesian plane (x, y): (a) all values, (b) distinguished between without rig and rig-based.
Figure 5.
Values of the deviations (angle φ) in the Cartesian plane (x, y): (a) all values, (b) distinguished between without rig and rig-based.

Figure 6.
Empirical frequency distribution (histograms) of the deviation (angle φ) in the Cartesian plane (x, y), class width of 1/8°: (a) the x-values and (b) y-values.
Figure 6.
Empirical frequency distribution (histograms) of the deviation (angle φ) in the Cartesian plane (x, y), class width of 1/8°: (a) the x-values and (b) y-values.

Figure 7.
Empirical relative frequency distribution (histograms in grey) and the calculated empiric frequency density function (coloured line) of the deviation (angle φ). (a) All drilled holes (without rig and rig-based), class width = 0.25°, n = 352, cd = 0.5); (b) drilled holes without rig, class width = 0.5°, n = 303, cd = 0.8; (c) drilled holes rig-based, class width = 0.25°, n = 49, cd = 0.8.

Figure 8.
Probability density function of the deviation (angle φ) of the drilled boreholes in different configurations. (a) PDF of hammer drilled holes with and without using rig using hammer drilling 2-cutting edge; (b) PDF of drilled holes without using rig of sizes Ø10 and Ø16; (c) PDF of drilled holes without using rig of different drilling methods (all concretes); (d) PDF of drilled holes without using rig of different concretes (all drilling methods).


Table 1.
Overview of used drilling methods.
| Drilling Method | Edge | Additional Parameter | Nominal Drilling Diameter |
|---|---|---|---|
| Hammer drilling | 2-cutting | free hand drilling | Ø10, Ø16 |
| 2-cutting | rig-based drilling | Ø10, Ø16 | |
| 3-cutting | free hand drilling | Ø10, Ø16 | |
| 4-cutting | free hand drilling | Ø10, Ø16 | |
| Hollow drilling | 2-cutting | free hand drilling | Ø10, Ø16 |
| Diamond drilling | core drilling | free hand drilling with circular level | Ø10, Ø16 |
| Diamond drilling | core drilling | free hand drilling | Ø10, Ø16 |
Table 2.
Overview of tested concrete mixtures.
| Concrete Mixture | Age [d] | fc,test,cube,150 [N/mm2] | Additional Information |
|---|---|---|---|
| C20/25 | 420 | 31.7 | CEM I 32.5 R, GK16 |
| C50/60 | 415 | 69.8 | CEM I 42.5 R, GK16 |
| C90/105 | 424 | 125.9 | CEM I 52.5 R, GK16 |
| UHPC | 491 | 185.2 | CEM I 42.5 R, Microsilica, steel fibre reinforced 1) |
| Recycling concrete | 2092 | 34.1 | CEM II 42.5 N, GK32 aggregates made of tunnel excavation material 2) |
Table 3.
Overview of the test results.
| Drilling Method | Number of Tests | Arithmetic Mean Value [°] | Min. Value [°] | Max. Value [°] |
|---|---|---|---|---|
| all drilling methods | 352 | 2.6 | 0.1 | 6.6 |
| free hand drilling | 303 | 2.9 | 0.1 | 6.6 |
| rig-based drilling | 49 | 1.0 | 0.2 | 2.5 |
Table 4.
Parameters of the probability density functions following a Rayleigh-Distribution for different configurations.
Table 4.
Parameters of the probability density functions following a Rayleigh-Distribution for different configurations.
| Drilling Method | Edge | Additional Parameter | E(φ) | |
|---|---|---|---|---|
| Hammer drilling | 2-cutting | free hand drilling | 2.9 | 2.3 |
| 2-cutting | rig-based drilling | 1.0 | 0.8 | |
| 3-cutting | free hand drilling | 2.8 | 2.3 | |
| 4-cutting | free hand drilling | 2.7 | 2.2 | |
| Hollow drilling | 2-cutting | free hand drilling | 3.2 | 2.5 |
| Diamond drilling | core drilling | free hand drilling with circular level | 2.1 | 1.7 |
| Diamond drilling | core drilling | free hand drilling | 3.1 | 2.5 |
| Hammer drilling | 2-/3-/4-cutting | free hand drilling all concrete types | 2.8 | 2.3 |
| free hand drilling C20/25 | 3.2 | 2.6 | ||
| free hand drilling C50/60 | 2.4 | 1.9 | ||
| free hand drilling C90/105 | 2.7 | 2.2 | ||
| free hand drilling UHPC | 2.5 | 2.0 | ||
| free hand drilling Recycling concrete | 2.5 | 2.0 | ||
| Hammer drilling | 2-/3-/4-cutting | only Ø10 | 2.9 | 2.3 |
| only Ø16 | 2.8 | 2.2 |
Publisher’s Note: MDPI stays neutral with regard to jurisdictional claims in published maps and institutional affiliations. |
© 2020 by the authors. Licensee MDPI, Basel, Switzerland. This article is an open access article distributed under the terms and conditions of the Creative Commons Attribution (CC BY) license (http://creativecommons.org/licenses/by/4.0/).
Share and Cite
MDPI and ACS Style
Zeman, O.; Schwenn, M.; Schorn, J.; Bergmeister, K. Statistical Evaluation of the Perpendicularity of Boreholes in Concrete for Post-Installed Fasteners. CivilEng 2020, 1, 253-263. https://0-doi-org.brum.beds.ac.uk/10.3390/civileng1030016
AMA Style
Zeman O, Schwenn M, Schorn J, Bergmeister K. Statistical Evaluation of the Perpendicularity of Boreholes in Concrete for Post-Installed Fasteners. CivilEng. 2020; 1(3):253-263. https://0-doi-org.brum.beds.ac.uk/10.3390/civileng1030016
Chicago/Turabian StyleZeman, Oliver, Michael Schwenn, Josef Schorn, and Konrad Bergmeister. 2020. "Statistical Evaluation of the Perpendicularity of Boreholes in Concrete for Post-Installed Fasteners" CivilEng 1, no. 3: 253-263. https://0-doi-org.brum.beds.ac.uk/10.3390/civileng1030016