Material-Dependent Shear Capacity of Threaded Rods


Department of Civil Engineering, University of Kaiserslautern, Paul-Ehrlich-Straße 14, 67663 Kaiserslautern, Germany
*
Author to whom correspondence should be addressed.
CivilEng 2020, 1(3), 351-367; https://0-doi-org.brum.beds.ac.uk/10.3390/civileng1030022
Submission received: 29 September 2020
/
Revised: 17 November 2020
/
Accepted: 30 November 2020
/
Published: 18 December 2020
(This article belongs to the Special Issue Connections in Concrete)
Abstract
:Currently, the determination of the shear capacity of post installed adhesive anchors is already included in the current standardization and approval documents. Considering that EAD 330499-00-0601 allows for determining the shear resistance of a fastener only based on the characteristic steel ultimate tensile strength determined from the material tensile tests, and without considering the actual ductility of the material used, this leads to a severe underestimation of the actual steel shear resistance. In order to efficiently determine the shear strength by calculation based on material characteristics, tensile and shear tests were carried out on metallic threaded rods and rebars to show their correlation with the material properties. A new correlation between tensile and shear strength is presented, which is based on the plasticity module and allows a good prognosis of the shear strength.
1. Introduction
The approval of a new post installed injection anchor is time consuming and expensive. The approval as such is based almost exclusively on the results of approval tests. The design of the approval procedure is based on several years of research, the results of which can be found in approval documents such as Technical Reports (TRs) or European Assessment Documents (EADs). A review of the last few years alone shows the major progress in transforming European Technical Approval Guidelines (ETAGs) into EADs or TRs. At this stage, several changes have already been made to the test procedures, and explanations have been added. Nevertheless, there are still some open questions regarding the determination of steel shear resistance of injection anchors. Determination of shear resistance in accordance with the current standard [1] and [2] is recorded in the test description of the test series V1 which offers two alternative options:
- performing at least five shear tests with the fastening elements in concrete;
- calculating shear tensile strength using Equation (1).
The load-bearing behavior of the fastening elements in concrete has been researched since the beginning of the 20th century. In the 1930s, B.F. Friberg [3,4] applied the approach of beams on elastic foundations to describe the load-bearing behavior of fasteners. Later, the fundamental failure mechanisms were described by Paulay [5]. Following further experimental and theoretical research [6,7,8,9], the simplified Equation (1) finally found its application in fastening technology. Shear resistance is defined by the reduction of tensile strength with the reduction factor .
The first option allows for determining the shear resistance of a connection node of a structural system. This is particularly advantageous when a complex load-bearing mechanism, such as shear connectors for a full-depth precast deck panel system [10,11], is examined. The determination of the pure steel shear resistance is influenced by the surrounding concrete and composite mortar. The compressive strength of concrete strongly influences the compressive stresses that can be absorbed in the top of the concrete [9,12]. The mortar properties influence the axial bond strength between anchor and concrete. High bond stresses can reduce the shear resistance of the fastener [13], because of the overlap of additional tensile stresses caused by the transverse displacement of the anchor [14]. The tensile resistance of the injection anchor is directly dependent on the mortar properties and the embedment depth. If the embedment depth in the concrete is insufficient, this can lead to a rear concrete pryout or even to pull-out or pull-through.
The second option allows for determining the characteristic shear resistance with a comparatively lower effort using only a few tensile tests. According to Equation (1), the adhesive itself does not influence shear resistance. Commercially available threaded rods are often used as anchors because the manufacturing processes and the material parameters for the threaded rods are standardized. This enables the application of Equation (1).
The studies of Grosser [15] have already shown the dependence of the reduction factor of the threaded rods on their tensile strength .
Unpublished test results [16] confirm that the reduction factor suggested in [1,2] for threaded rods can be applied as a first approximation to the safer side. In the standards of steel construction and fastening technology, Equation (1) is used as the basis for determining the characteristic steel shear resistance . Nevertheless, the information on the reduction factor varies depending on the standards. This is illustrated in Table 1.
At this point, it must also be noted that the comparison with the theoretical value according to Hubert–Mises does not take place here, because this theory does not allow large plastic shear distortions: “With plastic deformations, stress always remains at the elastic limit” [23] (p. 588).
In summary, the maximum shear strength of threaded rods must be dependent on at least one other material parameter in addition to tensile strength. Based on the shear and tensile tests, we found a new correlation to estimate the shear strength of threaded and reinforcing steels based on their material properties.
2. Materials and Methods
To compare the steel properties of threaded bars and reinforcing bars, five different steel grades were used: 4.8, 5.6, 8.8, A4/70 and B500 B. To demonstrate the influence of the shape factor, the investigations were carried out on several bar diameters (see Table 2).
2.1. Method—Plasticity Module
The modulus of elasticity is known to be an indispensable measurement parameter in civil engineering, and the basis for deformation calculations and the determination of the resulting stress states in the elastic or elastic–plastic stress state of the material. Shear strength of individual anchors in fastening technology is determined based on plastic material failure by either determining the shear stress as a result of practical shear tests in concrete, or theoretically according to Equation (1).
According to Equation (1), the shear stress of a threaded rod depends on tensile stress . This material dependence is defined by the reduction factor . It is assumed here that the value of the reduction factor depends on at least one additional steel parameter. Observing the mechanisms of plastic deformations allows for the identification of such a parameter.
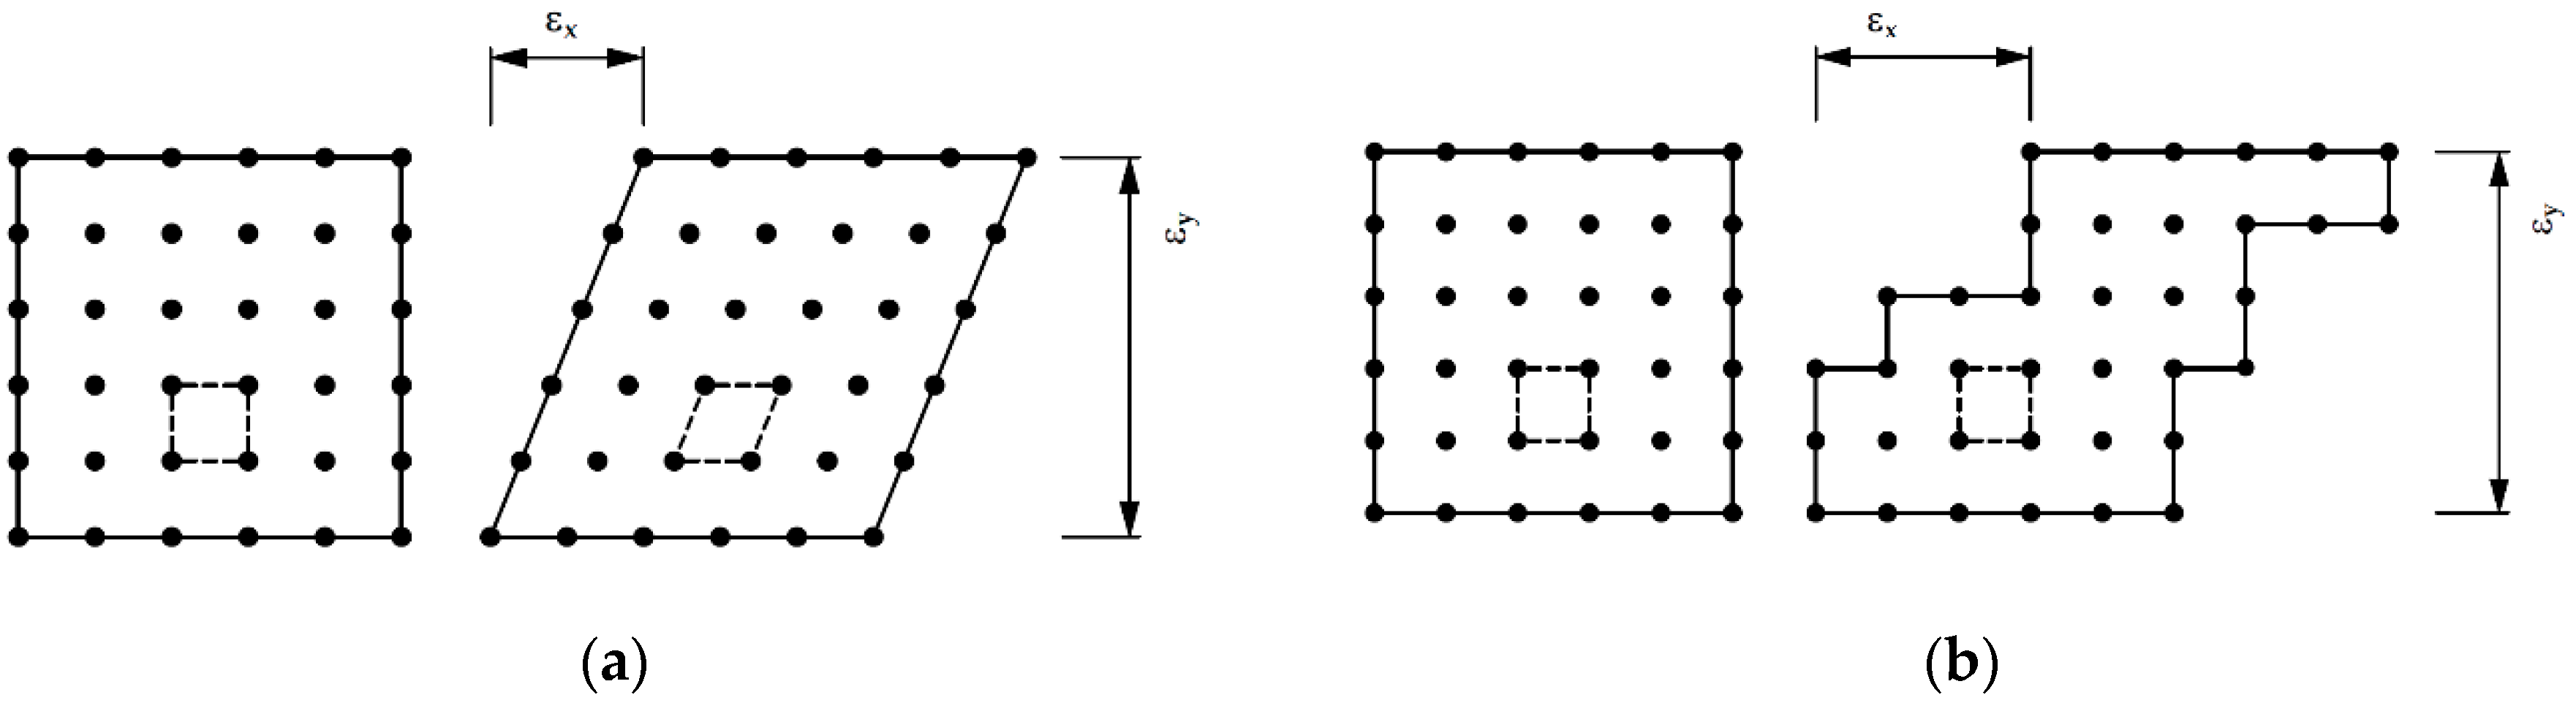
Microscopic examination reveals a crystalline structure of most metals. In the case of elastic deformation, the crystal must change its atomic structure. The crystal structure is retained during plastic deformation, while the outer shape is simultaneously changed [24]. The change of the atomic structure is illustrated in Figure 1.
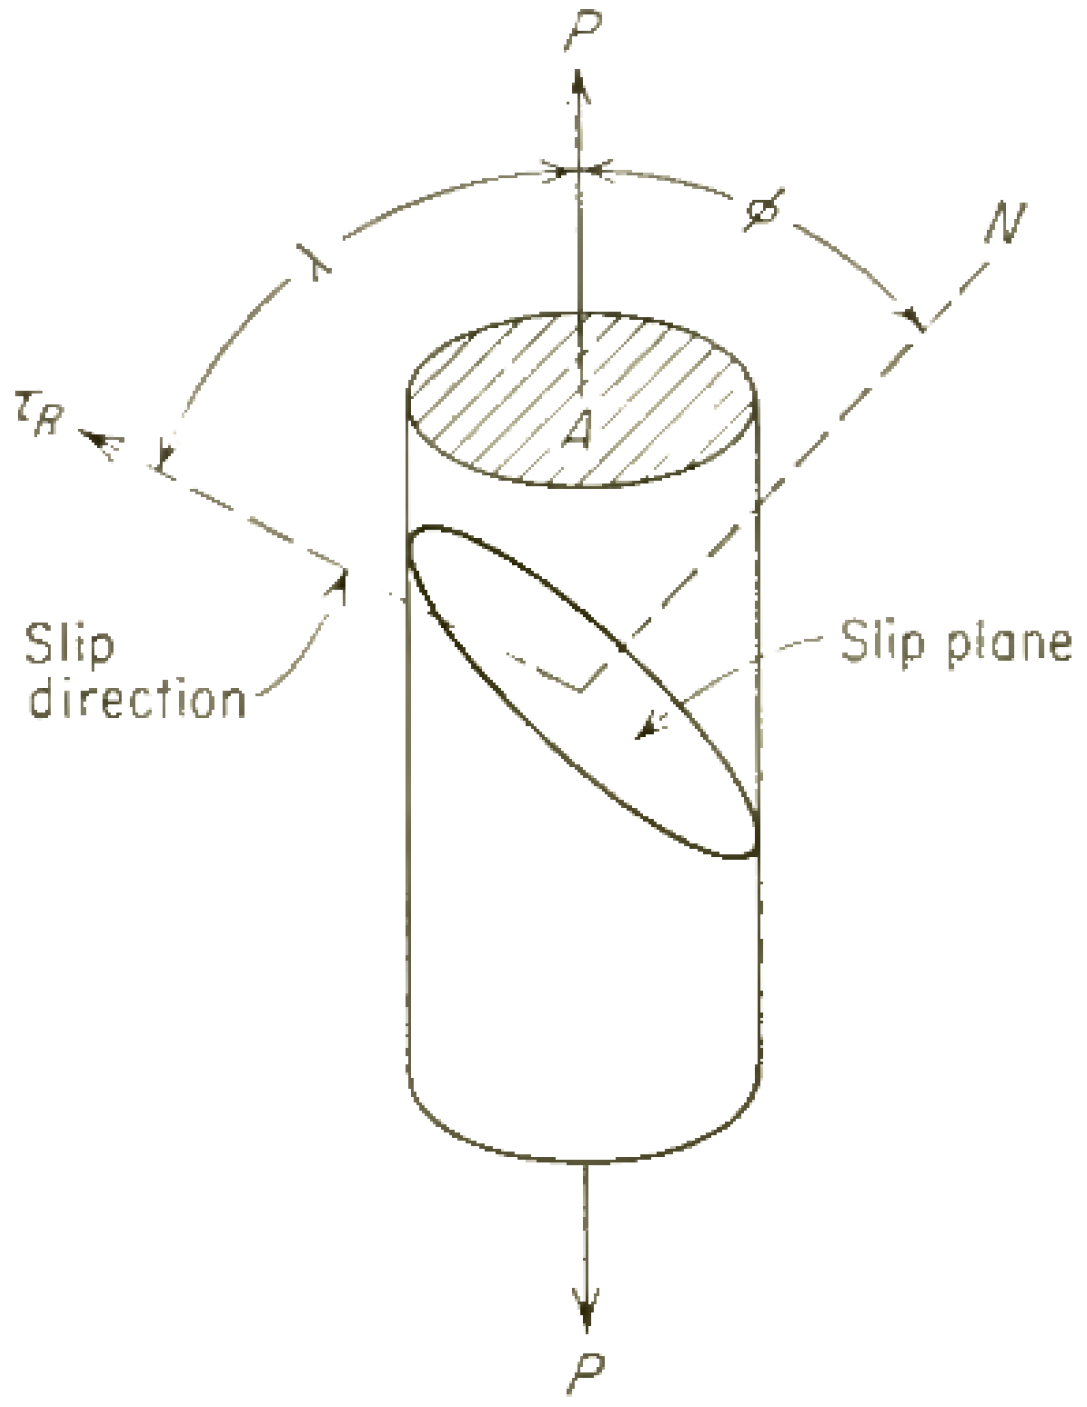
The dislocation motion between the atoms causes the formation of slip systems (slip plane or slip lines) in the atomic structure. The beginning of plastic flow resulting from tensile and shear stresses also characterizes the beginning of the dislocation movement. The Schmidian stress law according to Equation (2) states that when tensile stress is applied, the resulting shear stress in the slip system decides the dislocation movement and not the applied tensile stress [25] (p. 228). The geometrical relations of Equation (2) are shown in Figure 2.
The magnitude of the resulting shear stress describes the shear stress in the slip system which is critical for the origin of the dislocation movement. An extensive description of the physical processes can be found in the literature [24,25,26].
Based on this knowledge, an ideal failure free model can be imagined in which a shear failure is key. With regard to dislocation movements in slip systems, the maximum shear stress can be determined directly in a shear test. Thus, Equation (2) can be idealized and simplified as follows:
The position and orientation of the slip plane in the considered material remain unknown at first. However, they can be described by a positional change function of the atoms during shear loading both at microscopic and macroscopic levels. The position change function is the change in distance of the atoms relative to the original position (), which can be approximately measured as strains during a tensile test. It is assumed here that the maximum tensile stress thus describes the maximum shear stress dependent on the material strains . The real level of tensile stresses is due to the many different strengthening mechanisms. The dislocation movement mechanisms make a significant contribution to the increase in strength [27].
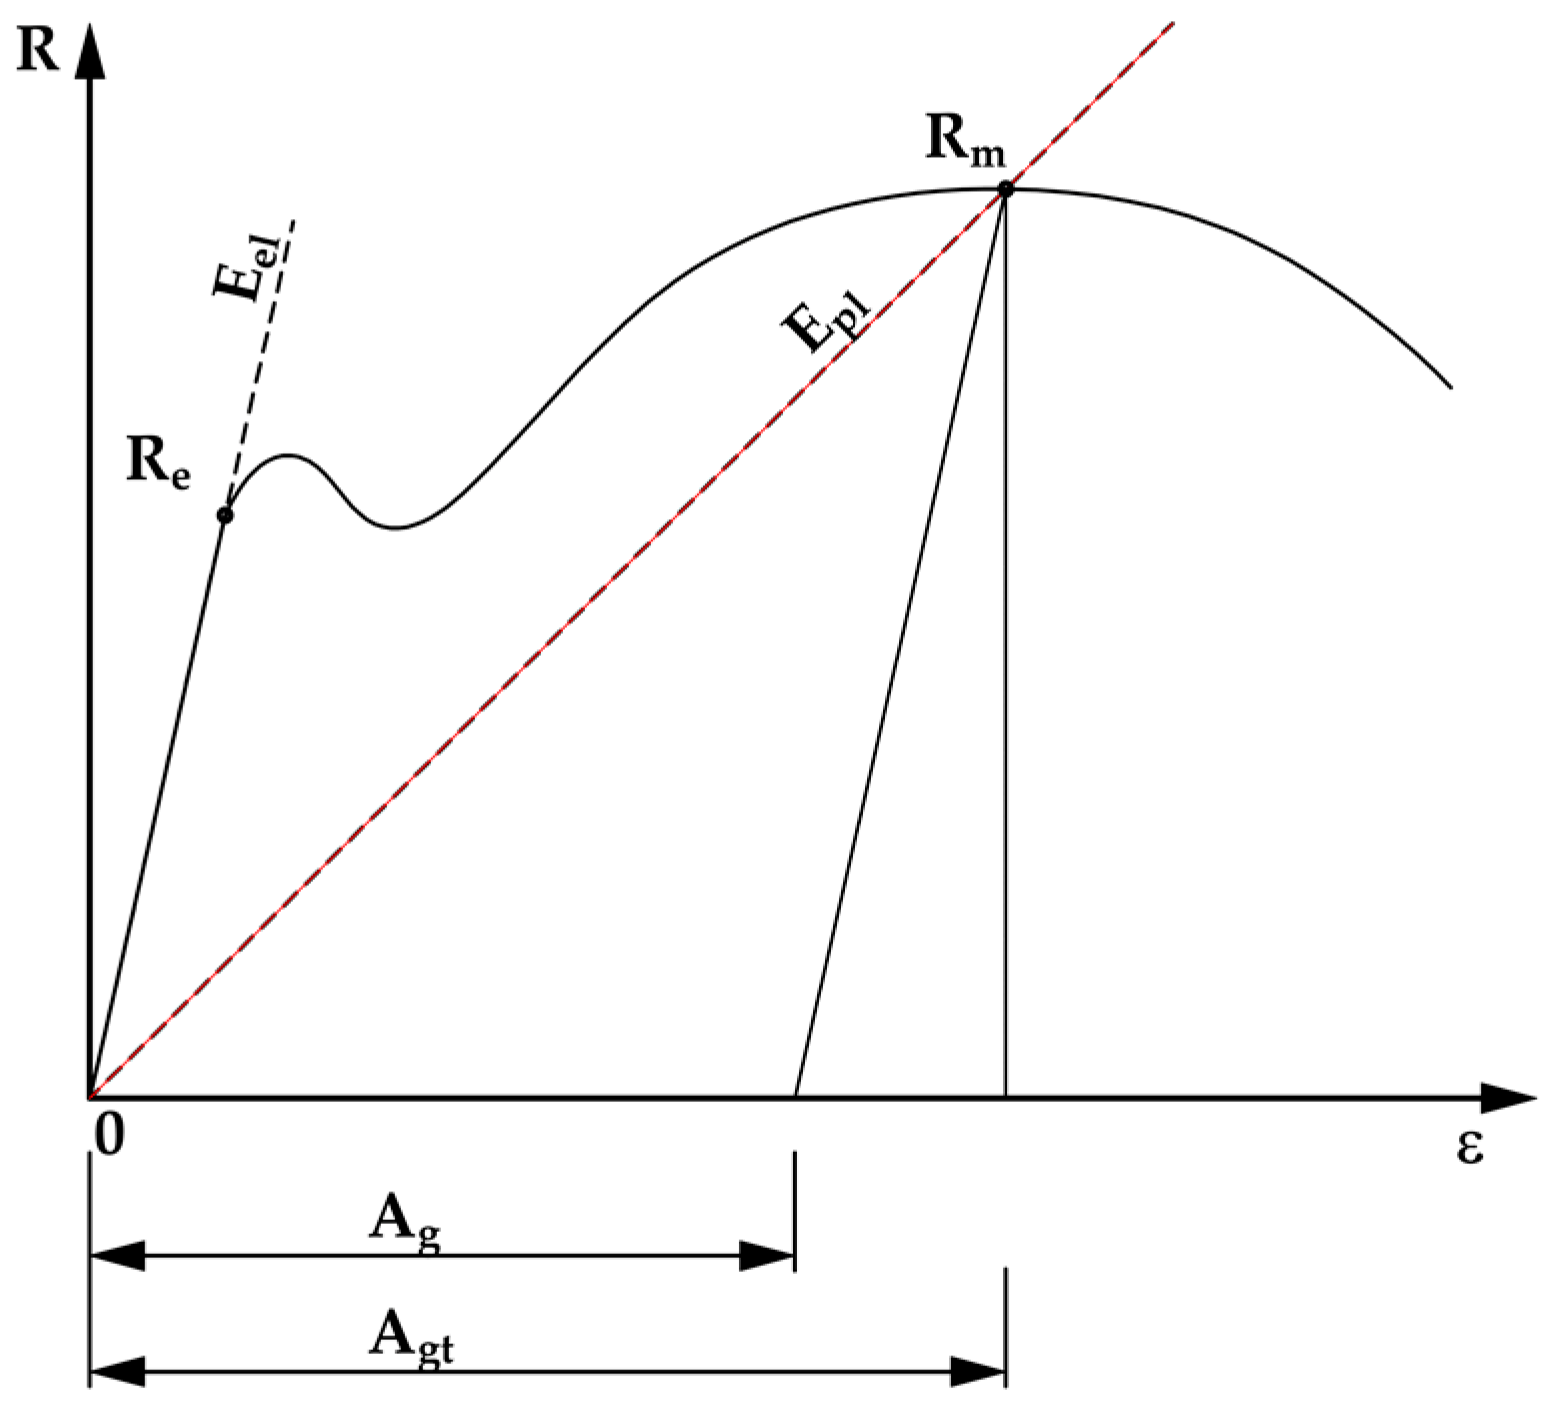
The determination of the modulus of elasticity is based on considerations to determine the elastic deformability of the material based on its tensile stresses and strains . A new parameter, the modulus of plasticity , is introduced to describe the plastic deformability of the material. Based on the assumption that the determination of can be characterized as a transition point from an elastic to a plastic state, the same procedure is used to determine the modulus. However, the maximum stress determined in a tensile test and the corresponding strain at the maximum load characterizes the transition point of the plastic uniform strain along the tensile test to the local material necking–softening. The ratio of tensile stress to longitudinal strain at this inflection point is named the modulus of plasticity according to Equation (4) and is shown schematically in Figure 3.
with:
The introduced quantity is intended to represent a direct dependency of the results from tensile and shear tests in order to determine the shear strength of threaded rods based on the parameters obtained in the tensile test. It is important to note that the total extensions and not only the plastic extensions are considered. While determining the shear strength, the rod undergoes both elastic and plastic strains which are retained up to the failure point.
The metallurgical outlook is intended to provide a general understanding of the experimental results presented in Section 3. The correlations between shear strength and tensile strength are empirical. The theoretical background under the inclusion of the plasticity theory is complex and is promised for further investigations. The theory of plasticity is not discussed in this article.
2.2. Tensile Tests
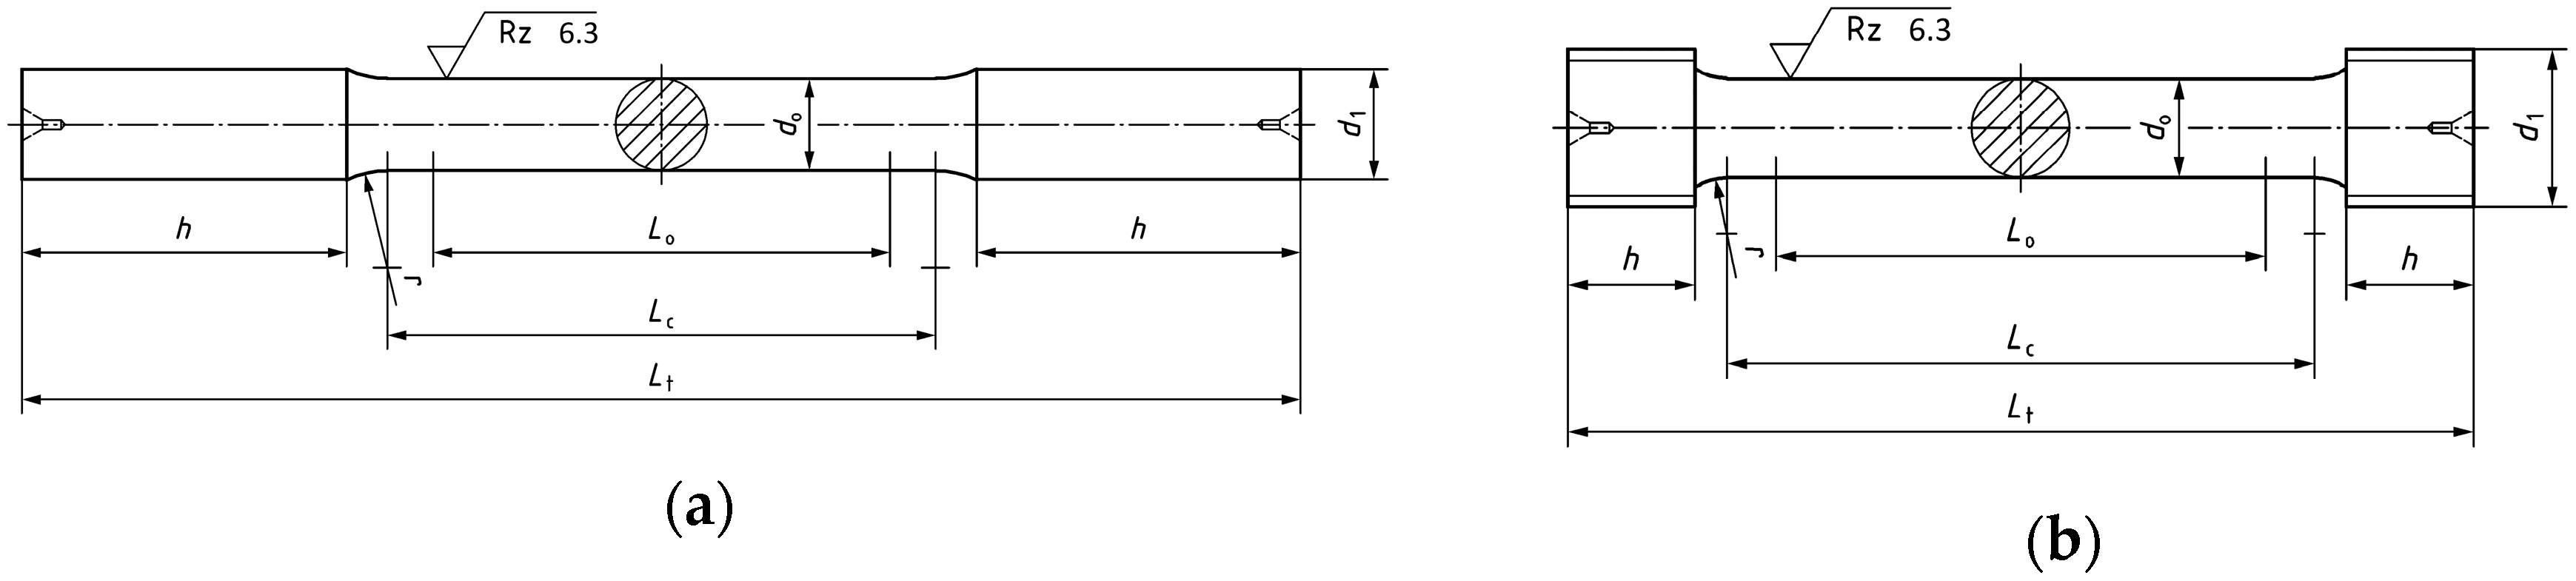
The steel properties were determined based on tensile tests carried out at the Technical University of Kaiserslautern on prepared tensile specimens. Form A and B tensile tests according to DIN 50125:2016-12 [28] were carried out on both threaded and reinforced bars. Table 3 shows the geometries of the tensile specimens in Figure 4.
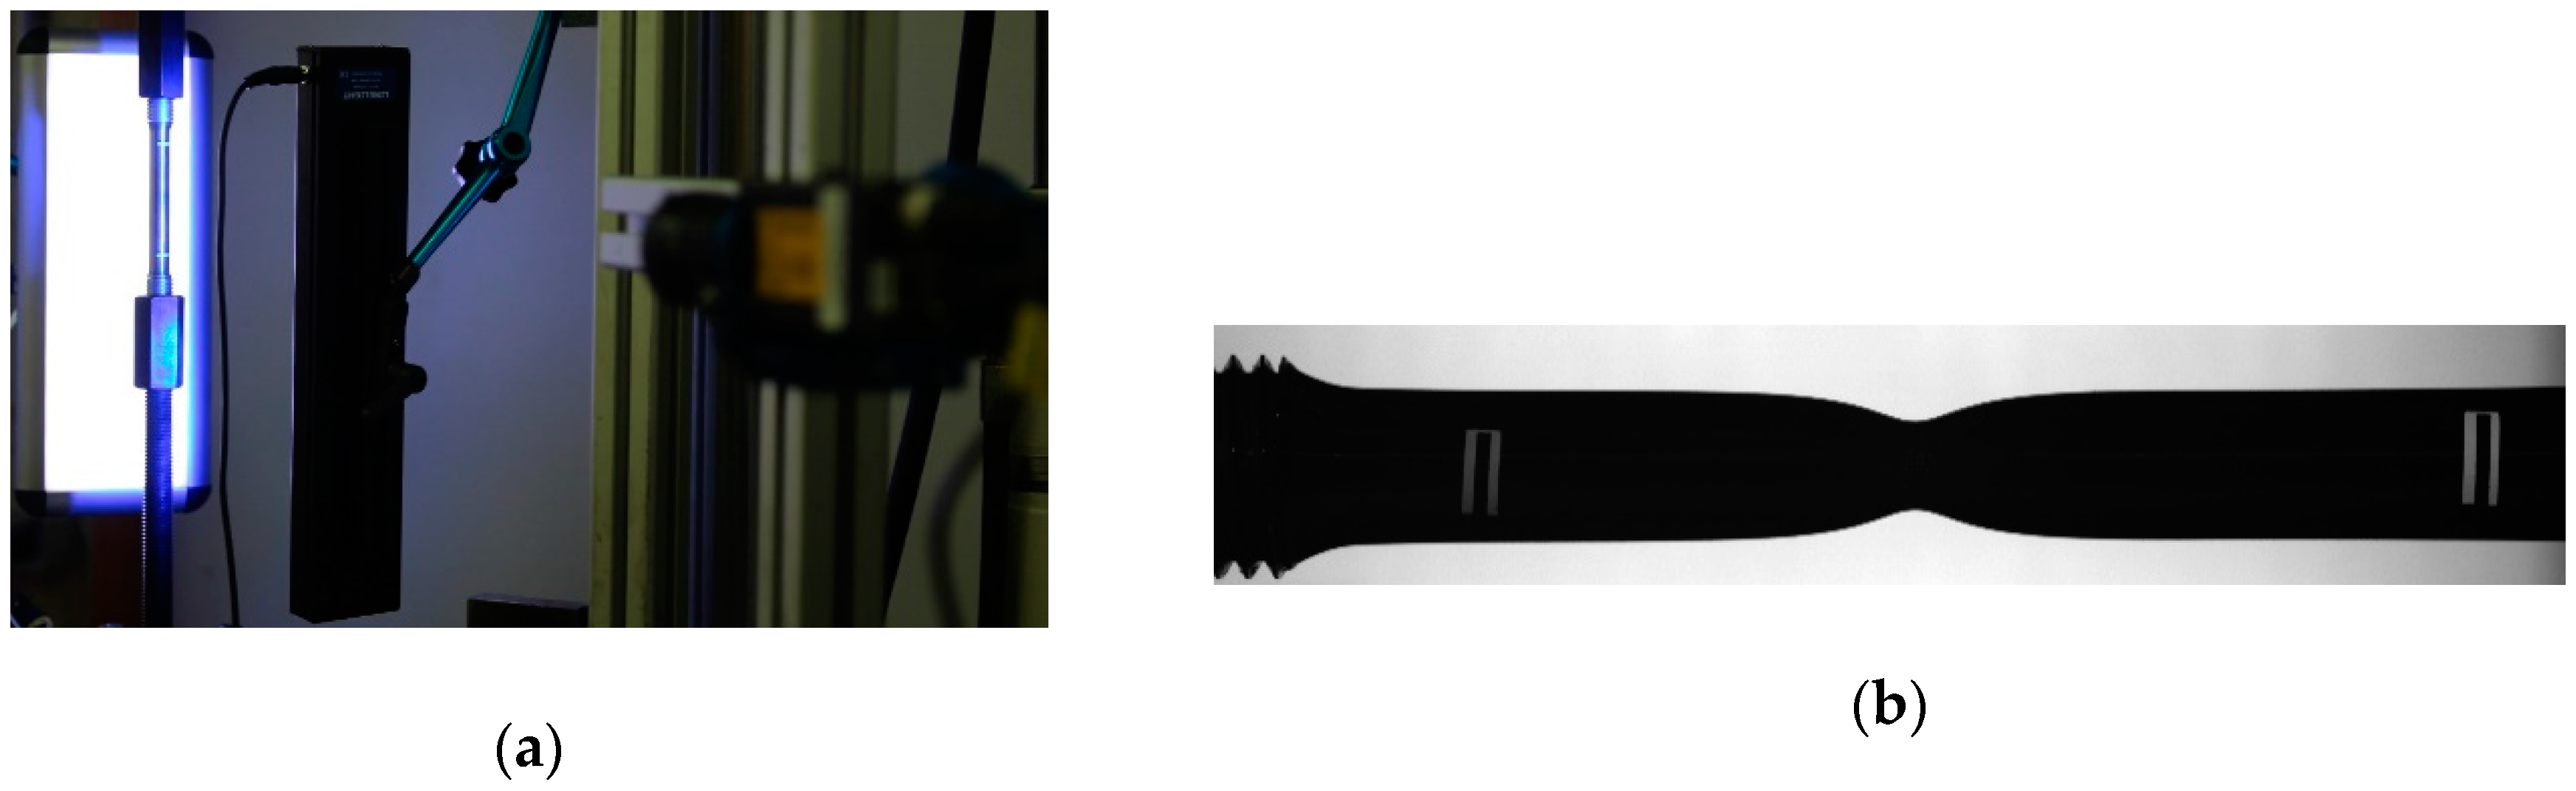
The tensile tests with the tensile specimen form A are considered as a preliminary test series. These results are evaluated in conjunction with the results of the main tests on tensile specimen form B. Both strain-controlled and displacement-controlled tensile tests were carried out. In both cases, the test speed was chosen by [28]. In the elastic range, was 0.00007 s−1 and in the plastic range until steel failure, the strain rate was constant 0.00025 s−1. The test setup is shown in Figure 5a. Using the RTSS | Video extensometer of the company LIMESS [29] both the elastic and the plastic steel strain up to steel failure were measured without contact, shown in Figure 5b. The individual material properties determined with tensile tests according to DIN EN ISO 6892-1 [30] can be found in Appendix A. They are summarized in Table A1 and Table A2.
2.3. Shear Tests
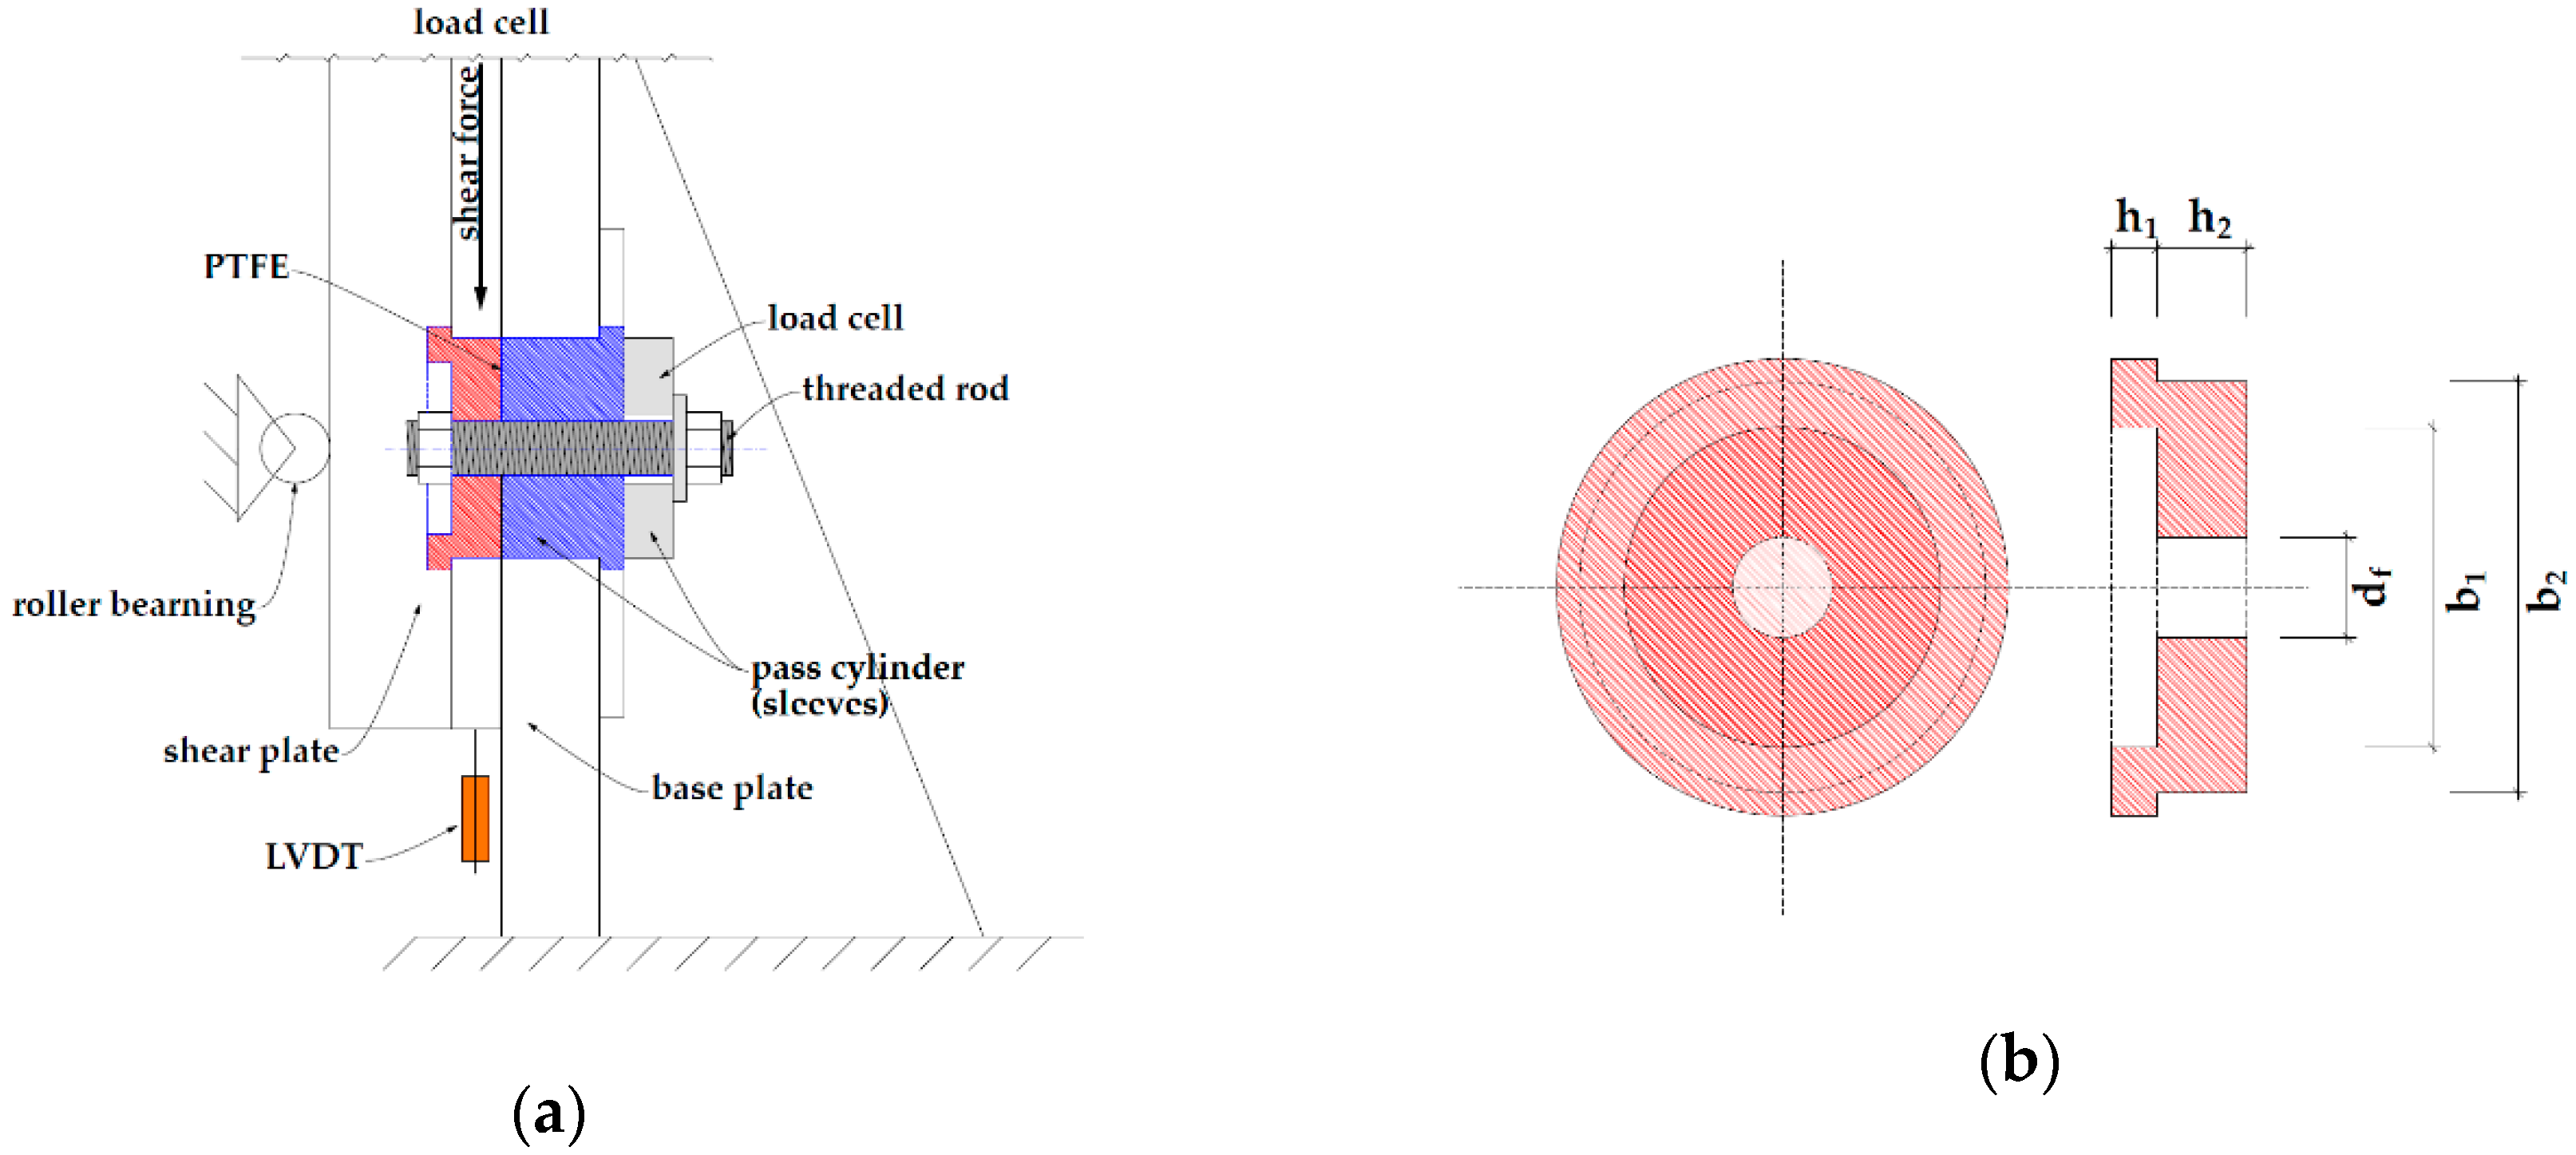
Based on current research results, the determination of the shear strength of bonded threaded rod and rebar bars is significantly influenced by the embedment depth and the strength of the adhesive mortar used [16]. To avoid these influences, the bars were sheared in a steel fixture to determine the steel shear strength without external influences. In contrast to the standardized shear test according to [31], the test is performed as a single-shear test. Figure 6 shows a schematic drawing of the testing device.
The test specimen is located between two hardened pass cylinders, which are inserted in the shear plate and the base plate. Before the test is carried out, both the threaded bars and the rebars are locked with nuts on both sides to prevent the bars from slipping through. The single-sided load causes additional tensile forces in the vertical direction, which can lead to the shear plates lifting off. Lifting of the shear plate is prevented by additional mounted roller bearings. The friction between the pass cylinders in the shear plate and the base plate is reduced to a minimum by the polytetrafluoroethylene (PTFE) foil used. Following [32,33], a 0.50 mm thick PTFE foil was chosen. The described procedure corresponds to performing suitability tests according to Technical Report 049 [33], except in these tests the anchor is not bonded in the concrete, but is screwed hand-tight between two metal plates.
A load cell was positioned on the side of the base plate to measure the tensile forces caused by forced deformation of the rod.
The diameter of the clearance hole was chosen so that there was as little space as possible between the hole wall and the test specimen. The geometries of the pass cylinders are summarized in Table 4.
According to [2,34], the threaded and rebar bars were brought to shear failure within 1 to 3 min by a linearly increasing force. The individual results are shown in Appendix A, Table A3.
3. Results
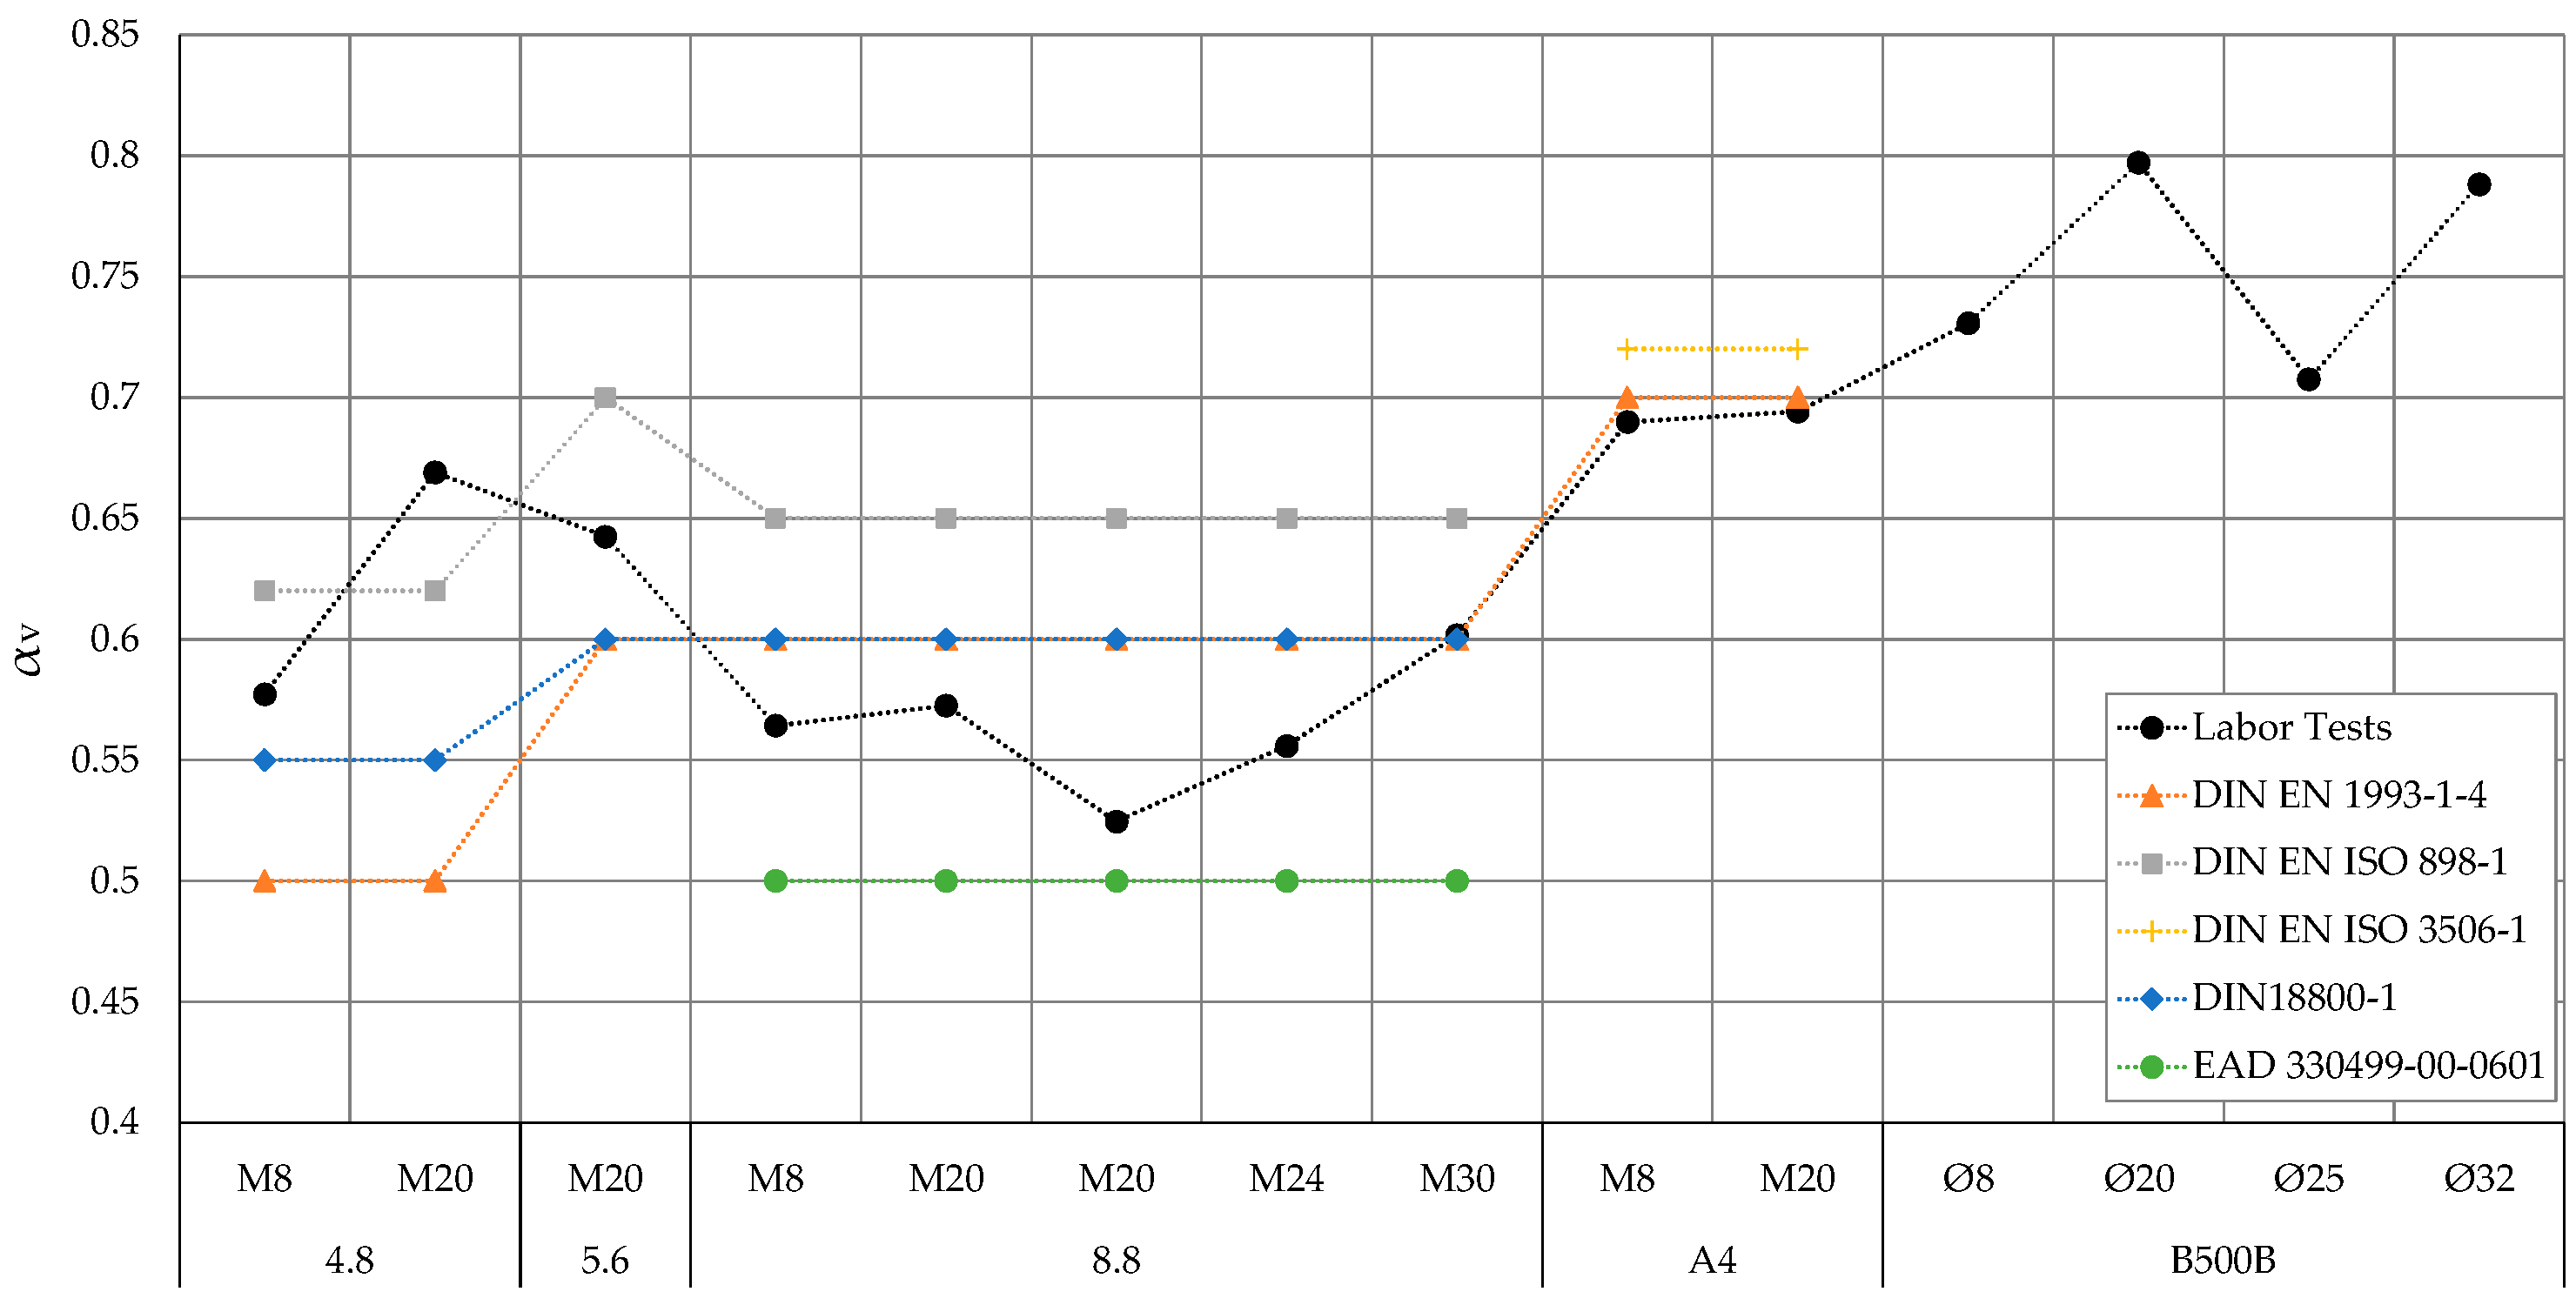
The results of the performed tests were first presented as mean values of the maximum tensile and shear stresses . The resulting reduction factors from Table 5 were compared to the values from various standards in Figure 7.
The calculated reduction factors show a controversial situation at first. Within the same steel grade, a relatively large scatter of the values is recorded. The difference between the diameters M8 and M20 of steel grade 4.8, which is approx. 0.1, is particularly high. A comparison of the laboratory results with the standard values from Table 1 does not lead to plausible conclusions either.
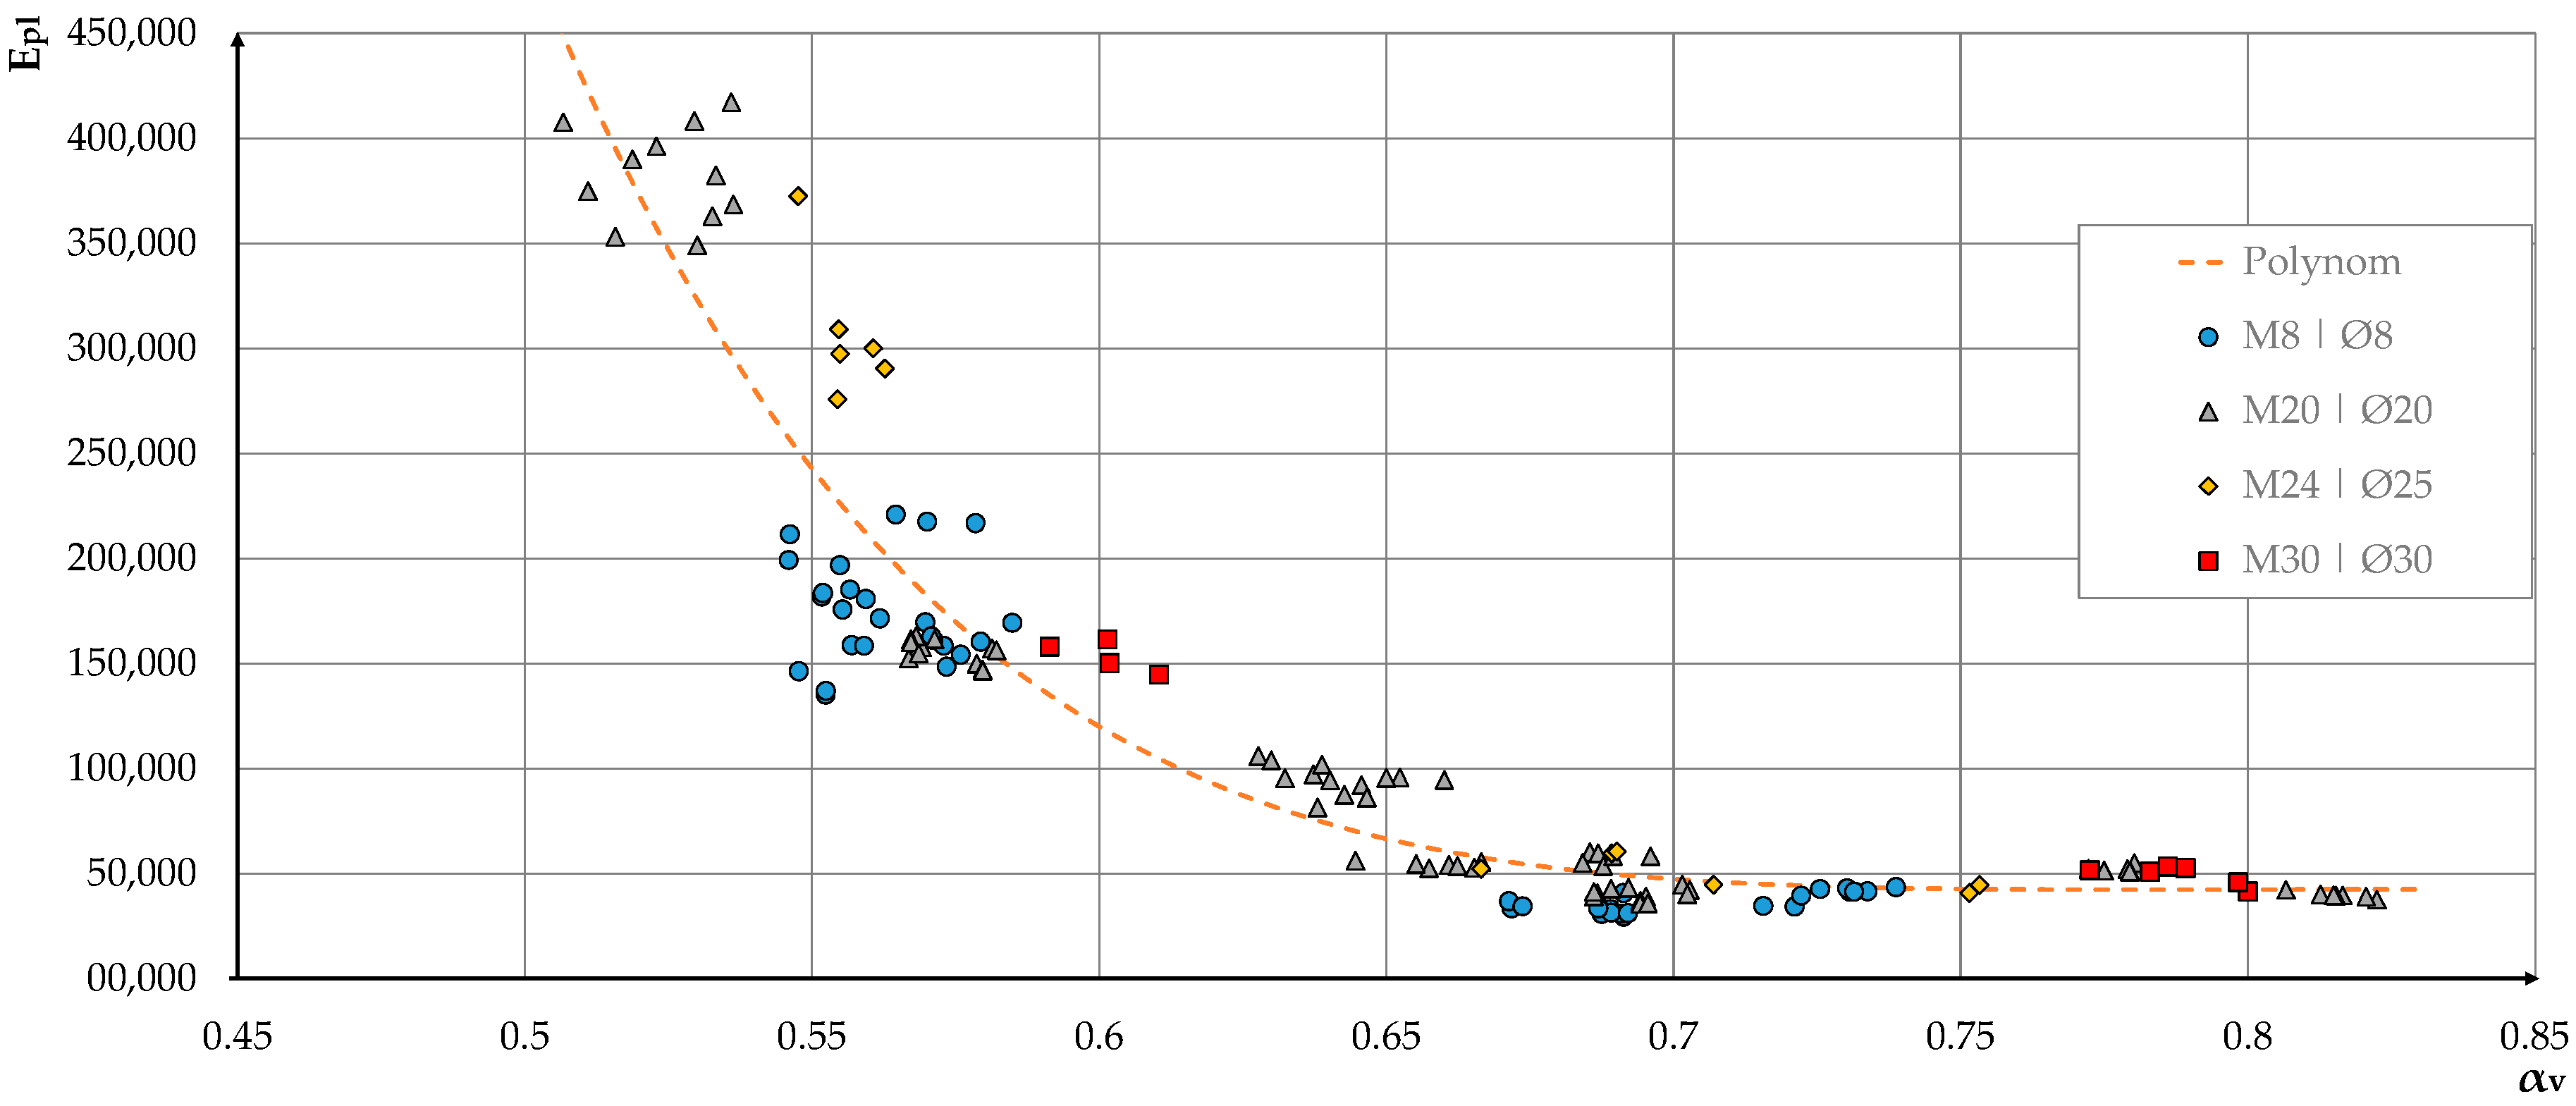
Although it could be observed in some cases that the increase in tensile strength within a steel grades increases the shear strength proportionally, this could not be transferred to all materials. Further analysis of the laboratory results showed a direct correlation between the strains determined from the tensile tests and the shear strength . By applying the proposed method for determining the modulus of plasticity , it was possible to determine the correlation between shear and tensile stresses as a function of the reduction factor . The calculated values of the modulus of plasticity and the reduction factors for used materials are summarized in Figure 8.
To apply the presented procedure to the existing data sets, the following must be observed:
- Results from the tensile tests were used as individual results;
- Results from the shear tests were used as average values.
Equation (5), with a coefficient of determination of , describes the correlation of the results.
with:
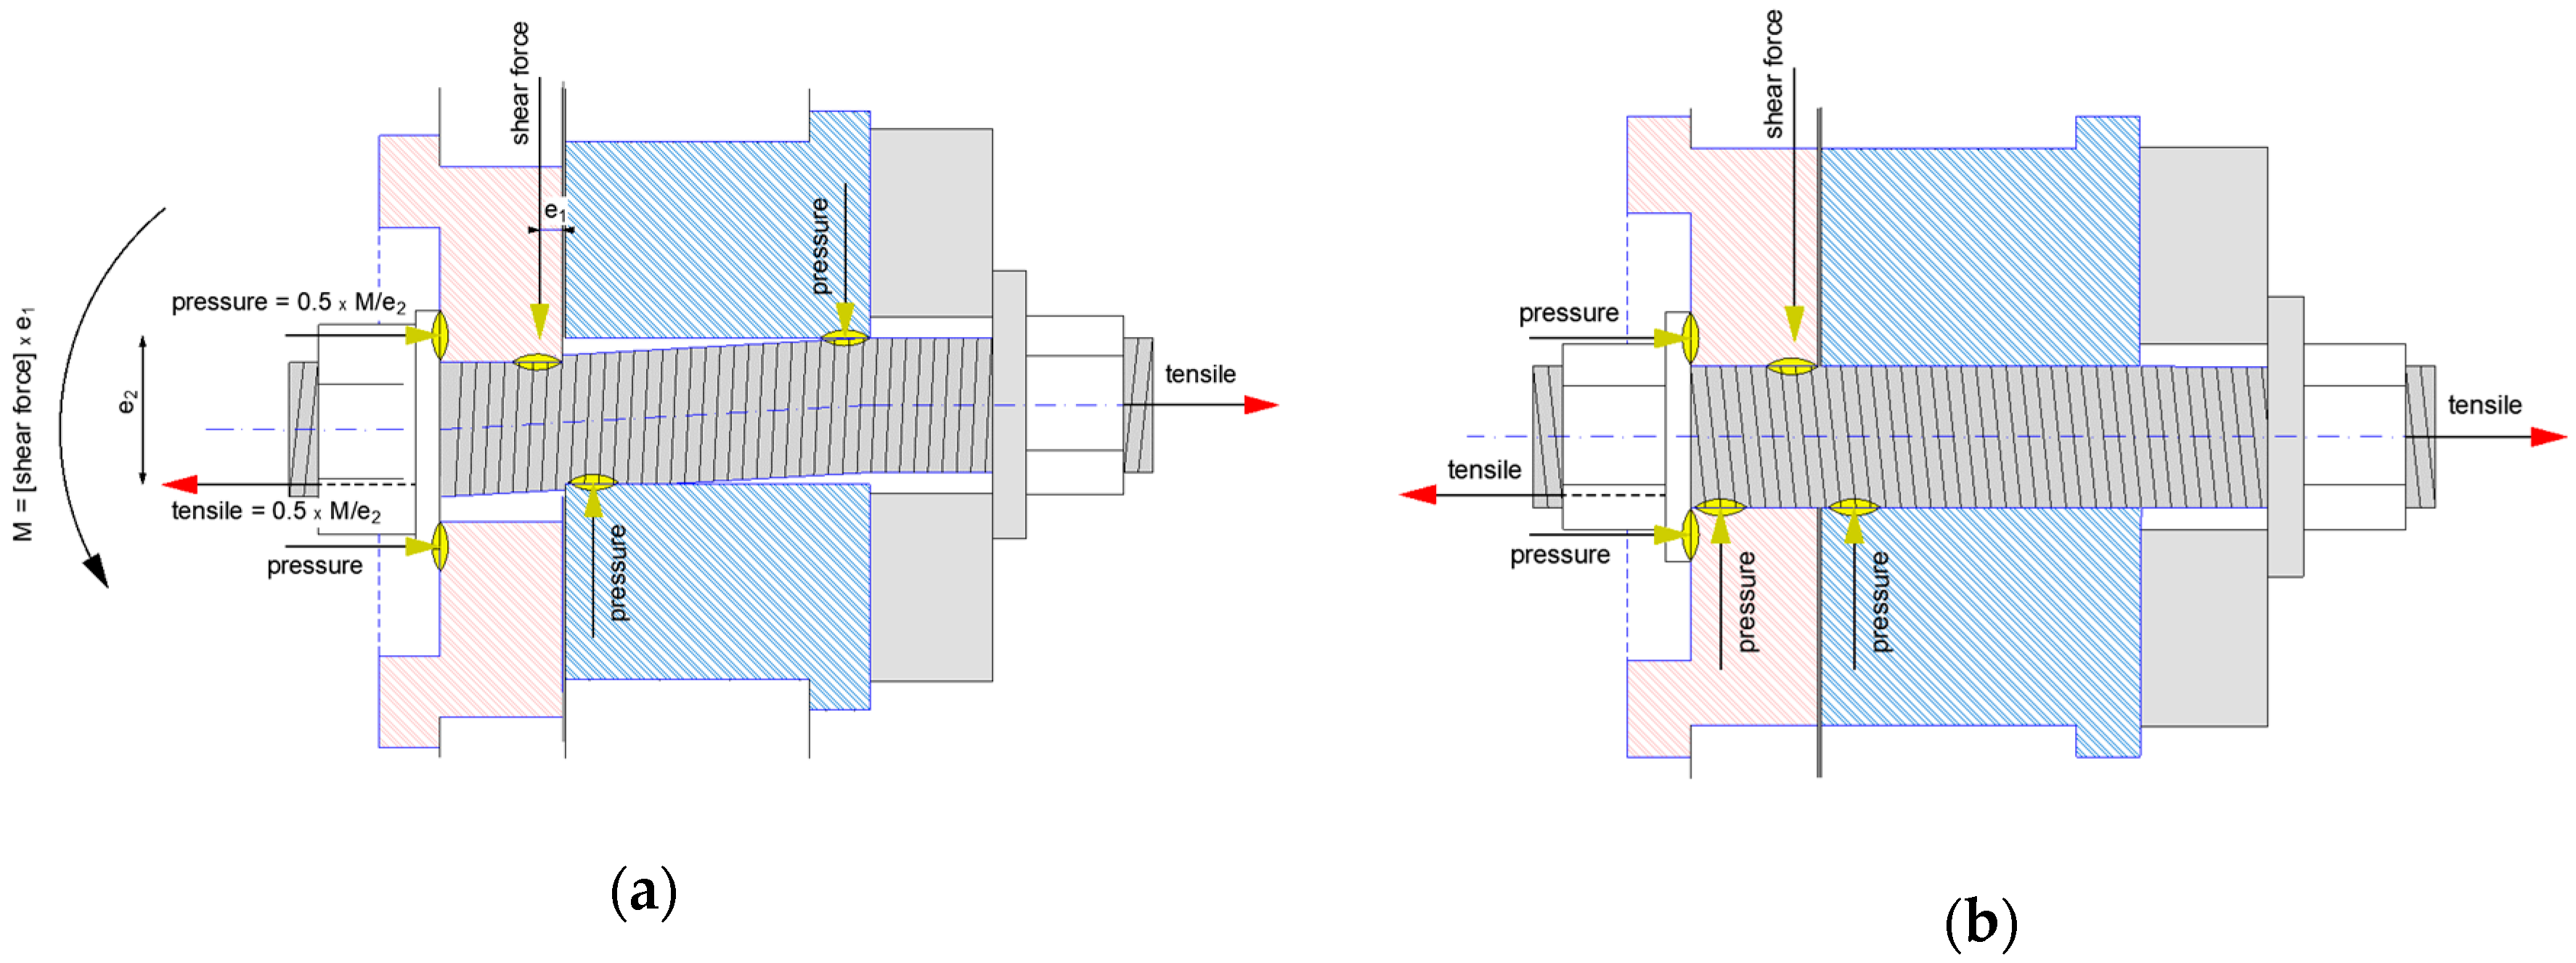
The shear force acting on the bar causes forced deformations in the longitudinal direction of the bar. These deformations manifest themselves by the formation of normal forces in the bar. The level of the resulting tensile force can easily be estimated. In Figure 9a, the secondary bending moment of the threaded nut is used to calculate the tensile and compressive components in the bar.
In the tests performed in Figure 9b, the tensile forces are very low because the selected geometry of the hole wall in Table 4 directly limits the bar in space and does not allow any significant deflection.
The development of secondary bending moments at the nut undoubtedly influences the load-bearing behavior of threaded connections. To estimate its effect, the quotients of the measured bar tension stresses and shear stresses were calculated in Table 6.
According to this, the level of the tensile force is geometry dependent and shows only minimal deviations for different materials. With increasing material strength, the tensile force is reduced according to the influence of the tensile force.
These effects have already been considered in the factor . Further efforts will be made to investigate the influence of the longitudinal strains on the failure mechanism. In this article, this topic will not be pursued further.
4. Discussion
The results in Figure 8 can be described as a regression curve. This means the reduction factor can already be taken directly from the diagram in a practical way, using the determined value as a first approximation. The correlations shown here are only valid for the depicted results. To generalize the scope, further investigations must be carried out with a much wider spectrum of materials and rod diameters. It is also advisable to define sample geometry and test speed so that results from different sources can be compared. Finally, the creation of an extensive database can be seen as a goal towards advancing research.
However, the regression analysis also shows that mixing the results of the reinforcement and threaded bars without taking other factors into account is not useful, because, in contrast to threaded bars, the shear failure of the reinforcing bars was determined in the shaft. Additionally, the low variation of the modulus of the plasticity of different rebars combined with a strong variation of the reduction factors 0.70 ÷ 0.80 allows the assumption that bar geometry has to be considered.
The influence of bar geometry on the threaded bars could not be investigated extensively because of the small number of tests. Nevertheless, it can be confirmed that the variation of the test results took place within comparable materials with different diameters.
Our findings confirm that brittle materials with a very high modulus of plasticity have a lower shear strength . In contrast, the high-ductility steels with a very low modulus of plasticity have a higher shear strength concerning the tensile strength.
In the future, it may be possible to develop a new design methodology based on the presented correlation between tensile and shear strength, so that laboratory testing of shear resistance of threaded and reinforcing bars as well as screws can be completely omitted.
Author Contributions
Conceptualization, N.S.; methodology, N.S.; software, N.S.; validation, N.S.; formal analysis, N.S.; investigation, N.S.; data curation, N.S.; writing—original draft preparation, N.S. and C.T.; writing—review and editing, N.S and C.T.; visualization, C.T.; supervision, C.T.; project administration, N.S. and C.T.; funding acquisition, C.T. All authors have read and agreed to the published version of the manuscript.
Funding
This research and the APC were funded by the State of Rhineland-Palatinate in the InnoProm pilot project with funds from MBWWK and EFRE, grant number 52708-1/47 (2)/84002695.
Acknowledgments
This article, and all data published here, are a pre-publication from the current research project: “Load capacity and deformation behavior of bonded anchors in case of earthquakes”.
Conflicts of Interest
The funders had no role in the design of the study; in the collection, analyses, or interpretation of data; in the writing of the manuscript, or in the decision to publish the results.
Nomenclature
| % | plastic extension at maximum force | |
| % | total extension at maximum force | |
| mm2 | effective stressed cross-sectional area of steel element | |
| mm | test piece diameter | |
| mm | diameter of gripped ends | |
| mm | diameter of clearance hole | |
| mm | nominal diameter | |
| mm | distance from lever arm | |
| mm | distance from lever arm | |
| N/mm2 | elastic modulus | |
| N/mm2 | plastic modulus | |
| N/mm2 | characteristic steel ultimate tensile strength | |
| mm | length of gripped ends | |
| mm | height of the bracket of the sleeves | |
| mm | height of the sleeves | |
| mm | inside diameter of the sleeves | |
| mm | outside diameter of the sleeves | |
| ° | angle between tension direction and slip plane | |
| mm | original gauge length | |
| mm | parallel length | |
| mm | total length of test piece | |
| kNm | secondary bending moment | |
| kN | ultimate tension load | |
| mm | radius | |
| N/mm2 | stress | |
| N/mm2 | yield strength | |
| N/mm2 | ultimate tensile stress | |
| kN | characteristic steel shear resistance for static loading | |
| kN | characteristic steel shear resistance for seismic loading | |
| - | reduction factor | |
| s−1 | strain rate | |
| % | extension | |
| % | total extension (include elastic and plastic extensions) | |
| % | dislocation motion in X direction | |
| % | dislocation motion in Y direction | |
| N/mm2 | compressive stress | |
| N/mm2 | tensile stress (tensile component from shear force) | |
| N/mm2 | ultimate tensile stress | |
| N/mm2 | ultimate shear stress | |
| ° | angle between tension direction and sliding direction | |
| N/mm2 | average value of the ultimate tensile stress | |
| N/mm2 | average value of the tensile stress (tensile component from shear force) | |
| N/mm2 | average value of the ultimate shear stress |
Appendix A

Table A1.
Tensile tests (form A).
| Nr. | Size | Material | |||||
|---|---|---|---|---|---|---|---|
| (-) | (-) | (-) | (mm2) | (N/mm2) | (%) | (N/mm2) | (-) |
| 1 | M20 | 8.8 | 113.10 | 1050 | 2.58 | 407641 | 0.51 ** |
| 2 | M20 | 8.8 | 113.10 | 1031 | 2.92 | 353339 | 0.52 ** |
| 3 | M20 | 8.8 | 113.10 | 1017 | 2.57 | 396335 | 0.52 ** |
| 4 | M20 | 8.8 | 113.10 | 1004 | 2.87 | 349181 | 0.53 ** |
| 5 | M20 | 8.8 | 113.10 | 1025 | 2.63 | 390016 | 0.52 ** |
| 1 | Ø20 | B500B | 113.10 | 635 | 11.49 | 55265 | 0.78 |
| 2 | Ø20 | B500B | 113.10 | 636 | 12.15 | 52348 | 0.78 |
| 3 | Ø20 | B500B | 113.10 | 635 | 12.44 | 51082 | 0.78 |
| 4 | Ø20 | B500B | 113.10 | 641 | 12.23 | 52445 | 0.77 |
| 5 | Ø20 | B500B | 113.10 | 636 | 12.45 | 51038 | 0.78 |
| 6 | Ø20 | B500B | 113.10 | 639 | 12.39 | 51611 | 0.77 |
| 1 | M24 | 8.8 | 153.94 | 953 | 2.56 | 372491 | 0.55 |
| 2 | M24 | 8.8 | 153.94 | 941 | 3.04 | 309174 | 0.55 |
| 3 | M24 | 8.8 | 153.94 | 940 | 3.16 | 297617 | 0.55 |
| 4 | M24 | 8.8 | 153.94 | 941 | 3.41 | 275879 | 0.55 |
| 5 | M24 | 8.8 | 153.94 | 927 | 3.19 | 290572 | 0.56 |
| 6 | M24 | 8.8 | 153.94 | 930 | 3.10 | 300172 | 0.56 |
| 1 | Ø25 | B500B | 153.94 | 591 | 13.22 | 44714 | 0.75 |
| 2 | Ø25 | B500B | 153.94 | 593 | 14.44 | 41044 | 0.75 |
| 3 | Ø25 | B500B | 153.94 | 646 | 10.81 | 59761 | 0.69 |
| 4 | Ø25 | B500B | 153.94 | 668 | 12.75 | 52426 | 0.67 |
| 5 | Ø25 | B500B | 153.94 | 630 | 14.05 | 44827 | 0.71 |
| 6 | Ø25 | B500B | 153.94 | 645 | 10.64 | 60651 | 0.69 |
| 1 | M30 | 8.8 | 314.16 | 1049 | 6.63 | 158174 | 0.59 |
| 2 | M30 | 8.8 | 314.16 | 1032 | 6.38 | 161785 | 0.60 |
| 3 | M30 | 8.8 | 314.16 | 1031 | 6.86 | 150338 | 0.60 |
| 4 | M30 | 8.8 | 314.16 | 1017 | 7.01 | 144935 | 0.61 |
| 1 | Ø32 | B500B | 314.16 | 600 | 14.40 | 41690 | 0.80 |
| 2 | Ø32 | B500B | 314.16 | 613 | 12.01 | 51061 | 0.78 |
| 3 | Ø32 | B500B | 314.16 | 622 | 11.99 | 51878 | 0.77 |
| 4 | Ø32 | B500B | 314.16 | 611 | 11.40 | 53599 | 0.79 |
| 5 | Ø32 | B500B | 314.16 | 602 | 13.05 | 46111 | 0.80 |
| 6 | Ø32 | B500B | 314.16 | 609 | 11.49 | 52971 | 0.79 |
# The steel shear strength was determined from the shear tests held in the steel. ** The steel shear strength was determined using the shear tests in concrete.
Table A2.
Tensile tests (form B).
| Nr. | Size | Material | |||||
|---|---|---|---|---|---|---|---|
| (-) | (-) | (-) | (mm2) | (N/mm2) | (%) | (N/mm2) | (-) |
| 1 | M8 | 4.8 | 19.63 | 531 | 3.57 | 148711 | 0.57 |
| 2 | M8 | 4.8 | 19.63 | 544 | 3.01 | 181014 | 0.56 |
| 3 | M8 | 4.8 | 19.63 | 547 | 3.44 | 158952 | 0.56 |
| 4 | M8 | 4.8 | 19.63 | 532 | 3.35 | 158693 | 0.57 |
| 5 | M8 | 4.8 | 19.63 | 556 | 3.79 | 146581 | 0.55 |
| 6 | M8 | 4.8 | 19.63 | 551 | 4.07 | 135411 | 0.55 |
| 7 | M8 | 4.8 | 19.63 | 551 | 4.02 | 137157 | 0.55 |
| 8 | M8 | 4.8 | 19.63 | 552 | 3.03 | 182140 | 0.55 |
| 9 | M8 | 4.8 | 19.63 | 534 | 3.15 | 169863 | 0.57 |
| 10 | M8 | 4.8 | 19.63 | 542 | 3.16 | 171768 | 0.56 |
| 1 | M8 | 8.8 | 19.63 | 987 | 5.32 | 185467 | 0.56 |
| 2 | M8 | 8.8 | 19.63 | 973 | 4.40 | 221146 | 0.56 |
| 3 | M8 | 8.8 | 19.63 | 961 | 5.95 | 161478 | 0.57 |
| 4 | M8 | 8.8 | 19.63 | 949 | 4.37 | 217058 | 0.58 |
| 5 | M8 | 8.8 | 19.63 | 963 | 4.42 | 217789 | 0.57 |
| 6 | M8 | 8.8 | 19.63 | 990 | 5.02 | 197049 | 0.55 |
| 7 | M8 | 8.8 | 19.63 | 1005 | 4.75 | 211710 | 0.55 |
| 8 | M8 | 8.8 | 19.63 | 989 | 5.62 | 175877 | 0.56 |
| 9 | M8 | 8.8 | 19.63 | 948 | 5.90 | 160665 | 0.58 |
| 10 | M8 | 8.8 | 19.63 | 1006 | 5.04 | 199452 | 0.55 |
| 11 | M8 | 8.8 | 19.63 | 982 | 6.19 | 158722 | 0.56 |
| 12 | M8 | 8.8 | 19.63 | 995 | 5.42 | 183726 | 0.55 |
| 13 | M8 | 8.8 | 19.63 | 939 | 5.53 | 169633 | 0.58 |
| 14 | M8 | 8.8 | 19.63 | 962 | 5.90 | 163139 | 0.57 |
| 15 | M8 | 8.8 | 19.63 | 953 | 6.18 | 154383 | 0.58 |
| 1 | M8 | A4 | 19.63 | 797 | 23.60 | 33791 | 0.67 |
| 2 | M8 | A4 | 19.63 | 798 | 21.45 | 37202 | 0.67 |
| 3 | M8 | A4 | 19.63 | 743 | 21.50 | 34557 | 0.72 |
| 4 | M8 | A4 | 19.63 | 795 | 22.91 | 34710 | 0.67 |
| 5 | M8 | A4 | 19.63 | 775 | 18.86 | 41091 | 0.69 |
| 6 | M8 | A4 | 19.63 | 749 | 21.50 | 34822 | 0.72 |
| 7 | M8 | A4 | 19.63 | 779 | 25.07 | 31079 | 0.69 |
| 8 | M8 | A4 | 19.63 | 778 | 23.28 | 33408 | 0.69 |
| 9 | M8 | A4 | 19.63 | 775 | 25.95 | 29861 | 0.69 |
| 10 | M8 | A4 | 19.63 | 775 | 24.82 | 31246 | 0.69 |
| 11 | M8 | A4 | 19.63 | 777 | 24.50 | 31730 | 0.69 |
| 12 | M8 | A4 | 19.63 | 774 | 24.63 | 31431 | 0.69 |
| 13 | M8 | A4 | 19.63 | 780 | 23.08 | 33787 | 0.69 |
| 1 | Ø8 | B500B | 19.63 | 609 | 14.61 | 41671 | 0.71 |
| 2 | Ø8 | B500B | 19.63 | 609 | 14.08 | 43273 | 0.71 |
| 3 | Ø8 | B500B | 19.63 | 606 | 14.51 | 41788 | 0.72 |
| 4 | Ø8 | B500B | 19.63 | 602 | 13.72 | 43871 | 0.72 |
| 5 | Ø8 | B500B | 19.63 | 616 | 15.46 | 39820 | 0.70 |
| 6 | Ø8 | B500B | 19.63 | 613 | 14.28 | 42929 | 0.71 |
| 7 | Ø8 | B500B | 19.63 | 608 | 14.59 | 41684 | 0.71 |
| 1 | M20 | 4.8 | 153.94 | 429 | 7.90 | 54309 | 0.66 |
| 2 | M20 | 4.8 | 153.94 | 413 | 6.85 | 60318 | 0.69 |
| 3 | M20 | 4.8 | 153.94 | 413 | 6.90 | 59827 | 0.69 |
| 4 | M20 | 4.8 | 153.94 | 407 | 6.97 | 58384 | 0.70 |
| 5 | M20 | 4.8 | 153.94 | 412 | 7.66 | 53826 | 0.69 |
| 6 | M20 | 4.8 | 153.94 | 414 | 7.48 | 55403 | 0.68 |
| 7 | M20 | 4.8 | 153.94 | 425 | 7.64 | 55648 | 0.67 |
| 8 | M20 | 4.8 | 153.94 | 426 | 8.04 | 52970 | 0.67 |
| 9 | M20 | 4.8 | 153.94 | 440 | 7.79 | 56420 | 0.64 |
| 10 | M20 | 4.8 | 153.94 | 431 | 8.17 | 52747 | 0.66 |
| 11 | M20 | 4.8 | 153.94 | 433 | 7.88 | 54883 | 0.66 |
| 12 | M20 | 4.8 | 153.94 | 428 | 7.95 | 53835 | 0.66 |
| 1 | M20 | 5.6 | 153.94 | 563 | 5.95 | 94686 | 0.66 |
| 2 | M20 | 5.6 | 153.94 | 575 | 6.23 | 92323 | 0.65 |
| 3 | M20 | 5.6 | 153.94 | 580 | 6.13 | 94617 | 0.64 |
| 4 | M20 | 5.6 | 153.94 | 570 | 5.94 | 95891 | 0.65 |
| 5 | M20 | 5.6 | 153.94 | 572 | 5.97 | 95723 | 0.65 |
| 6 | M20 | 5.6 | 153.94 | 575 | 6.66 | 86350 | 0.65 |
| 7 | M20 | 5.6 | 153.94 | 578 | 6.59 | 87709 | 0.64 |
| 8 | M20 | 5.6 | 153.94 | 583 | 5.99 | 97370 | 0.64 |
| 9 | M20 | 5.6 | 153.94 | 582 | 5.70 | 102051 | 0.64 |
| 10 | M20 | 5.6 | 153.94 | 592 | 5.58 | 106141 | 0.63 |
| 11 | M20 | 5.6 | 153.94 | 590 | 5.67 | 104012 | 0.63 |
| 12 | M20 | 5.6 | 153.94 | 588 | 6.15 | 95607 | 0.63 |
| 13 | M20 | 5.6 | 153.94 | 582 | 7.13 | 81680 | 0.64 |
| 1 | M20 | 8.8 | 153.94 | 958 | 6.07 | 157970 | 0.57 |
| 2 | M20 | 8.8 | 153.94 | 942 | 6.28 | 150136 | 0.58 |
| 3 | M20 | 8.8 | 153.94 | 941 | 6.38 | 147339 | 0.58 |
| 4 | M20 | 8.8 | 153.94 | 938 | 5.96 | 157316 | 0.58 |
| 5 | M20 | 8.8 | 153.94 | 941 | 6.41 | 146732 | 0.58 |
| 6 | M20 | 8.8 | 153.94 | 937 | 5.99 | 156473 | 0.58 |
| 7 | M20 | 8.8 | 153.94 | 960 | 6.18 | 155400 | 0.58 |
| 8 | M20 | 8.8 | 153.94 | 960 | 5.88 | 163124 | 0.57 |
| 9 | M20 | 8.8 | 153.94 | 954 | 5.90 | 151756 | 0.57 |
| 10 | M20 | 8.8 | 153.94 | 961 | 5.95 | 161683 | 0.57 |
| 11 | M20 | 8.8 | 153.94 | 962 | 6.31 | 152534 | 0.57 |
| 12 | M20 | 8.8 | 153.94 | 961 | 5.99 | 160396 | 0.57 |
| 13 | M20 | 8.8 | 153.94 | 959 | 6.19 | 154952 | 0.57 |
| 14 | M20 | 8.8 | 153.94 | 992 | 2.69 | 368417 | 0.54 ** |
| 15 | M20 | 8.8 | 153.94 | 998 | 2.61 | 382472 | 0.53 ** |
| 16 | M20 | 8.8 | 153.94 | 1005 | 2.46 | 408331 | 0.53 ** |
| 17 | M20 | 8.8 | 153.94 | 993 | 2.38 | 417149 | 0.54 ** |
| 18 | M20 | 8.8 | 153.94 | 999 | 2.75 | 363023 | 0.53 ** |
| 19 | M20 | 8.8 | 153.94 | 1041 | 2.78 | 374964 | 0.51 ** |
| 1 | M20 | A4 | 153.94 | 777 | 17.89 | 43402 | 0.69 |
| 2 | M20 | A4 | 153.94 | 783 | 19.14 | 40902 | 0.69 |
| 3 | M20 | A4 | 153.94 | 765 | 18.05 | 42374 | 0.70 |
| 4 | M20 | A4 | 153.94 | 766 | 17.06 | 44924 | 0.70 |
| 5 | M20 | A4 | 153.94 | 765 | 18.91 | 40477 | 0.70 |
| 6 | M20 | A4 | 153.94 | 780 | 13.33 | 58495 | 0.69 |
| 7 | M20 | A4 | 153.94 | 773 | 19.72 | 39210 | 0.70 |
| 8 | M20 | A4 | 153.94 | 783 | 19.95 | 39269 | 0.69 |
| 9 | M20 | A4 | 153.94 | 774 | 20.87 | 37093 | 0.69 |
| 10 | M20 | A4 | 153.94 | 780 | 18.13 | 43025 | 0.69 |
| 11 | M20 | A4 | 153.94 | 783 | 18.88 | 41502 | 0.69 |
| 12 | M20 | A4 | 153.94 | 774 | 21.69 | 35703 | 0.69 |
| 13 | M20 | A4 | 153.94 | 773 | 21.48 | 35981 | 0.70 |
| 1 | Ø20 | B500B | 153.94 | 602 | 15.94 | 37800 | 0.80 |
| 2 | Ø20 | B500B | 153.94 | 607 | 15.26 | 39766 | 0.80 |
| 3 | Ø20 | B500B | 153.94 | 608 | 15.30 | 39702 | 0.80 |
| 4 | Ø20 | B500B | 153.94 | 614 | 14.46 | 42484 | 0.79 |
| 5 | Ø20 | B500B | 153.94 | 604 | 15.40 | 39199 | 0.80 |
| 6 | Ø20 | B500B | 153.94 | 610 | 15.18 | 40176 | 0.80 |
| 7 | Ø20 | B500B | 153.94 | 608 | 15.23 | 39913 | 0.80 |
# The steel shear strength was determined from the shear tests held in the steel. ** The steel shear strength was determined using the shear tests in concrete.
Table A3.
Shear tests.
| Nr. | Size | Material | |||
|---|---|---|---|---|---|
| (-) | (-) | (-) | (mm2) | (N/mm2) | (N/mm2) |
| 1 | M8 | 4.8 | 36.6 | 298 | 62.6 |
| 2 | M8 | 4.8 | 36.6 | 299 | 71.8 |
| 3 | M8 | 4.8 | 36.6 | 317 | 70.4 |
| 4 | M8 | 4.8 | 36.6 | 328 | 72.1 |
| 5 | M8 | 4.8 | 36.6 | 327 | 69.1 |
| 6 | M8 | 4.8 | 36.6 | 314 | 41.3 |
| 1 | M8 | 8.8 | 36.6 | 542 | 103.4 |
| 2 | M8 | 8.8 | 36.6 | 540 | 75.8 |
| 3 | M8 | 8.8 | 36.6 | 538 | 81.2 |
| 4 | M8 | 8.8 | 36.6 | 558 | 60.3 |
| 5 | M8 | 8.8 | 36.6 | 554 | 80.0 |
| 6 | M8 | 8.8 | 36.6 | 563 | 64.0 |
| 1 | M8 | A4 | 36.6 | 525 | 56.6 |
| 2 | M8 | A4 | 36.6 | 521 | 60.7 |
| 3 | M8 | A4 | 36.6 | 529 | - |
| 4 | M8 | A4 | 36.6 | 550 | 61.4 |
| 5 | M8 | A4 | 36.6 | 542 | 63.8 |
| 6 | M8 | A4 | 36.6 | 547 | 63.9 |
| 1 | Ø8 | B500B | 50.3 | 452 | 49.5 |
| 2 | Ø8 | B500B | 50.3 | 450 | 50.6 |
| 3 | Ø8 | B500B | 50.3 | 442 | 36.6 |
| 4 | Ø8 | B500B | 50.3 | 437 | 38.3 |
| 5 | Ø8 | B500B | 50.3 | 434 | 41.6 |
| 6 | Ø8 | B500B | 50.3 | 453 | - |
| 1 | M20 | 4.8 | 245.0 | 282 | 17.9 |
| 2 | M20 | 4.8 | 245.0 | 283 | 17.7 |
| 3 | M20 | 4.8 | 245.0 | 281 | 22.8 |
| 4 | M20 | 4.8 | 245.0 | 288 | 20.2 |
| 5 | M20 | 4.8 | 245.0 | 281 | 16.4 |
| 6 | M20 | 4.8 | 245.0 | 286 | 20.7 |
| 1 | M20 | 5.6 | 245.0 | 374 | 23.0 |
| 2 | M20 | 5.6 | 245.0 | 365 | 32.0 |
| 3 | M20 | 5.6 | 245.0 | 372 | 25.6 |
| 4 | M20 | 5.6 | 245.0 | 374 | 14.0 |
| 5 | M20 | 5.6 | 245.0 | 373 | 16.8 |
| 6 | M20 | 5.6 | 245.0 | 371 | 21.0 |
| 1 | M20 | 8.8 | 245.0 | 548 | 37.2 |
| 2 | M20 | 8.8 | 245.0 | 554 | 42.6 |
| 3 | M20 | 8.8 | 245.0 | 532 | 36.8 |
| 4 | M20 | 8.8 | 245.0 | 550 | 27.7 |
| 5 | M20 | 8.8 | 245.0 | 545 | 22.6 |
| 6 | M20 | 8.8 | 245.0 | 542 | 25.0 |
| 1 | M20 | A4 | 245.0 | 550 | 29.8 |
| 2 | M20 | A4 | 245.0 | 540 | 35.5 |
| 3 | M20 | A4 | 245.0 | 554 | 43.4 |
| 4 | M20 | A4 | 245.0 | 530 | 39.4 |
| 5 | M20 | A4 | 245.0 | 527 | 13.0 |
| 6 | M20 | A4 | 245.0 | 524 | 14.1 |
| 1 | Ø20 | B500B | 314.2 | 501 | 24.1 |
| 2 | Ø20 | B500B | 314.2 | 500 | 31.3 |
| 3 | Ø20 | B500B | 314.2 | 503 | 37.1 |
| 4 | Ø20 | B500B | 314.2 | 485 | 20.9 |
| 5 | Ø20 | B500B | 314.2 | 492 | 17.3 |
| 6 | Ø20 | B500B | 314.2 | 493 | 8.6 |
| 1 | M24 | 8.8 | 352.5 | 530 | 28.3 |
| 2 | M24 | 8.8 | 352.5 | 519 | 25.9 |
| 3 | M24 | 8.8 | 352.5 | 527 | 47.2 |
| 4 | M24 | 8.8 | 352.5 | 514 | 39.3 |
| 5 | M24 | 8.8 | 352.5 | 517 | 44.9 |
| 6 | M24 | 8.8 | 352.5 | 523 | 45.8 |
| 1 | Ø25 | B500B | 490.9 | 447 | 57.0 |
| 2 | Ø25 | B500B | 490.9 | 448 | 50.6 |
| 3 | Ø25 | B500B | 490.9 | 441 | - |
| 1 | M30 | 8.8 | 561.0 | 618 | 51.9 |
| 2 | M30 | 8.8 | 561.0 | 619 | 66.1 |
| 3 | M30 | 8.8 | 561.0 | 628 | 56.3 |
| 4 | M30 | 8.8 | 561.0 | 626 | 36.6 |
| 5 | M30 | 8.8 | 561.0 | 615 | 68.2 |
| 6 | M30 | 8.8 | 561.0 | 617 | 39.4 |
| 1 | Ø32 | B500B | 804.2 | 491 | 25.6 |
| 2 | Ø32 | B500B | 804.2 | 478 | 47.2 |
| 3 | Ø32 | B500B | 804.2 | 472 | 38.5 |
References
- DIN EN 1992-4. Eurocode 2—Design of Concrete Structures—Part 4: Design of Fastenings for Use in Concrete; Deutsches Institut für Normung: Berlin, Germany, 2019. [Google Scholar]
- EAD 330499-00-0601. Bonded Fasteners for Use in Concrete; European Organisation for Technical Assessment (EOTA): Brussels, Belgium, 2017. [Google Scholar]
- Friberg, B.F. Design of Dowels in Transverse Joints of Concrete Pavements. Am. Soc. Civ. Eng. 1938, 64, 1809–1828. [Google Scholar]
- Friberg, B.F. Load and deflection characteristics of dowles in transverse joints of concrete pavements. In Proceedings of the Eighteenth Annual Meeting of the Highway Research Board Held at Washington, Washington, DC, USA, 28 November–2 December 1938; Volume 18, pp. 140–161. [Google Scholar]
- Paulay, T.; Park, R.; Phillips, M.H. Horizontal Construction Joints in Cast-In-Place Reinforced Concrete. J. Am. Concr. Inst. 1974, 42, 599–616. [Google Scholar]
- Rasmussen, B.H. The Carrying Capacity of Transversely Loaded Bolts and Dowles Embded in Concrete. Bygn. Medd. 1963, 34, 39–55. [Google Scholar]
- Vintzeleou, E.N.; Tassios, T. Behavior of Dowels under Cyclic Deformations. ACI Struct. J. 1987, 84, 18–30. [Google Scholar]
- DAfStb 346. Tragfähigkeit Geschweißter Verbindungen im Betonfertigteilbau; Deutscher Ausschuss für Stahlbeton: Berlin-München, Germany, 1983. [Google Scholar]
- DAfStb 424. Tragverhalten von Befestigungen unter Querlasten in ungerissenem Beton; Deutscher Ausschuss für Stahlbeton: Berlin, Germany, 1992. [Google Scholar]
- Kim, Y.H.; Trejo, D. Large-Diameter Shear Connector Systems for Full-Depth Precast Overhang Panels: Evaluation and Design. ACI Struct. J. 2015, 112, 439–449. [Google Scholar] [CrossRef]
- Kim, Y.H.; Trejo, D. Shear-Transfer Mechanism and Design of Shear Connectors for Full-Depth Precast Deck Panel System. ACI Struct. J. 2014, 111, 935–944. [Google Scholar] [CrossRef]
- Welz, G.; Eligehausen, R. Tragverhalten und Bemessung von Injektionsdübeln unter Quer- und Schrägzugbelastung im Mauerwerk. Ph.D. Thesis, University of Stuttgart, Germany, Stuttgart, 12 July 2011. [Google Scholar]
- Lungerhausen, H. Zur Schubtragfähigkeit von Kopfbolzendübeln. Rep. Tech. 1988, Notification Nr. 88-7, 10–26. [Google Scholar]
- Eligehausen, R. Befestigungstechnik im Beton- und Mauerwerksbau; Ernst und Sohn: Berlin, Germany, 2000; pp. 100–180. [Google Scholar]
- Grosser, P.R.; Eligehausen, R. Load-Bearing Behavior and Design of Anchorages Subjected to Shear and Torsion Loading in Uncracked Concrete. Ph.D. Thesis, University of Stuttgart, Germany, Stuttgart, 31 July 2012. [Google Scholar]
- Sklarov, N. Contribution to Load Bearing Behaviour of Bonded Anchors under Seismic Loads. Ph.D. Thesis, University of Kaiserslautern, Kaiserslautern, Germany, 2021. (Unpublished). [Google Scholar]
- DIN EN 1993-1-4. Eurocode 3: Design of Steel Structures—Part 1-4: General Rules—Supplementary Rules for Stainless Steels; Deutsches Institut für Normung: Berlin, Germany, 2015. [Google Scholar]
- DIN EN 1993-1-8. Eurocode 3: Design of Steel Structures—Part 1-8: Design of Joints; Deutsches Institut für Normung: Berlin, Germany, 2010. [Google Scholar]
- DIN EN ISO 898-1. Mechanical Properties of Fasteners Made of Carbon Steel and Alloy Steel—Part 1: Bolts, Screws and Studs with Specified Property Classes—Coarse Thread and Fine Pitch Thread (ISO 898-1:2013); Deutsches Institut für Normung: Berlin, Germany, 2013. [Google Scholar]
- VDI 2230 Part 1. Systematic Calculation of Highly Stressed Bolted Joints Joints with One Cylindrical Bolt; Verein Deutscher Ingenieuere (VDI): Düsseldorf, Germany, 2015. [Google Scholar]
- DIN EN ISO 3506-1. Mechanical Properties of Corrosion-Resistant Stainless Steel Fasteners—Part 1: Bolts, Screws and Studs (ISO 3506-1:2020); Deutsches Institut für Normung: Berlin, Germany, 2020. [Google Scholar]
- DIN 18800-1. Steel Structures—Part 1: Design and Construction; Deutsches Institut für Normung: Berlin, Germany, 2008. [Google Scholar]
- Mises, V.R. Mechanics of solid bodies in the plastically-deformable state. Nachr. Ges. Wiss. Göttingen 1913, 4, 582–592. [Google Scholar]
- Gottstein, G. Mechanical properties. In Materialwissenschaft und Werkstofftechnik, 4th ed.; Springer Vieweg: Berlin/Heidelberg, Germany, 2014; pp. 207–272. [Google Scholar]
- Gottstein, G. Physikalische Grundlagen der Materialkunde, 3rd ed.; Springer Vieweg: Berlin/Heidelberg, Germany, 2007; pp. 210–239. [Google Scholar]
- Dieter, G.E. Mechanical Metallurgy, 1st ed.; Mehl, R.F., Bever, M.B., Eds.; Indian Edition; McGraw-Hill: New York, NY, USA, 1961; pp. 81–111. [Google Scholar]
- Roos, E.; Maile, K.; Seidenfuß, M. Werkstoffkunde für Ingenieure, 6th ed.; Springer Vieweg: Berlin/Heidelberg, Germany, 2017; pp. 114–119. [Google Scholar]
- DIN 50125. Testing of Metallic Materials—Tensile Test Pieces; Deutsches Institut für Normung: Berlin, Germany, 2016. [Google Scholar]
- RTSS Videoextensometer: Limess Messtechnik und Software GmbH. Available online: https://www.limess.com/de/produkte/rtss-videoextensometer (accessed on 28 September 2020).
- DIN EN ISO 6892-1. Metallic Materials—Tensile Testing—Part 1: Method of Test at Room Temperature (ISO 6892-1:2019); Deutsches Institut für Normung: Berlin, Germany, 2020. [Google Scholar]
- DIN EN 28749. Pins and Grooved Pins; Shear test; (ISO 8749: 1986); Deutsches Institut für Normung: Berlin, Germany, 1992. [Google Scholar]
- TR 048. Details of Test for Post-Installed Fasteners in Concrete; European Organisation for Technical Assessment (EOTA): Brussels, Belgium, 2016. [Google Scholar]
- TR 049. Post-Installed Fasteners in Concrete under Seismic Action; European Organisation for Technical Assessment (EOTA): Brussels, Belgium, 2016. [Google Scholar]
- EAD 330232-00-0601. Mechanical Fasterners for Use in Concrete; European Organisation for Technical Assessment (EOTA): Brussels, Belgium, 2016. [Google Scholar]
Figure 1.
Dislocation: (a) changing the crystal structure, (b) retaining the crystal structure [24] (p. 220).
Figure 1.
Dislocation: (a) changing the crystal structure, (b) retaining the crystal structure [24] (p. 220).

Figure 2.
Diagram for calculating critical resolved shear stress [26] (p. 99).
Figure 2.
Diagram for calculating critical resolved shear stress [26] (p. 99).

Figure 3.
Modulus of plasticity .

Figure 4.
Tensile specimens: (a) form A, (b) form B.

Figure 5.
Tensile test: (a) contactless measuring system, (b) tensile specimen.

Figure 6.
Shear test: (a) test setup, (b) pass cylinder.

Figure 7.
Reduction factors

Figure 8.
Plasticity.

Figure 9.
Shear test: (a) with slip in the hole wall, (b) without slip in the hole wall.

Table 1.
Reduction factors from current standards.
| Standard | 4.8 | 5.6 | 8.8 | A4/70 |
|---|---|---|---|---|
| DIN EN 1993-1-4 [17] DIN EN 1993-1-8 [18] | 0.50 | 0.60 | 0.60 | 0.70 |
| VDI 2230 [19,20,21] | 0.62 | 0.70 | 0.65 | 0.72 |
| DIN18800-1 [22] | 0.55 | 0.60 | 0.60 | - |
| EAD 330499-00-0601 [2] | - | - | 0.50 | - |
Table 2.
Steel grade.
| Size | Steel Grade | |
|---|---|---|
| (-) | (mm) | (-) |
| M8 M20 | 8 20 | 4.8 8.8 A4/70 |
| M20 | 20 | 5.6 |
| M24 | 24 | 8.8 |
| M30 | 30 | |
| Ø8 | 8 | B500 B |
| Ø20 | 20 | |
| Ø25 | 25 | |
| Ø32 | 32 |
Table 3.
Geometries of the tensile specimens.
| Form | Size | d0 | L0 | d1 | r | h | Lc | Lt |
|---|---|---|---|---|---|---|---|---|
| A | M20|Ø20 | 12 | 60 | 15 | 9 | 150 | 72 | 382 |
| A | M24|Ø25 | 14 | 70 | 17 | 11 | 150 | 84 | 396 |
| A | M30|Ø32 | 20 | 100 | 24 | 15 | 150 | 120 | 435 |
| B | M8|Ø8 | 5 | 25 | M8 | 4 | 20 | 30 | 77 |
| B | M20|Ø20 | 14 | 70 | M20 | 11 | 40 | 95 | 180 |
Table 4.
Shear plate geometry.
| Shear Plate | Base Plate | ||||||
|---|---|---|---|---|---|---|---|
| Size | df | h1 | h2 | b1 | h1 | h2 | b1 |
| (-) | (mm) | (mm) | (mm) | (mm) | (mm) | (mm) | (mm) |
| M8 | 8 | 5 | 8 | 90 | 5 | 50 | 90 |
| M20 | 20 | 5 | 20 | 90 | 5 | 50 | 90 |
| M24 | 24 | 5 | 24 | 90 | 5 | 50 | 90 |
| M30 | 30 | 5 | 30 | 90 | 5 | 50 | 90 |
| Ø8 | 9 | 5 | 8 | 90 | 5 | 50 | 90 |
| Ø20 | 22 | 5 | 20 | 90 | 5 | 50 | 90 |
| Ø25 | 29 | 5 | 25 | 90 | 5 | 50 | 90 |
| Ø32 | 35 | 5 | 32 | 90 | 5 | 50 | 90 |
Table 5.
Average values of tensile and shear stresses.
| Size | Material | |||
|---|---|---|---|---|
| (-) | (-) | (N/mm2) | (N/mm2) | (-) |
| M8 | 4.8 | 544 | 314 | 0.58 |
| M8 | 8.8 | 973 | 549 | 0.56 |
| M8 | A4 | 777 | 536 | 0.69 |
| Ø8 | B500B | 609 | 445 | 0.73 |
| M20 | 4.8 | 423 | 283 | 0.67 |
| M20 | 5.6 | 579 | 372 | 0.64 |
| M20 | 8.8 | 952 | 545 | 0.57 |
| M20 | 8.8 | 1014 | 532 ** | 0.52 |
| M20 | A4 | 775 | 538 | 0.69 |
| Ø20 | B500B | 621 | 495 | 0.80 |
| M24 | 8.8 | 939 | 522 | 0.56 |
| Ø25 | B500B | 629 | 445 | 0.71 |
| M30 | 8.8 | 1032 | 621 | 0.60 |
| Ø32 | B500B | 609 | 480 | 0.79 |
** The steel shear strength was determined using the shear tests in concrete.
Table 6.
Average values of tensile component.
| Size | Material | |||
|---|---|---|---|---|
| (-) | (-) | (N/mm2) | (N/mm2) | (-) |
| M8 | 4.8 | 314 | 65 | 0.21 |
| M8 | 8.8 | 549 | 77 | 0.14 |
| M8 | A4 | 536 | 61 | 0.11 |
| Ø8 | B500B | 445 | 43 * | 0.07 |
| M20 | 4.8 | 283 | 19 | 0.07 |
| M20 | 5.6 | 372 | 22 | 0.06 |
| M20 | 8.8 | 545 | 32 | 0.06 |
| M20 | A4 | 538 | 29 | 0.05 |
| Ø20 | B500B | 495 | 23 * | 0.05 |
| M24 | 8.8 | 522 | 38 | 0.07 |
| Ø25 | B500B | 445 | 44 * | 0.10 |
| M30 | 8.8 | 621 | 53 | 0.09 |
| Ø32 | B500B | 480 | 38 * | 0.08 |
* The tensile force may be higher than specified because the bar end of the rebars was held in place on the base plate side with tensioning wedges. Slippage of the tensioning wedges cannot be excluded.
Publisher’s Note: MDPI stays neutral with regard to jurisdictional claims in published maps and institutional affiliations. |
© 2020 by the authors. Licensee MDPI, Basel, Switzerland. This article is an open access article distributed under the terms and conditions of the Creative Commons Attribution (CC BY) license (http://creativecommons.org/licenses/by/4.0/).
Share and Cite
MDPI and ACS Style
Sklarov, N.; Thiele, C. Material-Dependent Shear Capacity of Threaded Rods. CivilEng 2020, 1, 351-367. https://0-doi-org.brum.beds.ac.uk/10.3390/civileng1030022
AMA Style
Sklarov N, Thiele C. Material-Dependent Shear Capacity of Threaded Rods. CivilEng. 2020; 1(3):351-367. https://0-doi-org.brum.beds.ac.uk/10.3390/civileng1030022
Chicago/Turabian StyleSklarov, Nikolai, and Catherina Thiele. 2020. "Material-Dependent Shear Capacity of Threaded Rods" CivilEng 1, no. 3: 351-367. https://0-doi-org.brum.beds.ac.uk/10.3390/civileng1030022