Testing and Evaluation of Anchor Channels under Fatigue Loading

Materials Testing Institute, University of Stuttgart, Pfaffenwaldring 4d, 70569 Stuttgart, Germany
*
Author to whom correspondence should be addressed.
CivilEng 2021, 2(1), 1-13; https://0-doi-org.brum.beds.ac.uk/10.3390/civileng2010001
Submission received: 1 December 2020
/
Revised: 19 December 2020
/
Accepted: 22 December 2020
/
Published: 24 December 2020
(This article belongs to the Special Issue Connections in Concrete)
Abstract
:Cast-in anchor channels are used to connect steel components to concrete structures e.g., for elevators, cranes or machines, where repeated load cycles require verification against fatigue failure. The fatigue resistance of anchor channels may be determined by tests according to the interactive method, which provides a complete description of the S/N curve from one to infinite load cycles according to the current assessment document. This procedure differs from conventional fatigue concepts, which do not consider loads that are part of low cycle fatigue, but also question the general existence of an endurance limit. An alternative approach presented in this paper is based on the assumption that the S/N curve can be approximated by a bilinear function. The procedure for the evaluation of fatigue tests on anchor channels embedded in concrete is described. A comparison with the current qualification criteria is given by a test example to discuss the applicability of the proposed method.
1. Introduction
Anchor channels are considered a proven fastening system in today’s reinforced concrete constructions, providing versatile solutions for the connection of different components. The products currently available on the market consist of a C- or V-shaped steel profile with rigidly fixed anchors on its back that ensure the load transfer into the concrete. Special channel bolts can be placed flexibly along the longitudinal axis of the channel profile to attach structural components.
The use of anchor channels is not limited to static or quasi-static load cases, but can also be extended to fatigue-relevant applications. Repeated cyclic actions become increasingly important due to more filigree building structures as well as modern machinery and production systems. As typical examples, fastenings of cranes, guide rails of elevators and rotating parts of machines are mentioned in EN 1992-4 [1], but actions resulting from high speed traffic of railways or temperature variations in façade elements should also be taken into account. In such cases, fatigue verification must be performed to prevent failure of the anchorage.
Anchor channels have been the subject of numerous research work in the past. Previous studies mainly focus on the load-bearing capacity under monotonic loading. This includes the behavior in the case of tension load [2,3] and perpendicular shear load [4,5] as well as the interaction of these two loading directions [2,6]. The load transfer for serrated channels subjected to longitudinal shear was investigated by Schmidt [7] and Konertz et al. [8]. In contrast, knowledge about the influence of cyclic loads acting on anchor channels is rather limited. The suitability of anchor channels for earthquake loads was verified by means of simulated seismic tests performed in the low cycle range [9] and initial detailed investigations on the behavior under fatigue loading were carried out in [10,11]. However, the study of fatigue resistance under combined static and cyclic loads is still part of ongoing research [12,13].
EN 1992-4 provides European standardized regulations for the design of fastenings including anchor channels in reinforced concrete. For repeated cyclic actions, the standard requires an additional verification of the fatigue resistance beside the static proof. However, the provisions concerning fatigue apply for post-installed anchors and headed studs only, while the verification of anchor channels is not included. Consequently, the Technical Report EOTA TR 050 [14] provides separate design rules for anchor channels under fatigue loading. The application is currently limited to products that transfer fatigue tension loads.
Due to the special construction of anchor channels including different geometries, materials and manufacturing methods, the fatigue resistance is product dependent. Therefore, the products need to be qualified by appropriate tests, and the resulting resistance values and application conditions are provided in a European Technical Assessment (ETA). The European Assessment Document EAD 330008-02-0601 [15] serves as a current qualification guideline. The guideline specifies test procedures and assessment methods for the determination of the fatigue resistance by considering different failure modes, namely steel failure, concrete cone failure and pullout failure.
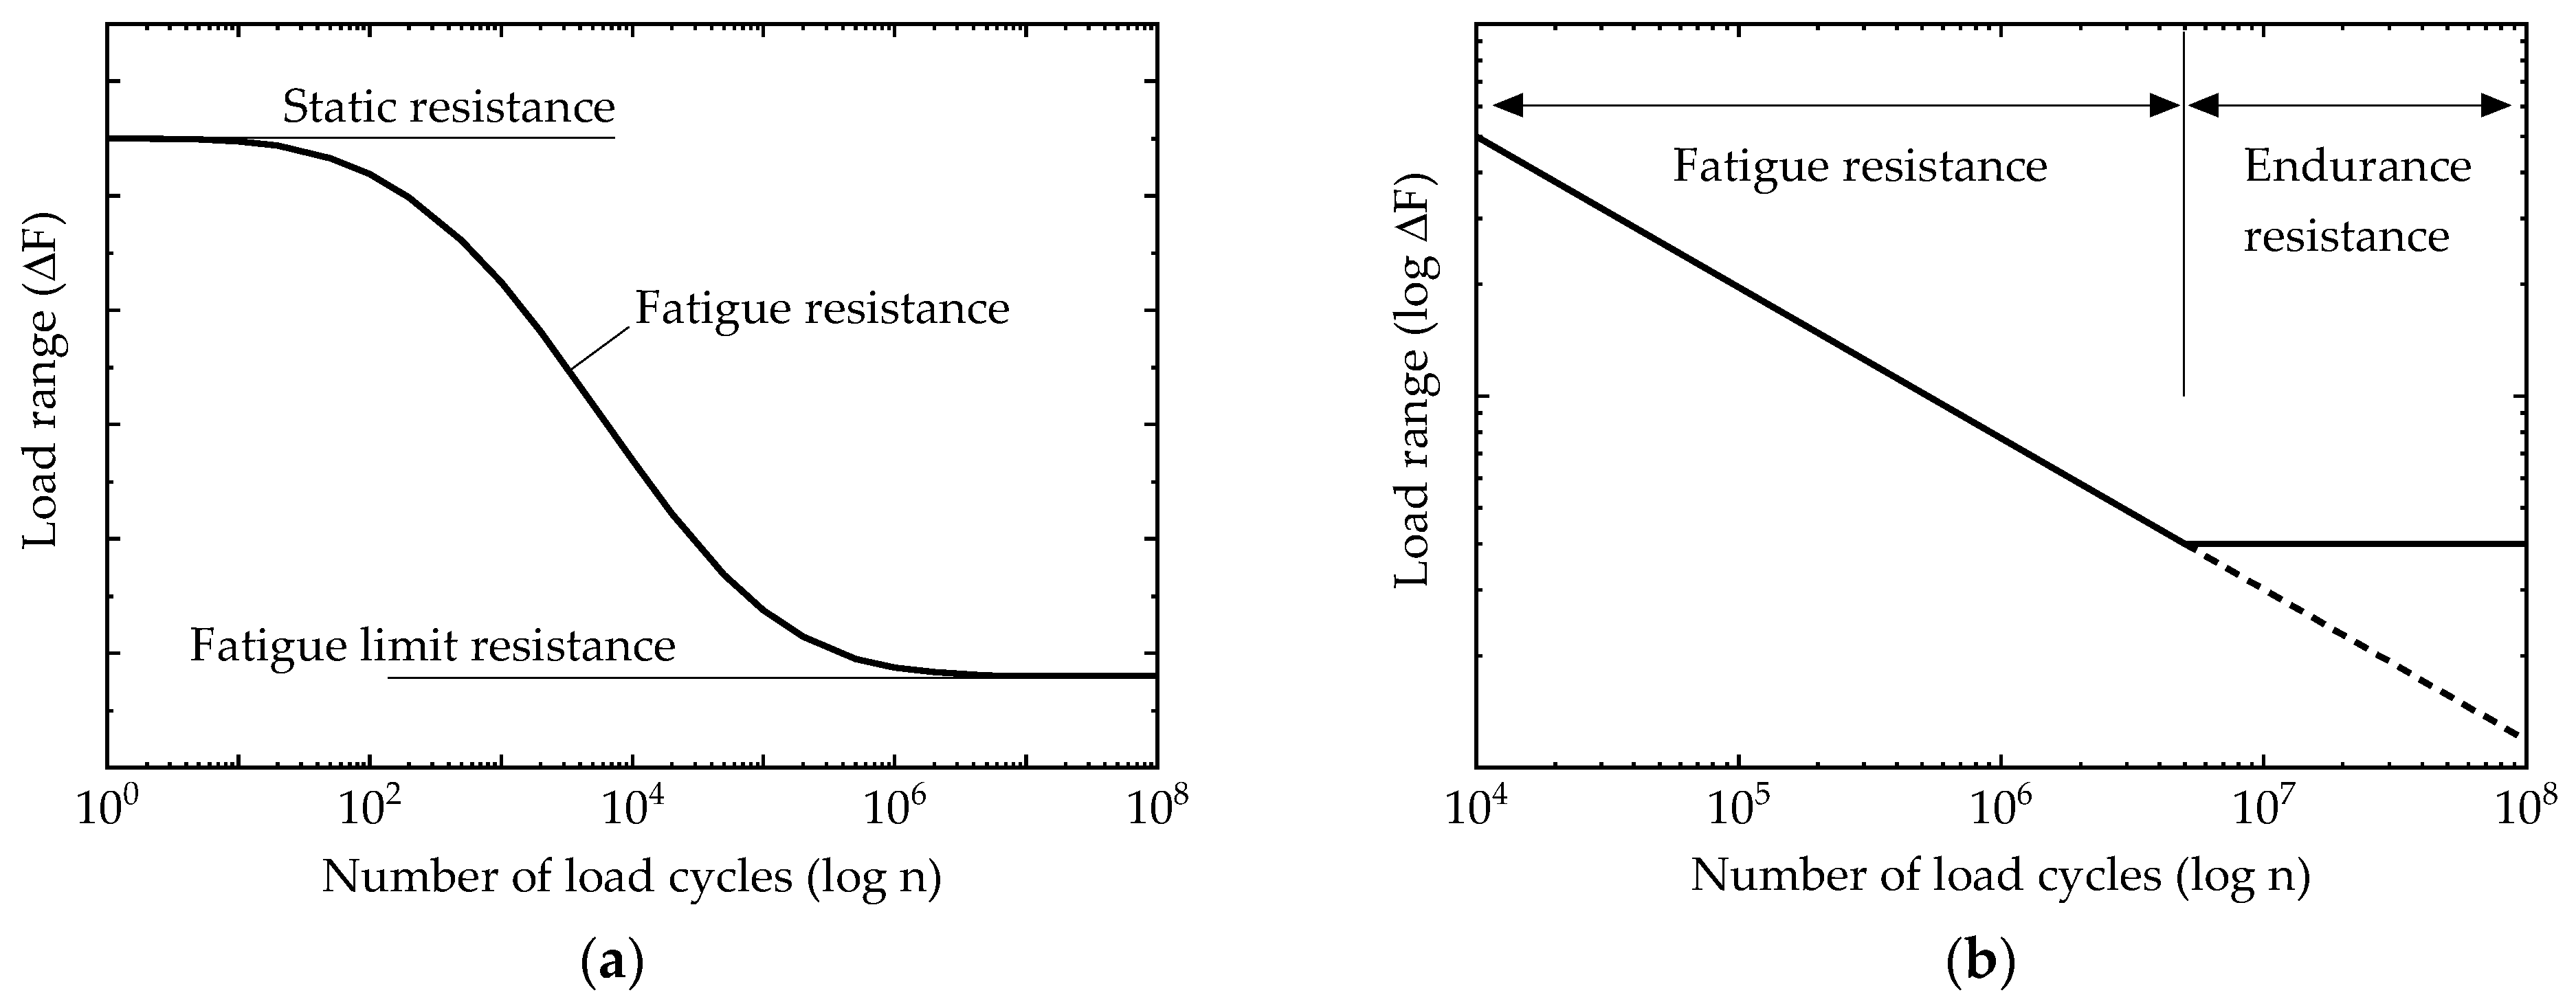
The available test methods are based on the principles of the interactive method [16,17,18]. The method is used to establish the S/N curve as a continuous function from one load cycle corresponding to the static resistance up to the fatigue limit resistance for infinite load cycles as shown in Figure 1a. This procedure is somewhat different from existing concepts, for example, for the fatigue design of reinforced concrete according to EN 1992-1-1 [19], steel according to EN 1993-1-9 [20] or composite structures according to 1994-1-1 [21]. These concepts have in common that the evaluation of load-controlled tests is performed in the area of high cycle fatigue under the assumption of linear-elastic material behavior. Consequently, test results of less than approximately 104 cycles with high load amplitudes exhibiting large plastic deformations are not considered in this case. In addition, the interactive method is based on a nonlinear function, which is used to evaluate the test results by an S-shaped curve fit between two horizontal lines representing the static resistance and the fatigue limit. However, the course of the S/N curve in the area of very high cycles is still a matter of discussion, as some materials do not show a clear endurance limit, which has been indicated by several studies not only in the case of concrete failure [22,23] but also for steel materials [24,25].
This paper presents an alternative approach for the assessment of anchor channels for steel failure under fatigue loading. Similar to the existing Eurocode concept for the fatigue evaluation of steel components, the method is based on the assumption that the fatigue resistance curve can be approximated by a bilinear function when both axes of the S/N diagram are logarithmic-scaled as provided in Figure 1b. The procedure for the evaluation of fatigue tests on anchor channels in concrete is described in the following sections. Finally, a comparison with the current qualification criteria is given by a test example in order to discuss the applicability of the proposed method.
2. Fatigue Behavior of Anchor Channels
The fatigue behavior of anchor channels is characterized by the interaction between the channel bolt, the channel profile and the anchor. As a result of the complex load transfer, various types of failure are possible that can also occur in combined form due to load redistributions in the anchorage system. The different failure modes under tension load according to EN 1992-4 [1] are illustrated in Figure 2.
Contrary to the behavior under static load, fatigue resistance is a time-dependent value and the decisive failure mode is related to the applied load range and the number of cycles. Previous studies have shown that steel failure often becomes crucial in the case of high cycle tension loads [10,12]. However, anchor channels can also exhibit concrete related fatigue failure, e.g., if they are installed close to the edge. These cases have not yet been investigated in detail. Nevertheless, it can be assumed that the fatigue resistance for concrete failure is about 50% of the static resistance at 2∙106 load cycles according to EN 1992-4 [1].
In the case of steel failure, fatigue fracture is usually initiated at notches with high stress concentration that can occur at several locations of the anchor channel. The following sections show examples of typical failure modes that have been observed by the authors in fatigue tension tests so far.
2.1. Steel Failure of the Channel Bolt
The load is transferred via the channel bolt into the channel profile. This can lead to a fracture of the bolt either in the thread, shaft or head depending on the type of product. The support conditions of the channel profile cause additional bending stresses in the head of the channel bolt, which may affect its fatigue resistance. In this case, internal tests on hook-head and serrated bolts of diameter M12 to M24 have shown that detail category FAT 50 for steel bolts according to EN 1993-1-9 [20] can serve as a good orientation for the selection of the appropriate channel bolt size.
2.2. Steel Failure of the Anchor
The static resistance of the anchor is governed by the cross section of the shaft and its material strength, while the anchor should be designed to prevent a failure of the anchor head. In contrast, no failure along the plain shaft length is to be expected under cyclic loading, but the transition area from the shaft to the anchor head provides a local notch that has to be considered for fatigue.
2.3. Steel Failure of the Connection Anchor Channel
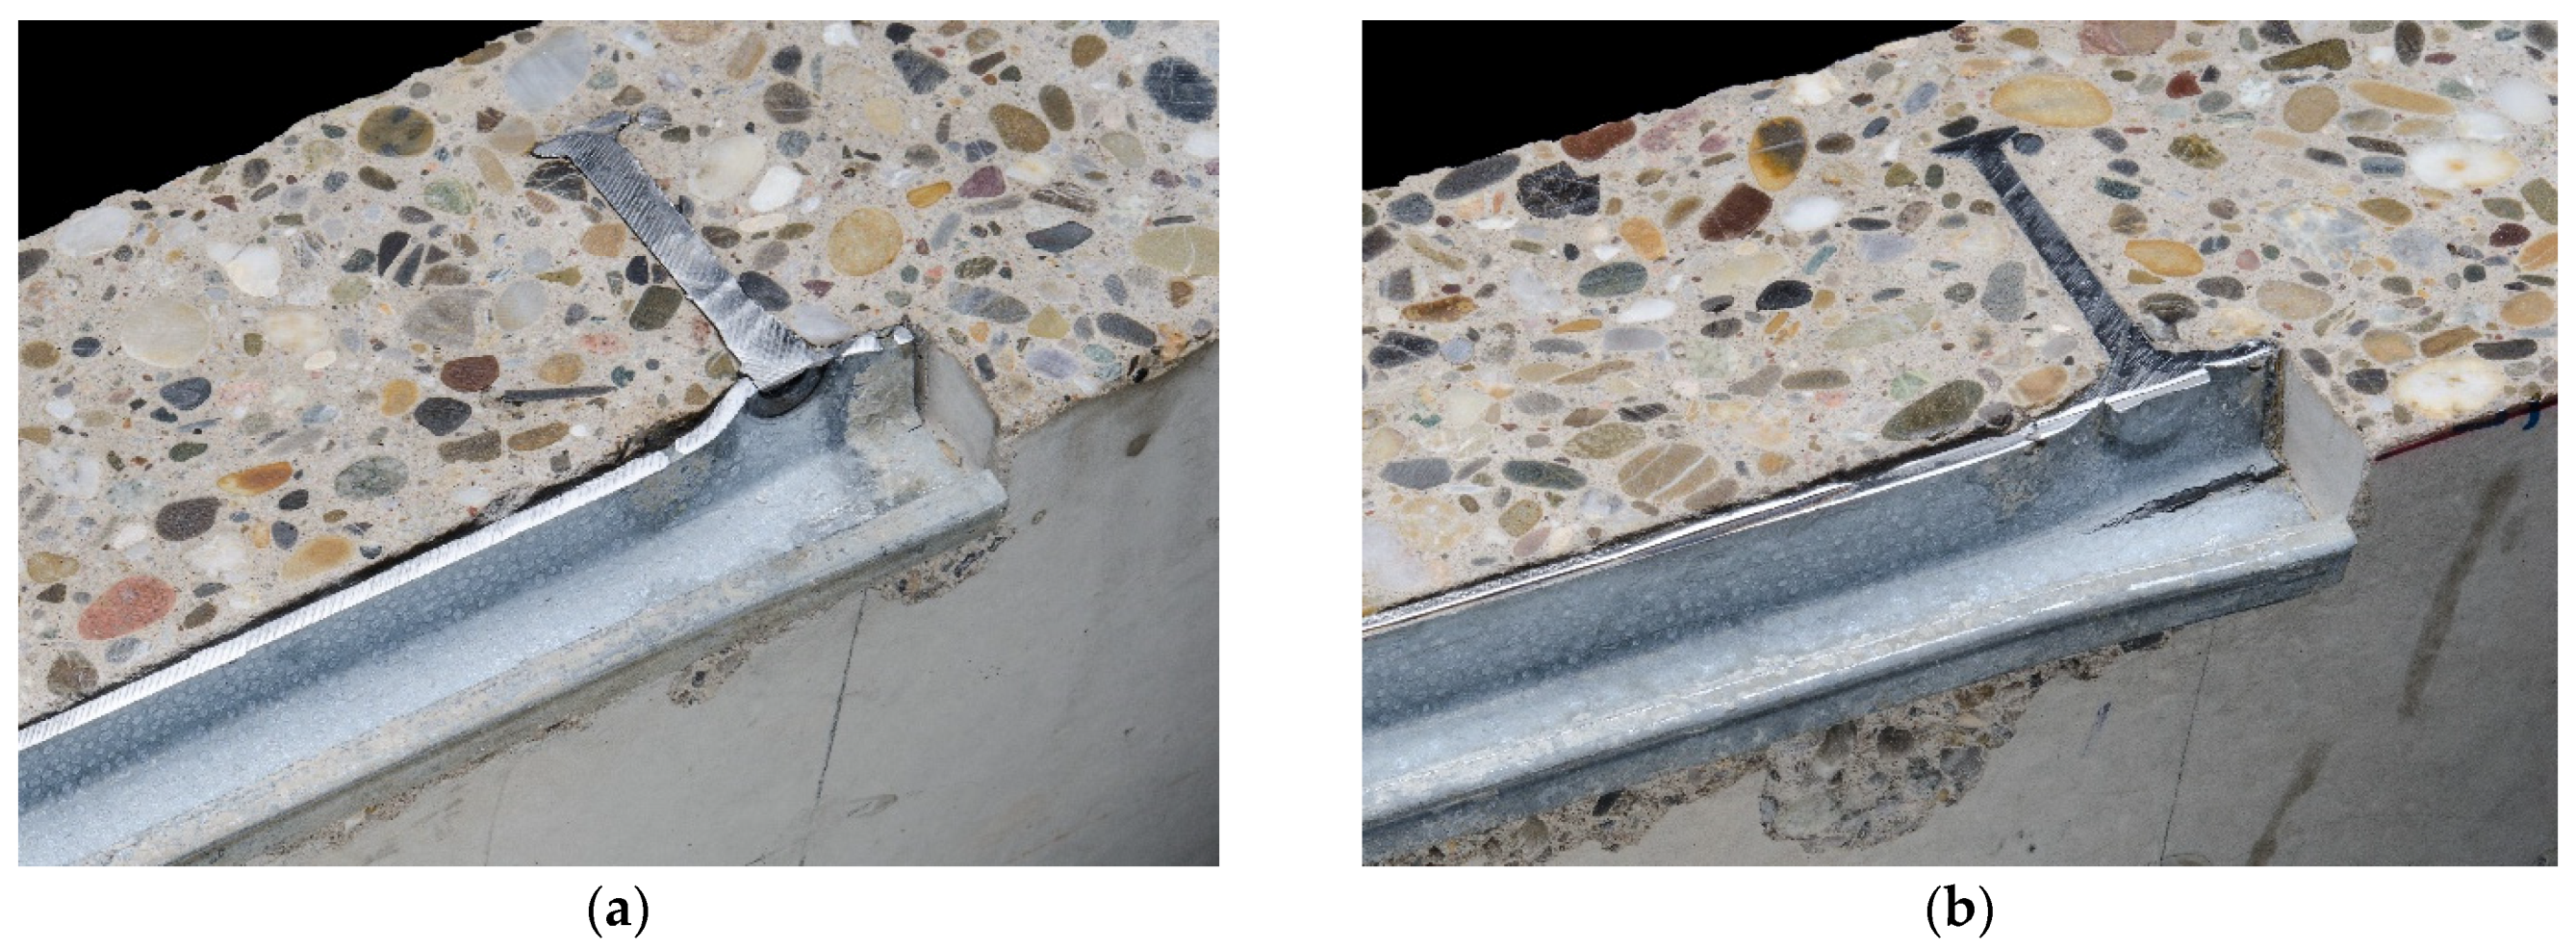
The connection between the anchor and the channel profile represents a typical location for fatigue failure of anchor channels. In addition to the load concentration at this point, the manufacturing method of the connection plays an important role for a potential fracture. Welded anchors usually fail by cracking of the welded seam, whereas bolted connections can fail in the threaded part. For anchors fixed by forging, a fracture of the forged head is often observed, see Figure 3a. If cracks are formed in the channel profile, it is also possible that the anchor is pulled out of the channel back. This can appear for all connection types.
2.4. Steel Failure of the Channel Lips or Flanges
In addition to the connection failure mentioned above, the most common failure mode under fatigue loading is a fracture of the channel flanges. The load acting in the channel bolt is introduced in the anchor channel by contact pressure between the bolt head and the channel lips. This creates a bending moment in the channel lips, which causes tensile stresses on the inner sides of the profile cross section. Typically, local bending of the channel lips under static load is accompanied by large plastic deformations, while the formation of cracks in the profile flanges lead to failure in the case of fatigue. The cracks are initiated in the flanges either close to the channel lips or near the channel back as shown in Figure 3b depending on the geometry and manufacturing process of the channel profile.
2.5. Steel Failure by Flexure of the Channel
If tension forces are applied between the anchors, the channel profile is loaded by bending. In several bending tests performed on anchor channels with two anchors, no flexural failure of the channel could be detected so far, as the fatigue resistance is limited by the local failure of the profile.
3. Evaluation of the Fatigue Resistance
3.1. General Procedure
In general, the fatigue resistance of anchor channels is established by load tests on samples embedded in the concrete. It is necessary to verify the product considering the boundary conditions, since the fatigue behavior is governed not only by the material characteristics, but also by the capacity of the complete anchorage system in which forces can be distributed.
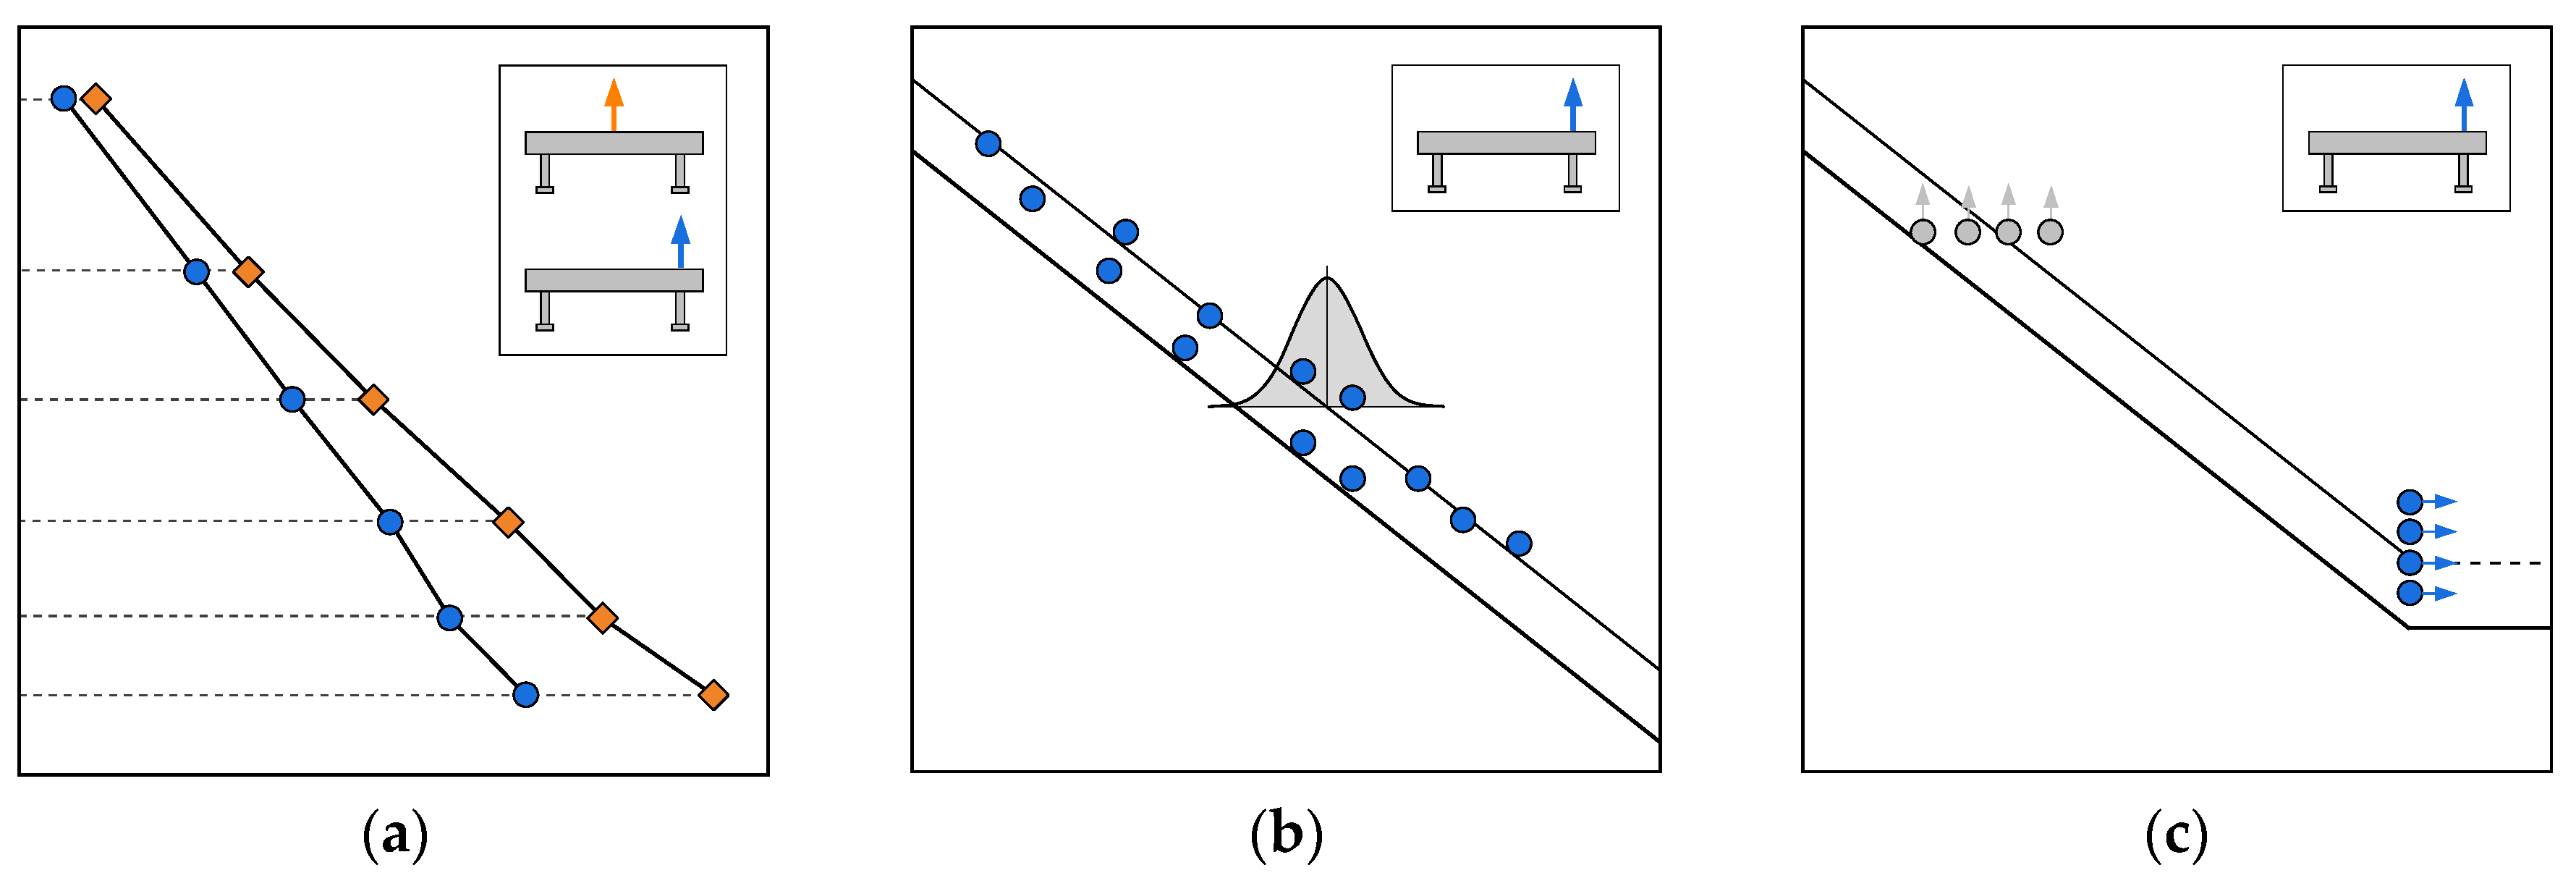
For the sake of simplicity, the fatigue tests are carried out on anchor channels with two anchors representing the minimum number of anchors permitted for the use in practice. Due to the flexible positioning of the channel bolt, the load can be introduced at different locations along the longitudinal axis of the channel profile. Thus, preliminary tests are required in order to identify the unfavorable load position as shown in Figure 4a. Here, a simplified distinction can be made between two specific cases, either the load is applied midway between the two anchors or the channel bolt is located directly over one anchor. The results of both these positions are considered as the maximum allowable resistance relevant for the design provisions given in EOTA TR 050 [14]. Based on the test results, which are product-dependent owing to the ratio of the bending stiffness of the profile to the anchor-related resistance, the position providing the lowest fatigue resistance shall be used for further investigation. This applies in Figure 4a for the tests performed over the anchor colored in blue.
In order to obtain a bilinear S/N curve for the decisive load position, the fatigue evaluation is divided in two parts. In the first step, a linear regression analysis is performed to determine the fatigue resistance for finite life (Figure 4b). The statistical evaluation of the test results corresponds to the principles of EN 1993-1-9 [20], which are documented in the background report to the standard [26]. Afterwards, run-out tests can be used for the verification of the endurance limit resistance as shown in Figure 4c. In the following sections, the proposed procedure for evaluating the fatigue test data is described in detail.
3.2. Linear Regression Analysis
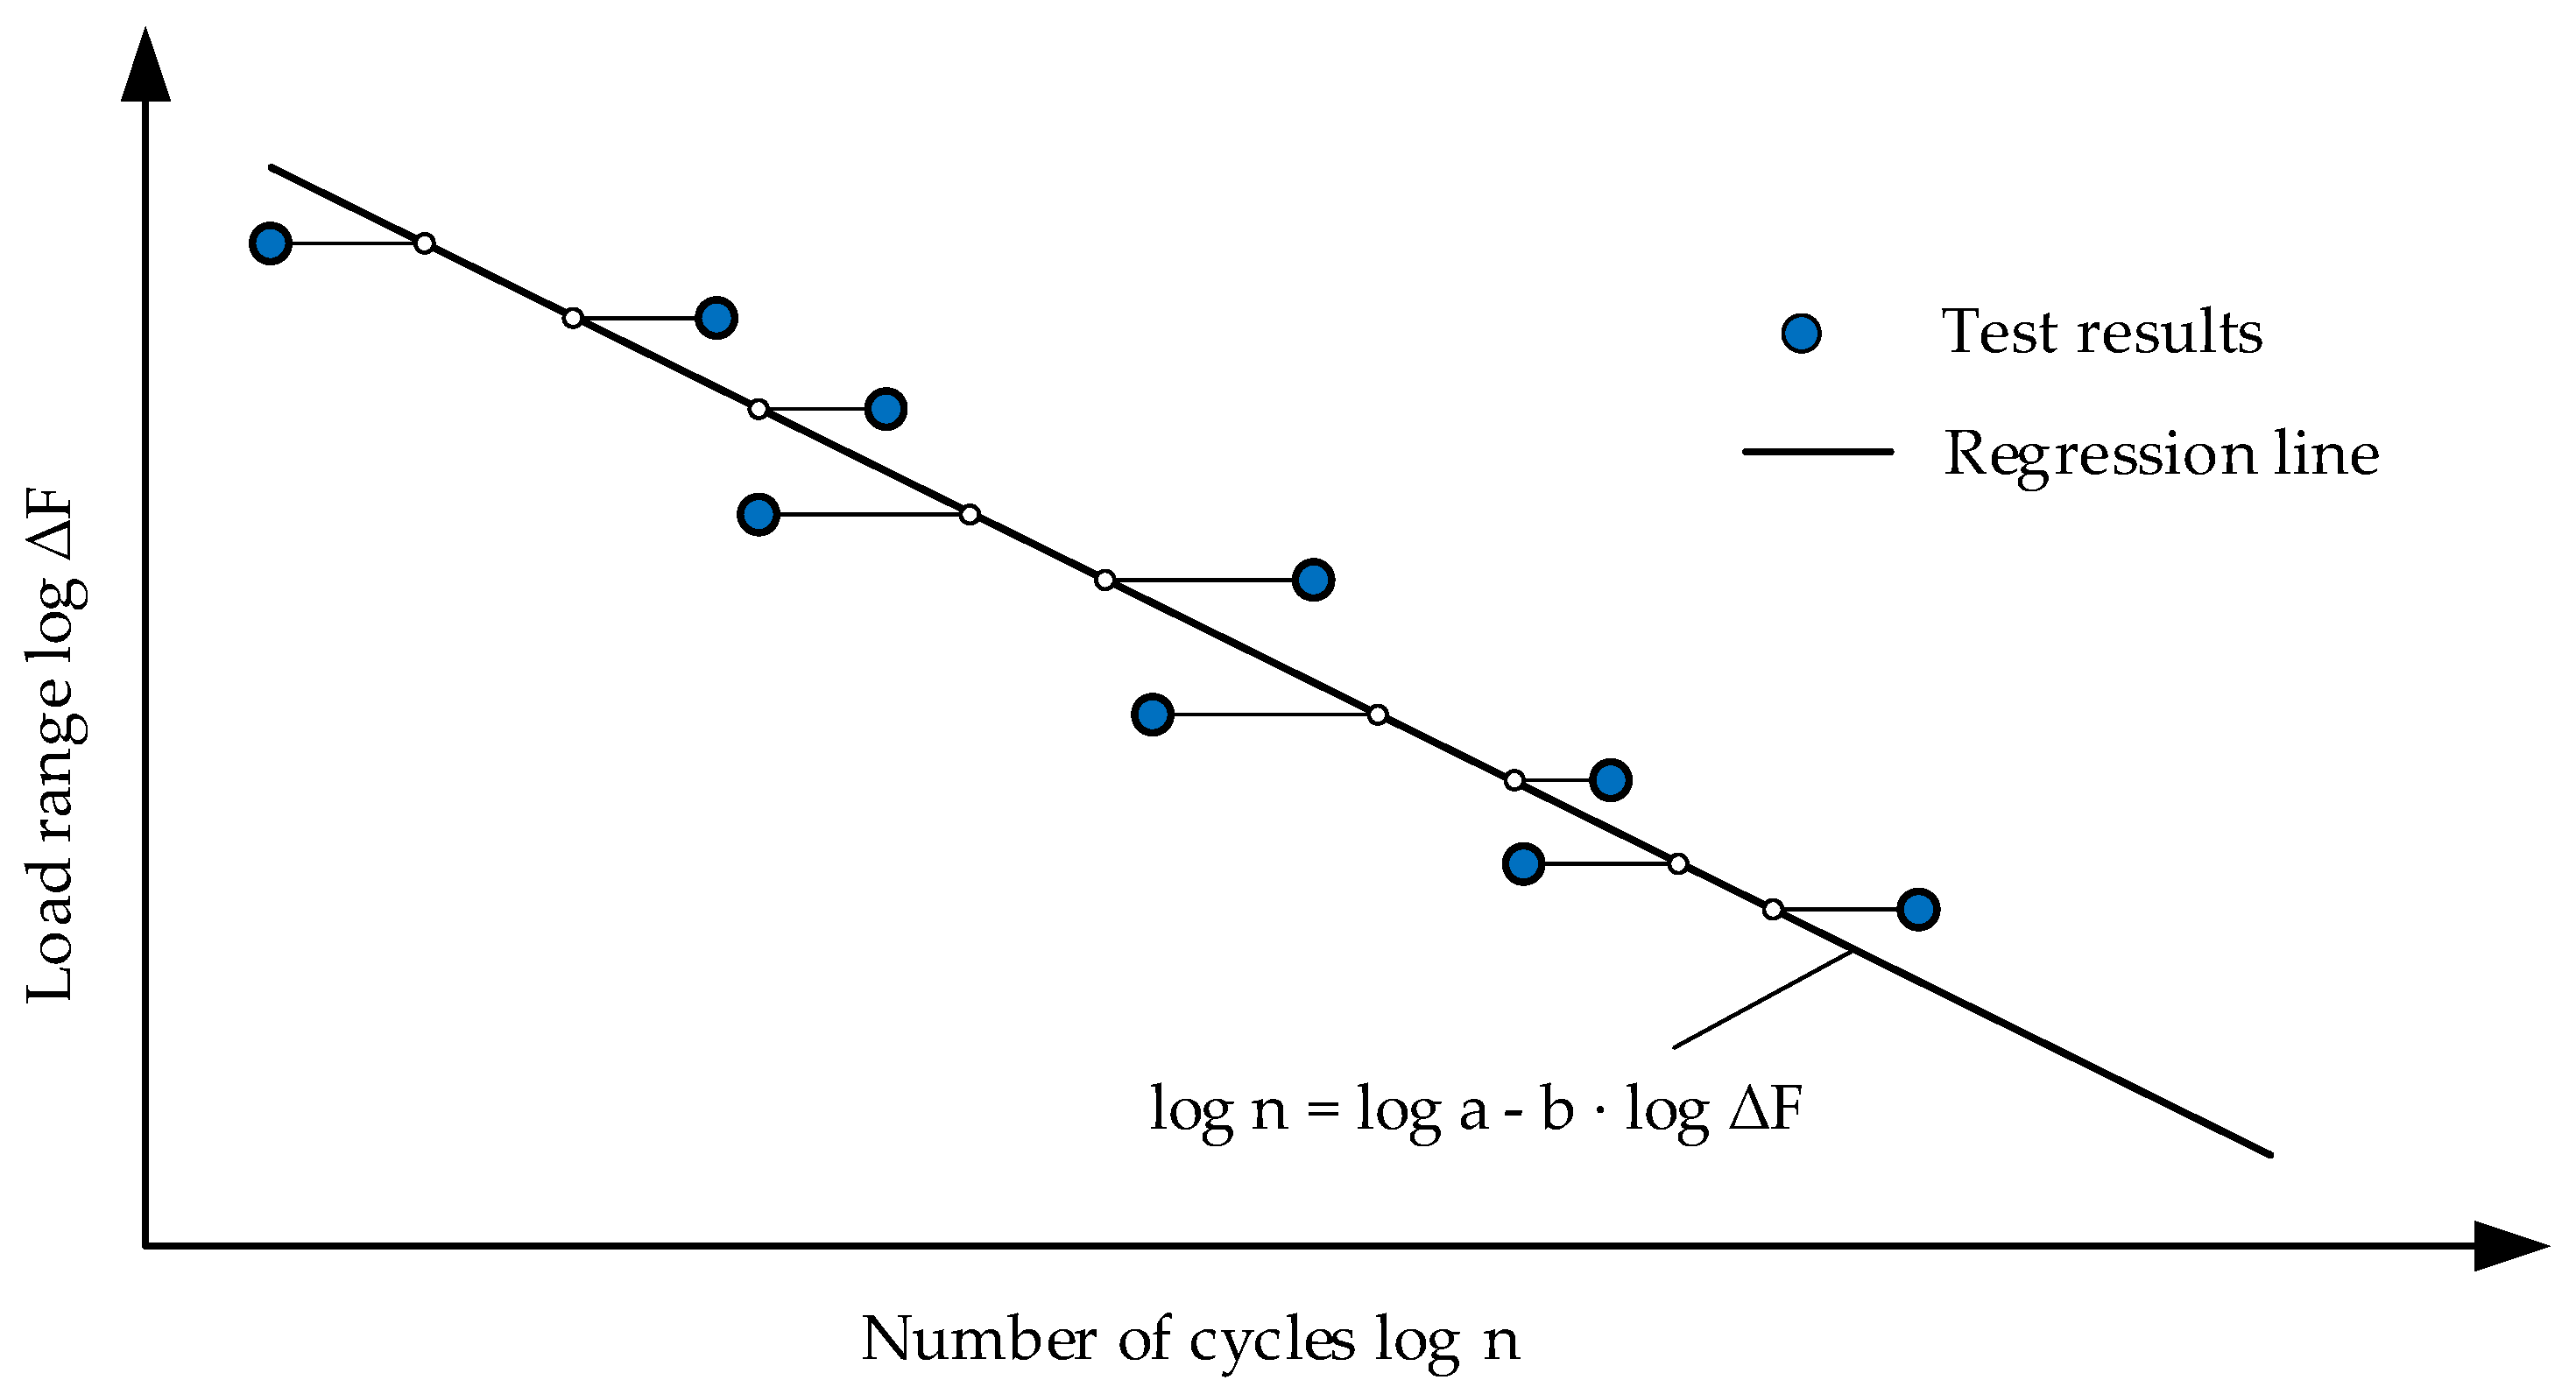
The fatigue resistance in the finite life area is determined by testing samples with different load levels to obtain the number of cycles to failure n for each applied load range ∆F. The pairs of test values are plotted in a diagram with logarithmic scaling of both axes as shown in Figure 5. According to the approach of Basquin [27], a linear relationship between the results is assumed. Thus, the test data can be described by a straight line:
Equation (1) includes two unknown parameters, the position log a and the slope coefficient b of the line, which are estimated by linear regression using the least square method. The best fit for the test results is obtained from the condition that the sum of the squares of the residuals is becoming a minimum. This requires the definition of the dependent variable, for which the curve is optimized. When performing fatigue tests, the applied load is predefined to achieve an indefinite period of fatigue life until failure. Therefore, it is recommended to choose the number of cycles as a dependent variable for the regression analysis.
As a result, the regression parameters a and b are calculated as follows:
where m is the number of test data (pairs of load range ∆Fi and number of cycles ni) and and are the mean values of the test results.
3.3. Characteristic Fatigue Resistance of Finite Life
The so-obtained linear function represents to the mean S/N curve of the test results with a survival probability of 50%. However, the results of fatigue tests usually show a relevant amount of scatter. The standard deviation s can be used to express the variation of the test data. This value is calculated using the sum of the squares of the residuals between test results and regression line in the direction of log n according to Equation (4):
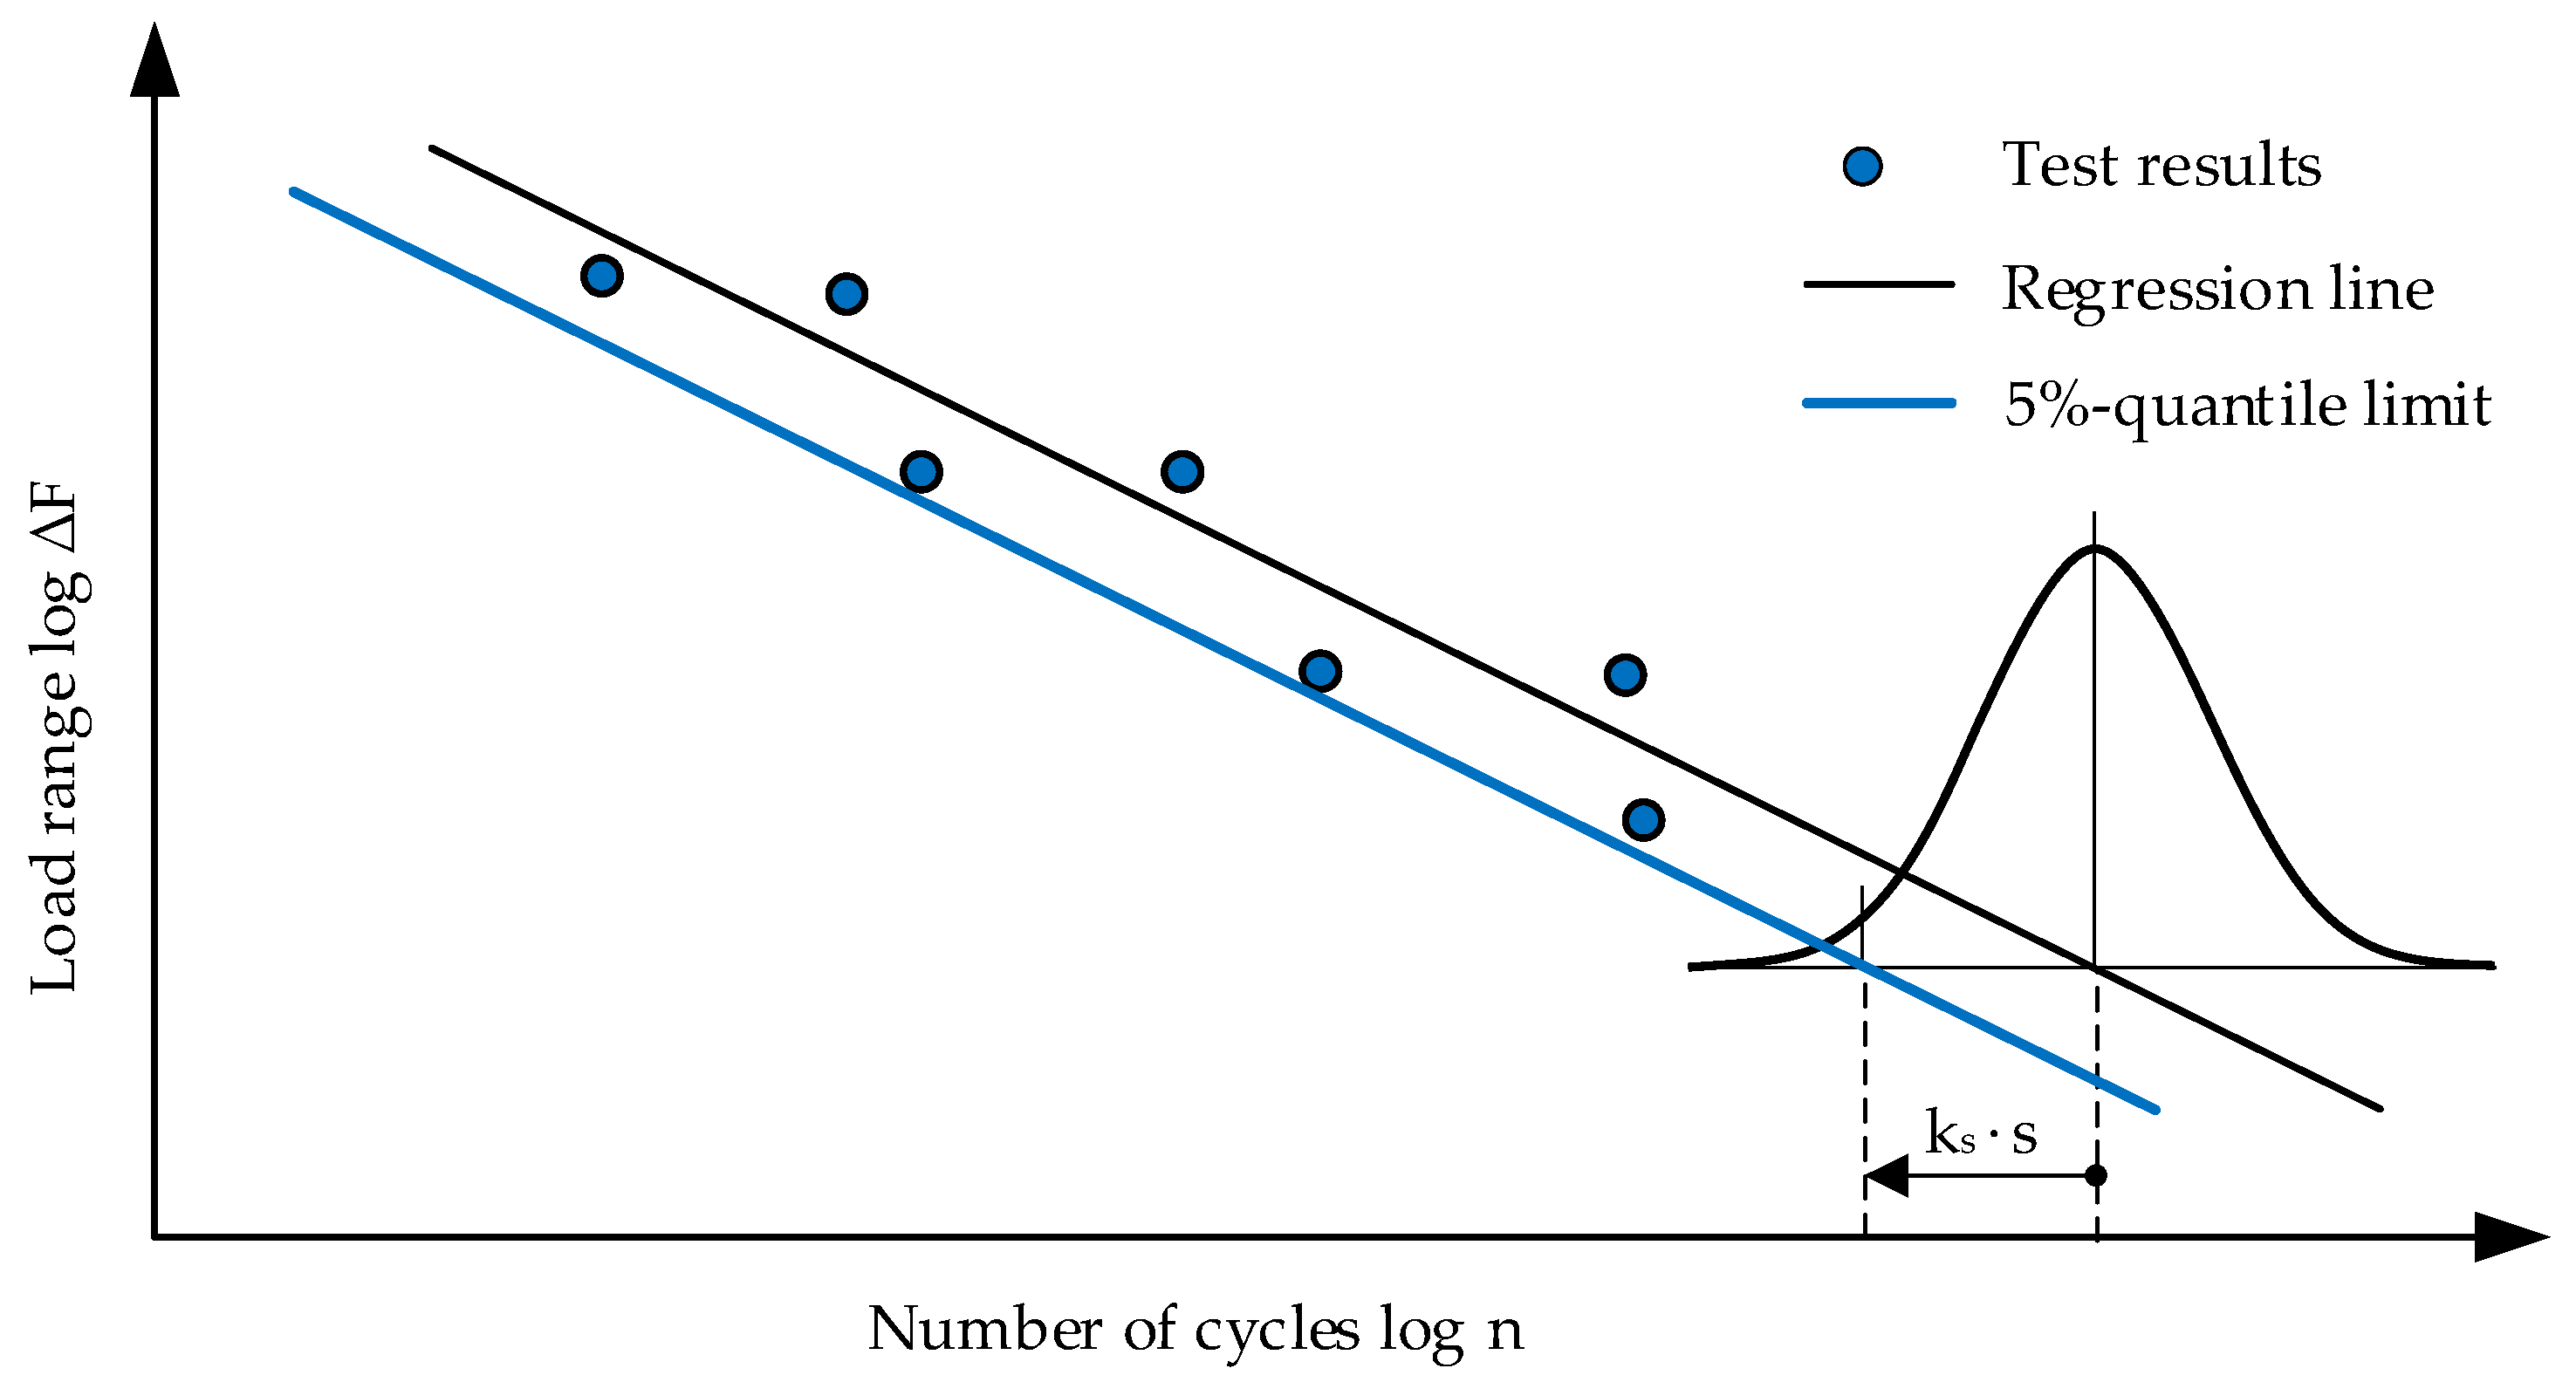
The characteristic S/N curve is established using the 5%-quantile values of the regression line representing the lower confidence limit of the fatigue resistance. For the evaluation, a normal distribution of the logarithmic values of the test result is assumed. Further, it is assumed that the standard deviation is almost constant in the area of finite life. Therefore, the values of the regression line can be reduced by parallel shifting in a horizontal direction, see Figure 6.
Hence, the characteristic fatigue resistance curve can be expressed by the following Equation (5):
where ks is the statistical factor to calculate the 5% characteristic value for a confidence level of 90% and unknown standard deviation according to the EAD 330008-02-0601 [15].
3.4. Verification of Endurance Limit
The linearized characteristic of the fatigue resistance function applies in particular to the finite life area in the range between approximately 104 and 106 load cycles. For a larger number of cycles, the fatigue life increases more quickly with a decreasing load range and the S/N curve becomes flatter. The endurance limit is referred to as the lower limit of the fatigue resistance, which can be expressed by a horizontal course of the S/N curve. The horizontal line implies that load ranges of constant amplitude below this limit can be applied for an infinite number of load cycles without failure.
The endurance limit resistance needs to be established by tests as illustrated in Figure 7. For the verification, at least four run-out samples are required reaching the limit number of load cycles nlim without damage. The limit number of cycles represents the knee point of the S/N curve and must be predefined before testing. If further data from experience are not available, the following values for the expected limit number of cycles are recommended in accordance with the EAD [15]:
- Carbon steel: 5 × 10⁶ ≤ nlim ≤ 8 × 10⁶
- Stainless steel: 7 × 10⁶ ≤ nlim ≤ 1 × 10⁷
The load level for the run-out tests should be chosen in a way that the mean value of the applied load ranges ∆Fm.lim is larger than or equal to the mean fatigue resistance ∆FD at nlim load cycles, which is taken from the regression line according to Equation (1).
Test specimens reaching the limit number of cycles without failure are to be tested again at a higher load level arranged in the upper third of the finite life area. The specimen is considered a true run-out specimen on the first load level if the number of cycles obtained on the second load level exceeds the 5%-quantile function according to Equation (5). Otherwise, the specimen was damaged during the test on the first load level and is not considered to be a real run-out.
If a minimum of four specimens could be evaluated as run-out, then the characteristic endurance limit resistance ∆FD,k is determined using the characteristic value of the regression line according to Equation (5) for nlim load cycles. If no sufficient number of specimens can be identified as run-outs, the limit number of cycles has to be increased and testing for the verification of the endurance limit needs to start again from the beginning.
In the absence of a sufficient amount of run-out tests, the fatigue resistance for a higher number of load cycles can be determined either by setting a second slope, e.g., according to the approach of Haibach [28] or in a more conservative way by extending the slope of the S/N curve from finite life. In these cases, the cut-off limit may be assumed at 1 × 10⁸ cycles as applied for steel components under tension according to EN 1993-1-9 [20].
4. Experimental Example
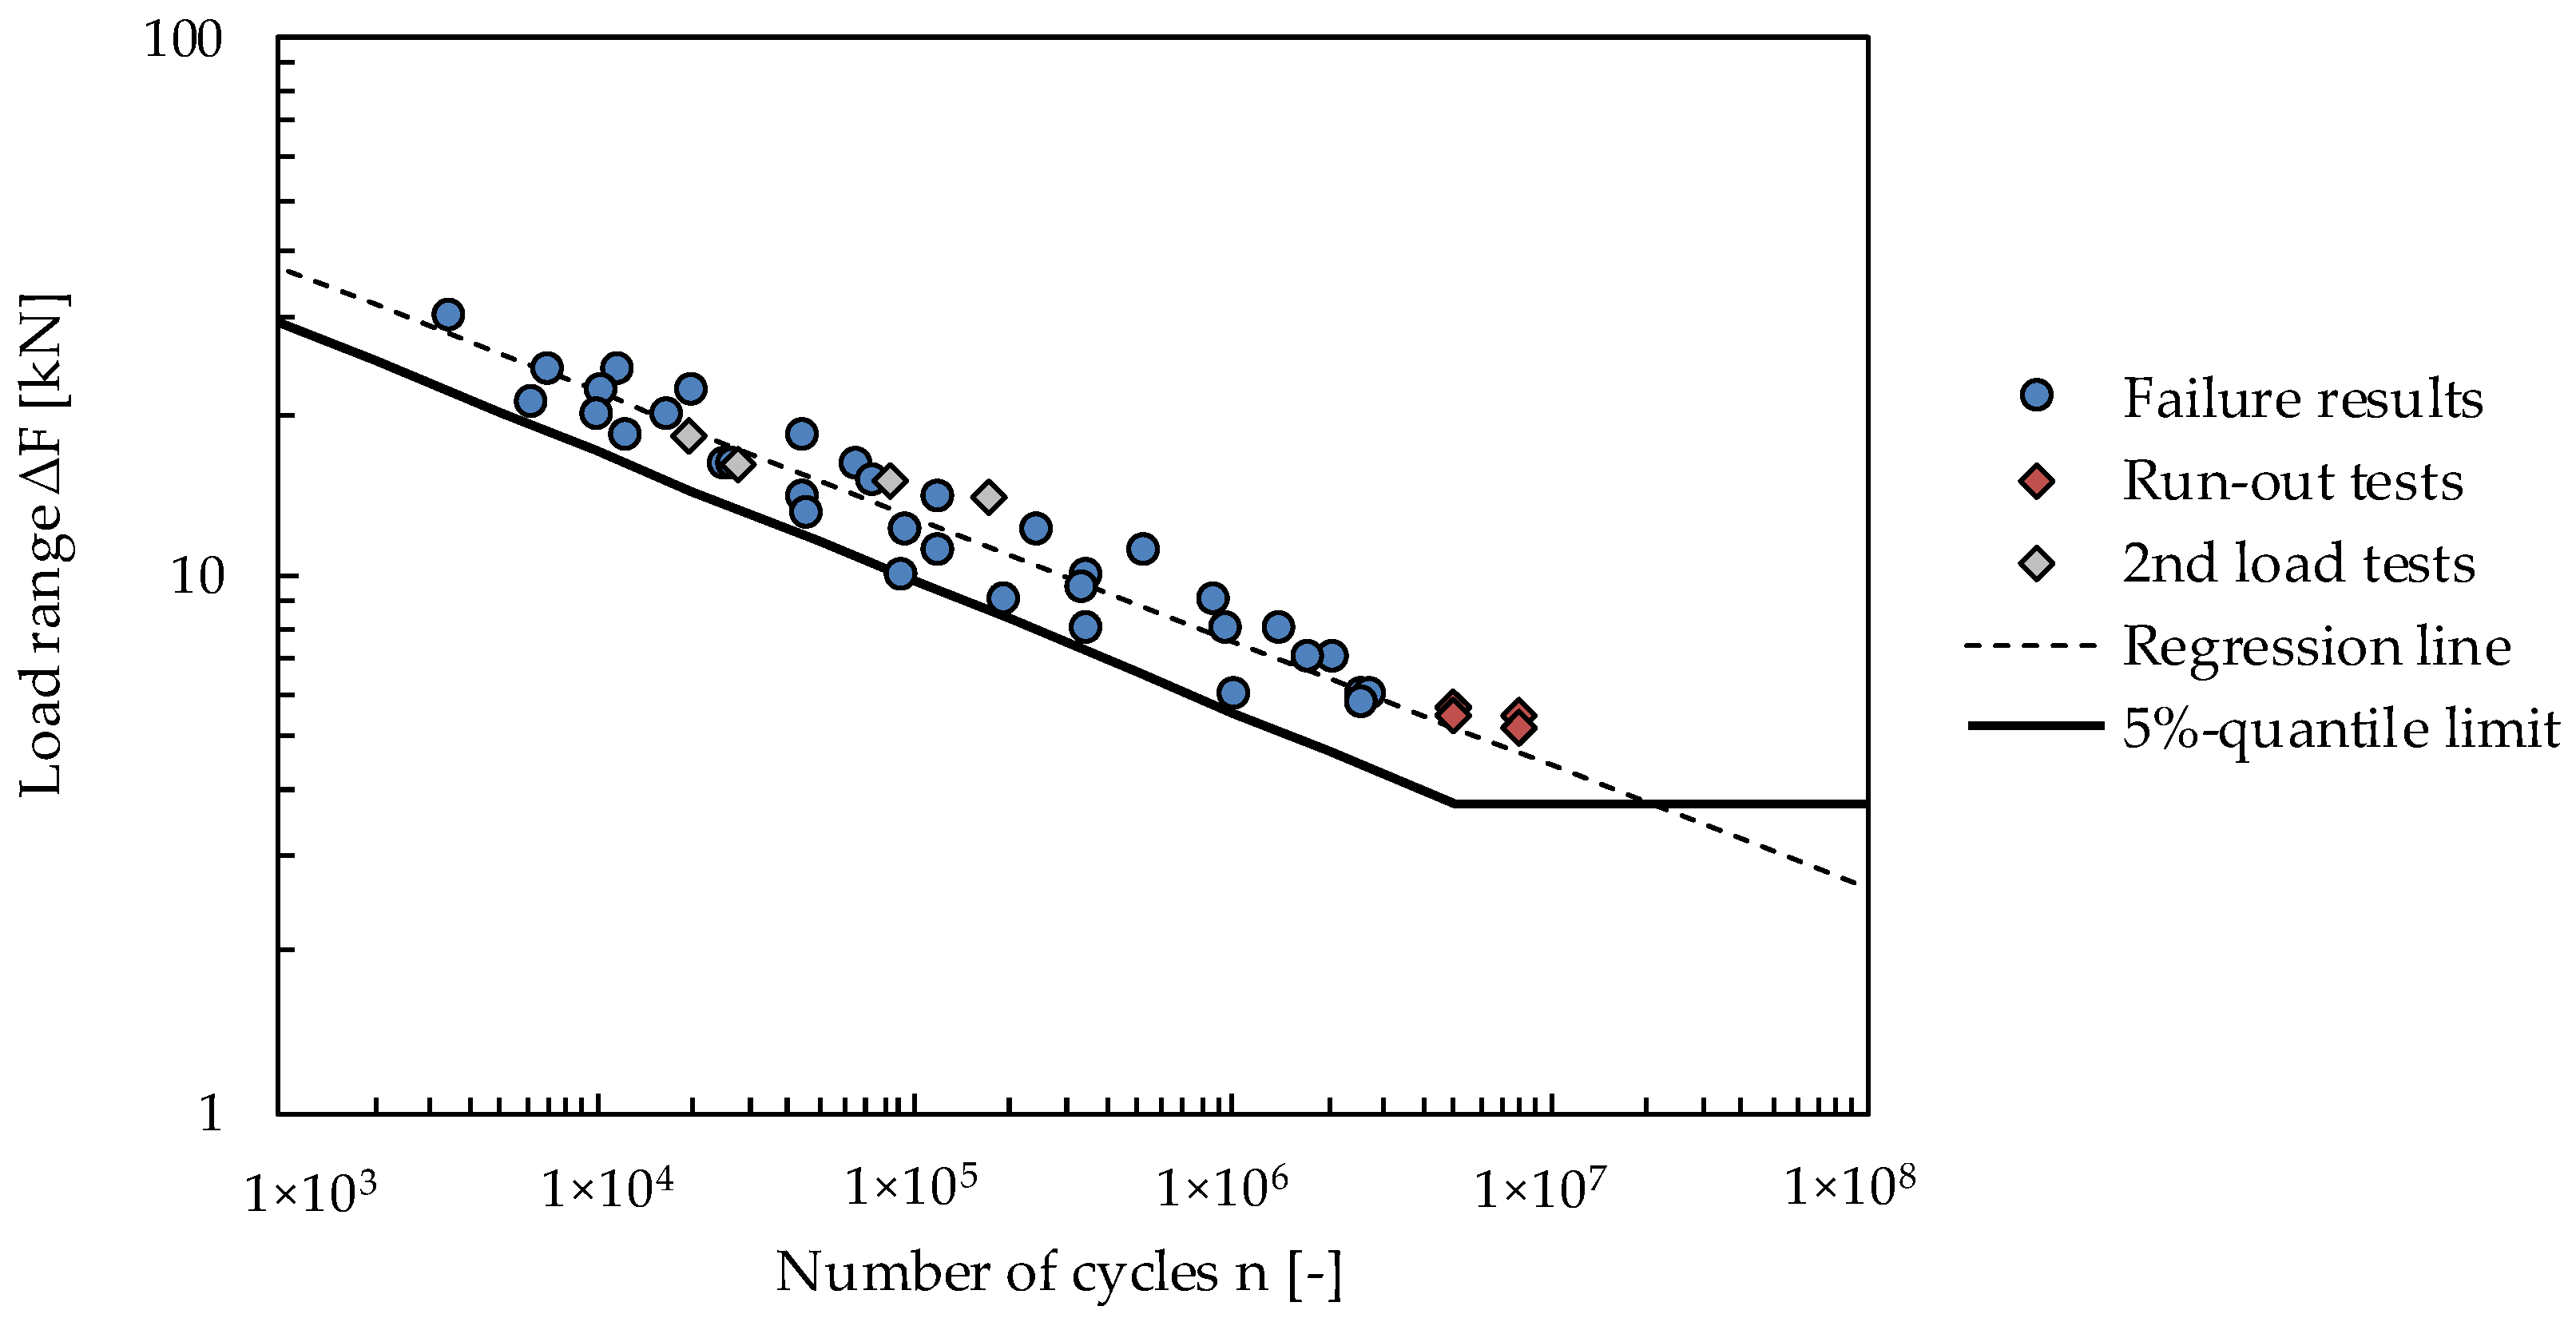
The proposed evaluation procedure to obtain a bilinear function of the S/N curve is illustrated by means of experimental test data. The example comprises a database of 40 fatigue tests, which include a number of m = 35 tests with failure belonging to the finite life area as well as five samples without failure. All test results shown in Figure 8 were obtained from one profile size and the decisive load position providing the lowest fatigue resistance by exhibiting steel failure of the anchor channel. All test data used for the evaluation of the regression line are given in Appendix A. The following calculations are based on rounded values.
The parameters a and b are calculated by linear regression analysis using Equations (2) and (3):
The linear fit provides a correlation coefficient of R2 = 0.92, which indicates low scatter and good reliability of the fatigue data.
Hence, the slope k of the S/N curve in finite life is defined by
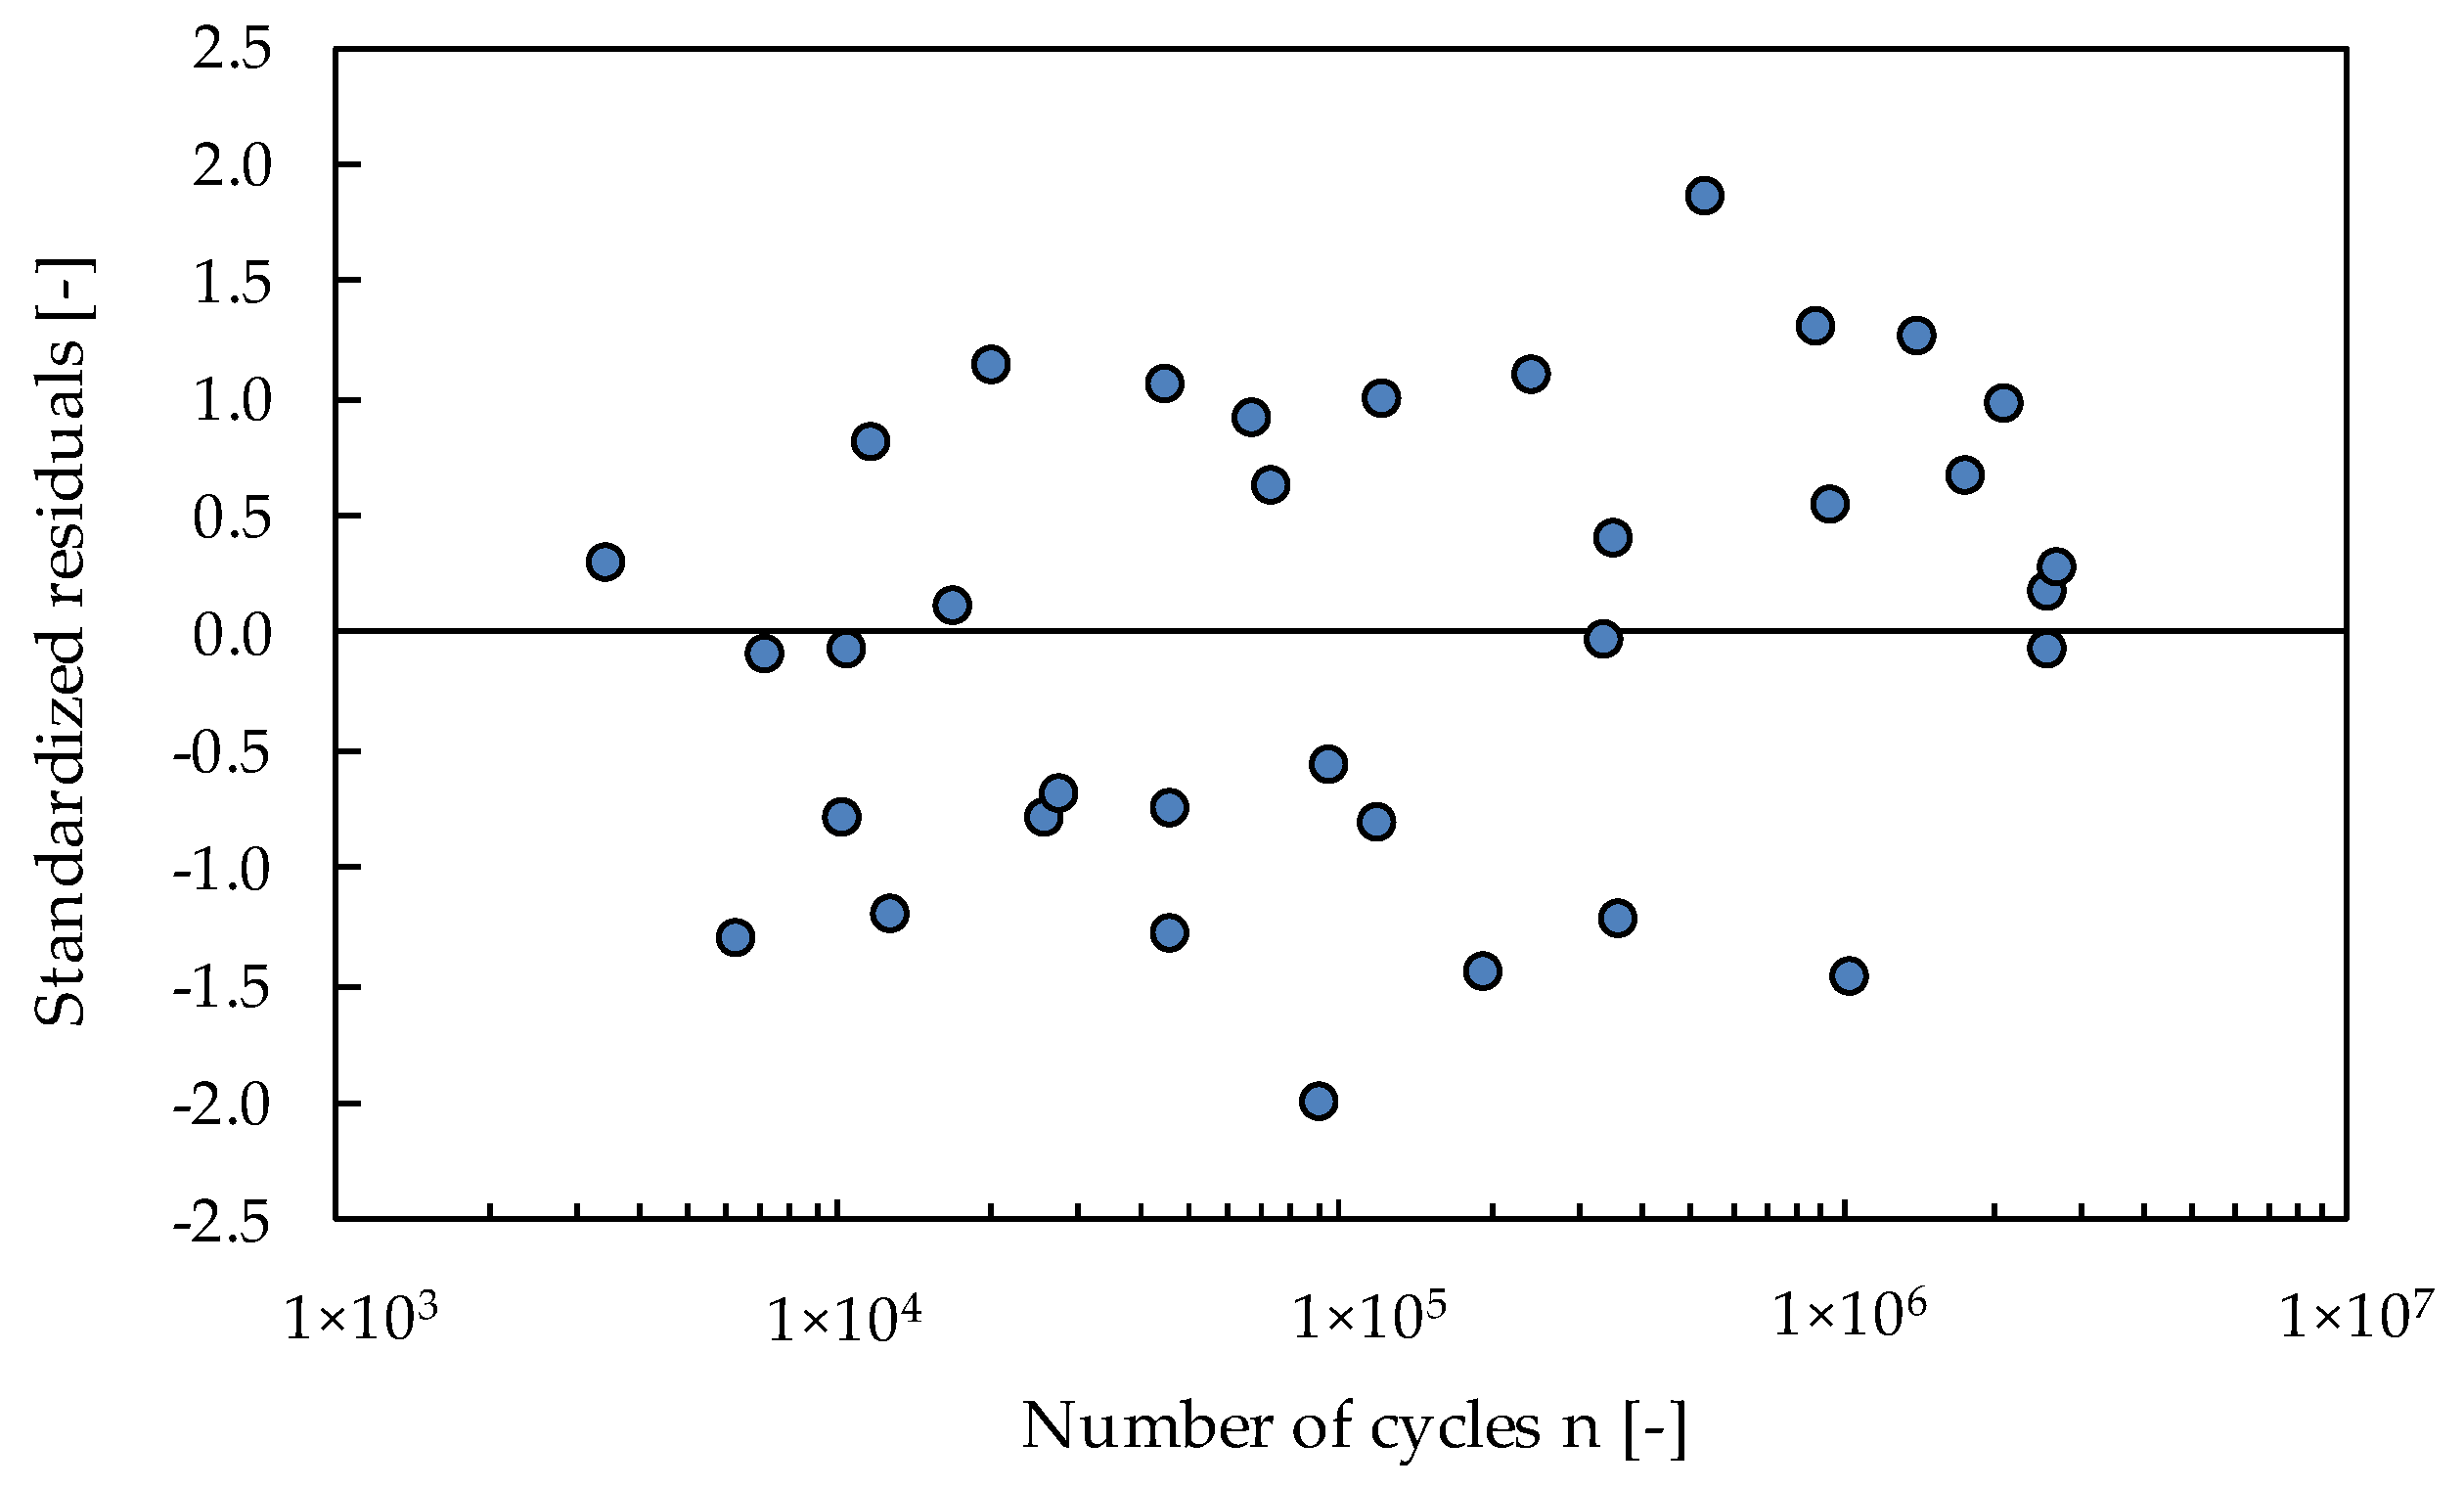
The standard deviation is estimated as follows:
whereby the residuals of the test results relative to the fitted values of log n are almost uniformly distributed along the S/N curve as shown in Figure 9.
The lower confidence limit of the fatigue resistance for 5% probability of failure is calculated from Equation (5) at a confidence level of 90% by taking the factor ks as 2.041. The characteristic resistance function for the finite life area is thus obtained as
For the verification of the endurance limit resistance, all test samples reaching the limit number of load cycles of at least nlim = 5 × 10⁶ without failure can be evaluated as real run-out, since the results of the second loading are clearly above the 5%-quantile limit. The load range of these tests with an average of ∆Fm,lim = 5.5 kN is larger than the fatigue resistance ∆FD = 5.0 kN taken from the mean S/N curve. The endurance limit is thus obtained at 5 × 10⁶ load cycles with a characteristic value of ∆FD,k = 3.8 kN.
5. Comparison of Test Methods
The existing test methods for the fatigue assessment of anchor channels according to [15] are given in Table 1. The purpose of these methods is to obtain the fatigue resistance for steel failure of the whole system, independent of the failure mode, under tension load. While Method B is focused exclusively on the determination of the endurance limit resistance, there are two methods that can be used to develop a complete S/N curve. The first (Method A1) corresponds to the interactive method and provides a continuous function from n = 1 to n = ∞ cycles as shown in Figure 1a, and the second (Method A2) assumes a trilinear function based on the experience gained by using the interactive method.
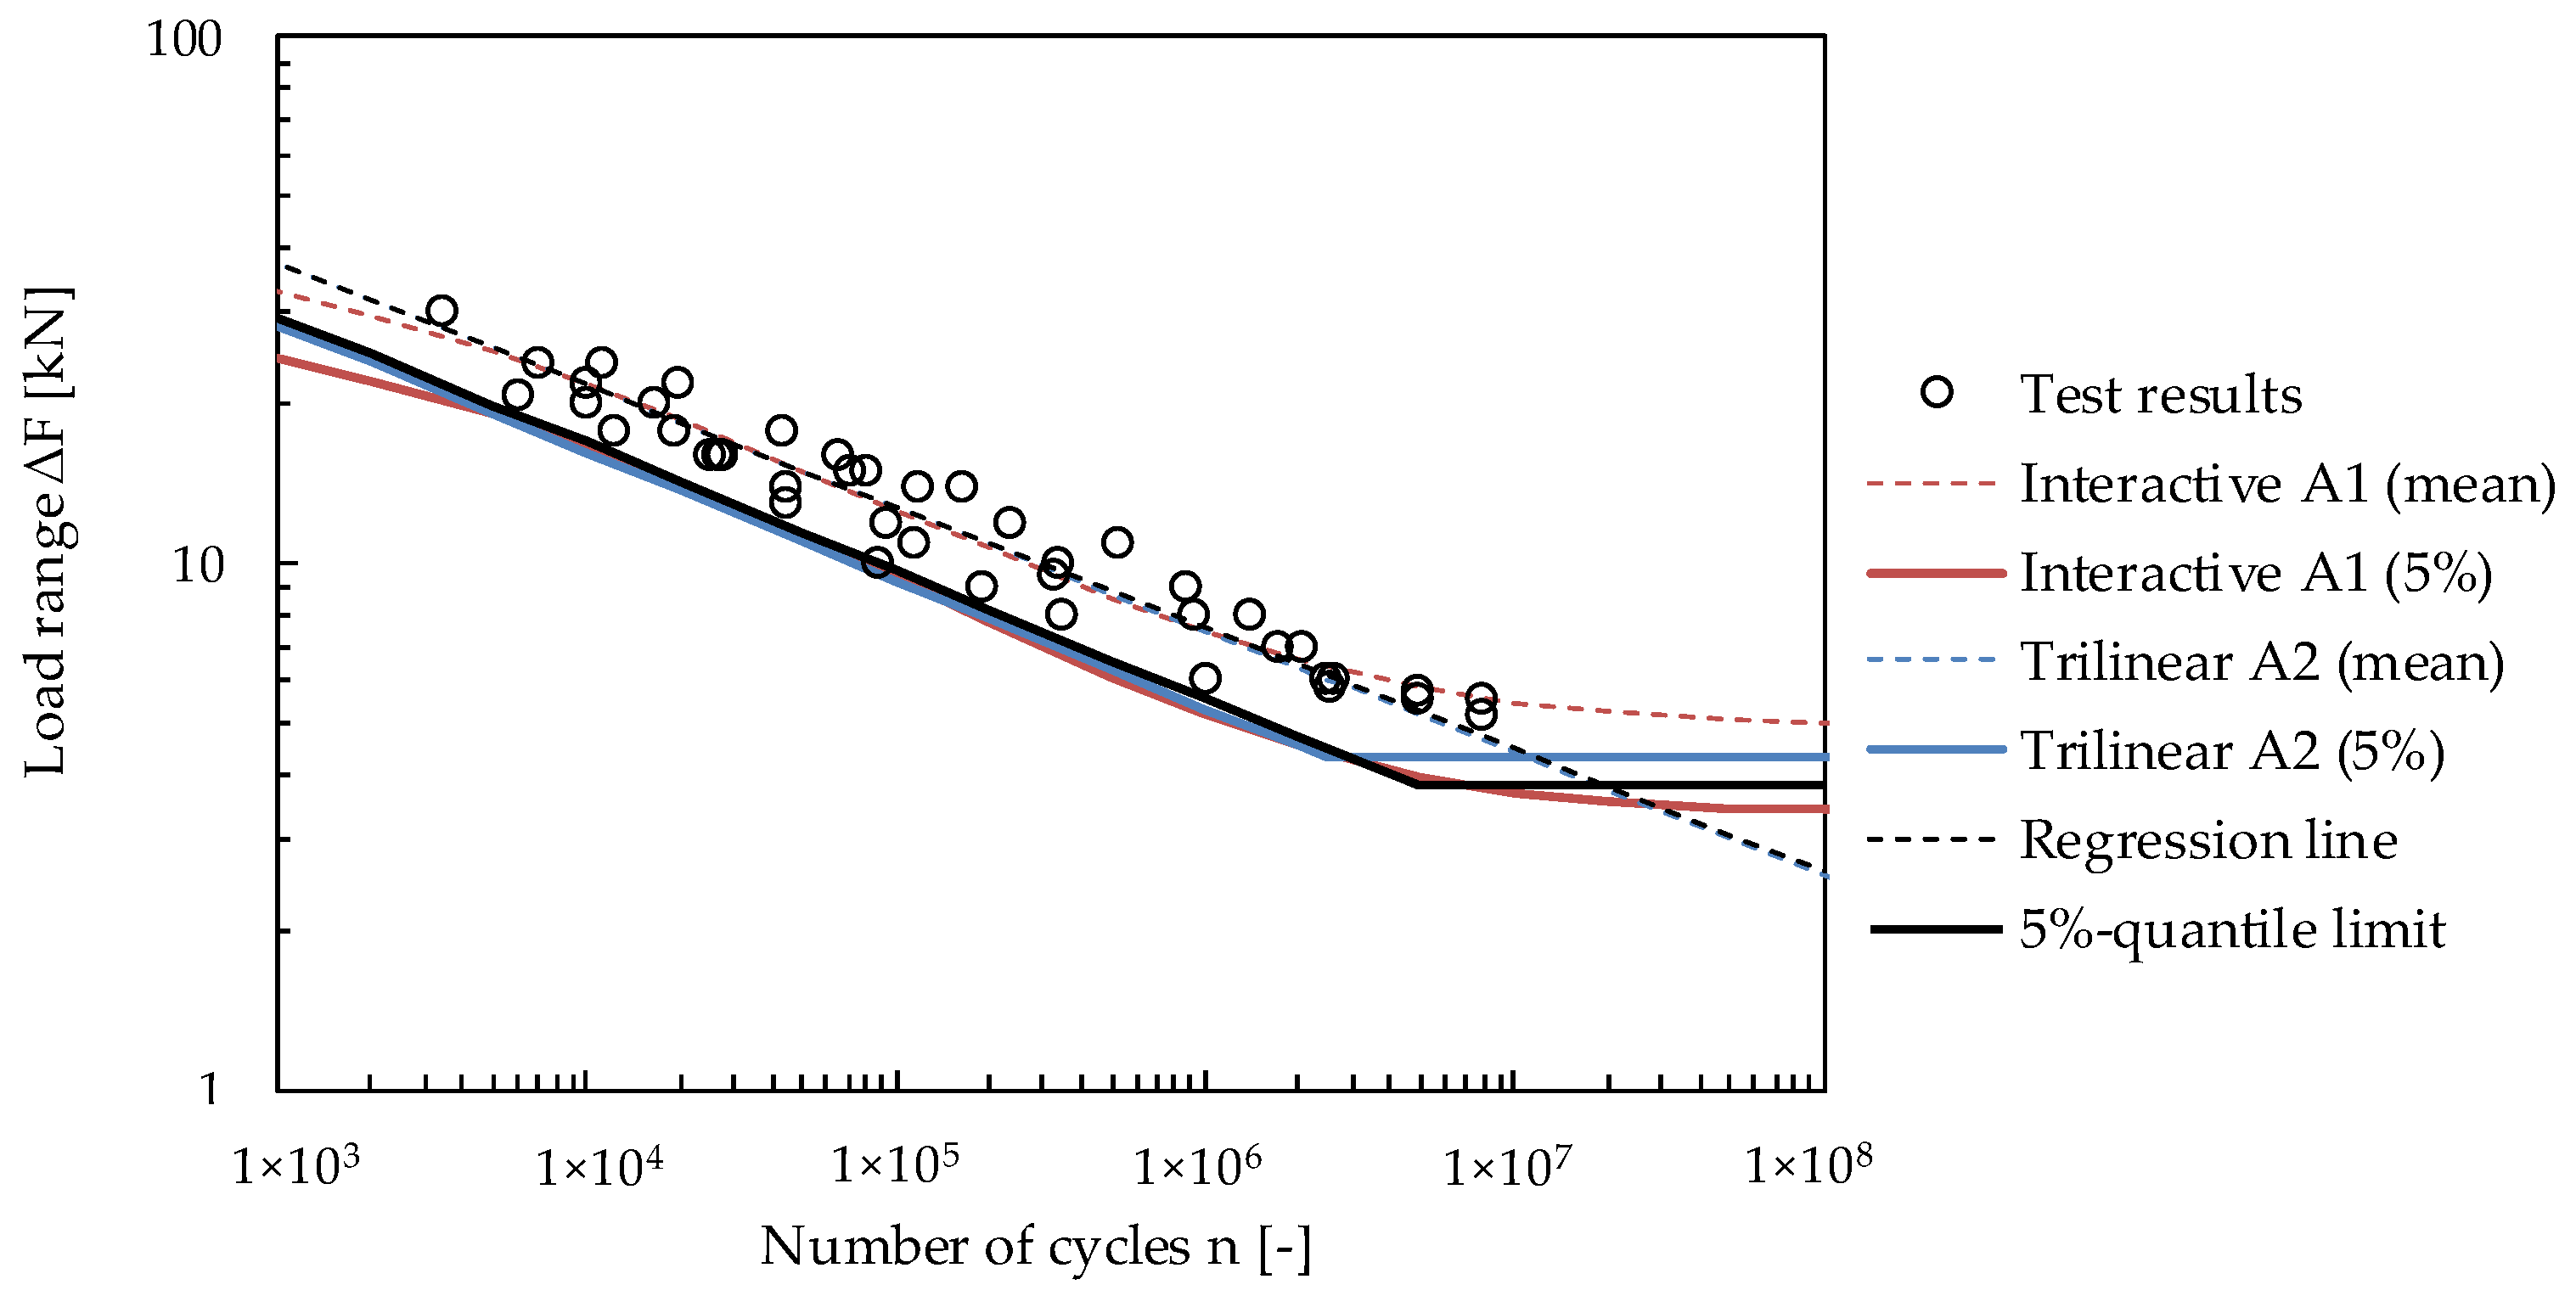
The experimental data given in Section 4 was applied to compare the different methods available for obtaining an S/N curve. Figure 10 shows the test results together with the fatigue resistance curves calculated with the recent methods A1 and A2 as well as the bilinear approach.
As can be seen from the diagram, all test results are above the characteristic resistance curves calculated for each method, even though 5% of tests may be lower. The comparison of the methods reveals almost the same resistance values in the area of finite fatigue life. However, the upper and the lower part of the S/N curves exhibit slight differences.
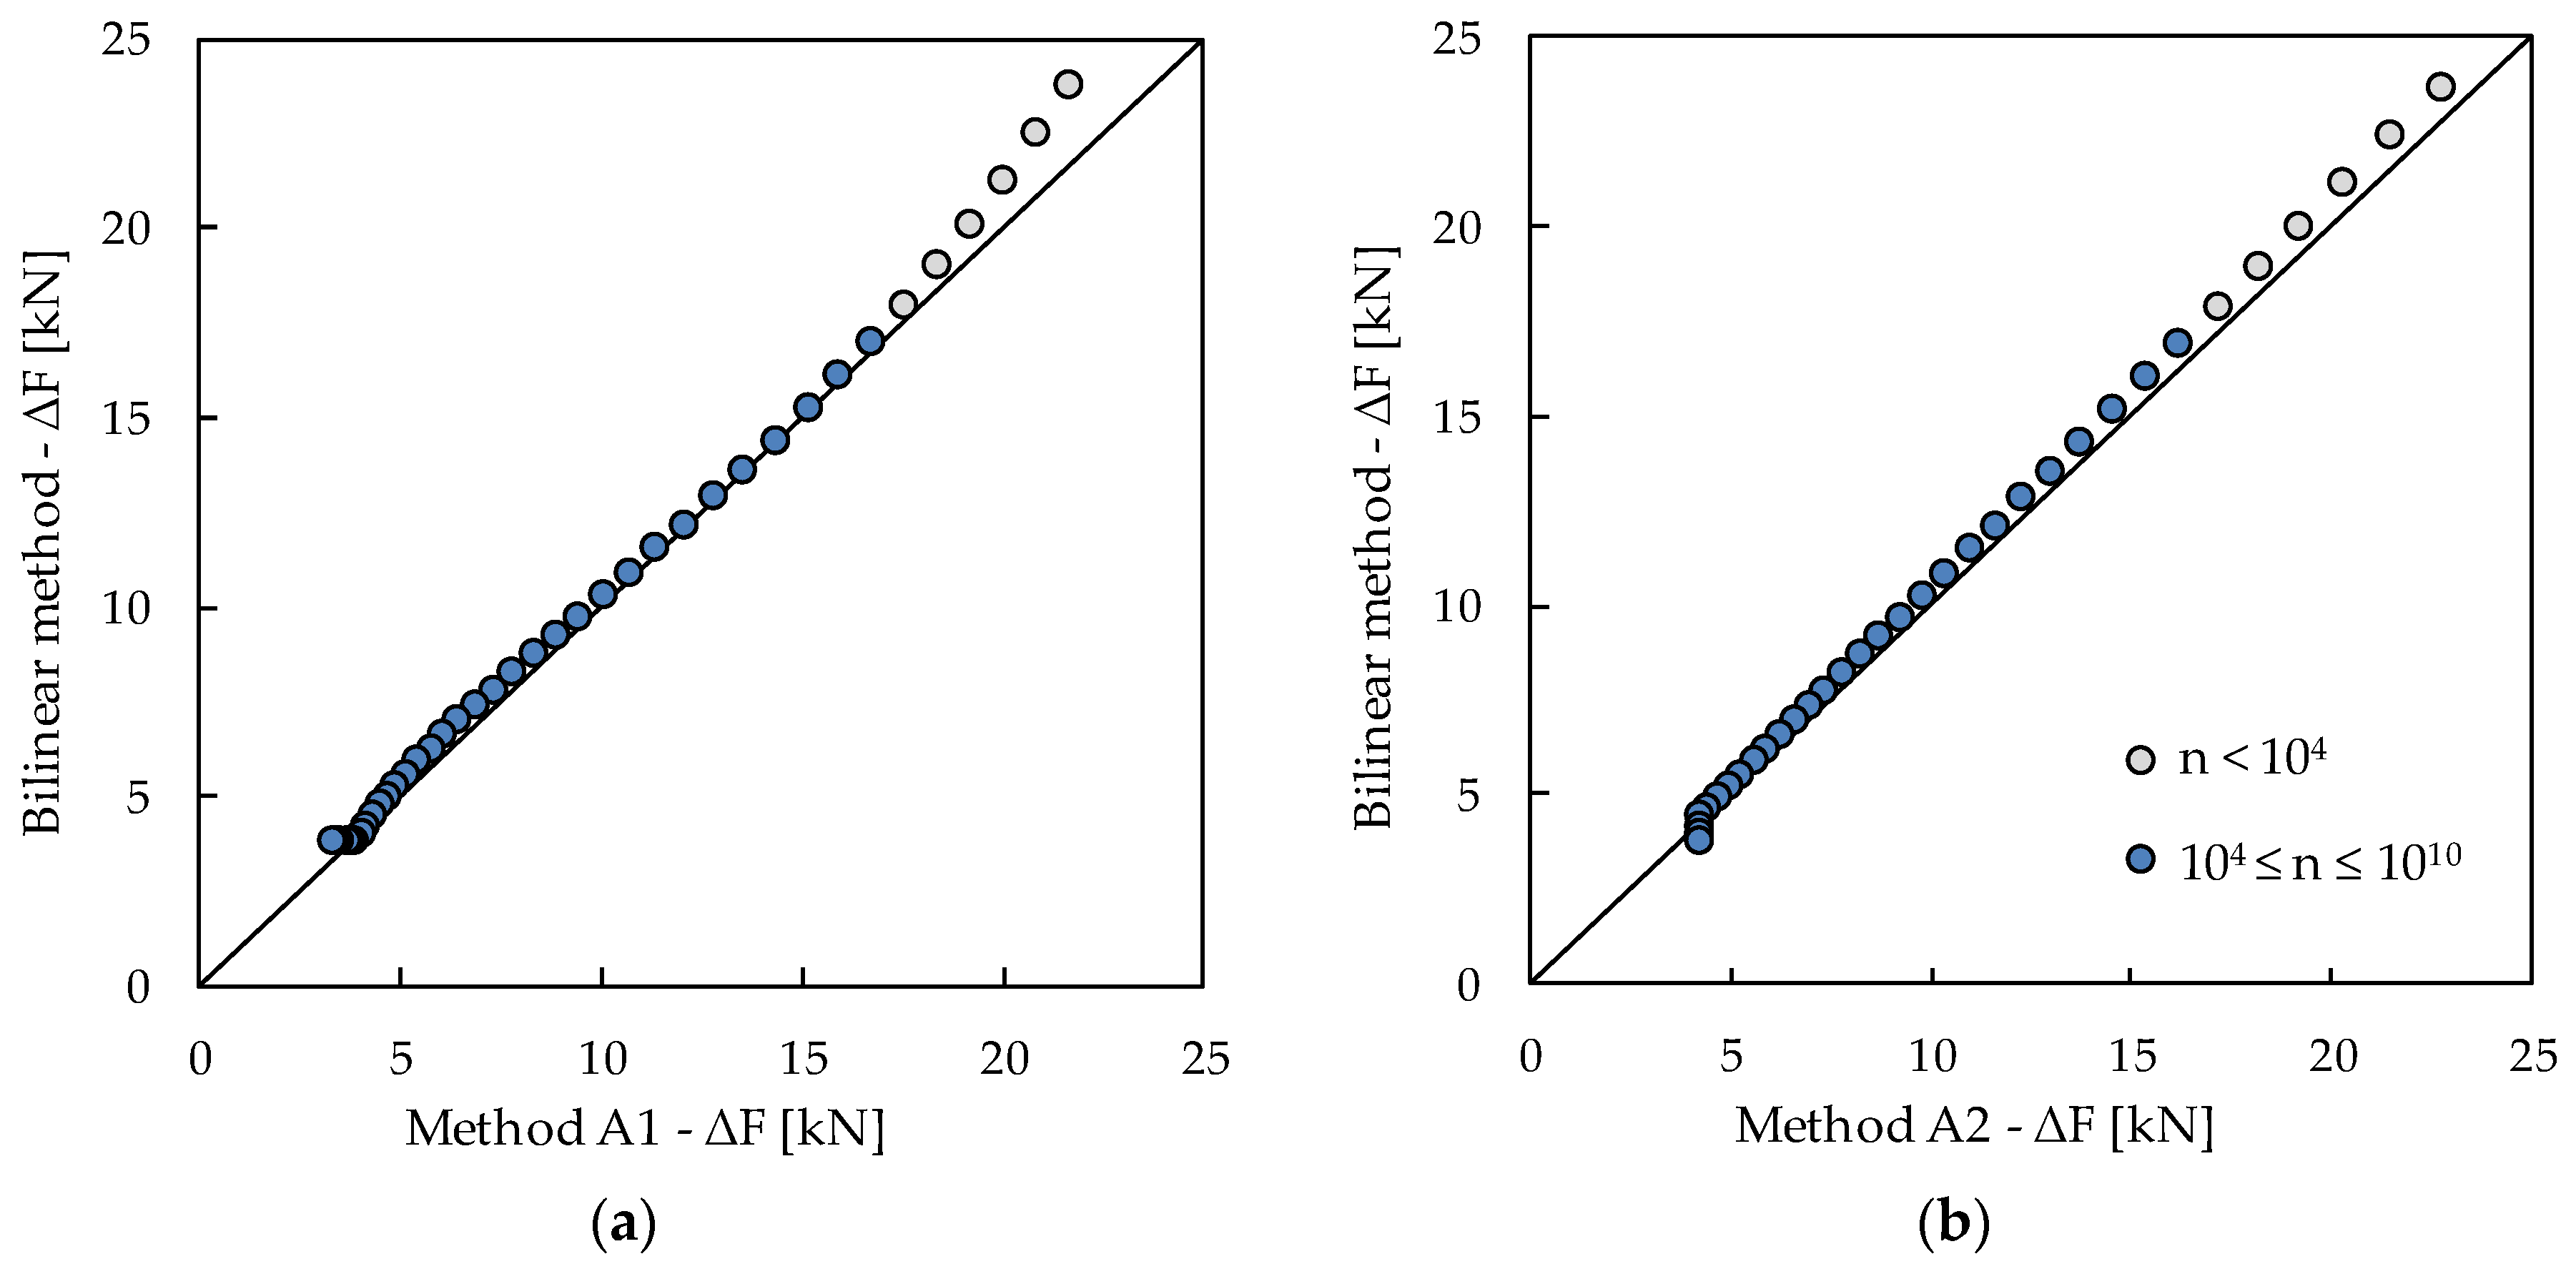
The qualitative deviations in terms of the characteristic fatigue resistance values obtained in the range between 103 and 1010 load cycles are depicted in Figure 11. For a small number of cycles, the interactive function provides lower fatigue resistances than the linearized methods. This emphasizes the assumption that the proposed method is only applicable for more than 104 load cycles. For larger number of cycles, the endurance limit obtained by the bilinear approach lies between the resulting values of method A1 and A2.
6. Discussion and Conclusions
This study presents an alternative approach for the testing and evaluation of anchor channels under fatigue tension loading. The proposed method provides a bilinear function of the fatigue resistance for steel failure of the whole anchor system. The following conclusions can be drawn:
- For the generation of the S/N curve, a minimum of six pre-tests for each load position (anchor/ middle of two anchors) and 16–20 fatigue tests for the decisive position are recommended.
- The fatigue resistance of finite life may be determined by the linear regression of test data in logarithmic scale using the least square method, taking the number of cycles as a dependent variable. Tests that had been stopped without failure cannot be included in the evaluation.
- For the verification of the endurance limit at least four run-out tests with sufficient load level reaching a predefined limit number of cycles must be identified.
- The evaluation procedure is described in detail and illustrated by a worked example, which facilitates the reproducibility of the calculations to assure reliable and consistent results from different testing institutes.
- Based on the results, a comparison with the existing methods shows good agreement, although the proposed method focuses on fatigue relevant loading with more than 104 cycles. This indicates that the evaluation principles of Eurocode 3 are also applicable to adequately capture the steel fatigue resistance of anchor channels.
- The provided bilinear function has the advantage that the fatigue resistance can be defined by two parameters, the value at a certain number of cycles, e.g., nlim, and the slope of the S/N curve.
- The characteristic fatigue resistance in the finite life area (1 × 10⁴ ≤ n ≤ 5 × 10⁶) may be represented by the linear 5%-quantile line determined under the assumption of a constant standard deviation.
- Using the characteristic resistance values obtained with this method, a constant partial factor for steel failure can be recommended for design as the scatter of fatigue data is regarded as almost constant for n ≥ 1 × 10⁴ load cycles. Therefore, the use of a variable factor to consider the transition from the static resistance is not required.
Author Contributions
Conceptualization, T.F.; methodology, T.F. and D.L.; writing—original draft preparation, T.F.; writing—review and editing, T.F. and D.L.; supervision, D.L. All authors have read and agreed to the published version of the manuscript.
Funding
This research received no external funding.
Data Availability Statement
The data presented in this study are available on request from the corresponding author. Detailed information on the test conditions of the provided fatigue data are not publicly available due to privacy restrictions.
Conflicts of Interest
The authors declare no conflict of interest.
Appendix A. Experimental Example
The test results given in Table A1 were obtained from fatigue tension tests performed on anchor channel samples embedded in concrete and subjected to constant lower load of Flo = 1 kN.

Table A1.
Example of fatigue test results.
| Test i | Load Range ∆Fi [kN] | Load Cycles n [-] | log ∆Fi [-] | log n [-] | log ∆Fi∙log n [-] | log ∆Fi 2 [-] |
|---|---|---|---|---|---|---|
| 1 | 30 | 3.462 | 1.477 | 3.539 | 5.227 | 2.182 |
| 2 | 24 | 7.063 | 1.380 | 3.849 | 5.312 | 1.904 |
| 3 | 24 | 11.632 | 1.380 | 4.066 | 5.611 | 1.904 |
| 4 | 22 | 20.029 | 1.342 | 4.302 | 5.773 | 1.801 |
| 5 | 22 | 10.307 | 1.342 | 4.013 | 5.385 | 1.801 |
| 6 | 21 | 6.239 | 1.322 | 3.795 | 5.017 | 1.748 |
| 7 | 20 | 10.189 | 1.301 | 4.008 | 5.214 | 1.693 |
| 8 | 20 | 16.748 | 1.301 | 4.224 | 5.495 | 1.693 |
| 9 | 18 | 44.292 | 1.255 | 4.646 | 5.831 | 1.575 |
| 10 | 18 | 12.593 | 1.255 | 4.100 | 5.146 | 1.575 |
| 11 | 16 | 25.584 | 1.204 | 4.408 | 5.307 | 1.450 |
| 12 | 16 | 66.416 | 1.204 | 4.822 | 5.806 | 1.450 |
| 13 | 16 | 27.244 | 1.204 | 4.435 | 5.340 | 1.450 |
| 14 | 15 | 73.128 | 1.176 | 4.864 | 5.720 | 1.383 |
| 15 | 14 | 45.298 | 1.146 | 4.656 | 5.336 | 1.313 |
| 16 | 14 | 119.701 | 1.146 | 5.078 | 5.819 | 1.313 |
| 17 | 13 | 45.596 | 1.114 | 4.659 | 5.190 | 1.241 |
| 18 | 12 | 95.377 | 1.079 | 4.979 | 5.372 | 1.164 |
| 19 | 12 | 241.237 | 1.079 | 5.382 | 5.807 | 1.164 |
| 20 | 11 | 528.773 | 1.041 | 5.723 | 5.958 | 1.084 |
| 21 | 11 | 118.807 | 1.041 | 5.075 | 5.283 | 1.084 |
| 22 | 10 | 90.829 | 1.000 | 4.958 | 4.958 | 1.000 |
| 23 | 10 | 345.629 | 1.000 | 5.539 | 5.539 | 1.000 |
| 24 | 9.5 | 336.363 | 0.978 | 5.527 | 5.405 | 0.956 |
| 25 | 9 | 886.566 | 0.954 | 5.948 | 5.674 | 0.910 |
| 26 | 9 | 192.857 | 0.954 | 5.285 | 5.042 | 0.910 |
| 27 | 8 | 353.193 | 0.903 | 5.548 | 5.010 | 0.815 |
| 28 | 8 | 948.260 | 0.903 | 5.977 | 5.397 | 0.815 |
| 29 | 8 | 1.413.670 | 0.903 | 6.150 | 5.553 | 0.815 |
| 30 | 7 | 2.081.140 | 0.845 | 6.318 | 5.339 | 0.714 |
| 31 | 7 | 1.767.506 | 0.845 | 6.247 | 5.279 | 0.714 |
| 32 | 6 | 2.530.311 | 0.778 | 6.403 | 4.982 | 0.605 |
| 33 | 6 | 2.692.952 | 0.778 | 6.430 | 5.003 | 0.605 |
| 34 | 6 | 1.021.174 | 0.778 | 6.009 | 4.675 | 0.605 |
| 35 | 5.8 | 2.561.643 | 0.763 | 6.409 | 4.890 | 0.582 |
| m | ∑ log ∆Fi | ∑ log n | ∑ log ∆Fi ∙log n | ∑ log ∆Fi 2 | ||
| 35 | 38.171 | 177.371 | 187.695 | 43.018 |
References
- EN 1992-4. Eurocode 2: Design of Concrete Structures-Part 4: Design of Fastenings for Use in Concrete; European Committee for Standardization (CEN): Brussels, Belgium, 2018. [Google Scholar]
- Wohlfahrt, R. Tragverhalten von Ankerschienen Ohne Rückhängebewehrung (Load Bearing Behaviour of Anchor Channels without Supplementary Reinforcement). Ph.D. Thesis, University of Stuttgart, Stuttgart, Germany, 1996. [Google Scholar]
- Kraus, J. Tragverhalten und Bemessung von Ankerschienen unter Zentrischer Zugbelastung (Load Bearing Behaviour and Design of Anchor Channels under Tensile Loads). Ph.D. Thesis, University of Stuttgart, Stuttgart, Germany, 2003. [Google Scholar]
- Potthoff, M. Tragverhalten und Bemessung von Ankerschienen unter Querbelastung (Load Bearing Behaviour and Design of Anchor Channels under Shear Loads). Ph.D. Thesis, University of Stuttgart, Stuttgart, Germany, 2008. [Google Scholar]
- Schmid, K. Tragverhalten und Bemessung von Befestigungen am Bauteilrand mit Rückhängebewehrung unter Querlasten rechtwinklig zum Rand (Load Bearing Behaviour and Design of Connections with Supplementary Reinforcement near the Member Edge under Shear Loads Perpendicular to the Edge). Ph.D. Thesis, University of Stuttgart, Stuttgart, Germany, 2009. [Google Scholar]
- Oluokun, F.; Burdette, E. Behavior of channel anchors in thin slabs under combined shear and tension (pullout) loads. ACI Struct. J. 1993, 90, 407–413. [Google Scholar]
- Schmidt, T. Tragverhalten von Ankerschienen unter Querlast in Schienenlängsrichtung (Load Bearing Behaviour of Anchor Channels under Shear Load Acting in Longitudinal Direction). Ph.D. Thesis, University of Stuttgart, Stuttgart, Germany, 2017. [Google Scholar]
- Konertz, D.; Kocur, G.K.; Häusler, F.; Mark, P. Longitudinal shear transmission of anchor channels into concrete–An experimental approach. Struct. Concr. 2020. [Google Scholar] [CrossRef]
- Park, J.; Plamper-Hellwig, D. Untersuchung des Tragwiderstandes von Ankerschienensystemen unter Erdbebenbeanspruchungen (Investigation of the capacity of anchor channel systems under earthquake loads). Bauingenieur 2012, 87, 3–8. [Google Scholar]
- Güres, S. Zum Tragverhalten von Ankerschienenbefestigungen unter Nichtruhenden Beanspruchungen (Load Bearing Behaviour of Anchor Channels under Fatigue Loads). Ph.D. Thesis, Ruhr University Bochum, Bochum, Germany, 2005. [Google Scholar]
- Hanenkamp, W.; Güres, S. Zum Tragverhalten von Ankerschienen unter ermüdungsrelevanten Ein-wirkungen. Stahlbau 2004, 73, 668–675. [Google Scholar] [CrossRef]
- Fröhlich, T.; Lotze, D. Influence of static load level on the fatigue behavior of anchor channels. In Proceedings of the 3rd International Symposium ConSC2017 (Connections between Steel and Concrete), Stuttgart, Germany, 27–29 September 2017. [Google Scholar]
- Fröhlich, T.; Lotze, D. Fatigue of fastenings–investigations on the effect of static load level. Otto Graf J. 2019, 18, 79–88. [Google Scholar]
- European Organisation for Technical Assessment. Technical Report 050: Calculation Method for the Performance of Anchor Channels under Fatigue Loading; European Commission: Brussels, Belgium, 2018. [Google Scholar]
- European Organisation for Technical Assessment. EAD 330008-02-0601: Anchor Channels; European Commission: Brussels, Belgium, 2016. [Google Scholar]
- Block, K.; Dreier, F. Die Ermüdungsfestigkeit zuverlässig und kostengünstig ermitteln–Das Interaktive Verfahren. Materialprüfung 1998, 40, 73–77. [Google Scholar]
- Block, K.; Dreier, F. Das Ermüdungsverhalten von Dübelbefestigungen. Deutscher Ausschuss für Stahlbeton, Heft 541; Beuth Verlag: Berlin, Germany, 2003. [Google Scholar]
- Maurer, R.; Block, K.; Dreier, F. Ermüdungstragfähigkeit von Betonstahl–Bestimmung mit dem Interaktiven Verfahren. Bauingenieur 2010, 85, 17–28. [Google Scholar]
- EN 1992-1-1. Eurocode 2: Design of Concrete Structures—Part 1-1: General Rules and Rules for Buildings; European Committee for Standardization (CEN): Brussels, Belgium, 2010. [Google Scholar]
- EN 1993-1-9. Eurocode 3: Design of Steel Structures-Part 1-9: Fatigue; European Committee for Standardization (CEN): Brussels, Belgium, 2009. [Google Scholar]
- EN 1994-1-1. Eurocode 4: Design of Composite Steel and Concrete Structures—Part 1-1: General Rules and Rules for Buildings; European Committee for Standardization (CEN): Brussels, Belgium, 2009. [Google Scholar]
- Karr, U.; Schuller, R.; Fitzka, M.; Denk, A.; Strauss, A.; Mayer, H. Very high cycle fatigue testing of concrete using ultrasonic cycling. Mater. Test. 2017, 59, 438–444. [Google Scholar] [CrossRef]
- Tóth, M. Fatigue Behaviour of Fasteners: Numerical and Experimental Investigations on the Concrete Cone Failure Mode. Ph.D. Thesis, University of Stuttgart, Stuttgart, Germany, 2020. [Google Scholar]
- Sonsino, C.M. Course of SN-curves especially in the high-cycle fatigue regime with regard to component design and safety. Int. J. Fatigue 2007, 29, 2246–2258. [Google Scholar] [CrossRef]
- Grad, P.; Reuscher, B.; Brodyanski, A.; Kopnarski, M.; Kerscher, E. Mechanism of fatigue crack initiation and propagation in the very high cycle fatigue regime of high-strength steels. Scr. Mater. 2012, 67, 838–841. [Google Scholar] [CrossRef]
- Brozzetti, J.; Hirt, M.A.; Ryan, I.; Sedlacek, G.; Smith, I.F.C. Background Documentation Chapter 9–Document 9.01, Background informations on Fatigue Design Rules, Statistical Evaluation, Eurocode No. 3, Design of Steel Structures, Part 1–General Rules and Rules for Buildings; European Commission: Brussels, Belgium, 1989. [Google Scholar]
- Basquin, O.H. The exponential law of endurance tests. Am. Soc. Test. Mater. Proc. 1910, 10, 625–630. [Google Scholar]
- Haibach, E. Modifizierte Lineare Schadensakkumulations-Hypothese zur Berücksichtigung des Dauer-Festigkeitsabfalls Mit Fortschreitender Schädigung; LBF-Technische Mitteilung TM 50/70; Laboratorium für Betriebsfestigkeit: Darmstadt, Germany, 1970. [Google Scholar]
Figure 1.
S/N curves for characterizing the fatigue resistance of anchor channels in case of steel failure: (a) Interactive method; (b) Bilinear approach.
Figure 1.
S/N curves for characterizing the fatigue resistance of anchor channels in case of steel failure: (a) Interactive method; (b) Bilinear approach.

Figure 2.
Failure modes of anchor channels under tension load according to EN 1992-4: (a) Steel failure of channel bolt; (b) Steel failure of anchor, (c) Steel failure of connection anchor channel, (d) Steel failure of channel lips, (e) Steel failure by flexure of channel, (f) Concrete cone failure, (g) Pullout failure, (h) Concrete splitting failure, (i) Concrete blow out failure.

Figure 3.
Photographs of typical failure modes for anchor channels in fatigue tension tests: (a) Steel failure of connection anchor channel; (b) Steel failure by crack formation in the channel flange.
Figure 3.
Photographs of typical failure modes for anchor channels in fatigue tension tests: (a) Steel failure of connection anchor channel; (b) Steel failure by crack formation in the channel flange.

Figure 4.
General procedure for the fatigue assessment of anchor channels: (a) Identification of the unfavorable load position; (b) Evaluation of the fatigue resistance for finite life; (c) Verification of the endurance limit resistance.
Figure 4.
General procedure for the fatigue assessment of anchor channels: (a) Identification of the unfavorable load position; (b) Evaluation of the fatigue resistance for finite life; (c) Verification of the endurance limit resistance.

Figure 5.
Linear regression of fatigue test data.

Figure 6.
Statistical evaluation of the characteristic fatigue resistance of finite life.

Figure 7.
Run-out tests for verification of the fatigue endurance limit.

Figure 8.
S/N curve for test results evaluated by the bilinear method.

Figure 9.
Residuals obtained from linear regression of the test results, scaled by standard deviation.
Figure 9.
Residuals obtained from linear regression of the test results, scaled by standard deviation.

Figure 10.
Comparison of test data and fatigue resistance curves evaluated by different methods.

Figure 11.
Characteristic fatigue resistance between 103 and 1010 cycles derived by the bilinear method compared to the values obtained by the recent methods: (a) Interactive A1; (b) Trilinear A2.
Figure 11.
Characteristic fatigue resistance between 103 and 1010 cycles derived by the bilinear method compared to the values obtained by the recent methods: (a) Interactive A1; (b) Trilinear A2.

Table 1.
Test methods for the fatigue evaluation of anchor channels given in EAD 330008-02-0601 [15].
Table 1.
Test methods for the fatigue evaluation of anchor channels given in EAD 330008-02-0601 [15].
| Method A1 | Method A2 | Method B | |
|---|---|---|---|
| Function for S/N curve | continuous | trilinear | no |
| Area of application | N = 1 to n = ∞ | N = 1 to n = ∞ | n = ∞ |
| Number of tests 1 | 20 | 20 | 3 |
1 Required number of fatigue tests at the decisive load position.
Publisher’s Note: MDPI stays neutral with regard to jurisdictional claims in published maps and institutional affiliations. |
© 2020 by the authors. Licensee MDPI, Basel, Switzerland. This article is an open access article distributed under the terms and conditions of the Creative Commons Attribution (CC BY) license (http://creativecommons.org/licenses/by/4.0/).
Share and Cite
MDPI and ACS Style
Fröhlich, T.; Lotze, D. Testing and Evaluation of Anchor Channels under Fatigue Loading. CivilEng 2021, 2, 1-13. https://0-doi-org.brum.beds.ac.uk/10.3390/civileng2010001
AMA Style
Fröhlich T, Lotze D. Testing and Evaluation of Anchor Channels under Fatigue Loading. CivilEng. 2021; 2(1):1-13. https://0-doi-org.brum.beds.ac.uk/10.3390/civileng2010001
Chicago/Turabian StyleFröhlich, Thilo, and Dieter Lotze. 2021. "Testing and Evaluation of Anchor Channels under Fatigue Loading" CivilEng 2, no. 1: 1-13. https://0-doi-org.brum.beds.ac.uk/10.3390/civileng2010001