Rheology, Mechanical Properties and Porosity of Ternary Alkali-Activated Binders Based on Mining Mud Waste with Waste Glass and Metakaolin


Abstract
:1. Introduction
2. Materials and Experimental Methods
2.1. Materials
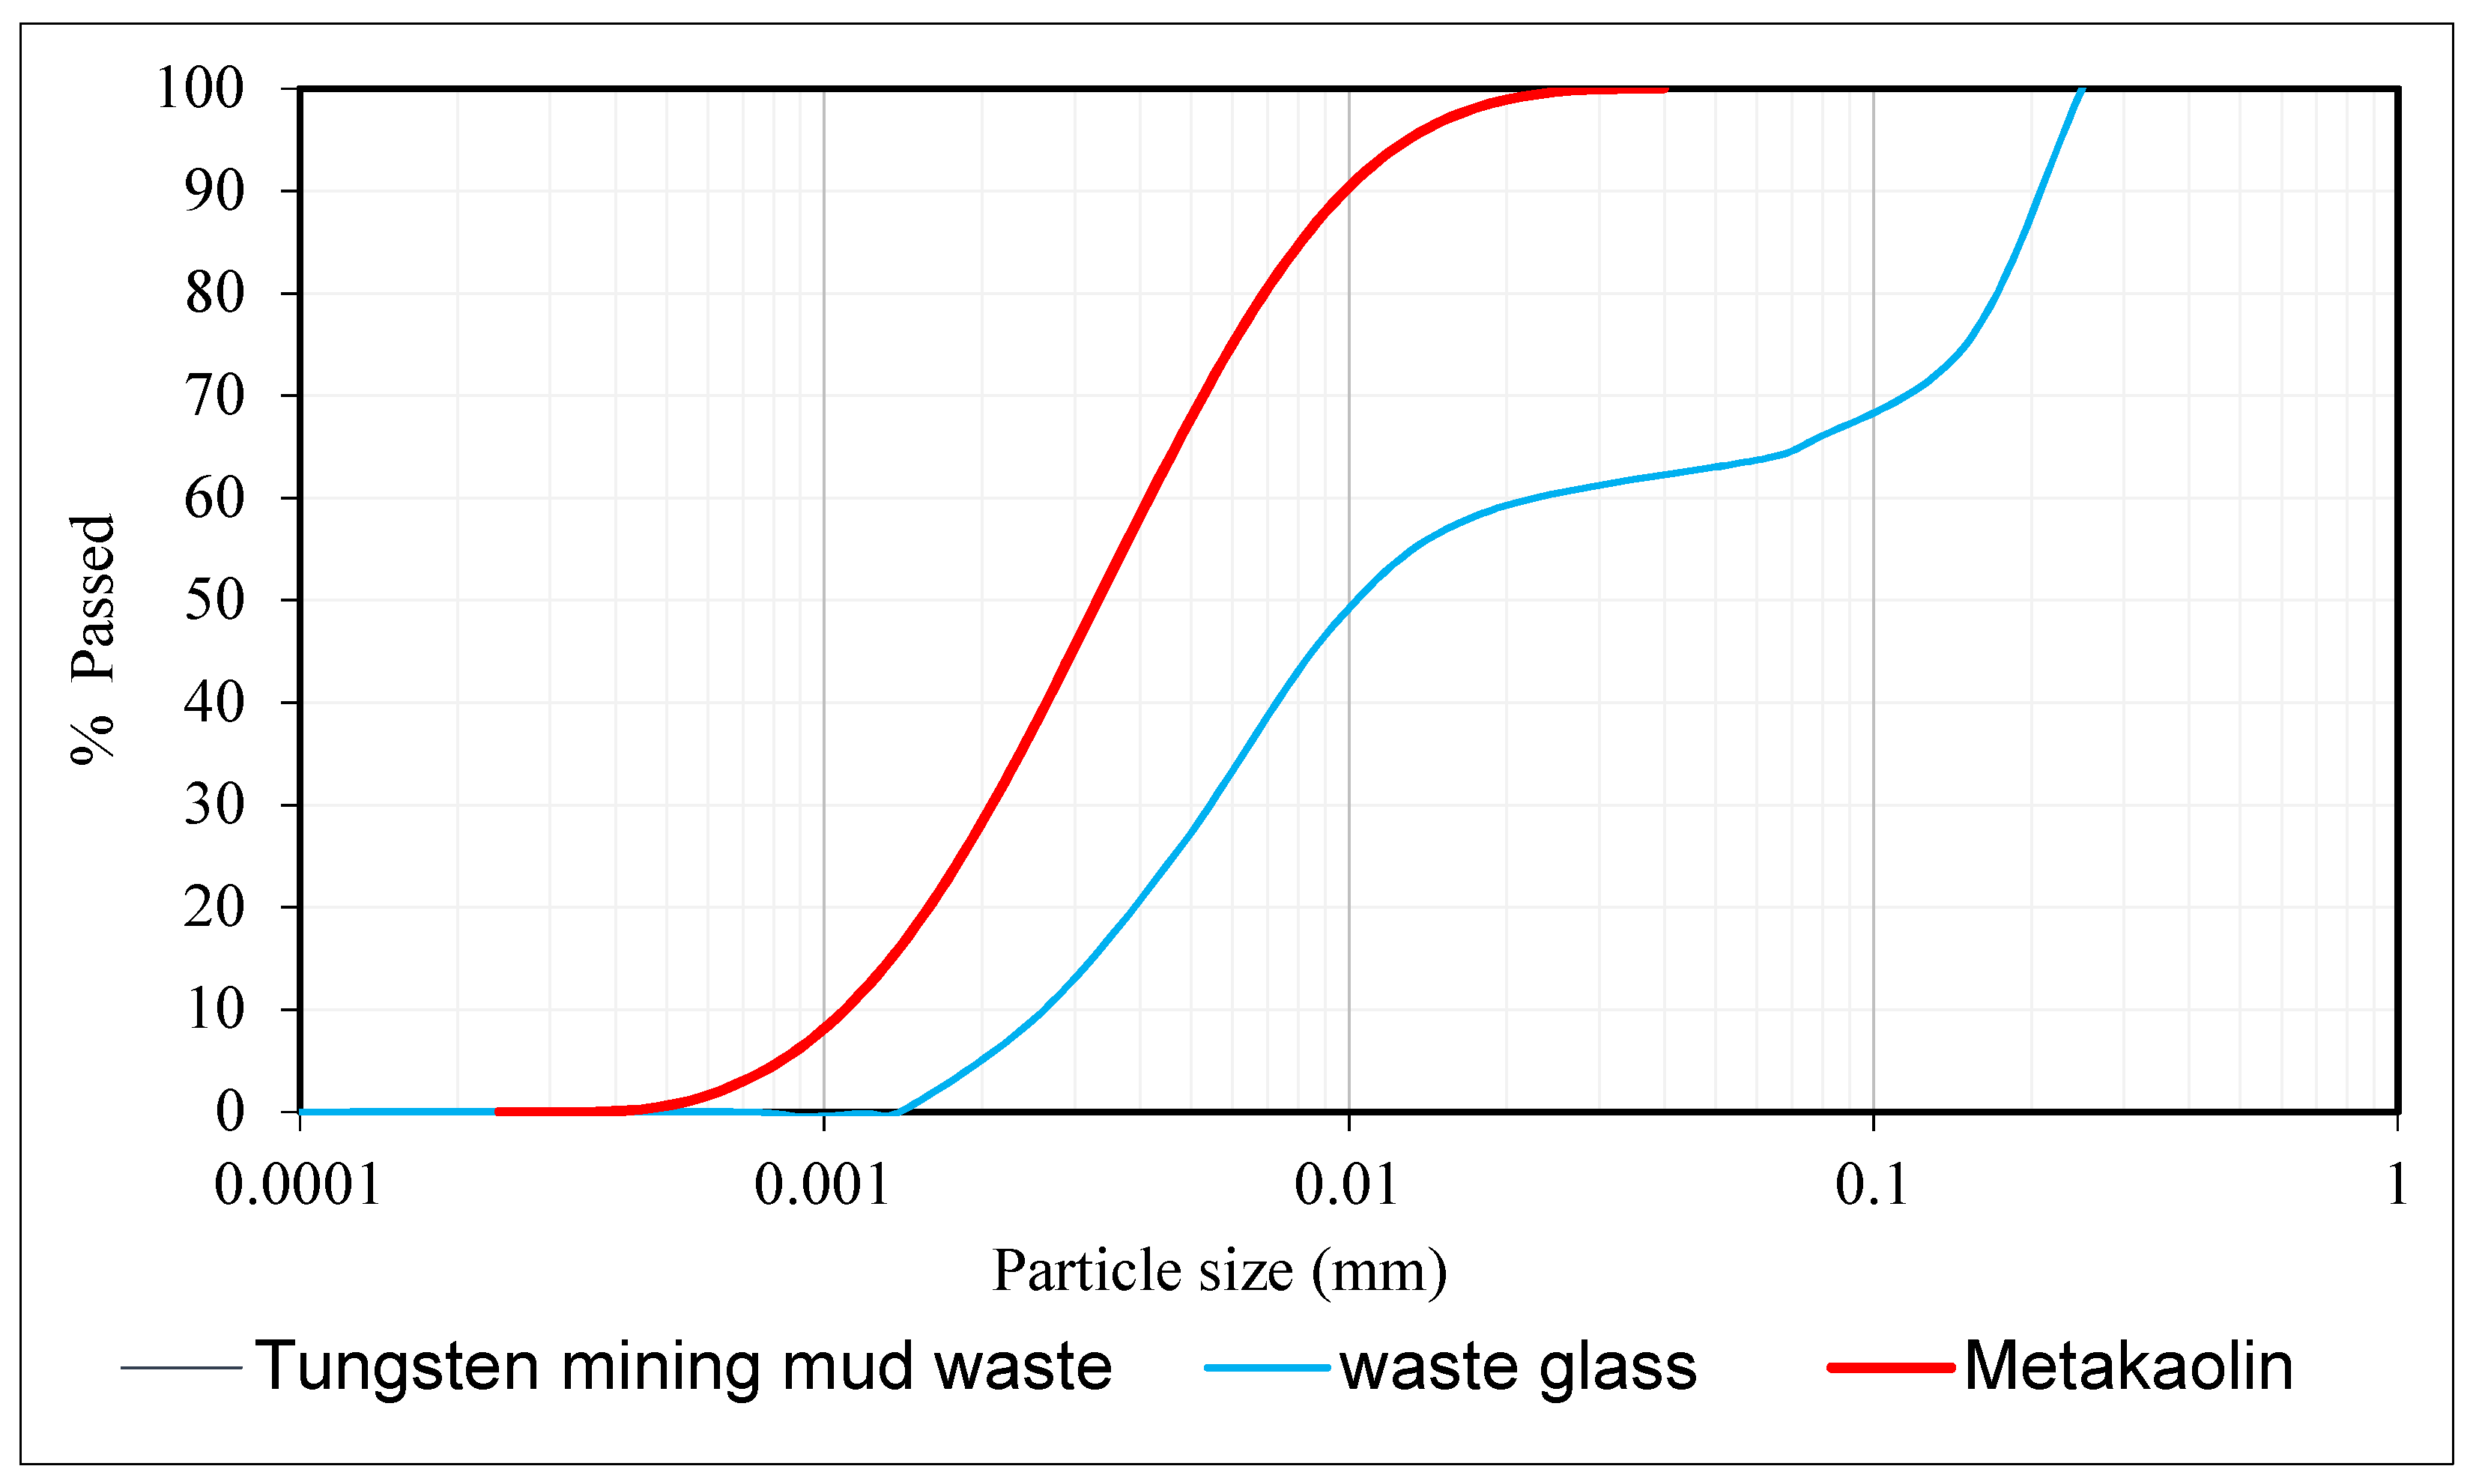
2.1.1. Precursors
2.1.2. Alkaline Activator Solution
2.2. Experimental Methods
2.2.1. Preparation of the Paste
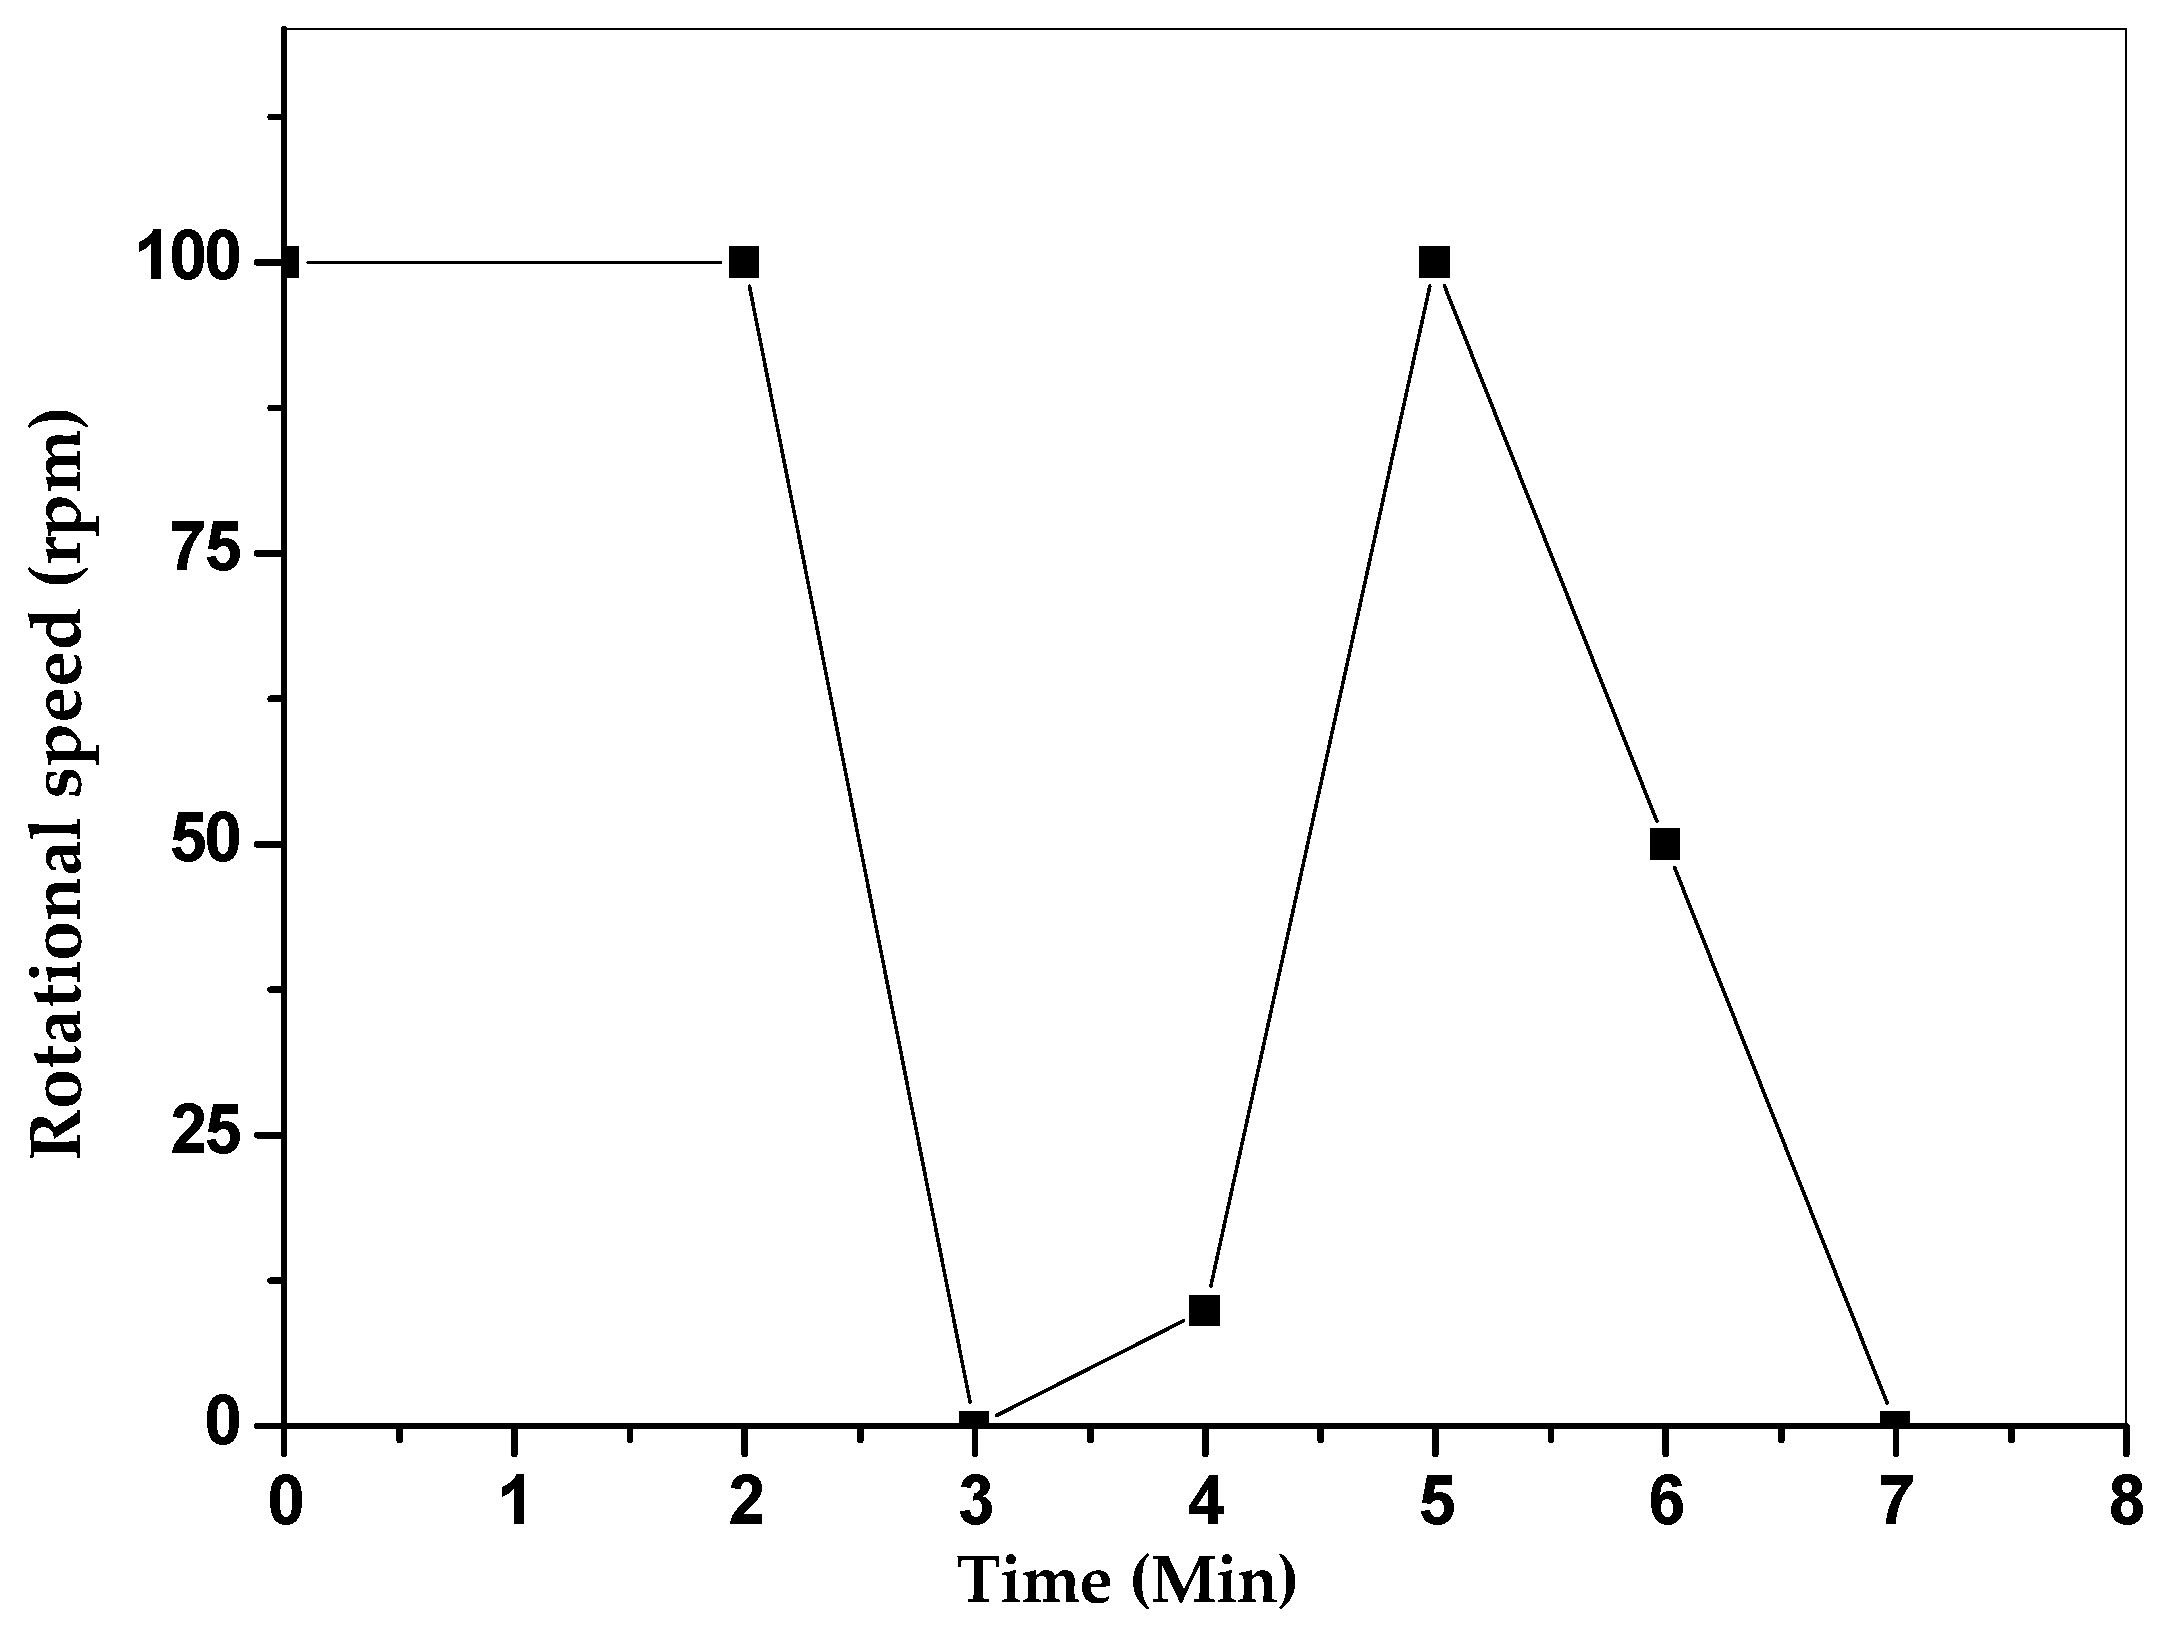
2.2.2. Rheological Measurement
2.2.3. The Flow Table Test
2.2.4. Mercury Intrusion Porosimetry Test
2.2.5. Compressive Strength Test
3. Results and Discussion
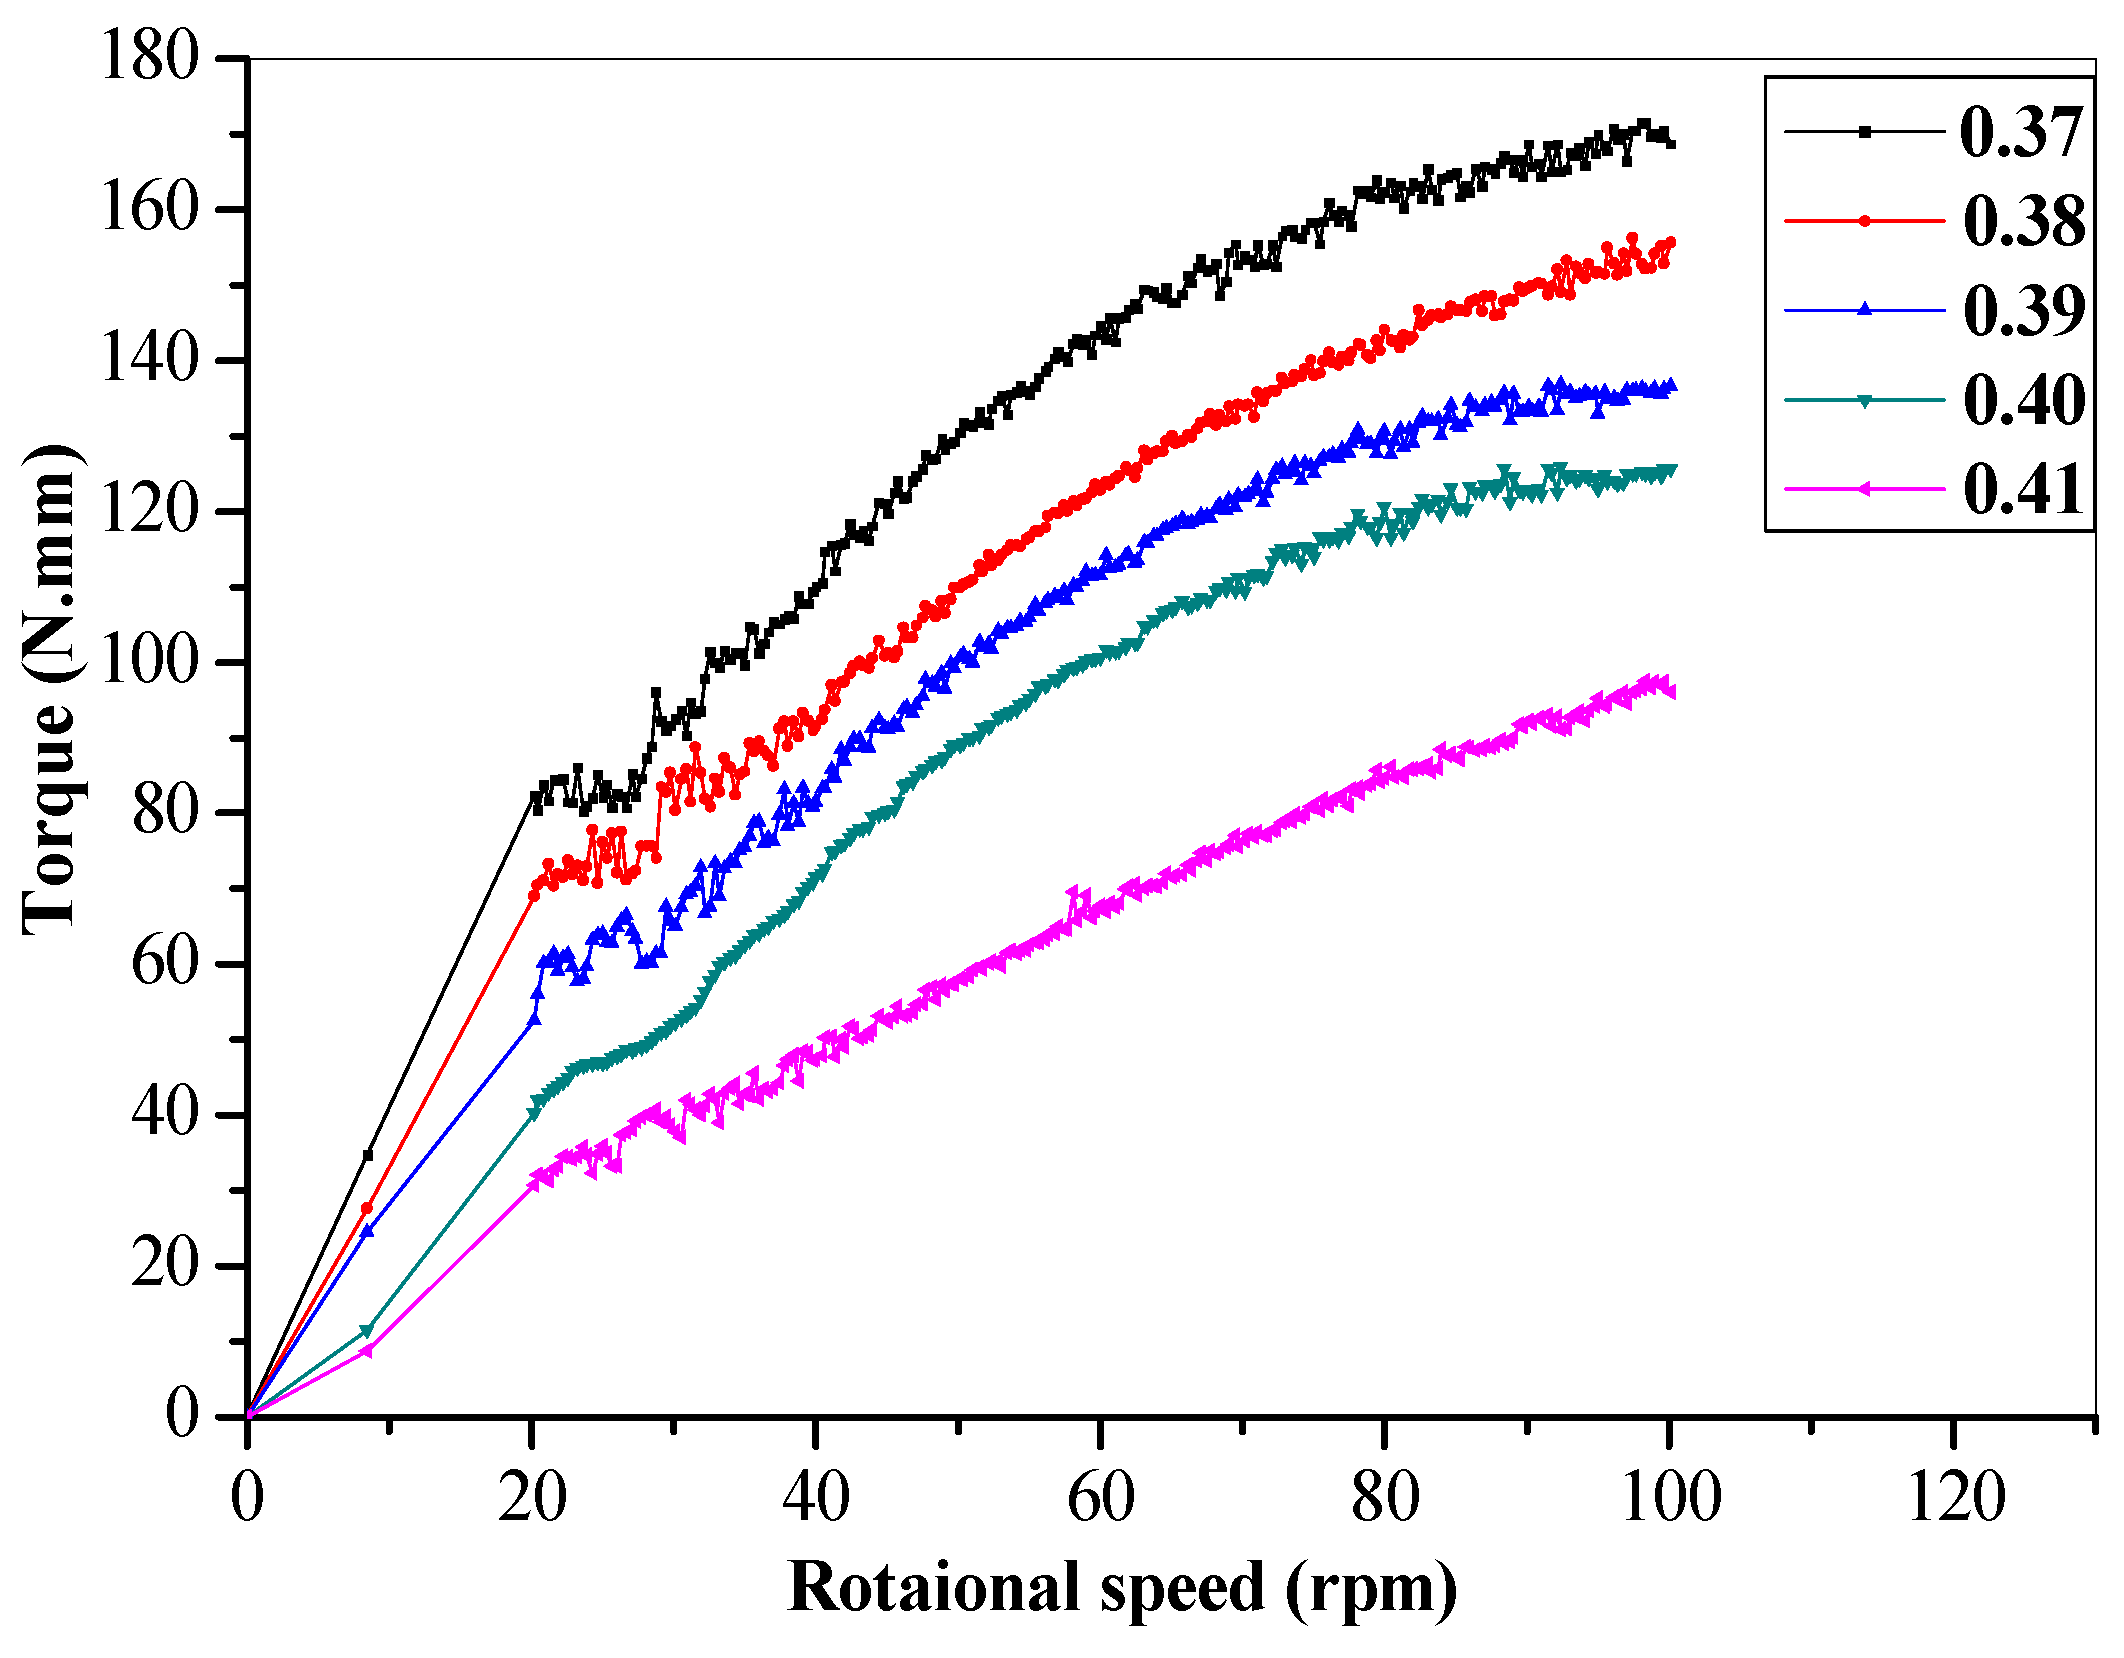
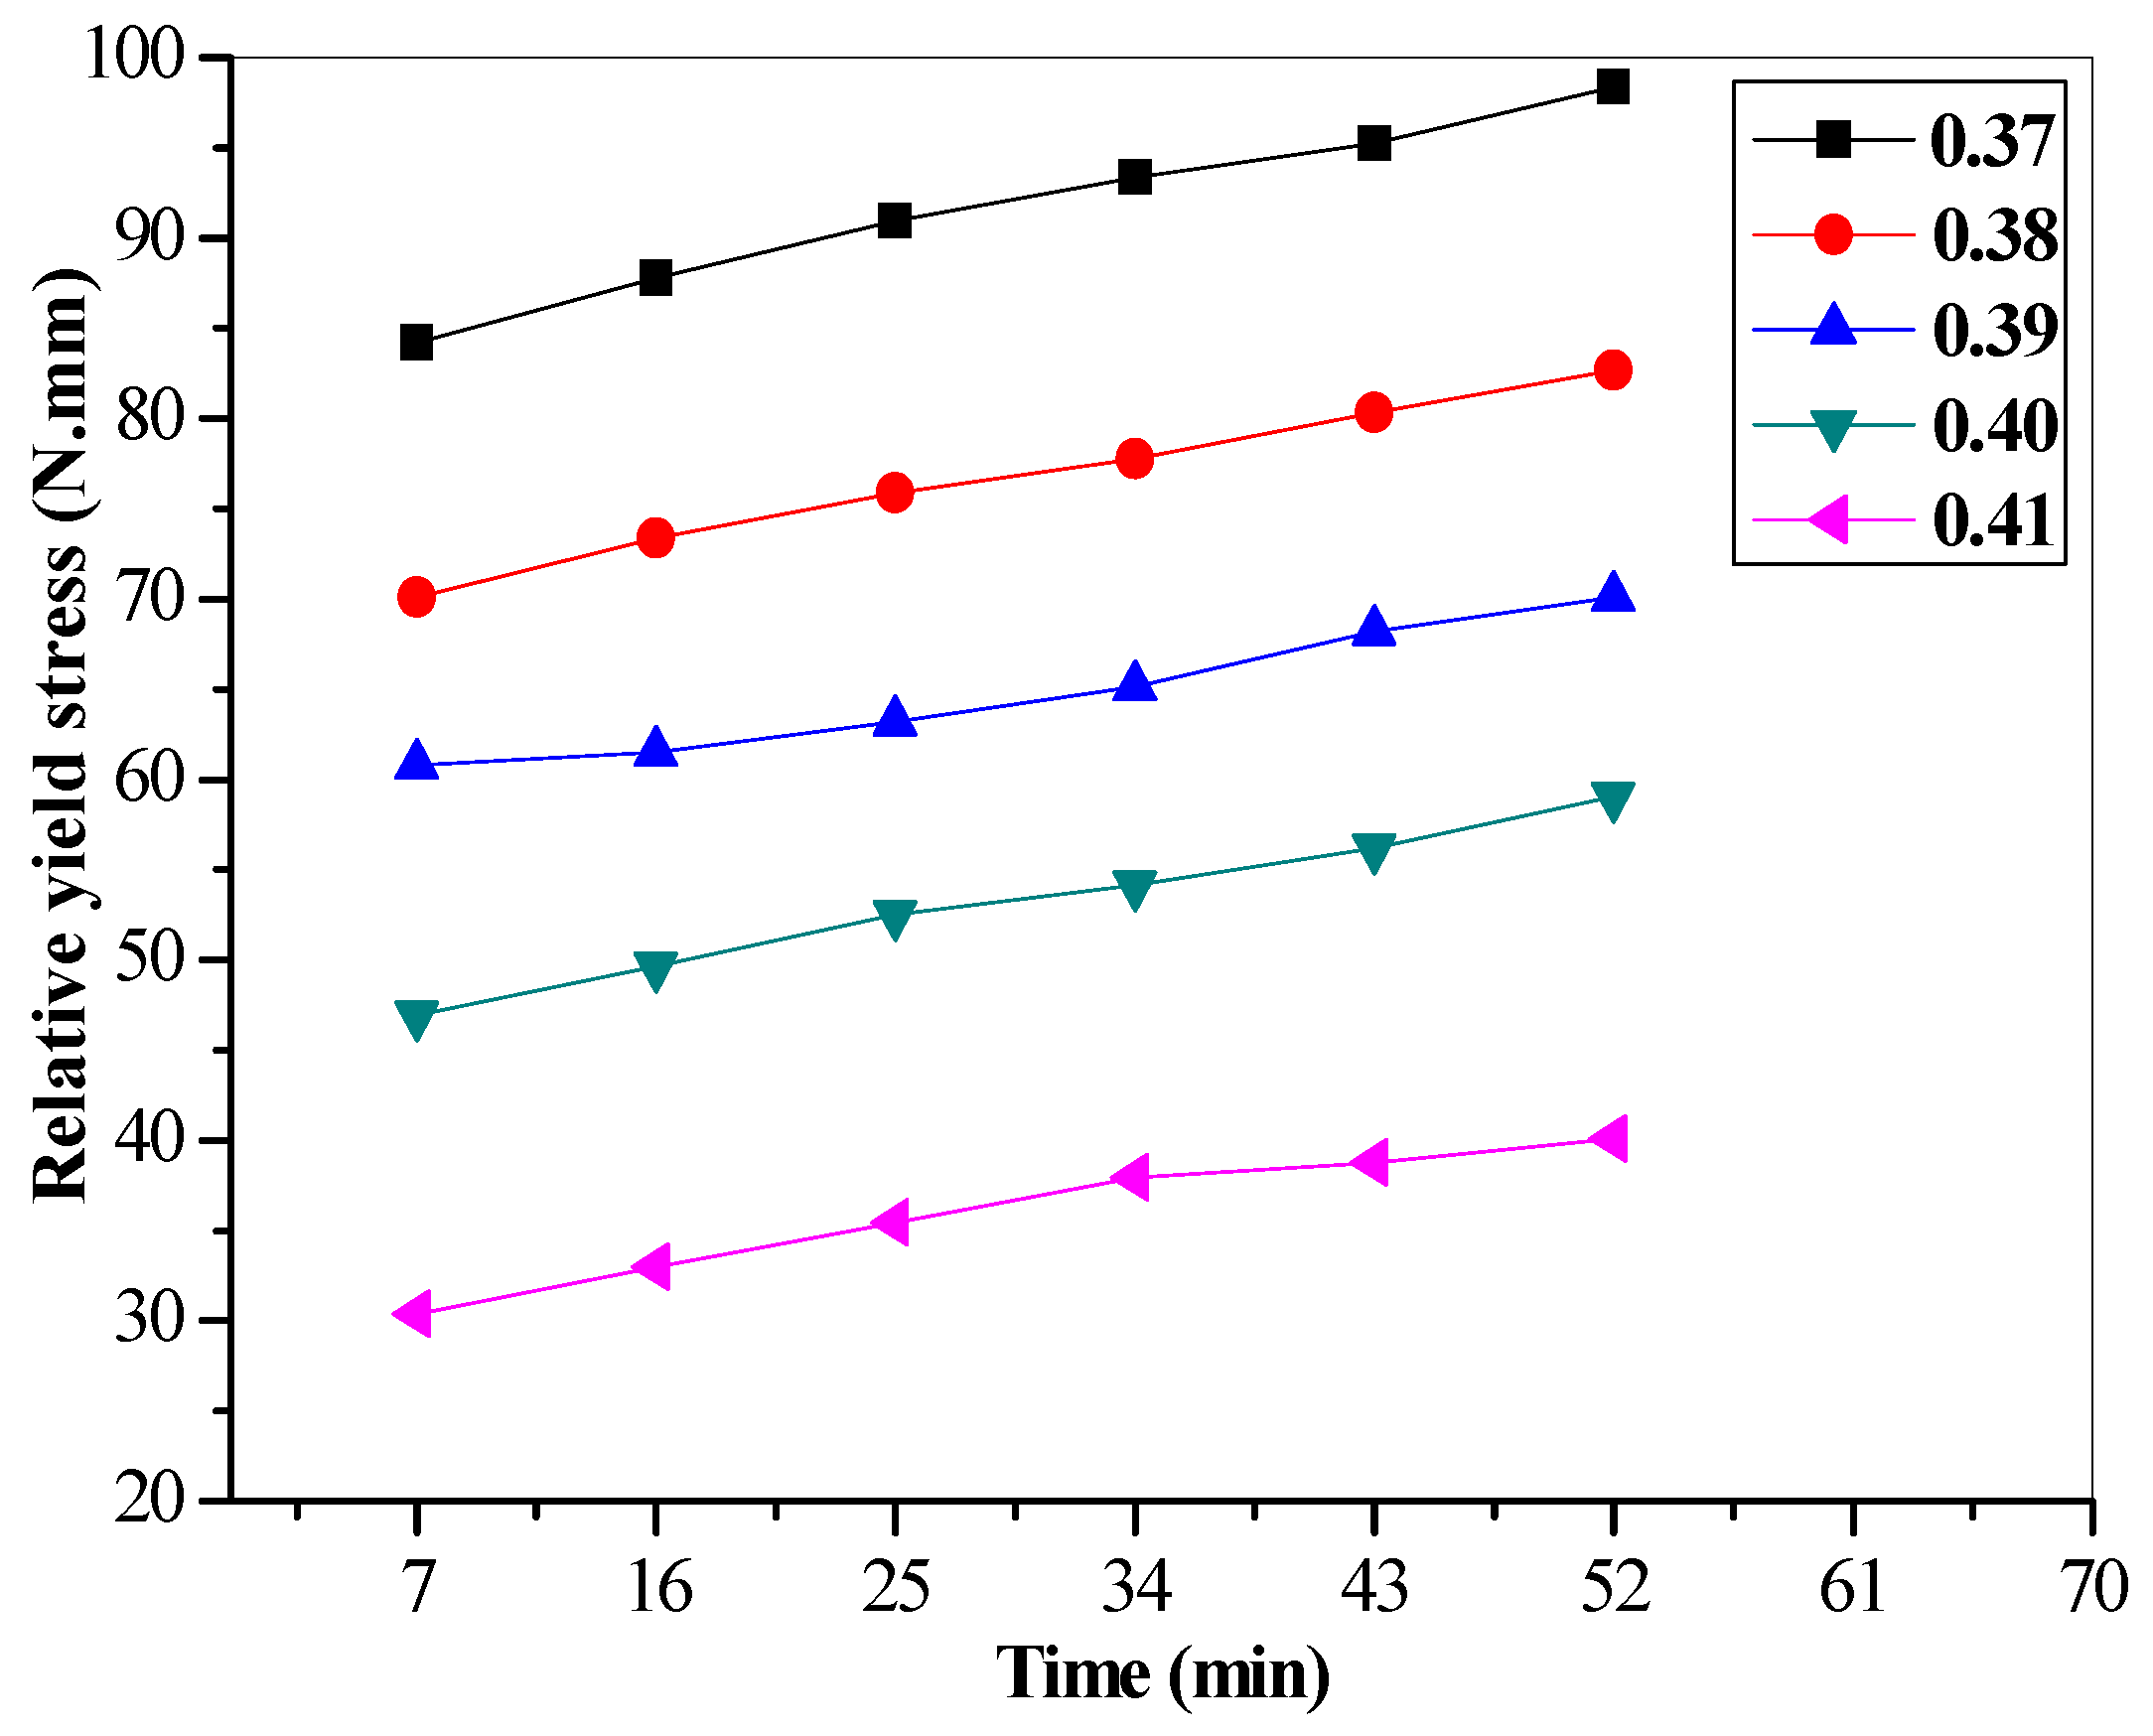
3.1. Evaluation of Yield Stress
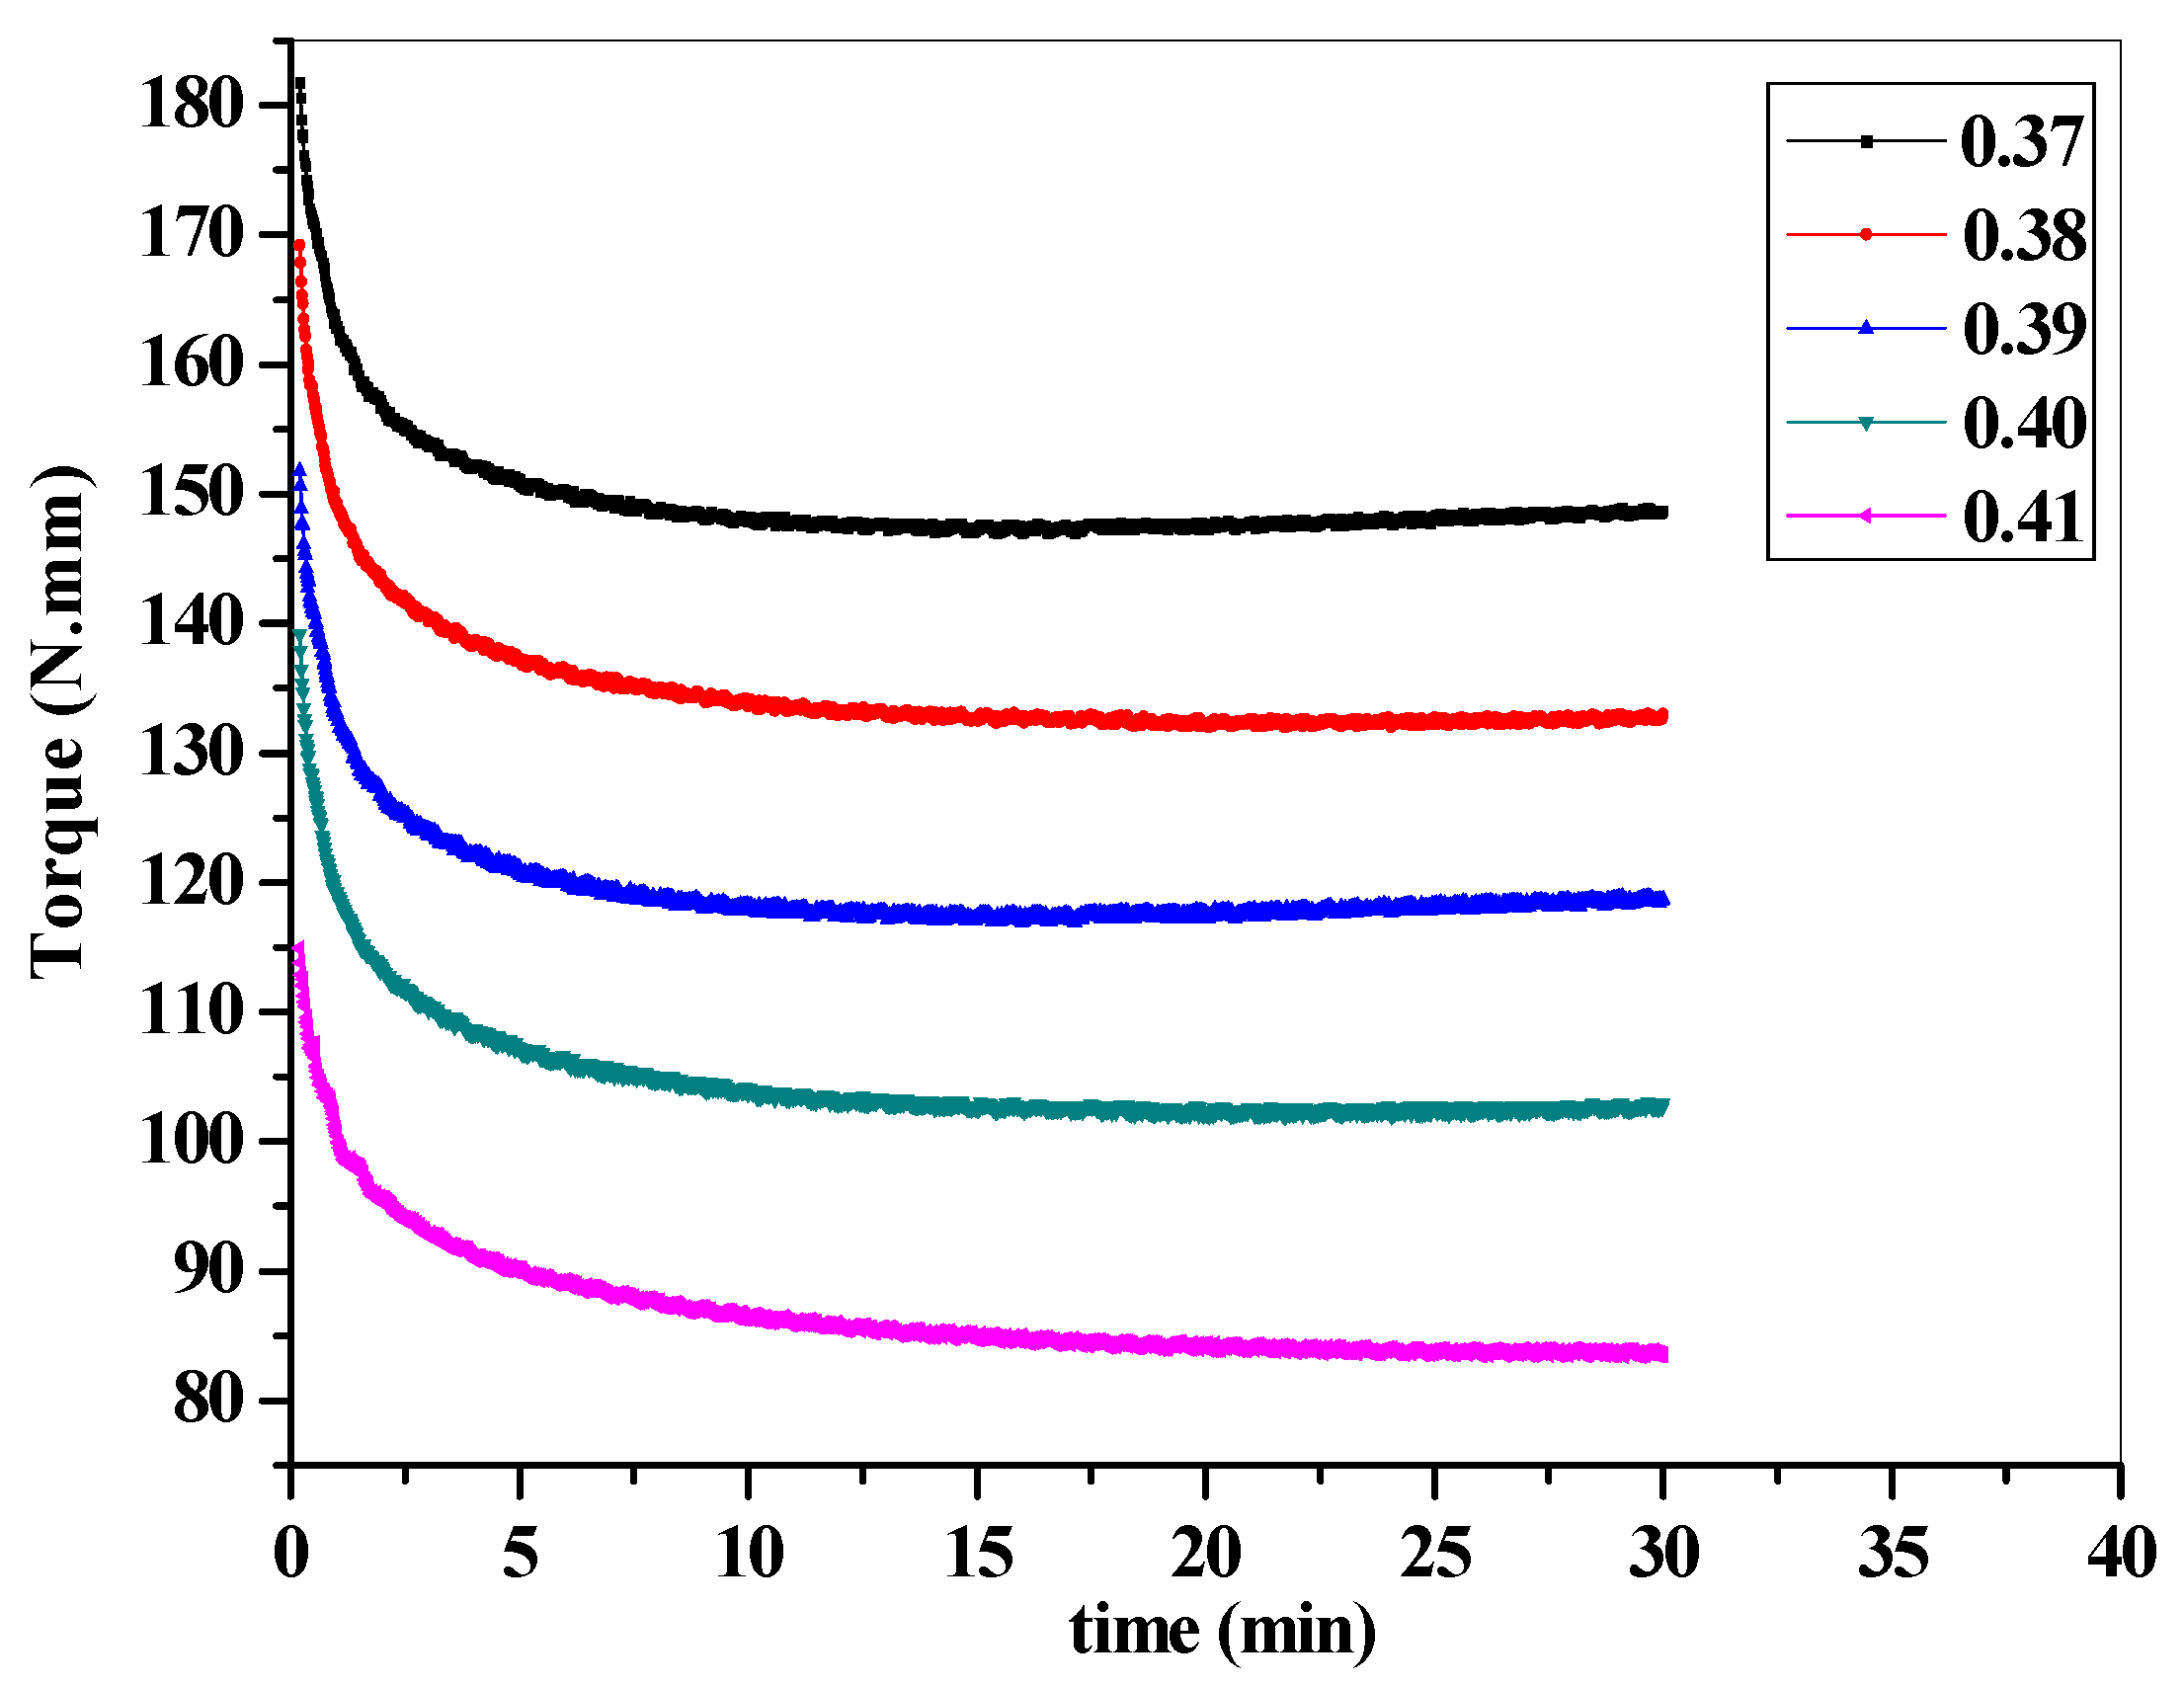
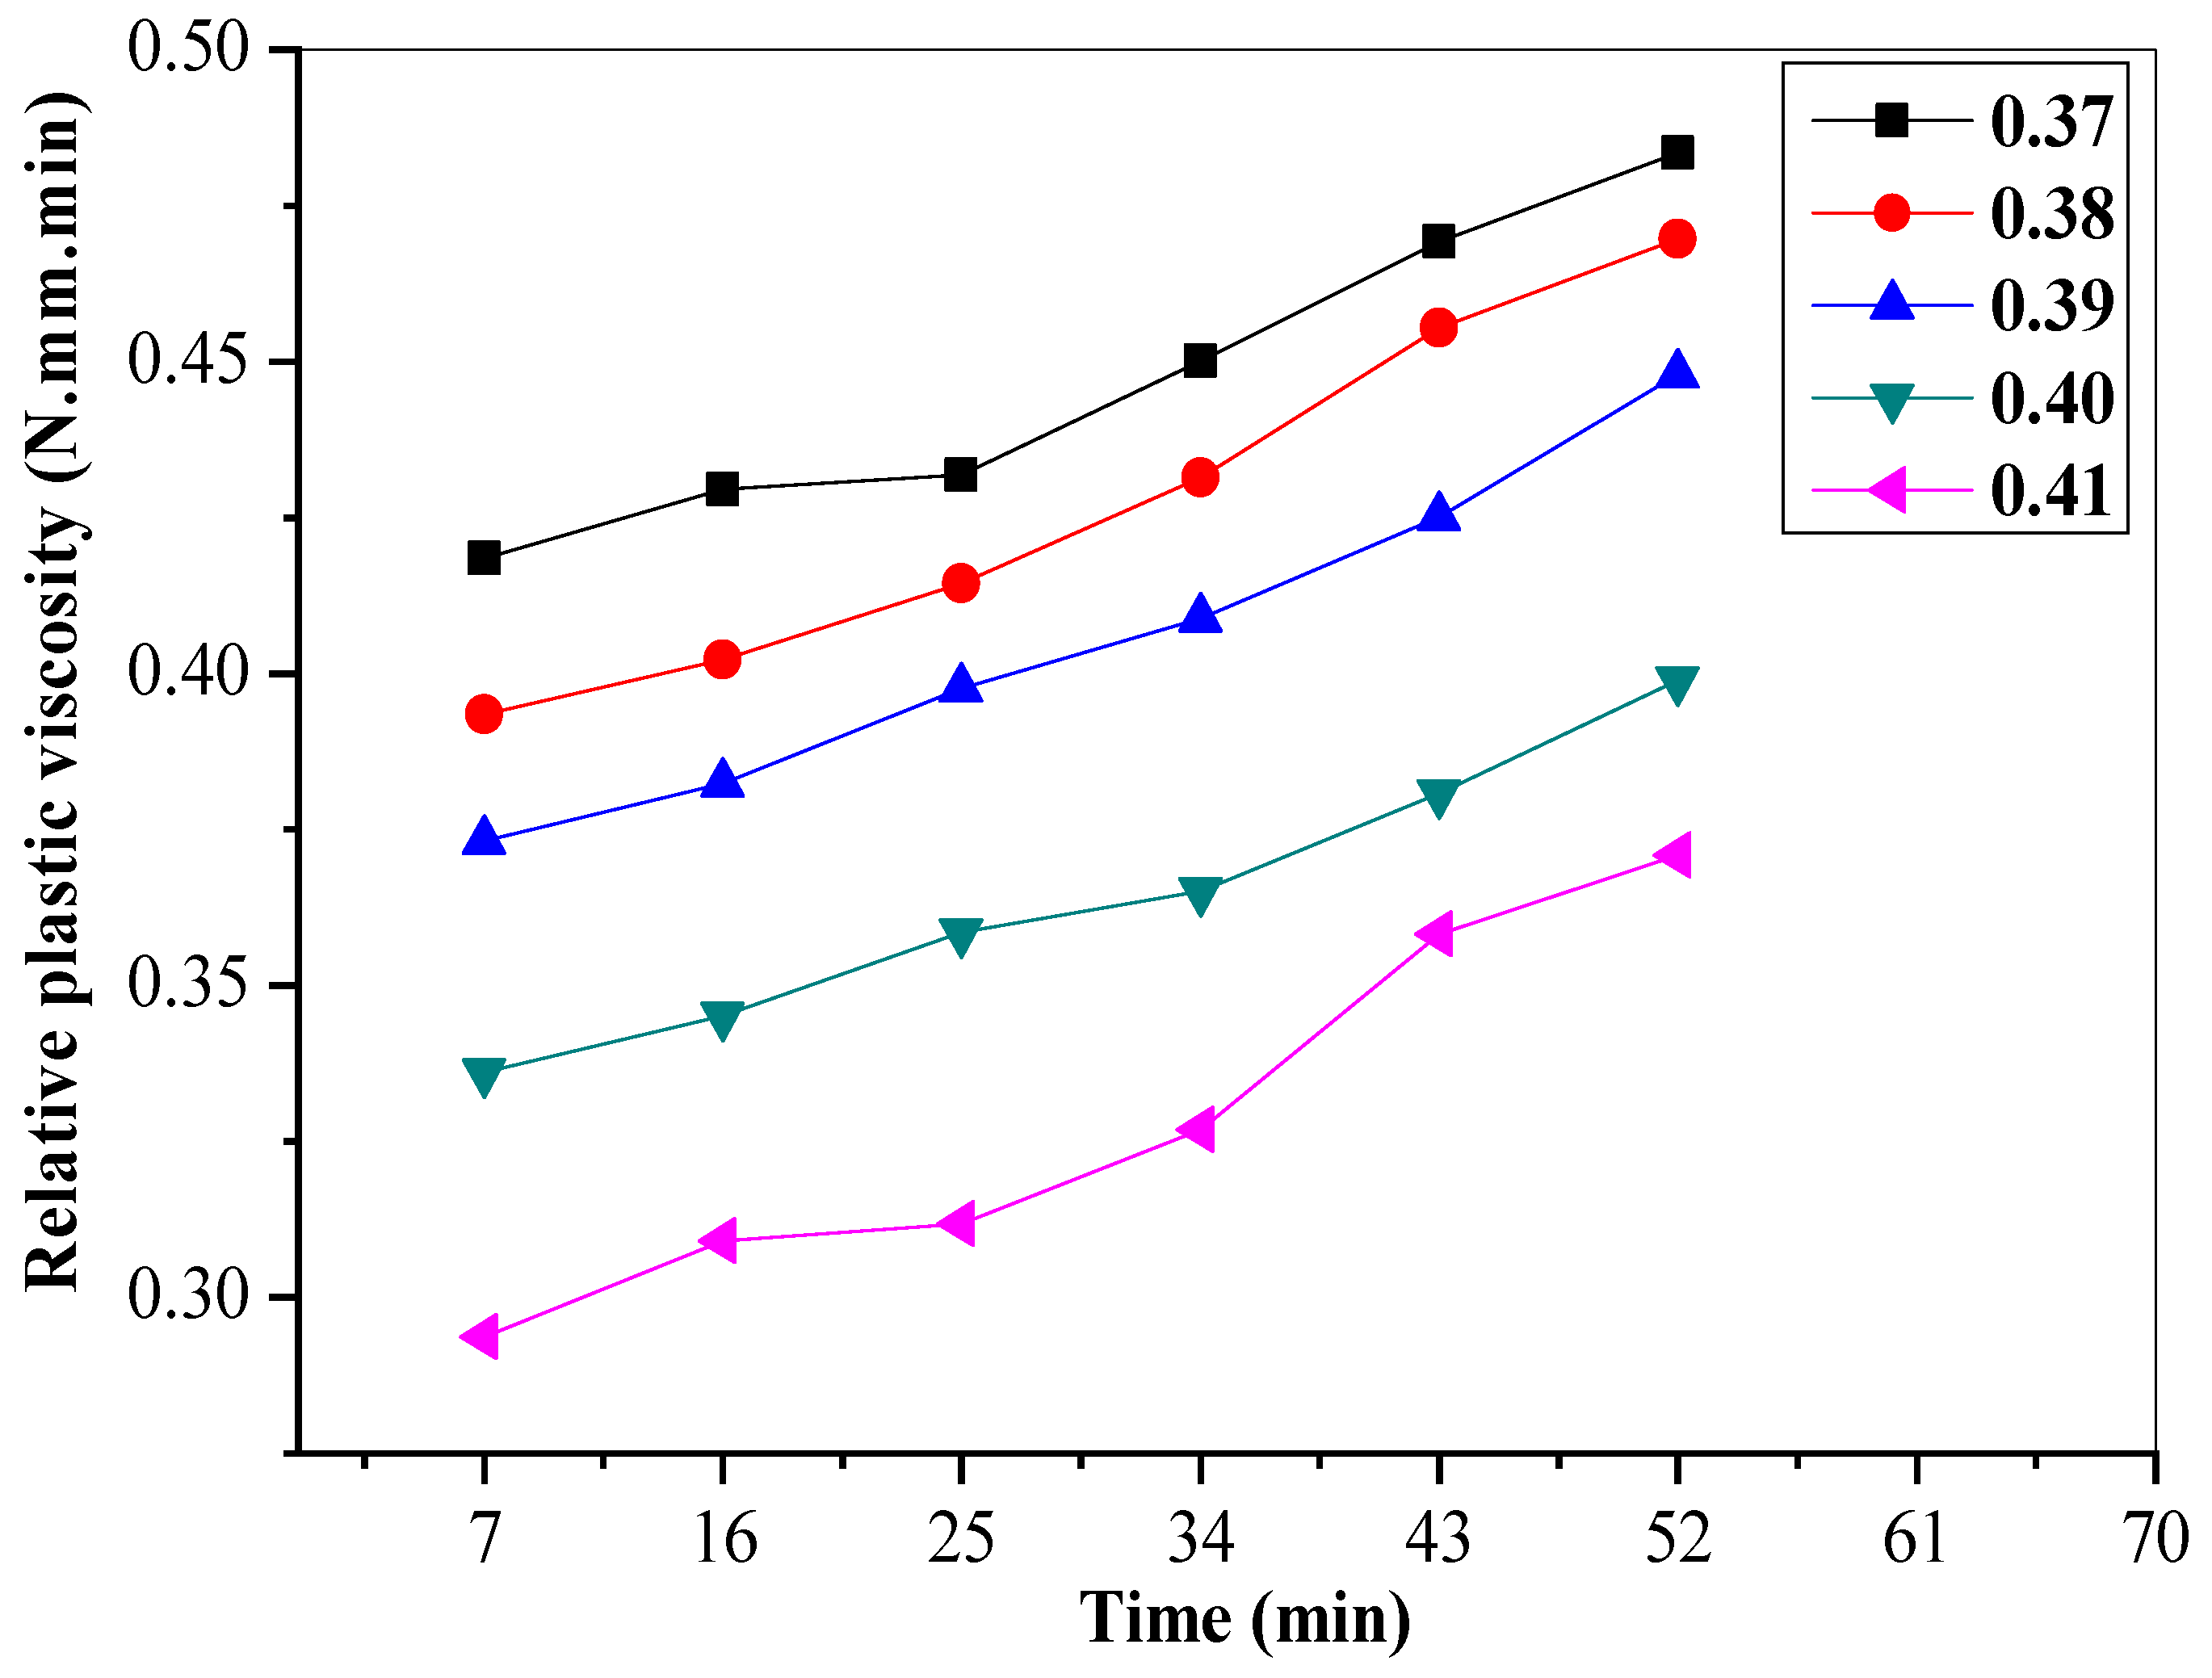
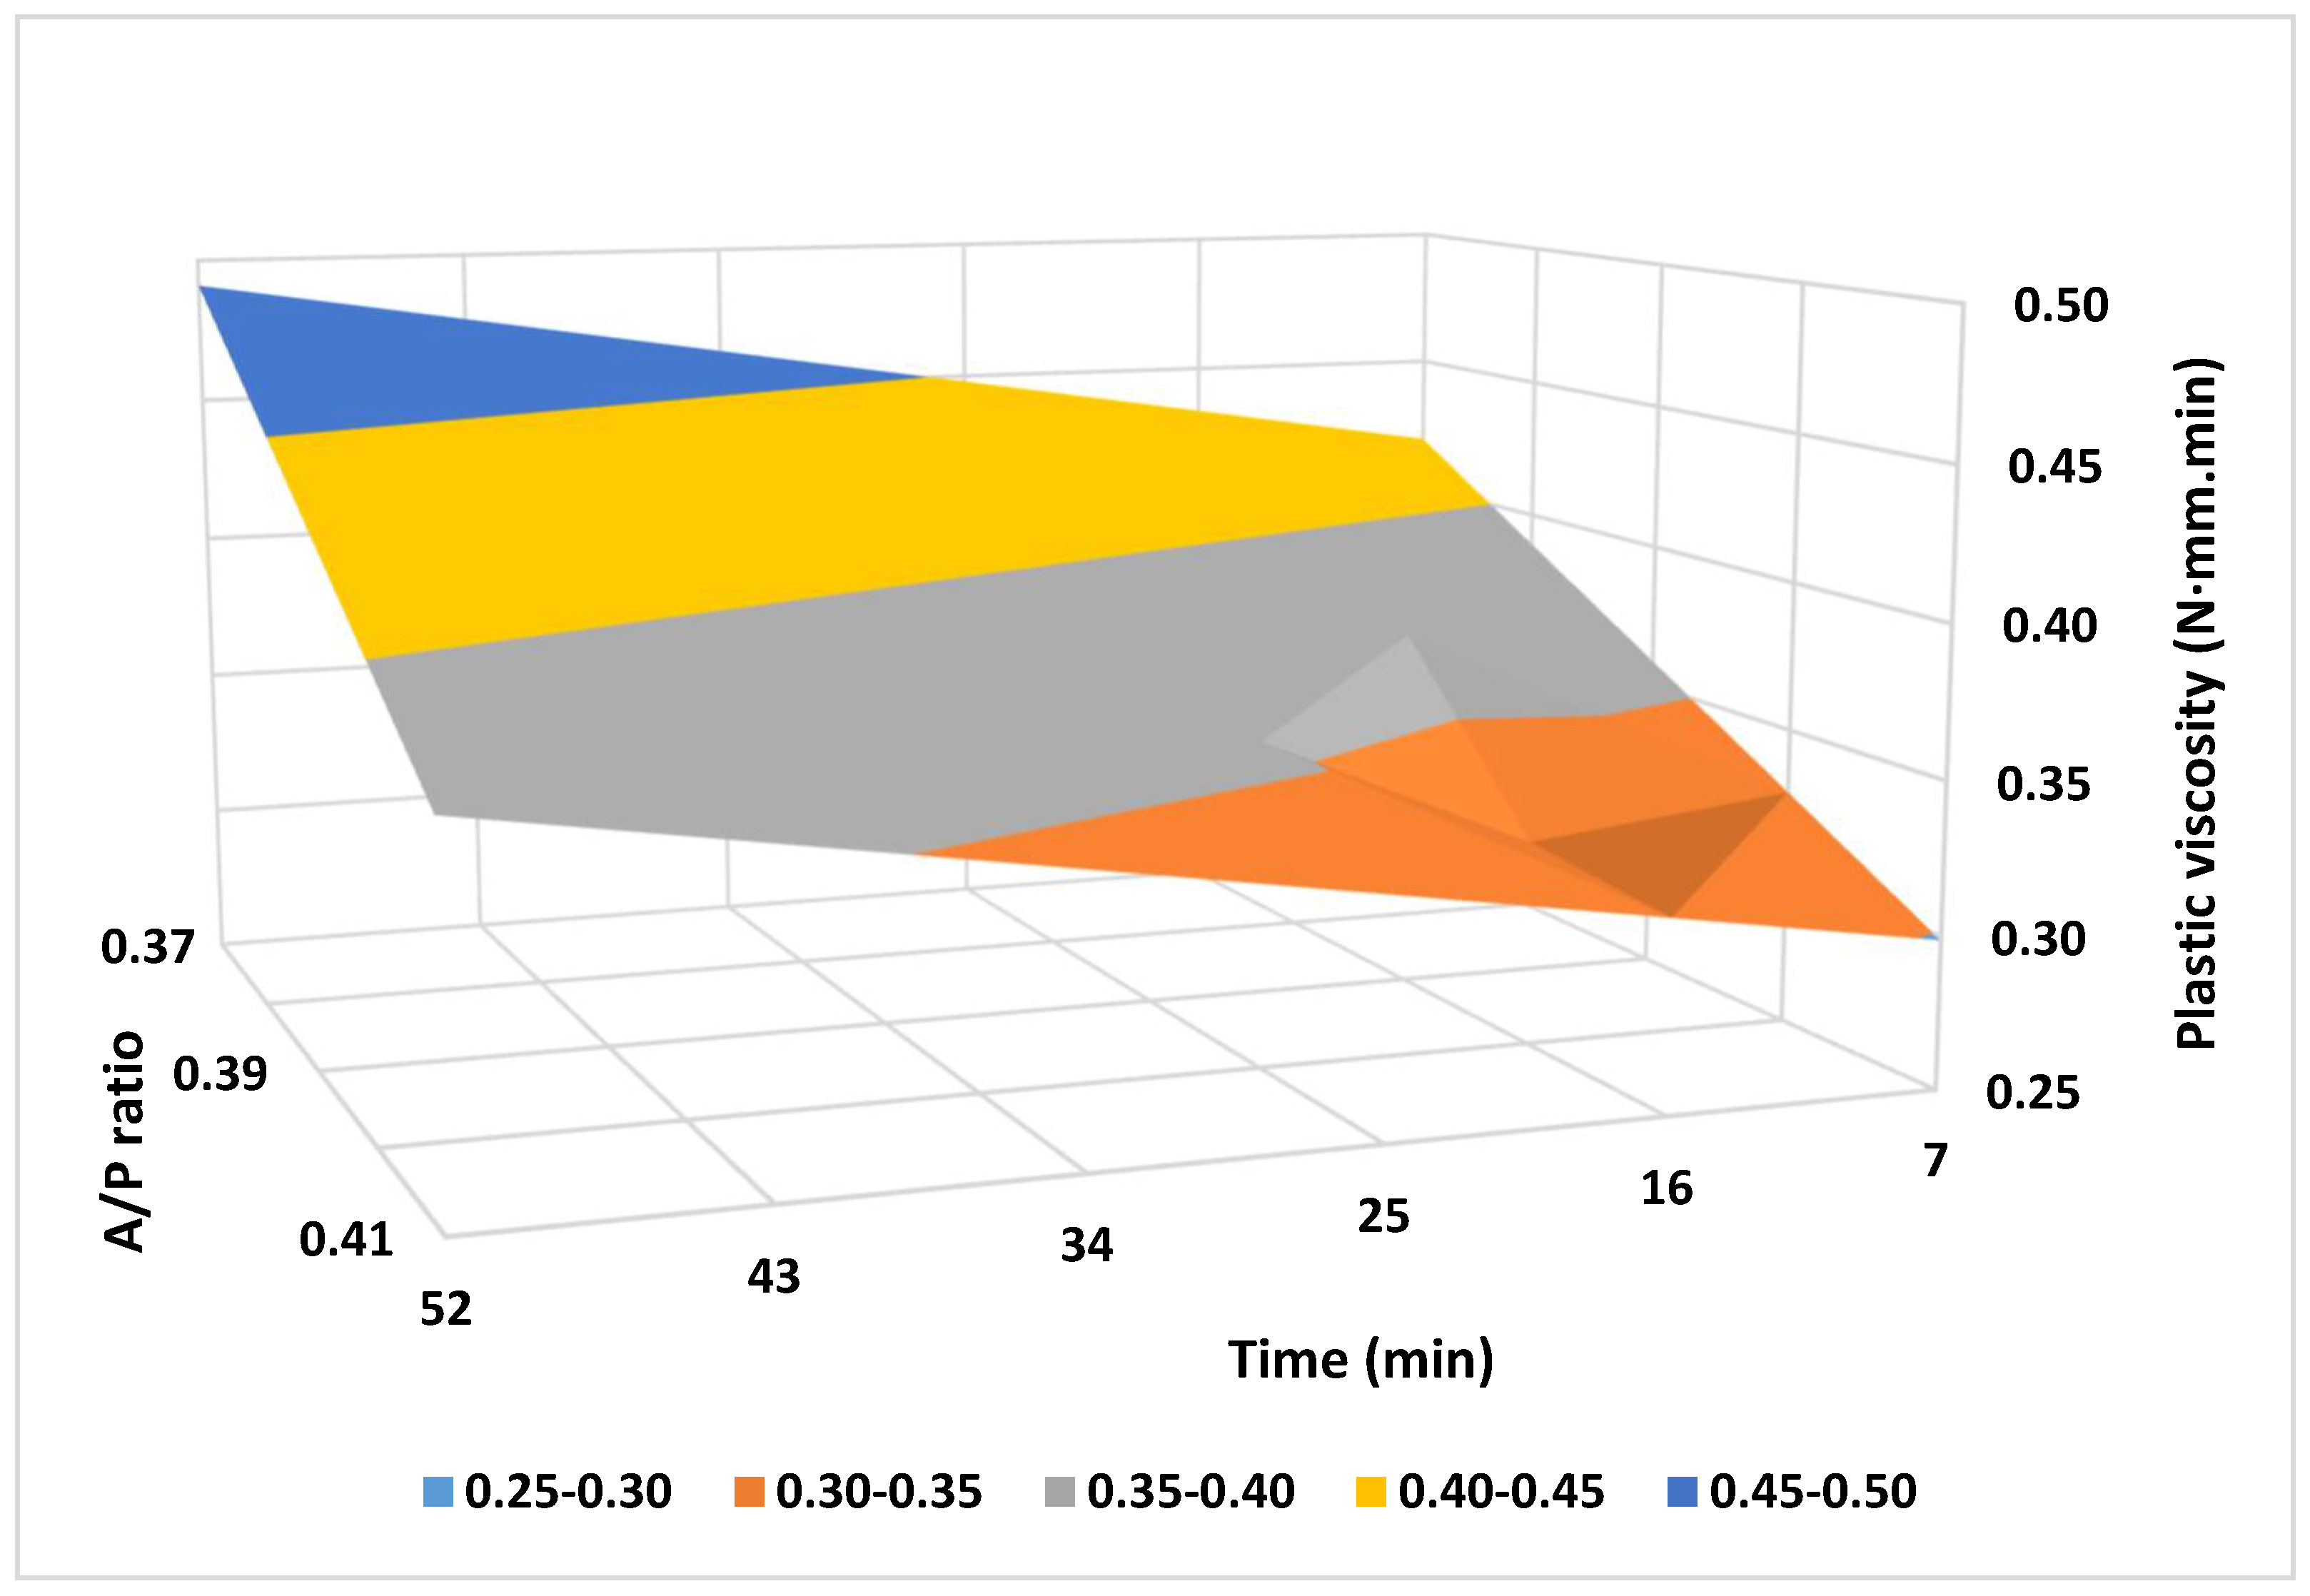
3.2. Evaluation of Relative Plastic Viscosity
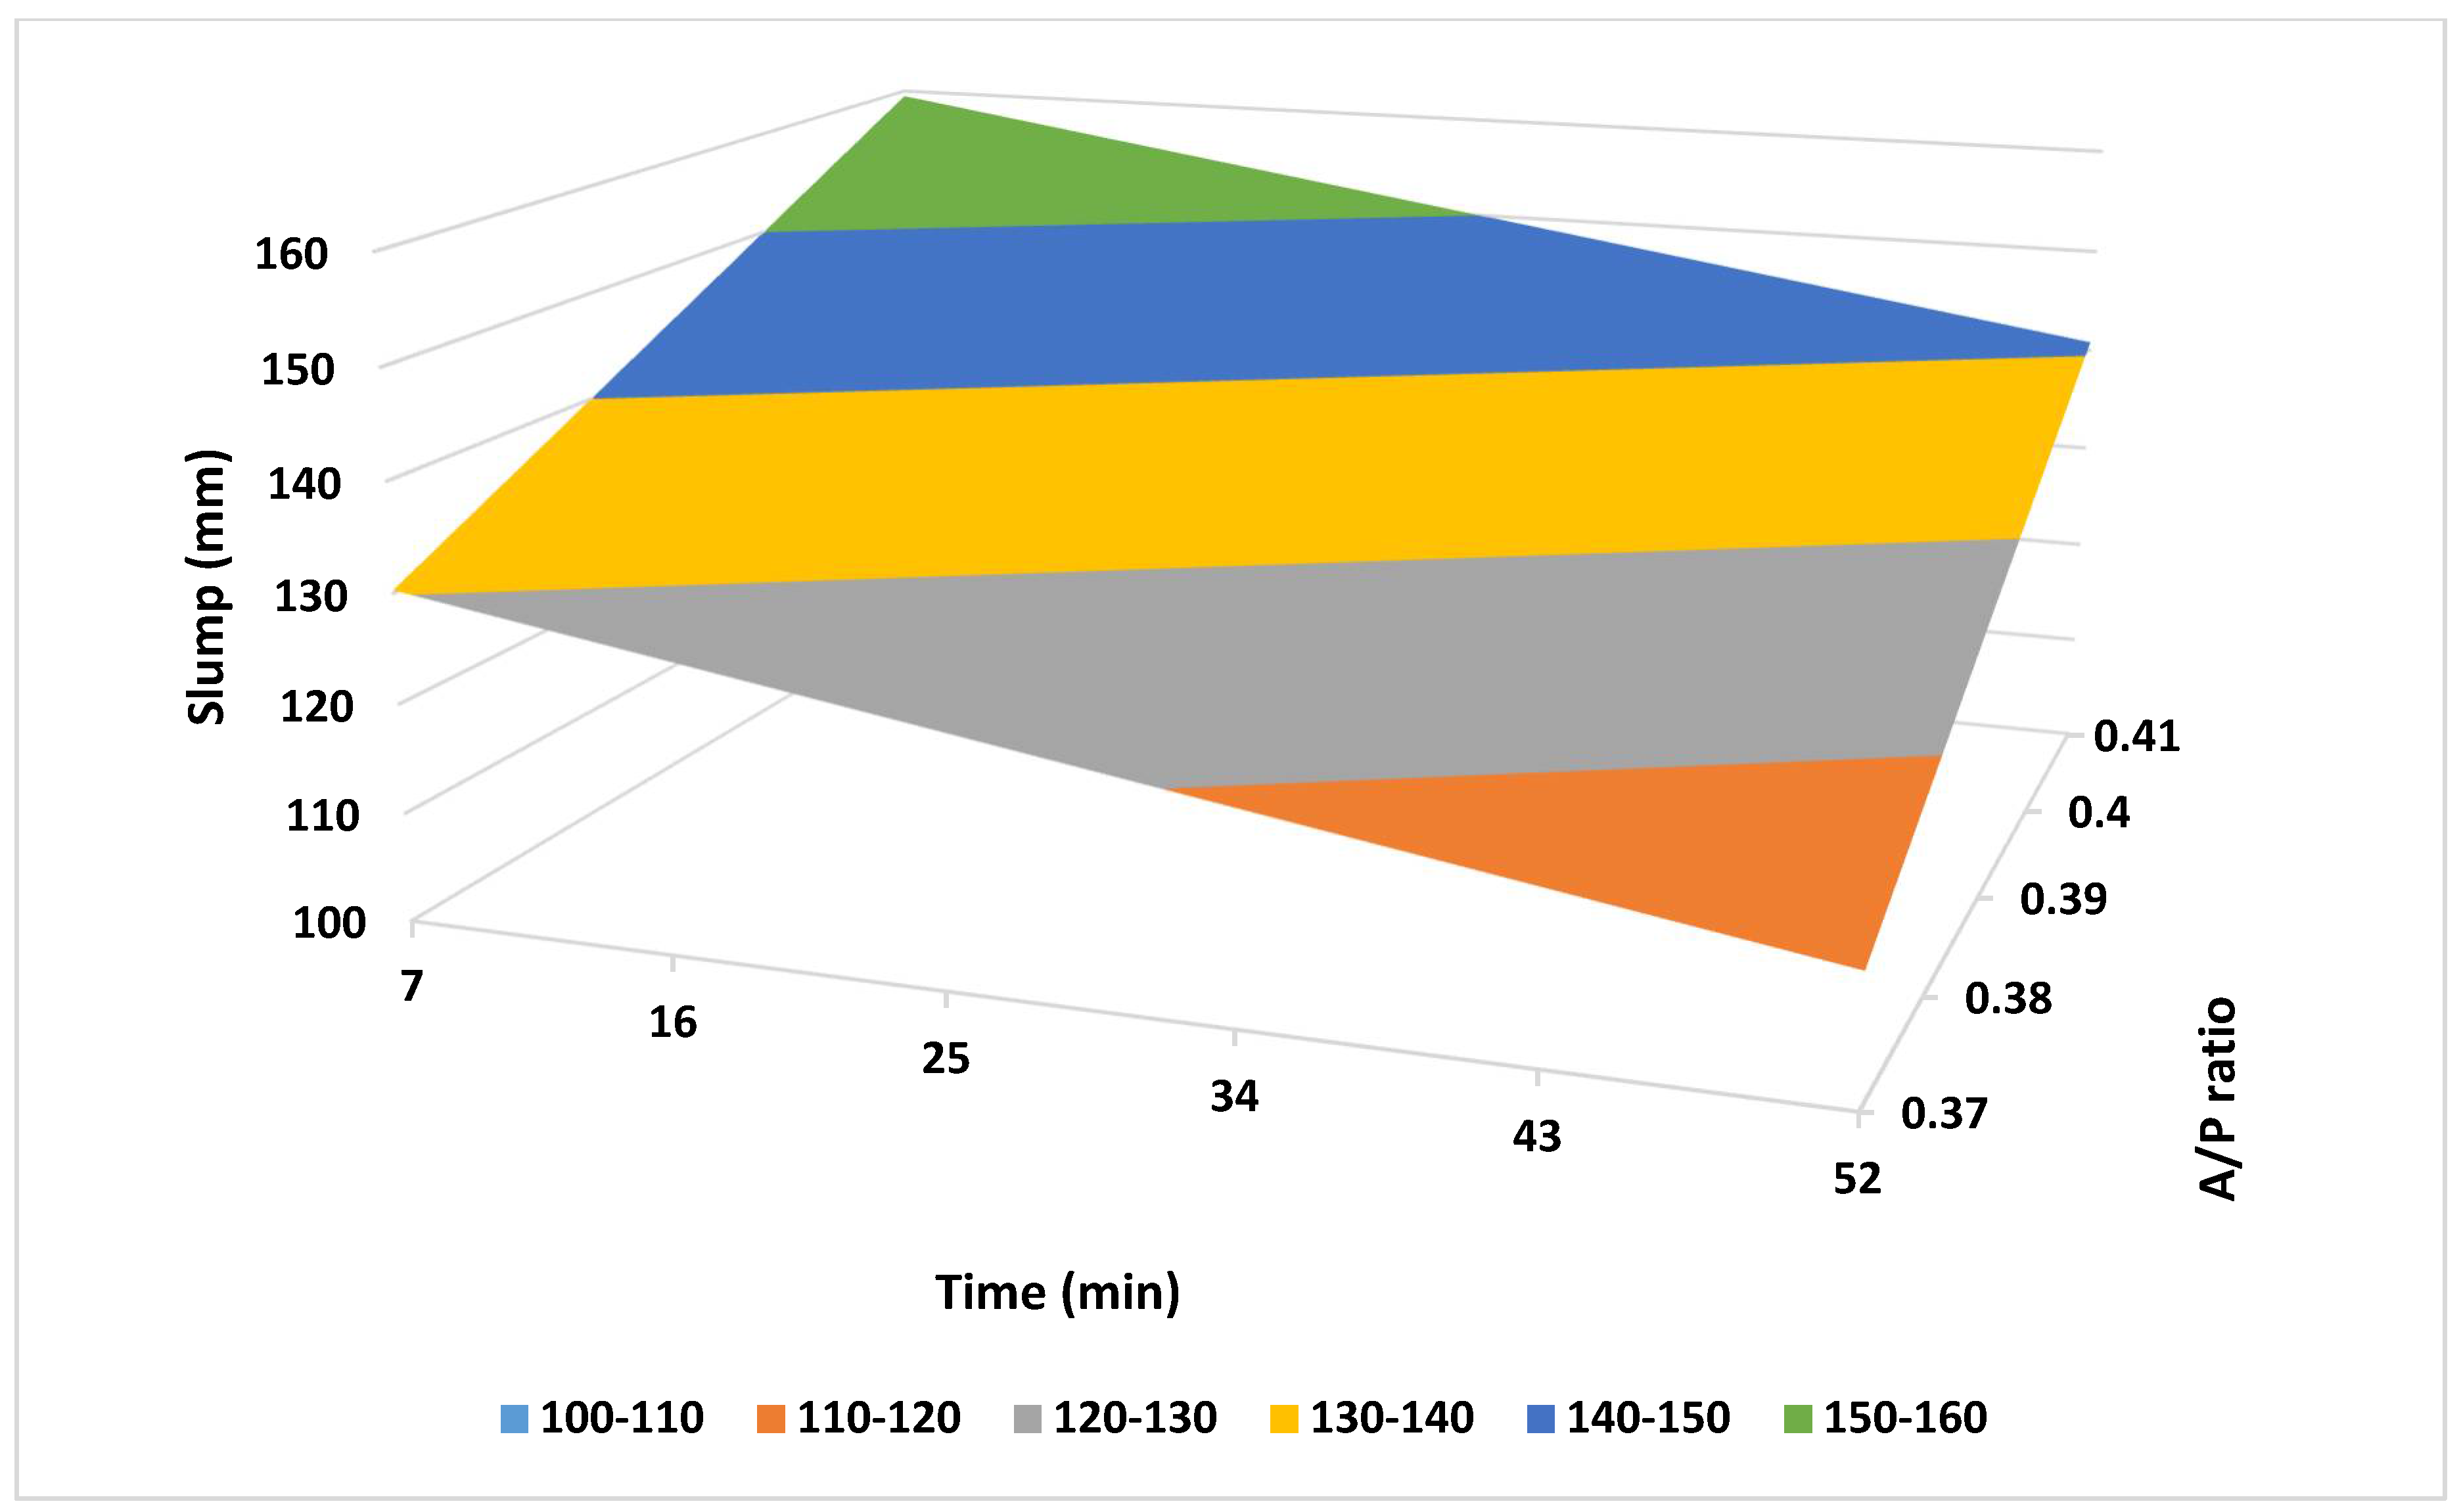
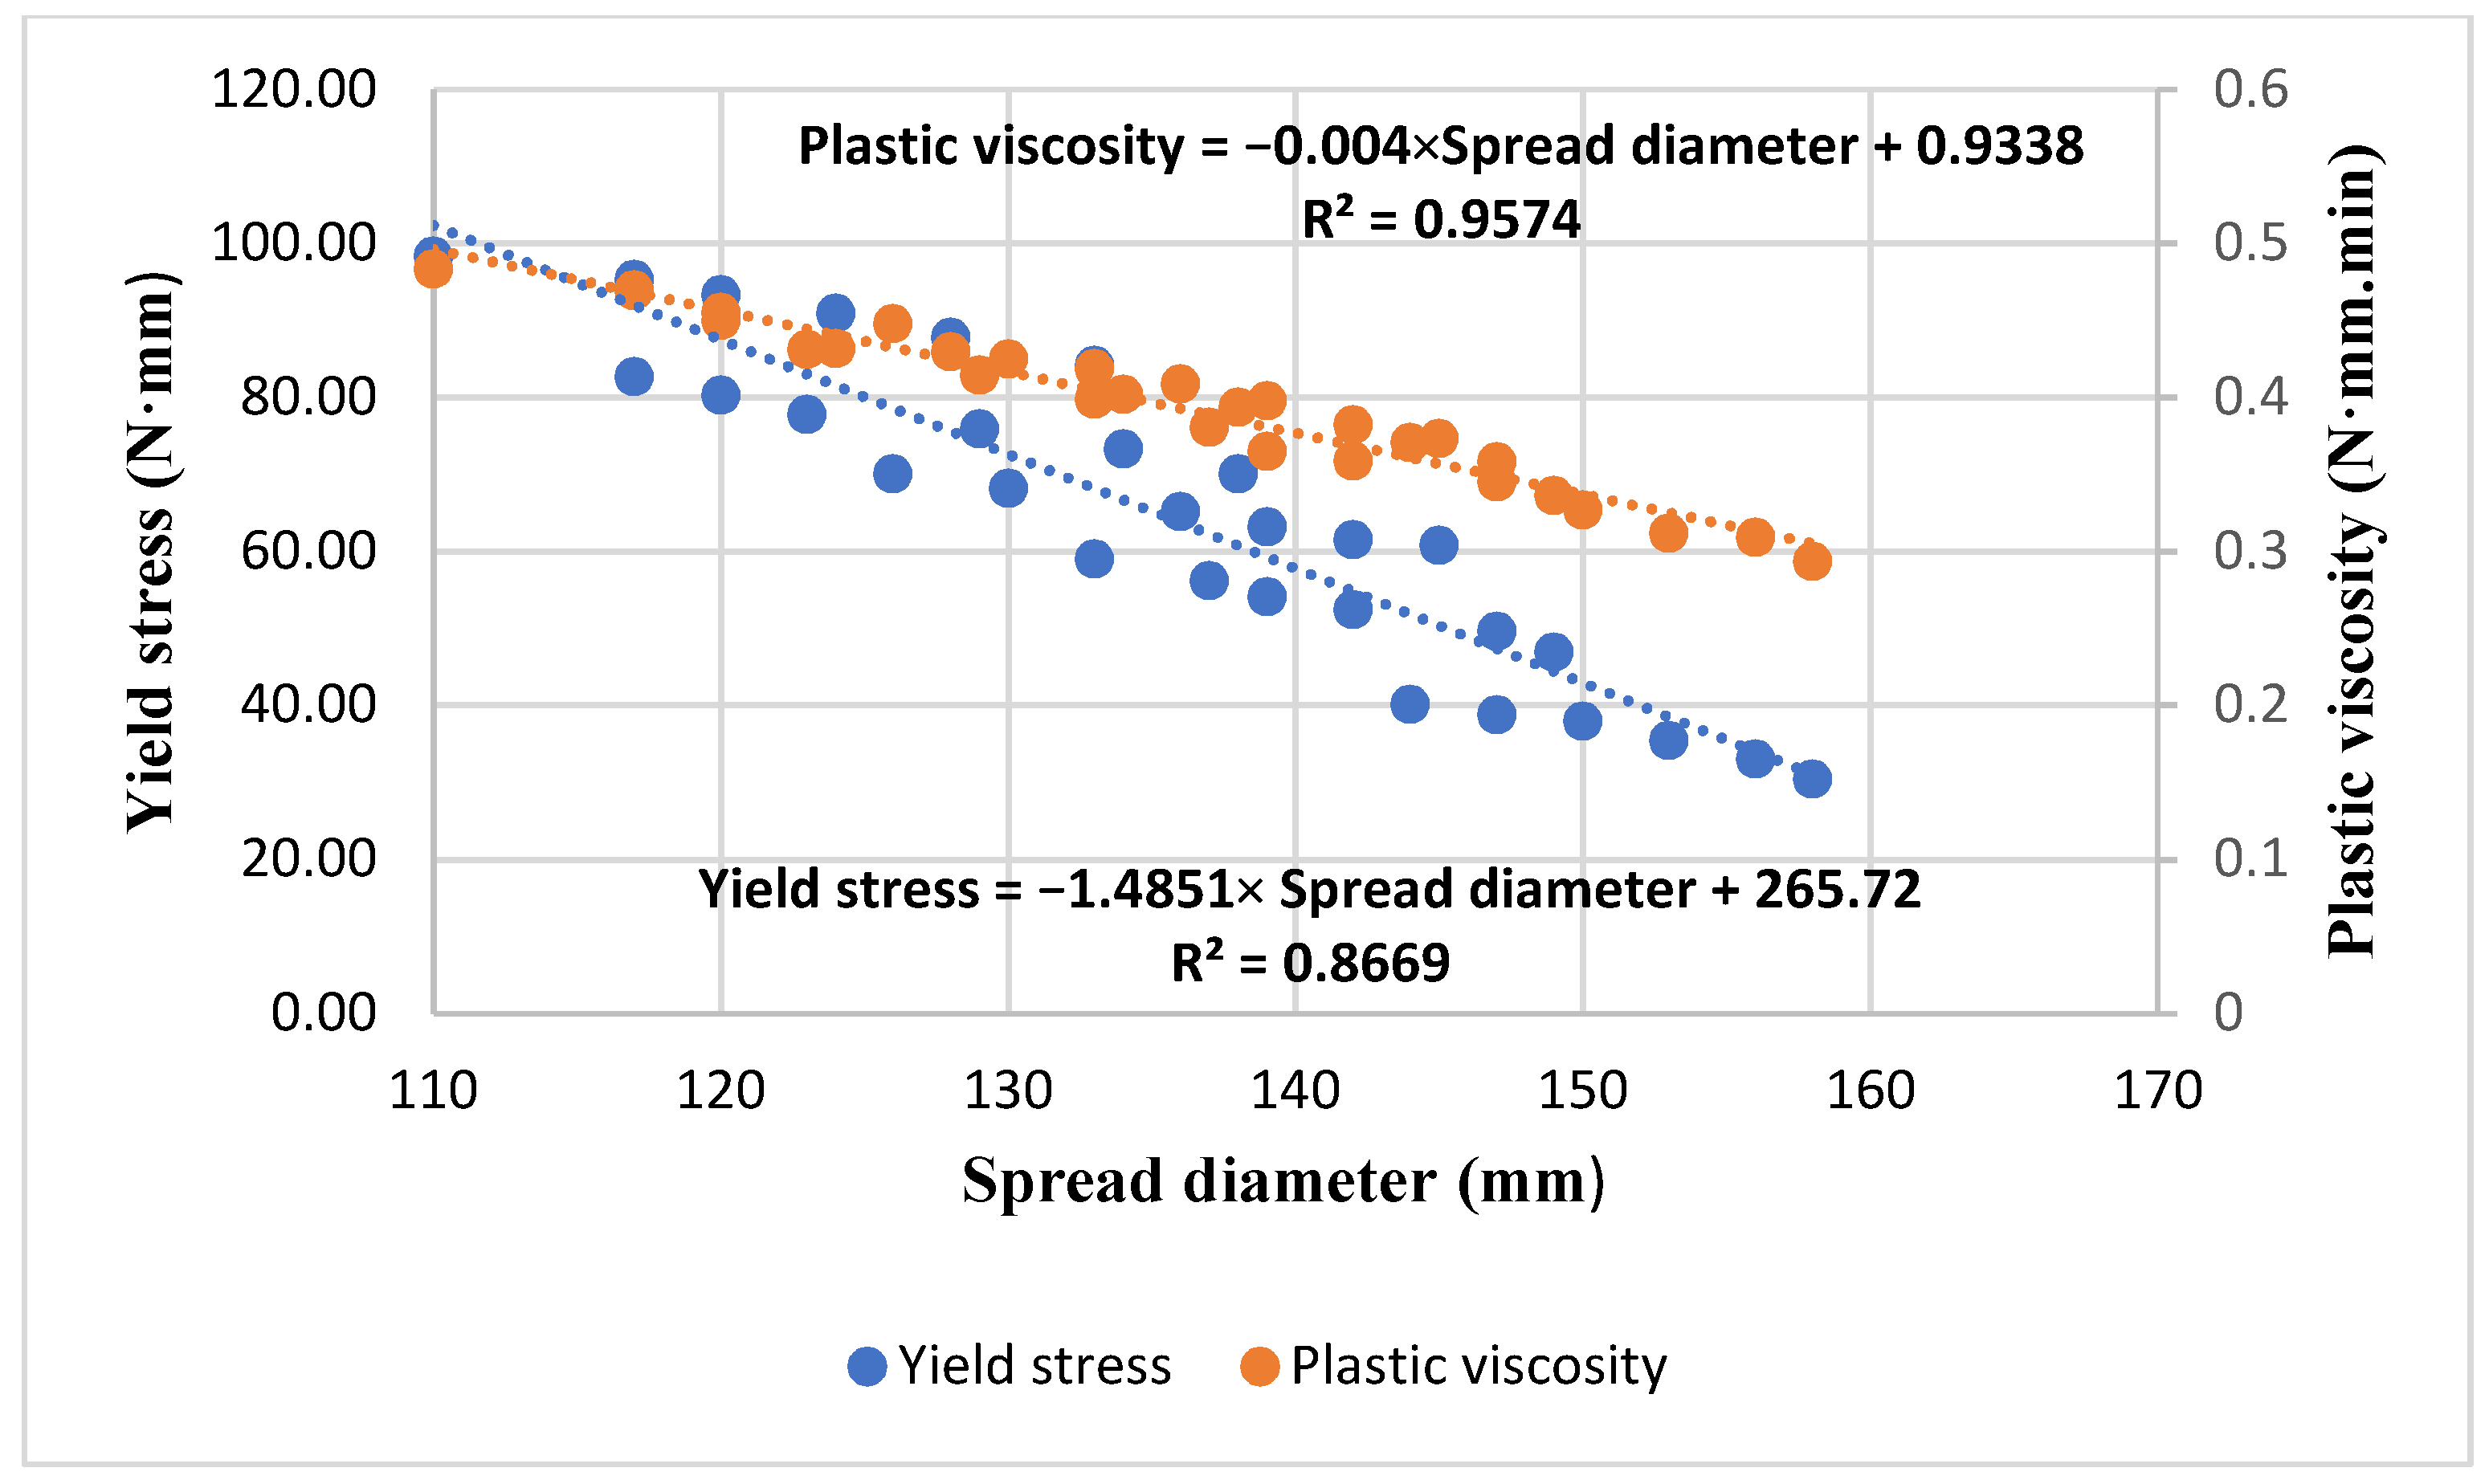
3.3. The Flow Table Results
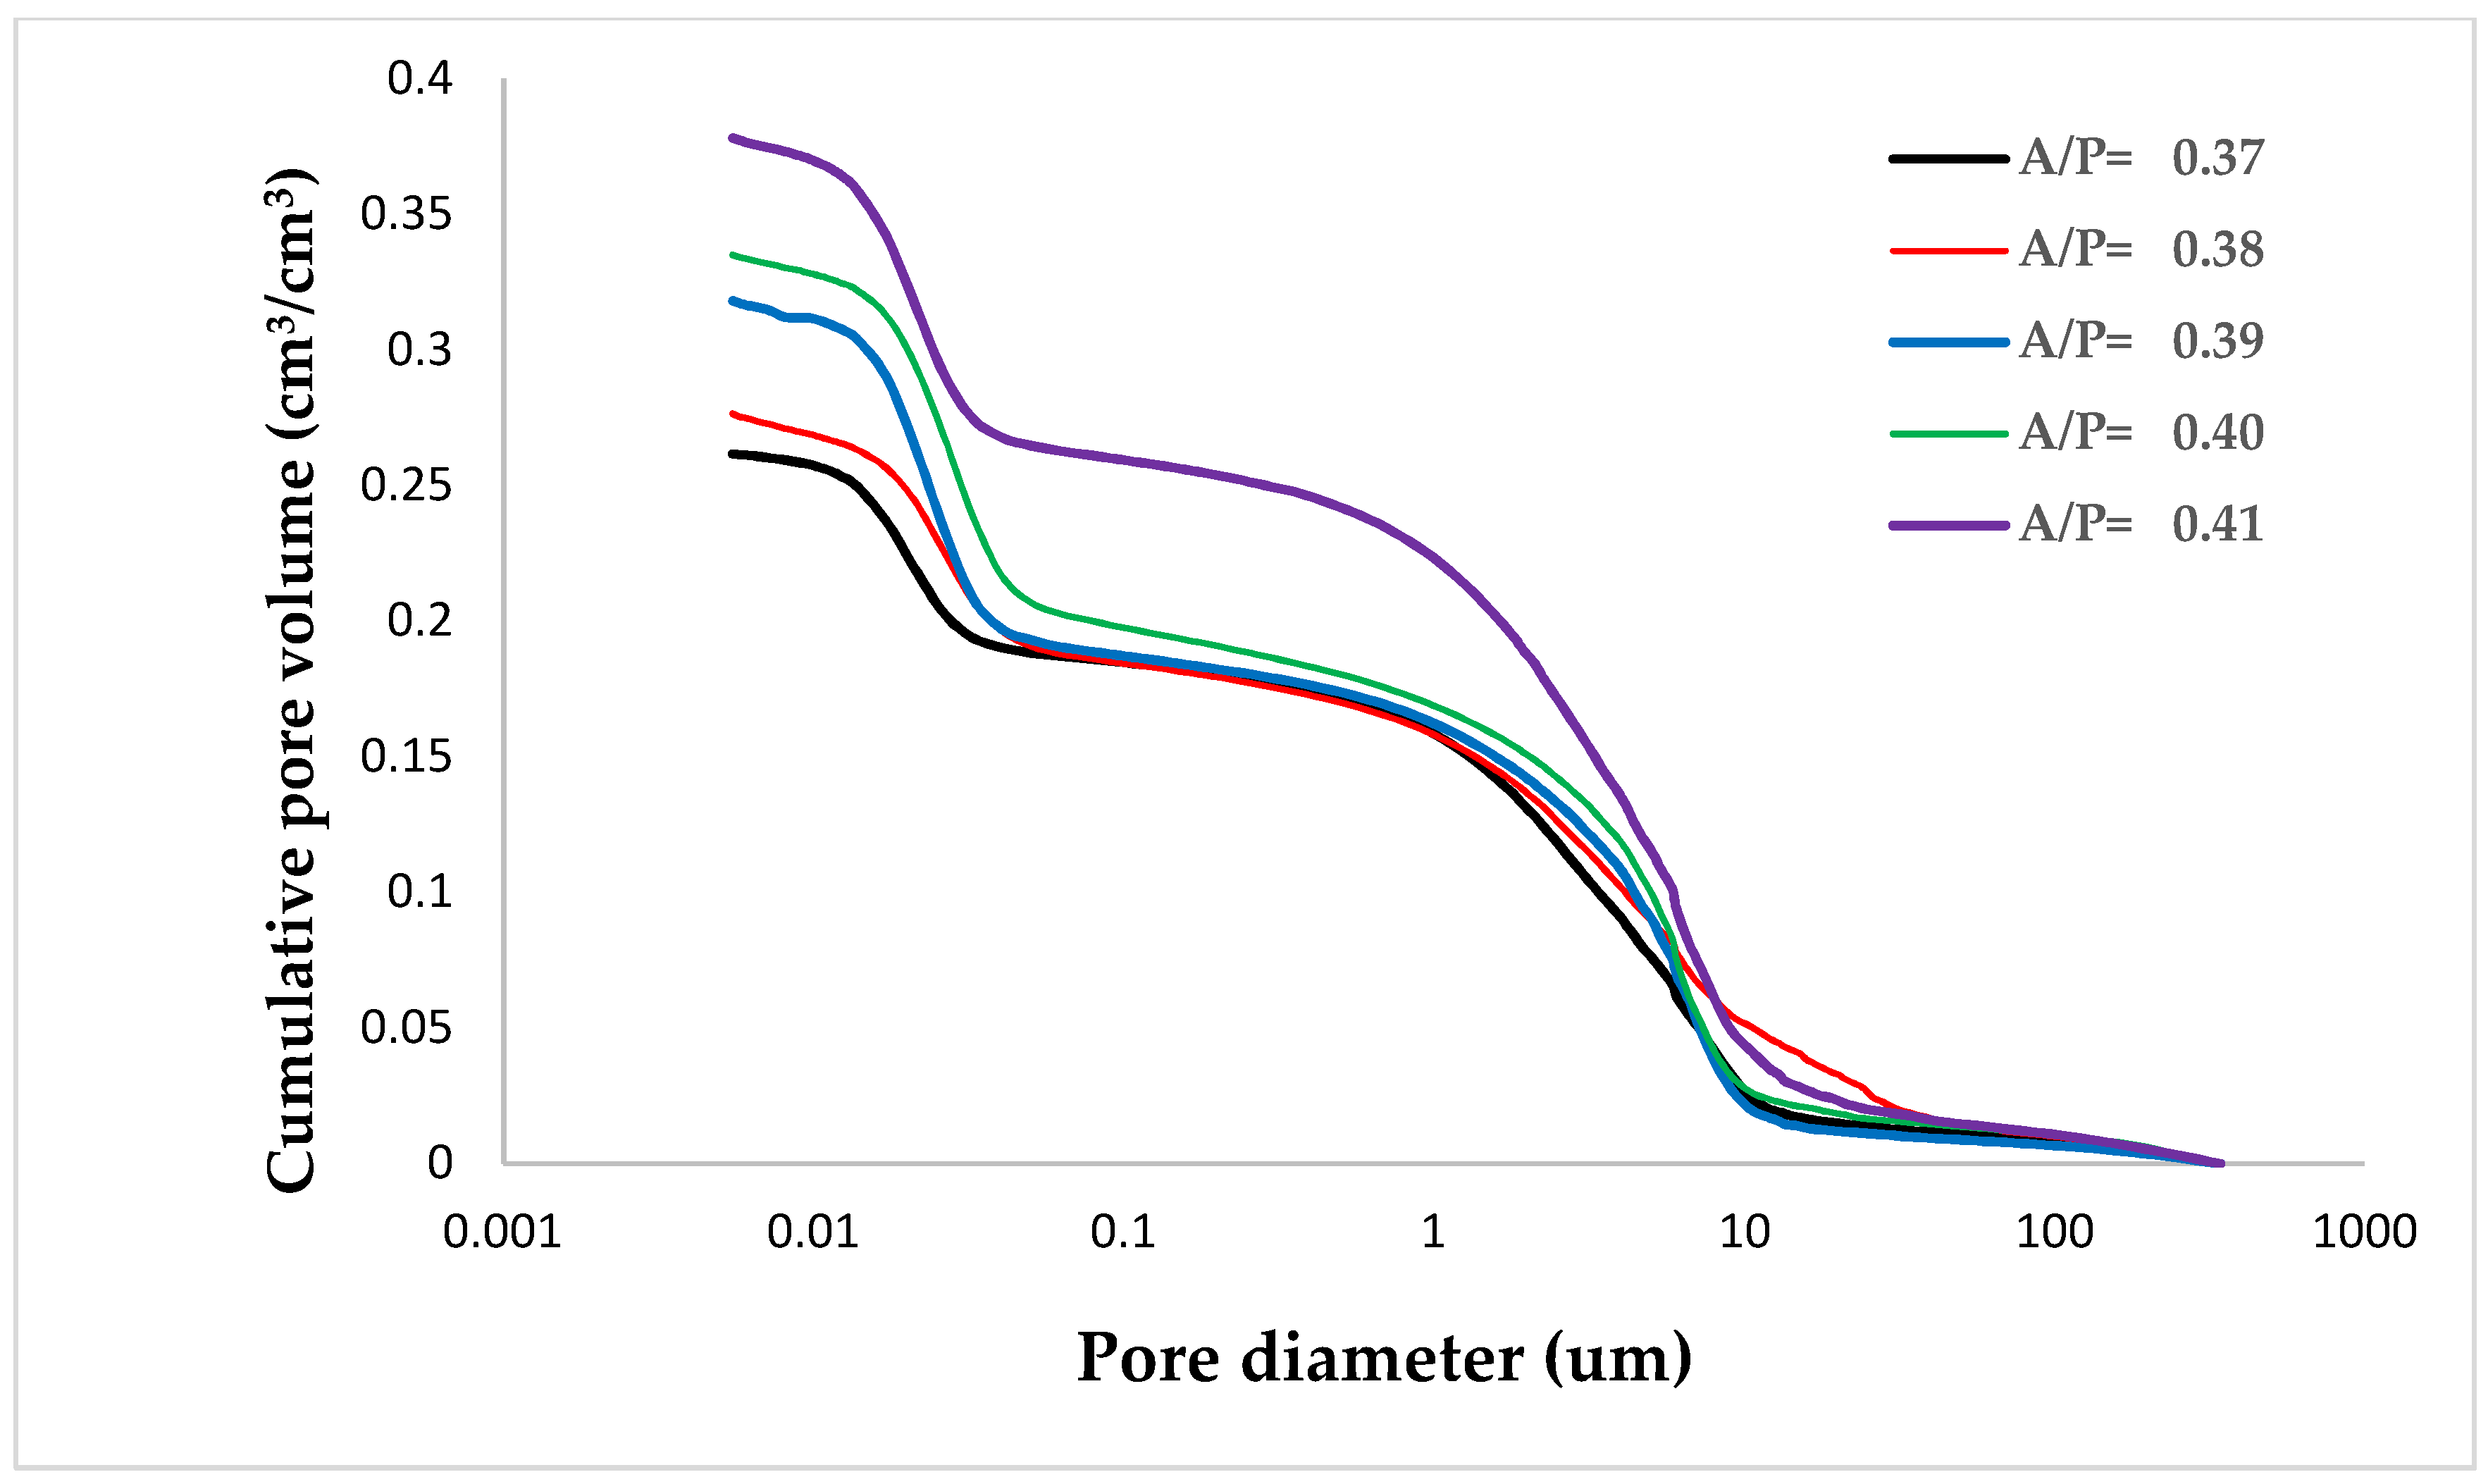
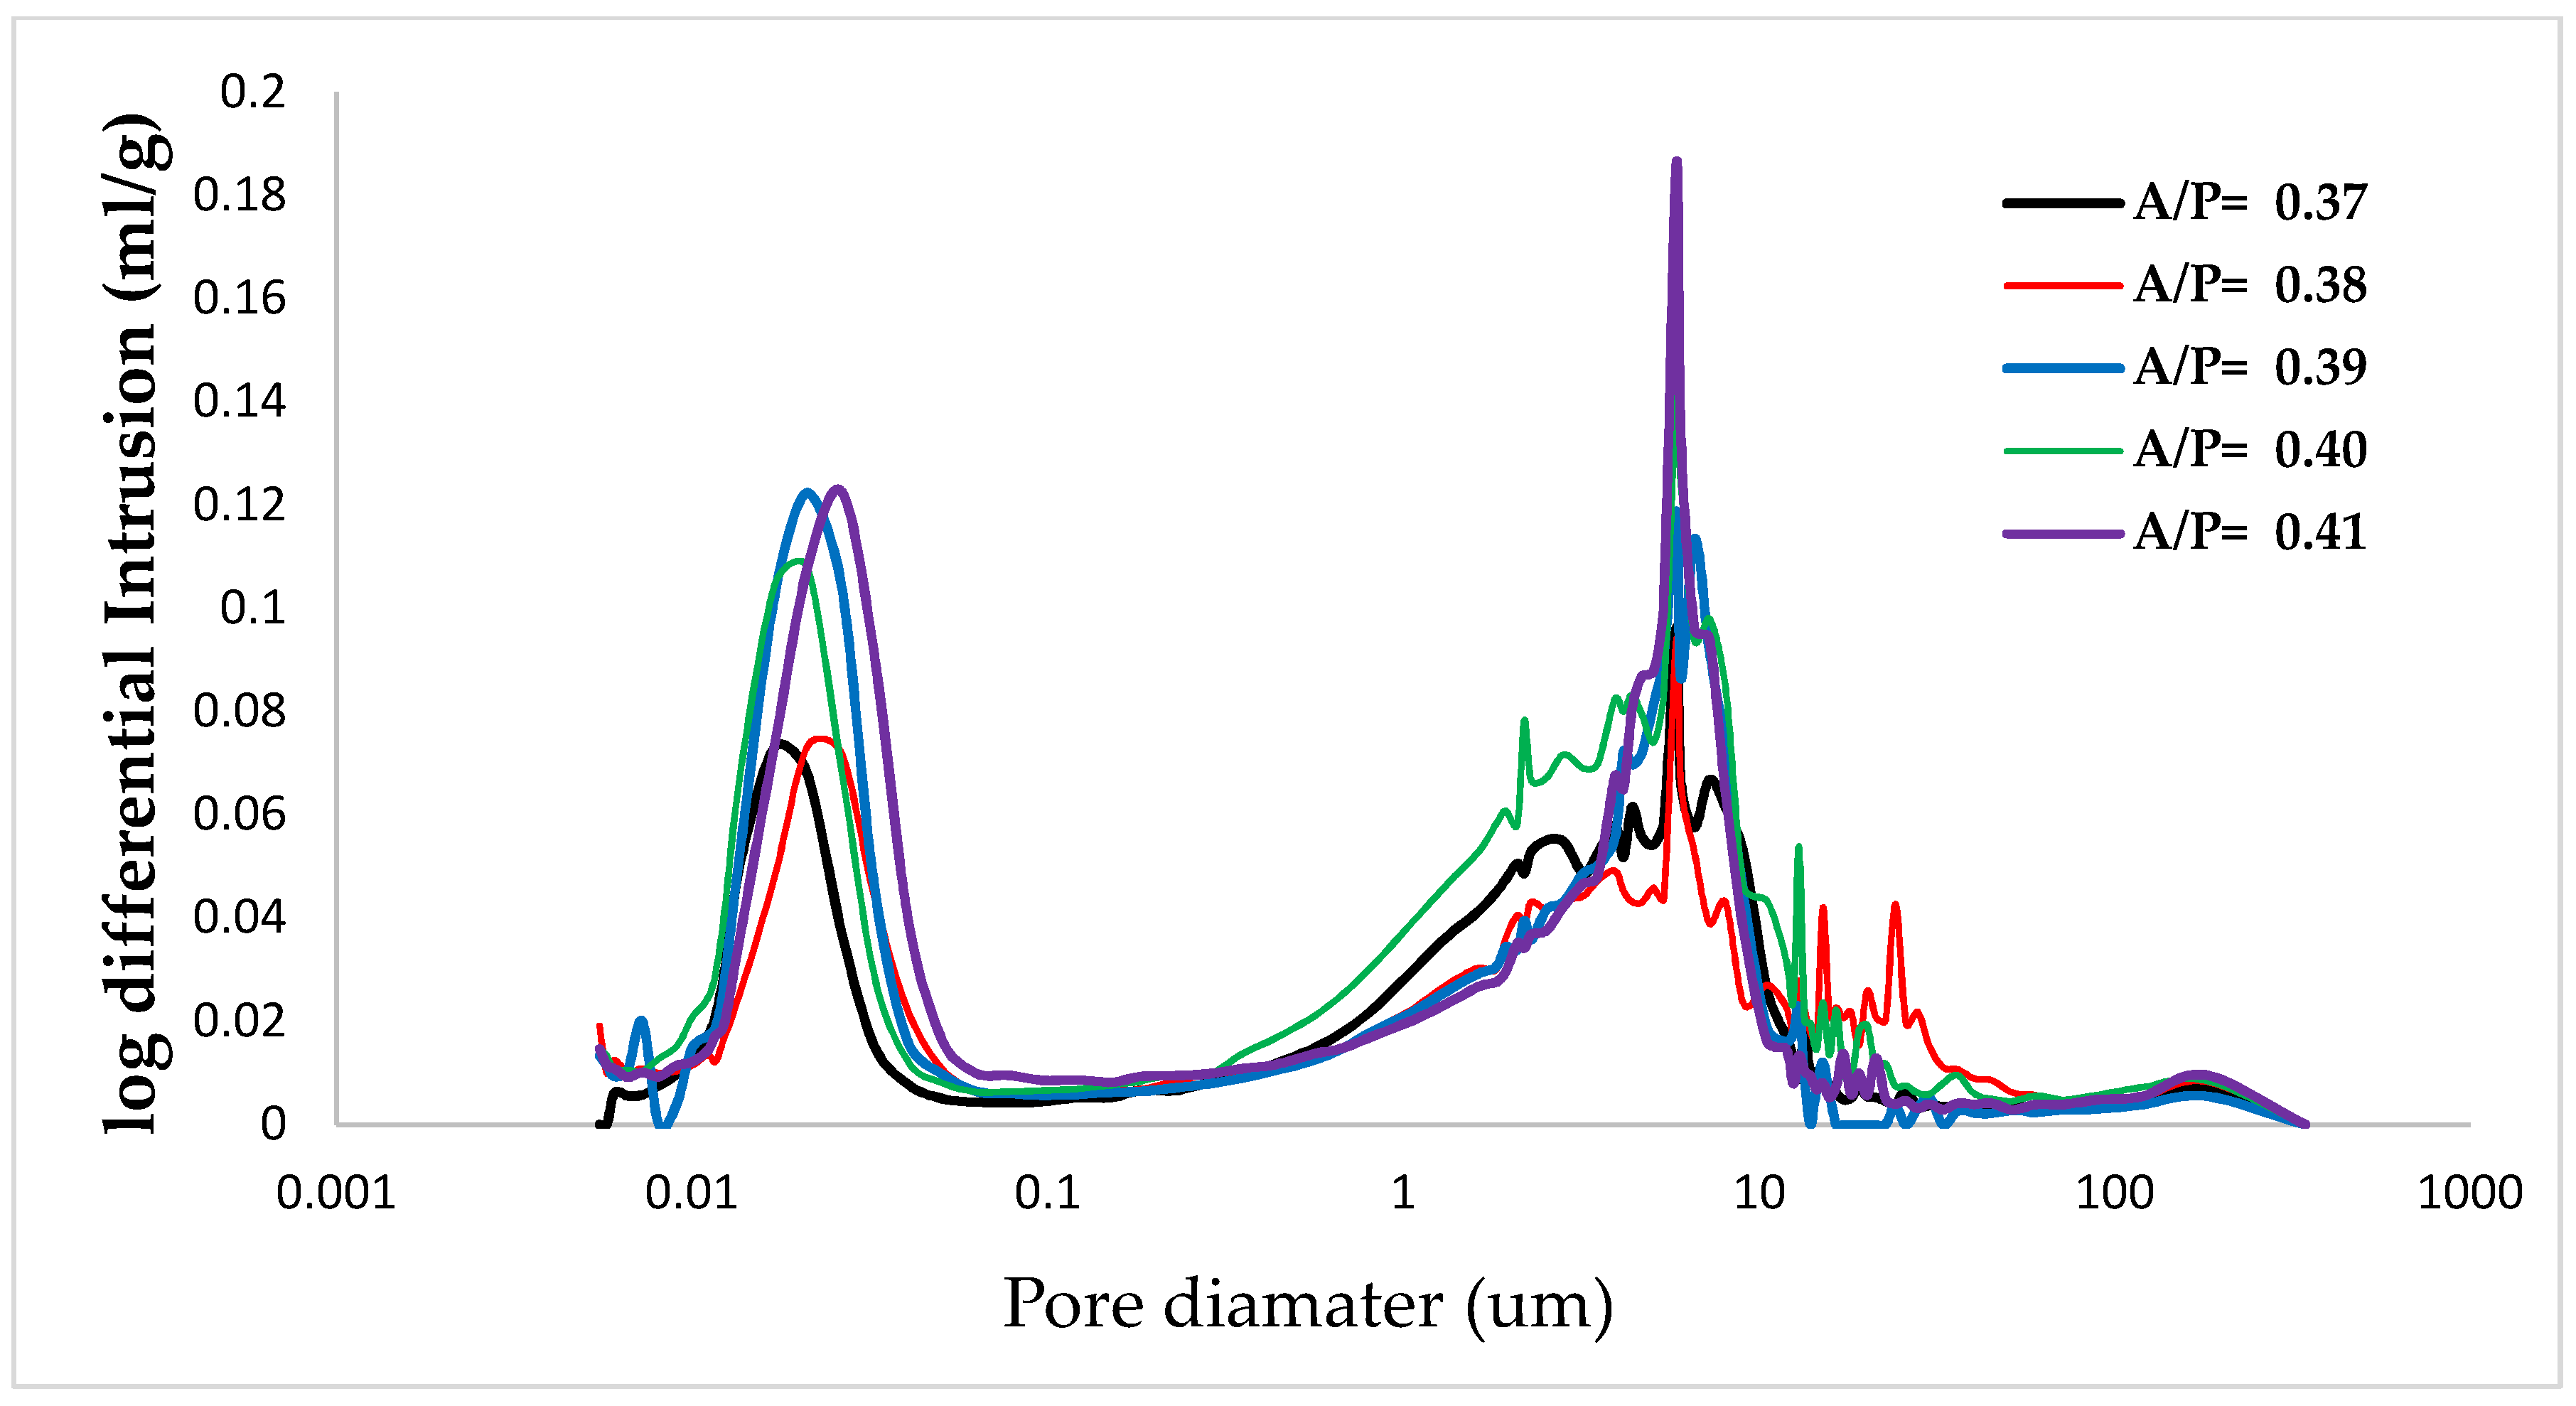
3.4. Mercury Intrusion Porosimetry Test
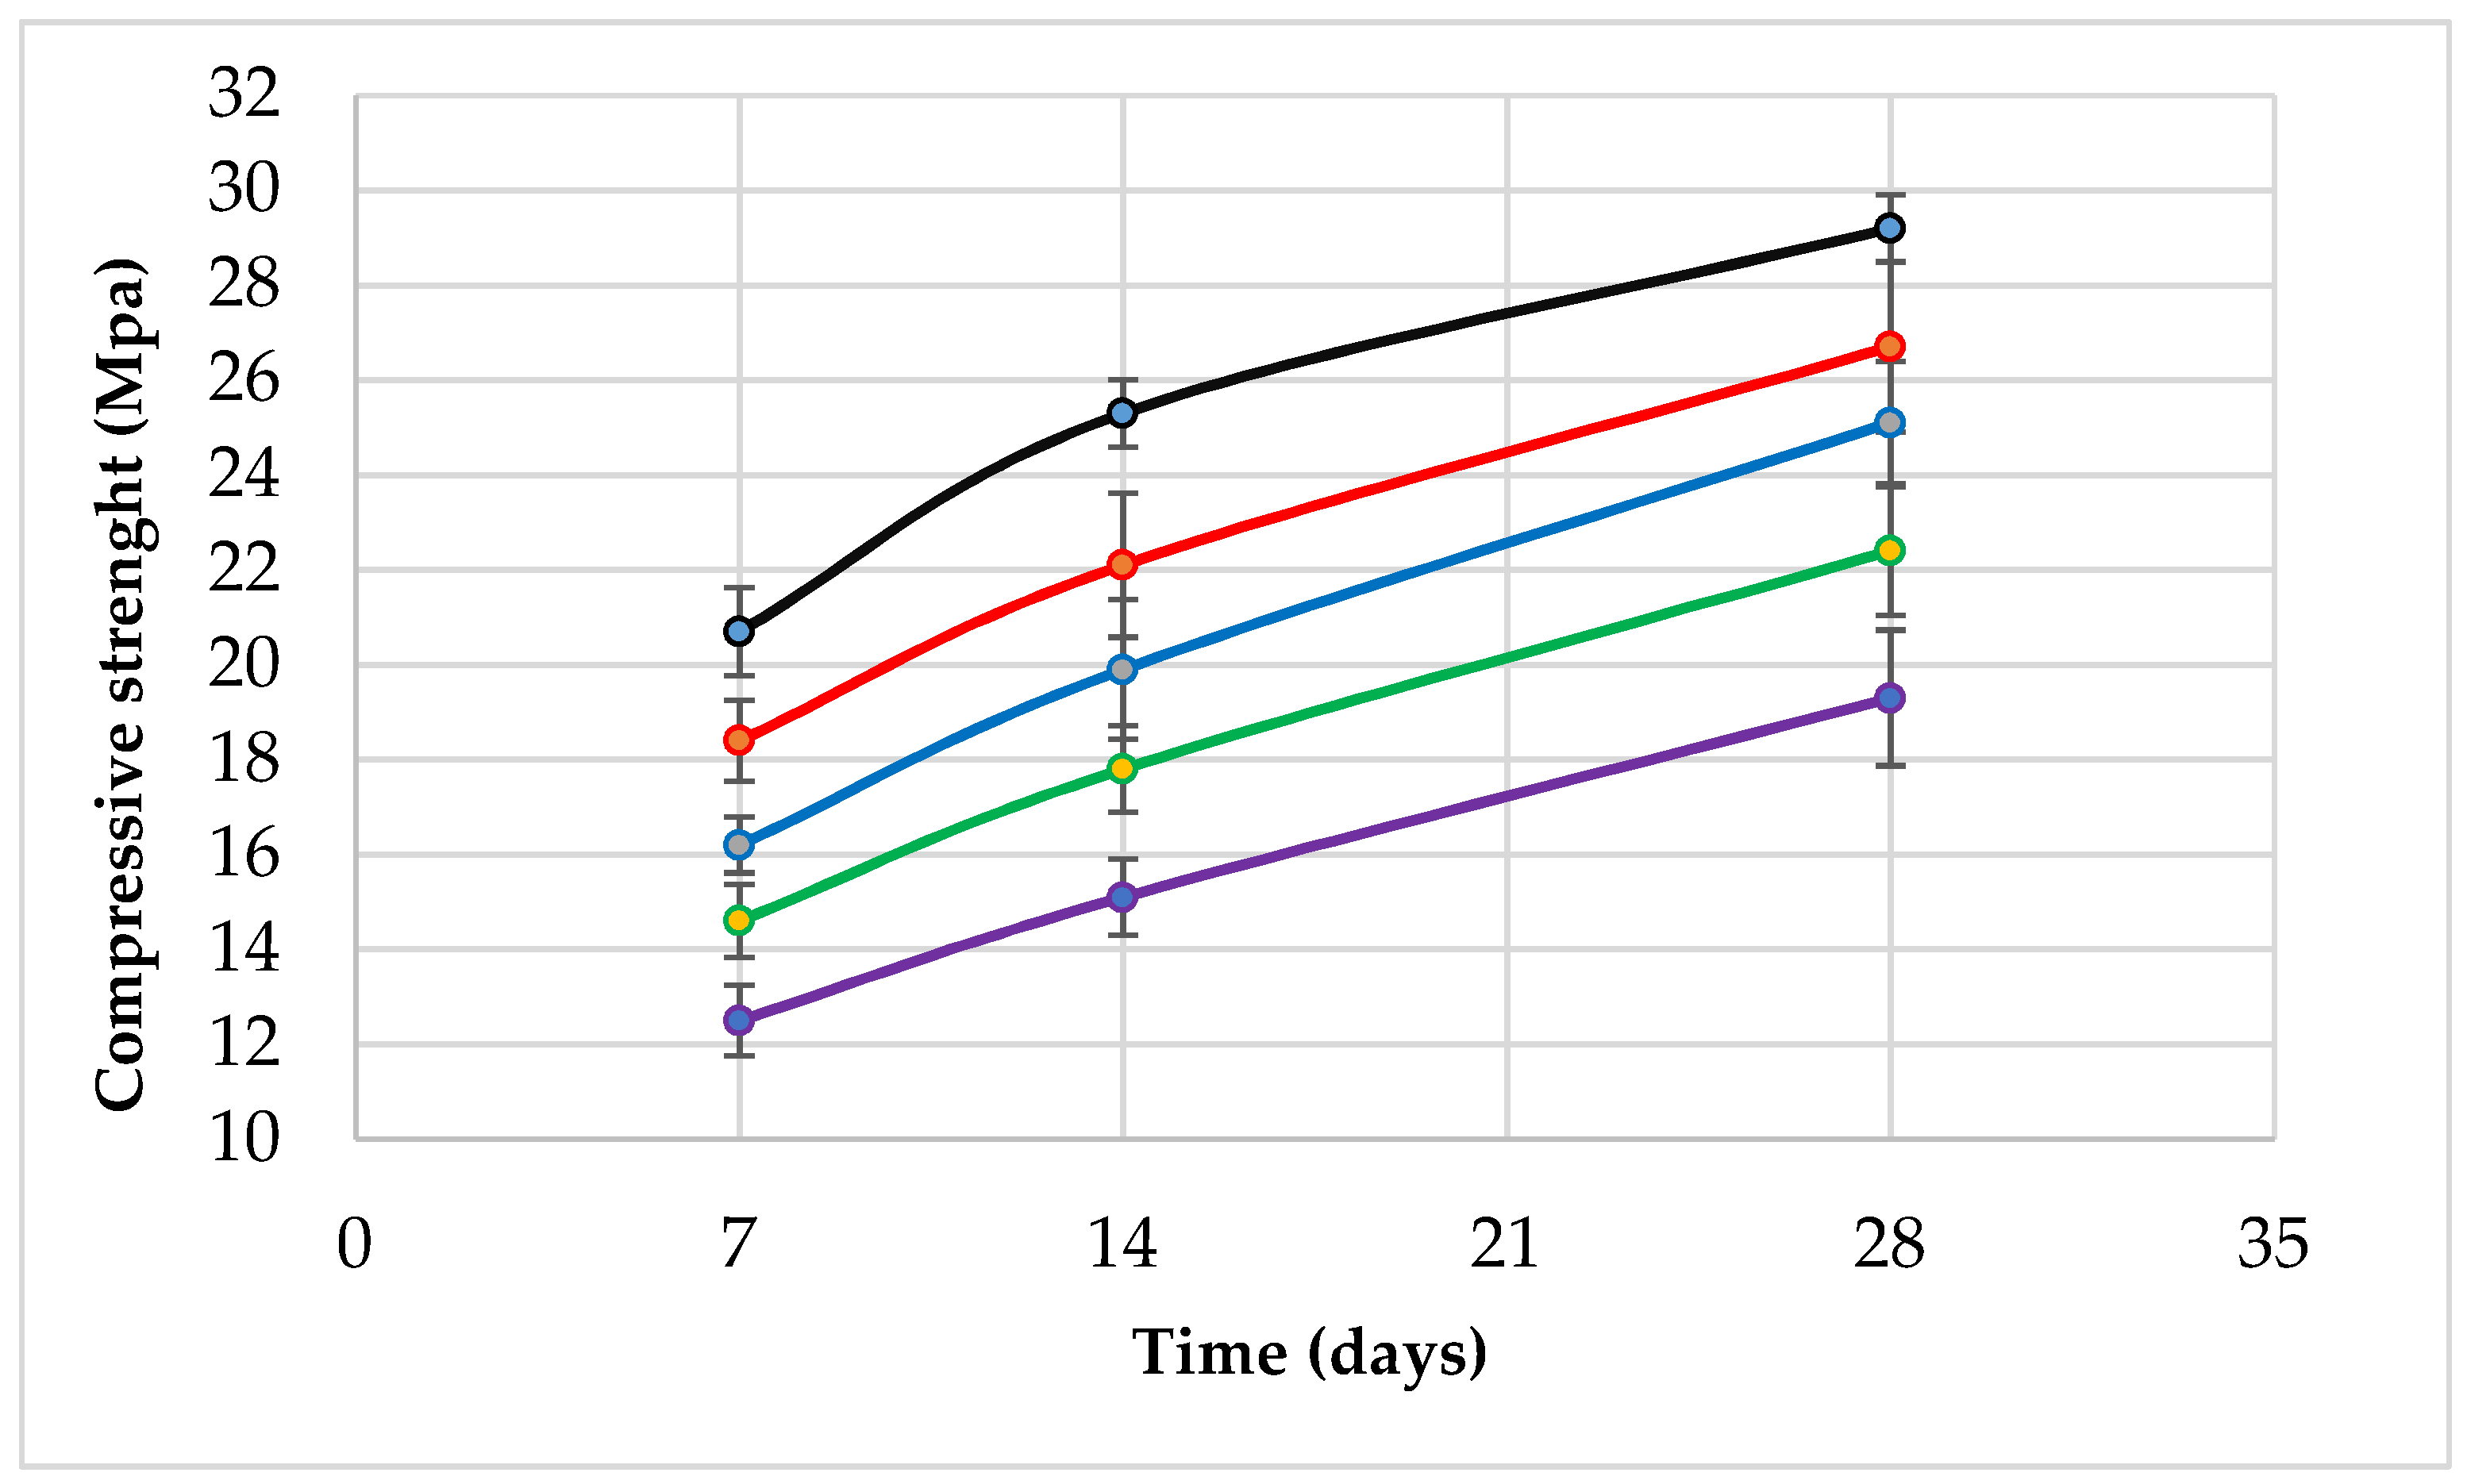
3.5. Compressive Strength
4. Conclusions
- The rheological behaviour of all the AA pastes tested fit the Bingham model, and the rheological parameters (yield stress and plastic viscosity) were affected by the activator/precursor ratios. This rheological behaviour was similar to the OPC behaviour since both fit the Bingham model and are characterized as non-Newtonian fluid. Likewise, the A/P ratio had a similar effect to the water/cement ratio, that is, the decrease in the liquid portion in the mixtures increased the viscosity of the pastes, increased the compressive strength, and decreased the porosity.
- The relative yield stress and relative plastic viscosity increased proportionally with time, which was explained by the starting of C-A-S-H or N-A-S-H gel considering the presence of Ca cation in the waste glass during this alkali-activation, and they decreased inversely with the increase of the A/P ratio, which was explained by the relation between interparticle forces and A/P ratio (the interparticle forces in the viscous paste are higher than in the fluid paste), and also due to the solid content and the quantity of the liquid activator.
- Some empirical models to preview yield stress, plastic viscosity, and spread diameter were developed, considering the variables A/P ratio and time.
- The spread diameter in all the AA pastes affected by the A/P (an increase of spread diameter proportionally with A/P ratio) can be explained by the decrease of the cohesion between the grains in paste caused by the rise of liquid content. Furthermore, the reduction of spread diameter over time was caused by the processing of alkali-activation (formation of C-A-S-H or N-A-S-H gel).
- The flow table test appears to be a good method to evaluate the resistance to flow or the workability of AAM pastes.
- A proportional reduction in the rheological parameters’ values with the increase in the spread diameter can explain a higher correlation between the spread diameter and the plastic viscosity, with R2 near to 0.95, and a good correlation between spread diameter and yield stress, with R2 near to 0.86.
- The paste porosity was high in all the samples (25% with A/P ratio equal to 0.37 and 41% when A/P ratio was equal to 0.41), which was explained by the high A/P ratios used for this study. Indeed, the rheometer did do not work with a ratio lower than 0.37, and also due to the nature of mud waste that does not react completely.
- The compressive strength was modified by A/P ratio: a reduction of about 34% at 28 days for 0.37 to 0.41 A/P ratios was found.
Author Contributions
Funding
Institutional Review Board Statement
Informed Consent Statement
Data Availability Statement
Conflicts of Interest
References
- European Parliament Council Directive 2013/59/Euratom of 5 December 2013 laying down basic safety standards for protection against the dangers arising from exposure to ionising radiation, and repealing Directives 89/618/Euratom, 90/641/Euratom, 96/29/Euratom, 97/43/Euratom a. Off. J. Eur. Commun. 2014, L13, 1–73.
- Bignozzi, M.C.; Manzi, S.; Natali, M.E.; Rickard, W.D.; van Riessen, A. Room temperature alkali activation of fly ash: The effect of Na 2 O/SiO 2 ratio. Constr. Build. Mater. 2014, 69, 262–270. [Google Scholar] [CrossRef]
- Hardjito, D.; Wallah, S.E.; Sumajouw, D.M.J. On the Development of Fly AshBased Geopolymer Concrete. ACI Mater. J. 2004, 101, 467–472. [Google Scholar]
- Blumenthal, K. Generation and treatment of municipal waste. Eurostat Stat. Focus Environ. 2011, 1–12. Available online: http://www.eds-destatis.de/en/downloads/sif/KS-SF-11-031-EN-N (accessed on 13 January 2021).
- Sedira, N.; Castro-Gomes, J.; Kastiukas, G.; Zhou, X.; Vargas, A. A review on mineral waste for chemical-activated binders: Mineralogical and chemical characteristics. Min. Sci. 2017, 24, 29–58. [Google Scholar]
- Pacheco-Torgal, F.; Castro-Gomes, J.; Jalali, S.; Castro-Gomes, J. Investigations of tungsten mine waste geopolymeric binder: Strength and microstructure. Constr. Build. Mater. 2008, 22, 2212–2219. [Google Scholar] [CrossRef] [Green Version]
- Duan, P.; Yan, C.; Zhou, W.; Ren, D. Fresh properties, compressive strength and microstructure of fly ash geopolymer paste blended with iron ore tailing under thermal cycle. Constr. Build. Mater. 2016, 118, 76–88. [Google Scholar] [CrossRef]
- Sun, T.; Chen, J.; Lei, X.; Zhou, C. Detoxification and immobilization of chromite ore processing residue with metakaolin-based geopolymer. J. Environ. Chem. Eng. 2014, 2, 304–309. [Google Scholar] [CrossRef]
- Huang, X.; Huang, T.; Li, S.; Muhammad, F.; Xu, G.; Zhao, Z.; Yu, L.; Yan, Y.; Li, D.; Jiao, B. Immobilization of chromite ore processing residue with alkali-activated blast furnace slag-based geopolymer. Ceram. Int. 2016, 42, 9538–9549. [Google Scholar] [CrossRef]
- Jiao, X.; Zhang, Y.; Chen, T. Thermal stability of a silica-rich vanadium tailing based geopolymer. Constr. Build. Mater. 2013, 38, 43–47. [Google Scholar] [CrossRef]
- Wilson, B.; Pyatt, F.B. Bio-availability of tungsten in the vicinity of an abandoned mine in the English Lake District and some potential health implications. Sci. Total Environ. 2006, 370, 401–408. [Google Scholar] [CrossRef]
- Kraus, T.; Schramel, P.; Schaller, K.H.; Zöbelein, P.; Weber, A.; Angerer, J. Exposure assessment in the hard metal manufacturing industry with special regard to tungsten and its compounds. Occup. Environ. Med. 2001, 58, 631–634. [Google Scholar] [CrossRef] [PubMed] [Green Version]
- Castro-Gomes, J.; Silva, A.P.; Cano, R.P.; Suarez, J.D.; Albuquerque, A. Potential for reuse of tungsten mining waste-rock in technical-artistic value added products. J. Clean. Prod. 2012, 25, 34–41. [Google Scholar] [CrossRef]
- Pacheco-Torgal, F.; Gomes, J.P.C.; Jalali, S. Tungsten mine waste geopolymeric binder: Preliminary hydration products investigations. Constr. Build. Mater. 2009, 23, 200–209. [Google Scholar] [CrossRef] [Green Version]
- Kastiukas, G.; Zhou, X.; Castro-Gomes, J. Development and optimisation of phase change material-impregnated lightweight aggregates for geopolymer composites made from aluminosilicate rich mud and milled glass powder. Constr. Build. Mater. 2016, 110, 201–210. [Google Scholar] [CrossRef]
- Yang, T.; Zhu, H.; Zhang, Z.; Gao, X.; Zhang, C.; Wu, Q. Effect of fly ash microsphere on the rheology and microstructure of alkali-activated fly ash/slag pastes. Cem. Concr. Res. 2018, 109, 198–207. [Google Scholar] [CrossRef]
- Alonso, M.; Gismera, S.; Blanco, M.; Lanzón, M.; Puertas, F. Alkali-activated mortars: Workability and rheological behaviour. Constr. Build. Mater. 2017, 145, 576–587. [Google Scholar] [CrossRef]
- Puertas, F.; Varga, C.; Alonso, M. Rheology of alkali-activated slag pastes. Effect of the nature and concentration of the activating solution. Cem. Concr. Compos. 2014, 53, 279–288. [Google Scholar] [CrossRef]
- Puertas, F.; Palacios, M. Estabilidad de aditivos superplastificantes y reductores de la retracción en medios fuertemente básicos. Mater. Constr. 2004, 54, 65–86. [Google Scholar] [CrossRef] [Green Version]
- Banfill, P.F.G. The Rheology of Fresh Concrete. 2003. Available online: https://books.google.pt/books?id=fa1RAAAAMAAJ (accessed on 13 January 2021).
- Banfill, P. Rheological methods for assessing the flow properties of mortar and related materials. Constr. Build. Mater. 1994, 8, 43–50. [Google Scholar] [CrossRef]
- Palomo, A.; Banfill, P.F.G.; Fernández-Jiménez, A.; Swift, D.S. The influence of wastes materials on the rheol-ogy of rendering mortars. Appl. Rheol. 2013, 23, 1. [Google Scholar] [CrossRef]
- Palomo, A.; Banfill, P.F.G.; Fernández-Jiménez, A.; Swift, D.S. Properties of alkali-activated fly ashes determined from rheological measurements. Adv. Cem. Res. 2005, 17, 143–151. [Google Scholar] [CrossRef]
- Torres-Carrasco, M.; Rodríguez-Puertas, C.; Alonso, M.D.M.; Puertas, F. Alkali activated slag cements using waste glass as alternative activators. Rheological behaviour. Boletín de la Sociedad Española de Cerámica y Vidrio 2015, 54, 45–57. [Google Scholar] [CrossRef] [Green Version]
- Palacios, M.; Banfill, P.F.; Puertas, F. Rheology and Setting of Alkali-Activated Slag Pastes and Mortars: Effect of Organ Admixture. ACI Mater. J. 2008, 140–148. Available online: https://www.researchgate.net/publication/283026701_Rheology_and_setting_of_alkali-activated_slag_pastes_and_mortars_Effect_of_organ_admixture (accessed on 19 October 2020).
- Sitarz, M.; Urban, M.; Hager, I. Rheology and Mechanical Properties of Fly Ash-Based Geopolymer Mortars with Ground Granulated Blast Furnace Slag Addition. Energies 2020, 13, 2639. [Google Scholar] [CrossRef]
- Fu, C.; Ye, H.; Zhu, K.; Fang, D.; Zhou, J. Alkali cation effects on chloride binding of alkali-activated fly ash and metakaolin geopolymers. Cem. Concr. Compos. 2020, 114, 103721. [Google Scholar] [CrossRef]
- Ye, H.; Huang, L.; Chen, Z. Influence of activator composition on the chloride binding capacity of alkali-activated slag. Cem. Concr. Compos. 2019, 104, 103368. [Google Scholar] [CrossRef]
- Beghoura, I.; Castro-Gomes, J. Design of alkali-activated aluminium powder foamed materials for precursors with different particle sizes. Constr. Build. Mater. 2019, 224, 682–690. [Google Scholar] [CrossRef]
- Palacios, M.; Houst, Y.; Bowen, P.; Puertas, F. Adsorption of superplasticizer admixtures on alkali-activated slag pastes. Cem. Concr. Res. 2009, 39, 670–677. [Google Scholar] [CrossRef] [Green Version]
- CEN—EN 1015-3—Methods of Test for Mortar for Masonry—Part 3: Determination of Consistence of Fresh Mortar (by Flow Table) Engineering 360. 1999. Available online: https://standards.globalspec.com/std/733841/EN1015-3 (accessed on 16 October 2020).
- Kastiukas, G.; Zhou, X.; Castro-Gomes, J. Preparation Conditions for the Synthesis of Alkali-Activated Binders Using Tungsten Mining Waste. J. Mater. Civ. Eng. 2017, 29, 04017181. [Google Scholar] [CrossRef]
- Sedira, N.; Castro-Gomes, J. Microstructure Features of Ternary Alkali-activated Binder Based on Tungsten Mining Waste, Slag and Metakaolin. KnE Eng. 2020, 2020, 195–206. [Google Scholar] [CrossRef]
- Vance, K.; Dakhane, A.; Sant, G.; Neithalath, N. Observations on the rheological response of alkali activated fly ash suspensions: The role of activator type and concentration. Rheol. Acta 2014, 53, 843–855. [Google Scholar] [CrossRef]
- Mehdizadeh, H.; Kani, E.N. Rheology and apparent activation energy of alkali activated phosphorous slag. Constr. Build. Mater. 2018, 171, 197–204. [Google Scholar] [CrossRef]
- Krieger, I.M.; Dougherty, T.J. A Mechanism for Non-Newtonian Flow in Suspensions of Rigid Spheres. Trans. Soc. Rheol. 1959, 3, 137–152. [Google Scholar] [CrossRef]
- Sedira, N.; Castro-Gomes, J.; Magrinho, M. Red clay brick and tungsten mining waste-based alkali-activated binder: Microstructural and mechanical properties. Constr. Build. Mater. 2018, 190, 1034–1048. [Google Scholar] [CrossRef]


| Materials | Chemical Composition (wt%) | |||||||
|---|---|---|---|---|---|---|---|---|
| Al2O3 | SiO2 | Na2O | SO3 | K2O | CaO | Fe2O3 | MgO | |
| TMWM | 17.1 | 46.67 | 0.85 | 7.9 | 4.9 | 0.69 | 15.47 | 4.83 |
| GW | 2.80 | 68.13 | 12.52 | 0.23 | 0.86 | 10.52 | 2.90 | 2.04 |
| MK | 42.99 | 52.28 | 0.32 | - | 0.94 | - | 1.49 | 0.47 |
| Materials | Chemical Composition (%) | Density | |||
|---|---|---|---|---|---|
| Na2O | SiO2 | Al2O3 | H2O | g/cm3 | |
| Sodium hydroxide | 23.14 | 0.00 | 0.00 | 76.86 | 1.0192 |
| Sodium silicate | 8.6 | 27.8 | 0.4 | 63.2 | 1.525 |
| AA Paste | A/P 0.37 | A/P 0.38 | A/P 0.39 | A/P 0.40 | A/P 0.41 |
|---|---|---|---|---|---|
| Total porosity cm3/cm3 | 0.261 | 0.275 | 0.315 | 0.332 | 0.337 |
| A/P Ratios | |||||
|---|---|---|---|---|---|
| Time (days) | 0.37 | 0.38 | 0.39 | 0.40 | 0.41 |
| 7 | 0.93 | 0.85 | 0.59 | 0.77 | 0.75 |
| 14 | 0.71 | 1.52 | 1.47 | 0.91 | 0.80 |
| 28 | 0.71 | 1.80 | 1.29 | 1.36 | 1.43 |
Publisher’s Note: MDPI stays neutral with regard to jurisdictional claims in published maps and institutional affiliations. |
© 2021 by the authors. Licensee MDPI, Basel, Switzerland. This article is an open access article distributed under the terms and conditions of the Creative Commons Attribution (CC BY) license (http://creativecommons.org/licenses/by/4.0/).
Share and Cite
Benhamouda, A.; Castro-Gomes, J.; Pereira-de-Oliveira, L. Rheology, Mechanical Properties and Porosity of Ternary Alkali-Activated Binders Based on Mining Mud Waste with Waste Glass and Metakaolin. CivilEng 2021, 2, 236-253. https://0-doi-org.brum.beds.ac.uk/10.3390/civileng2010013
Benhamouda A, Castro-Gomes J, Pereira-de-Oliveira L. Rheology, Mechanical Properties and Porosity of Ternary Alkali-Activated Binders Based on Mining Mud Waste with Waste Glass and Metakaolin. CivilEng. 2021; 2(1):236-253. https://0-doi-org.brum.beds.ac.uk/10.3390/civileng2010013
Chicago/Turabian StyleBenhamouda, Abdelhakim, João Castro-Gomes, and Luiz Pereira-de-Oliveira. 2021. "Rheology, Mechanical Properties and Porosity of Ternary Alkali-Activated Binders Based on Mining Mud Waste with Waste Glass and Metakaolin" CivilEng 2, no. 1: 236-253. https://0-doi-org.brum.beds.ac.uk/10.3390/civileng2010013