
Numerical Modelling and Design of Aluminium Alloy Angles under Uniform Compression


School of Civil Engineering and Built Environment, Liverpool John Moores University, Liverpool L3 3AF, UK
*
Authors to whom correspondence should be addressed.
CivilEng 2021, 2(3), 632-651; https://0-doi-org.brum.beds.ac.uk/10.3390/civileng2030035
Submission received: 24 June 2021
/
Revised: 28 July 2021
/
Accepted: 29 July 2021
/
Published: 6 August 2021
(This article belongs to the Special Issue Early Career Stars in Civil Engineering)
Abstract
:Research studies have been reported on aluminium alloy tubular and doubly symmetric open cross-sections, whilst studies on angle cross-sections remain limited. This paper presents a comprehensive numerical study on the response of aluminium alloy angle stub columns. Finite element models are developed following a series of modelling assumptions. Geometrically and materially nonlinear analyses with imperfections included are executed, and the obtained results are validated against experimental data available in the literature. Subsequently, a parametric study is carried out to investigate the local buckling behaviour of aluminium alloy angles. For this purpose, a broad range of cross-sectional aspect ratios, slenderness and two types of structural aluminium alloys are considered. Their effect on the cross-sectional behaviour and strength is discussed. Moreover, the numerically obtained ultimate strengths together with literature test data are utilised to assess the applicability of the European design standards, the American Aluminium Design Manual and the Continuous Strength Method to aluminium alloy angles. The suitability of the Direct Strength Method is also evaluated and a modified method is proposed to improve the accuracy of the strength predictions.
1. Introduction
Aluminium alloys are commonly employed in transport, packaging, consumer goods and in the field of electrical engineering. Over the last two decades, aluminium alloys have gained increasing attention among structural engineers, architects and constructors owing to their profound features. Thus, 25% of the global aluminium production is used in modern construction [1]. Particularly, 6000 series aluminium alloys, known as structural alloys, are characterised by low density and high strength-to-weight ratio, enabling for lightweight and economically efficient structural elements. Therefore, they could be a suitable material choice for structural applications, such as high-rise buildings and long-span structures, where lightness and strength are primary design requirements.
The wide employment of aluminium alloys in the construction sector prompted researchers to investigate the structural response of aluminium alloy members by experimental and numerical means. A thorough literature review of the relevant studies is available in [2]. Past research works investigating the stability of aluminium alloy cross-sections, have mainly focused on tubular and doubly symmetric open sections. However, aluminium alloy angles can be easily extruded, thanks to their simple geometric shape and are often used as chords in transmission towers and diaphragm members in bridge girder systems. Among the few studies on aluminium alloy angles, Mazzolani et al. [3] investigated the local buckling behaviour of aluminium alloy angles and proposed a new cross-section classification criterion accounting for the influence of the material properties and the interaction between constituent plate elements. Furthermore, Wang et al. [4] tested a series of angle columns under uniform compression and suggested modified design criteria achieving increased accuracy of the strength predictions up to 22%. As can be seen, this type of cross-section is far less explored and it is deemed necessary to evaluate the accuracy of current design rules employed in practice [5,6], which have been reported to be overly conservative for aluminium alloys [2].
Aiming to generate performance data and thus a more comprehensive understanding of the cross-sectional behaviour of aluminium alloy angles, a thorough numerical study was carried out and is presented herein. Particularly, Section 2 outlines the modelling assumptions adopted for the developed finite element (FE) models. The models accounting for material and geometric nonlinearities were developed in ABAQUS [7] and validated against reported experimental results [3]. Subsequently, a series of parametric analyses was executed to extend the pool of performance data considering a wide range of cross-sectional aspect ratios and slenderness as well as two aluminium alloys, i.e., 6063-T5 (normal strength) and 6082-T6 (high strength). In Section 3, the results were analysed, whilst in Section 4, the numerically obtained compression strengths were utilised to assess the applicability and accuracy of the European [5] and American [6] design codes as well as the Continuous Strength Method [8] and the Direct Strength Method [9]. Modified design formulae for the Direct Strength Method [9] were, also, proposed improving the design accuracy by 12%. A series of reliability analyses was conducted to determine the safety level of the existing and proposed design criteria. Finally, Section 5 summarises the conclusions of the present study.
2. Numerical Modelling
The commercial software package ABAQUS [7] was employed in this study. This section presents the principal features of the developed FE models. The adopted modelling methodology and assumptions are described. Upon successful verification against test results [3], the developed FE models were utilised to conduct an extensive parametric study. A total of 42 numerical analyses, over a range of cross-sectional aspect ratios, cross-sectional slenderness and aluminium alloy types, were performed.
2.1. Angle Section Stub Columns
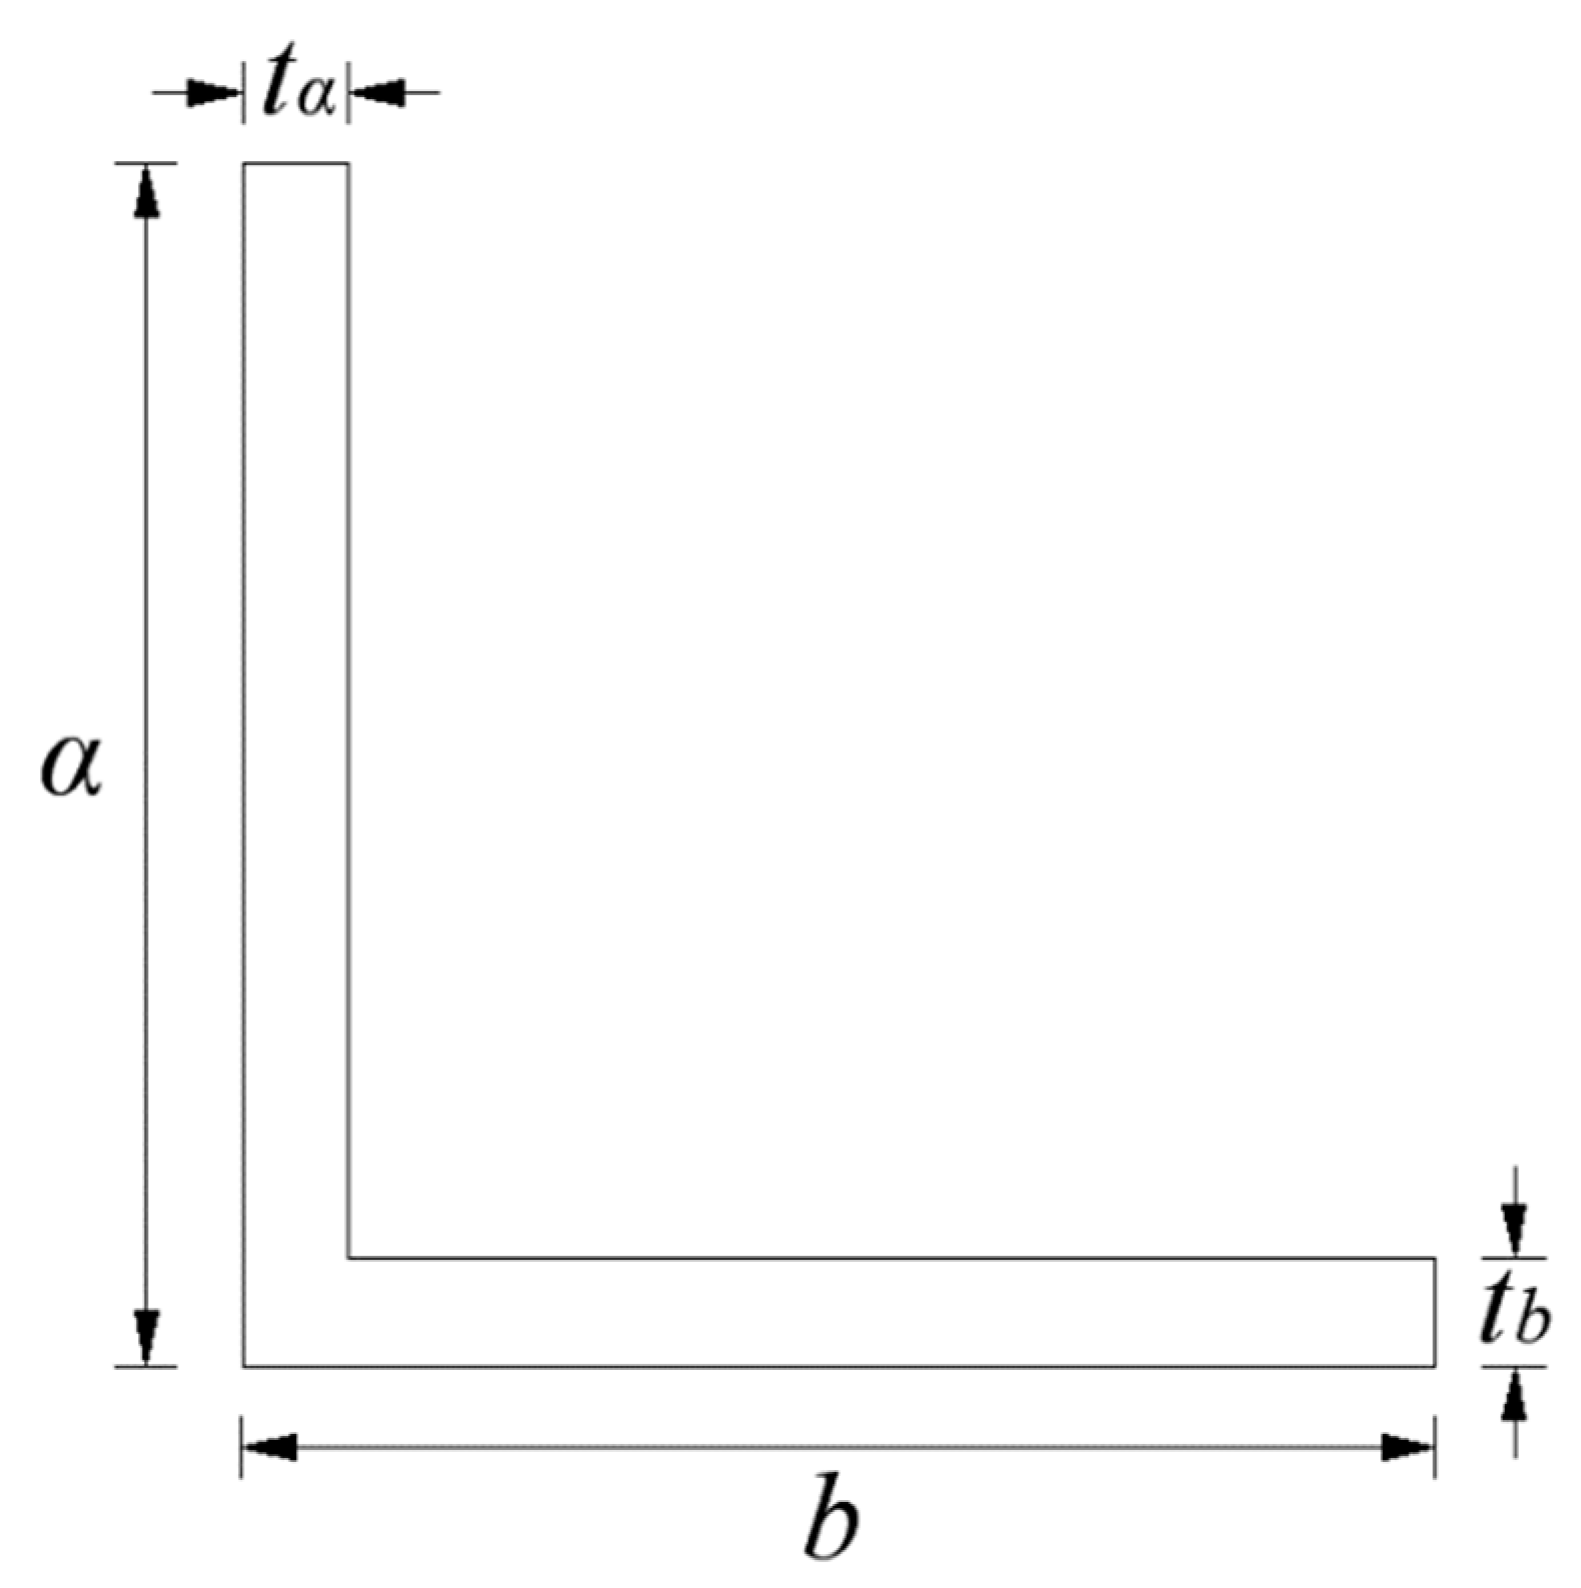
Finite element models of fix-ended stub columns with the cross-section shown in Figure 1 were developed; α is the outer web depth, b is the outer flange width and tα and tb are the corresponding thicknesses. The models’ height H was set equal to three times the maximum cross-sectional dimension enabling for local buckling failure without any coupled instability phenomena, i.e., combination of flexural or flexural-torsional and local buckling modes [10]. Columns of low member slenderness (short columns) present pure local buckling failure modes, while members of higher member slenderness (long columns) present failure modes dominated by flexural or interactive flexural-torsional buckling. At intermediate member slenderness values there is a transition in the failure mode from pure local buckling to one dominated flexural or flexural/torsional buckling. Focus of this study was the investigation of pure local buckling. According to the “Guide to stability design criteria for metal structures” [10] and in line with past studies [11,12,13,14], a stub column with length three times the maximum cross-sectional dimension can be considered sufficiently long to allow for the development of the lowest buckling wavelength, leading to pure local buckling failure.
2.2. General Modelling Assumptions
Using shell elements for modelling thin-walled members (i.e., members with thickness significantly smaller than the other two cross-sectional dimensions and developed stresses across the thickness that are negligible) is a commonly applied technique for metallic structural members [15,16,17,18,19,20]. Therefore, in the present numerical study, the four-node shell elements with reduced integration rule (S4R) were chosen to discretise the FE models. This type of shell element has three translational and three rotational degrees of freedom. It is a general-purpose conventional shell element, as its mathematical formulation allows transverse shear deformation and changes in the shell thickness as a function of the membrane strain (using thick shell or Kirchoff theory depending on the shell thickness). Furthermore, it is suitable for materially and geometrically nonlinear problems, as it accounts for arbitrarily large rotations and finite membrane strains. Note that the S4R shell element has been successfully employed in similar numerical studies [21,22,23,24]. The models were based on cross-sectional centreline dimensions.
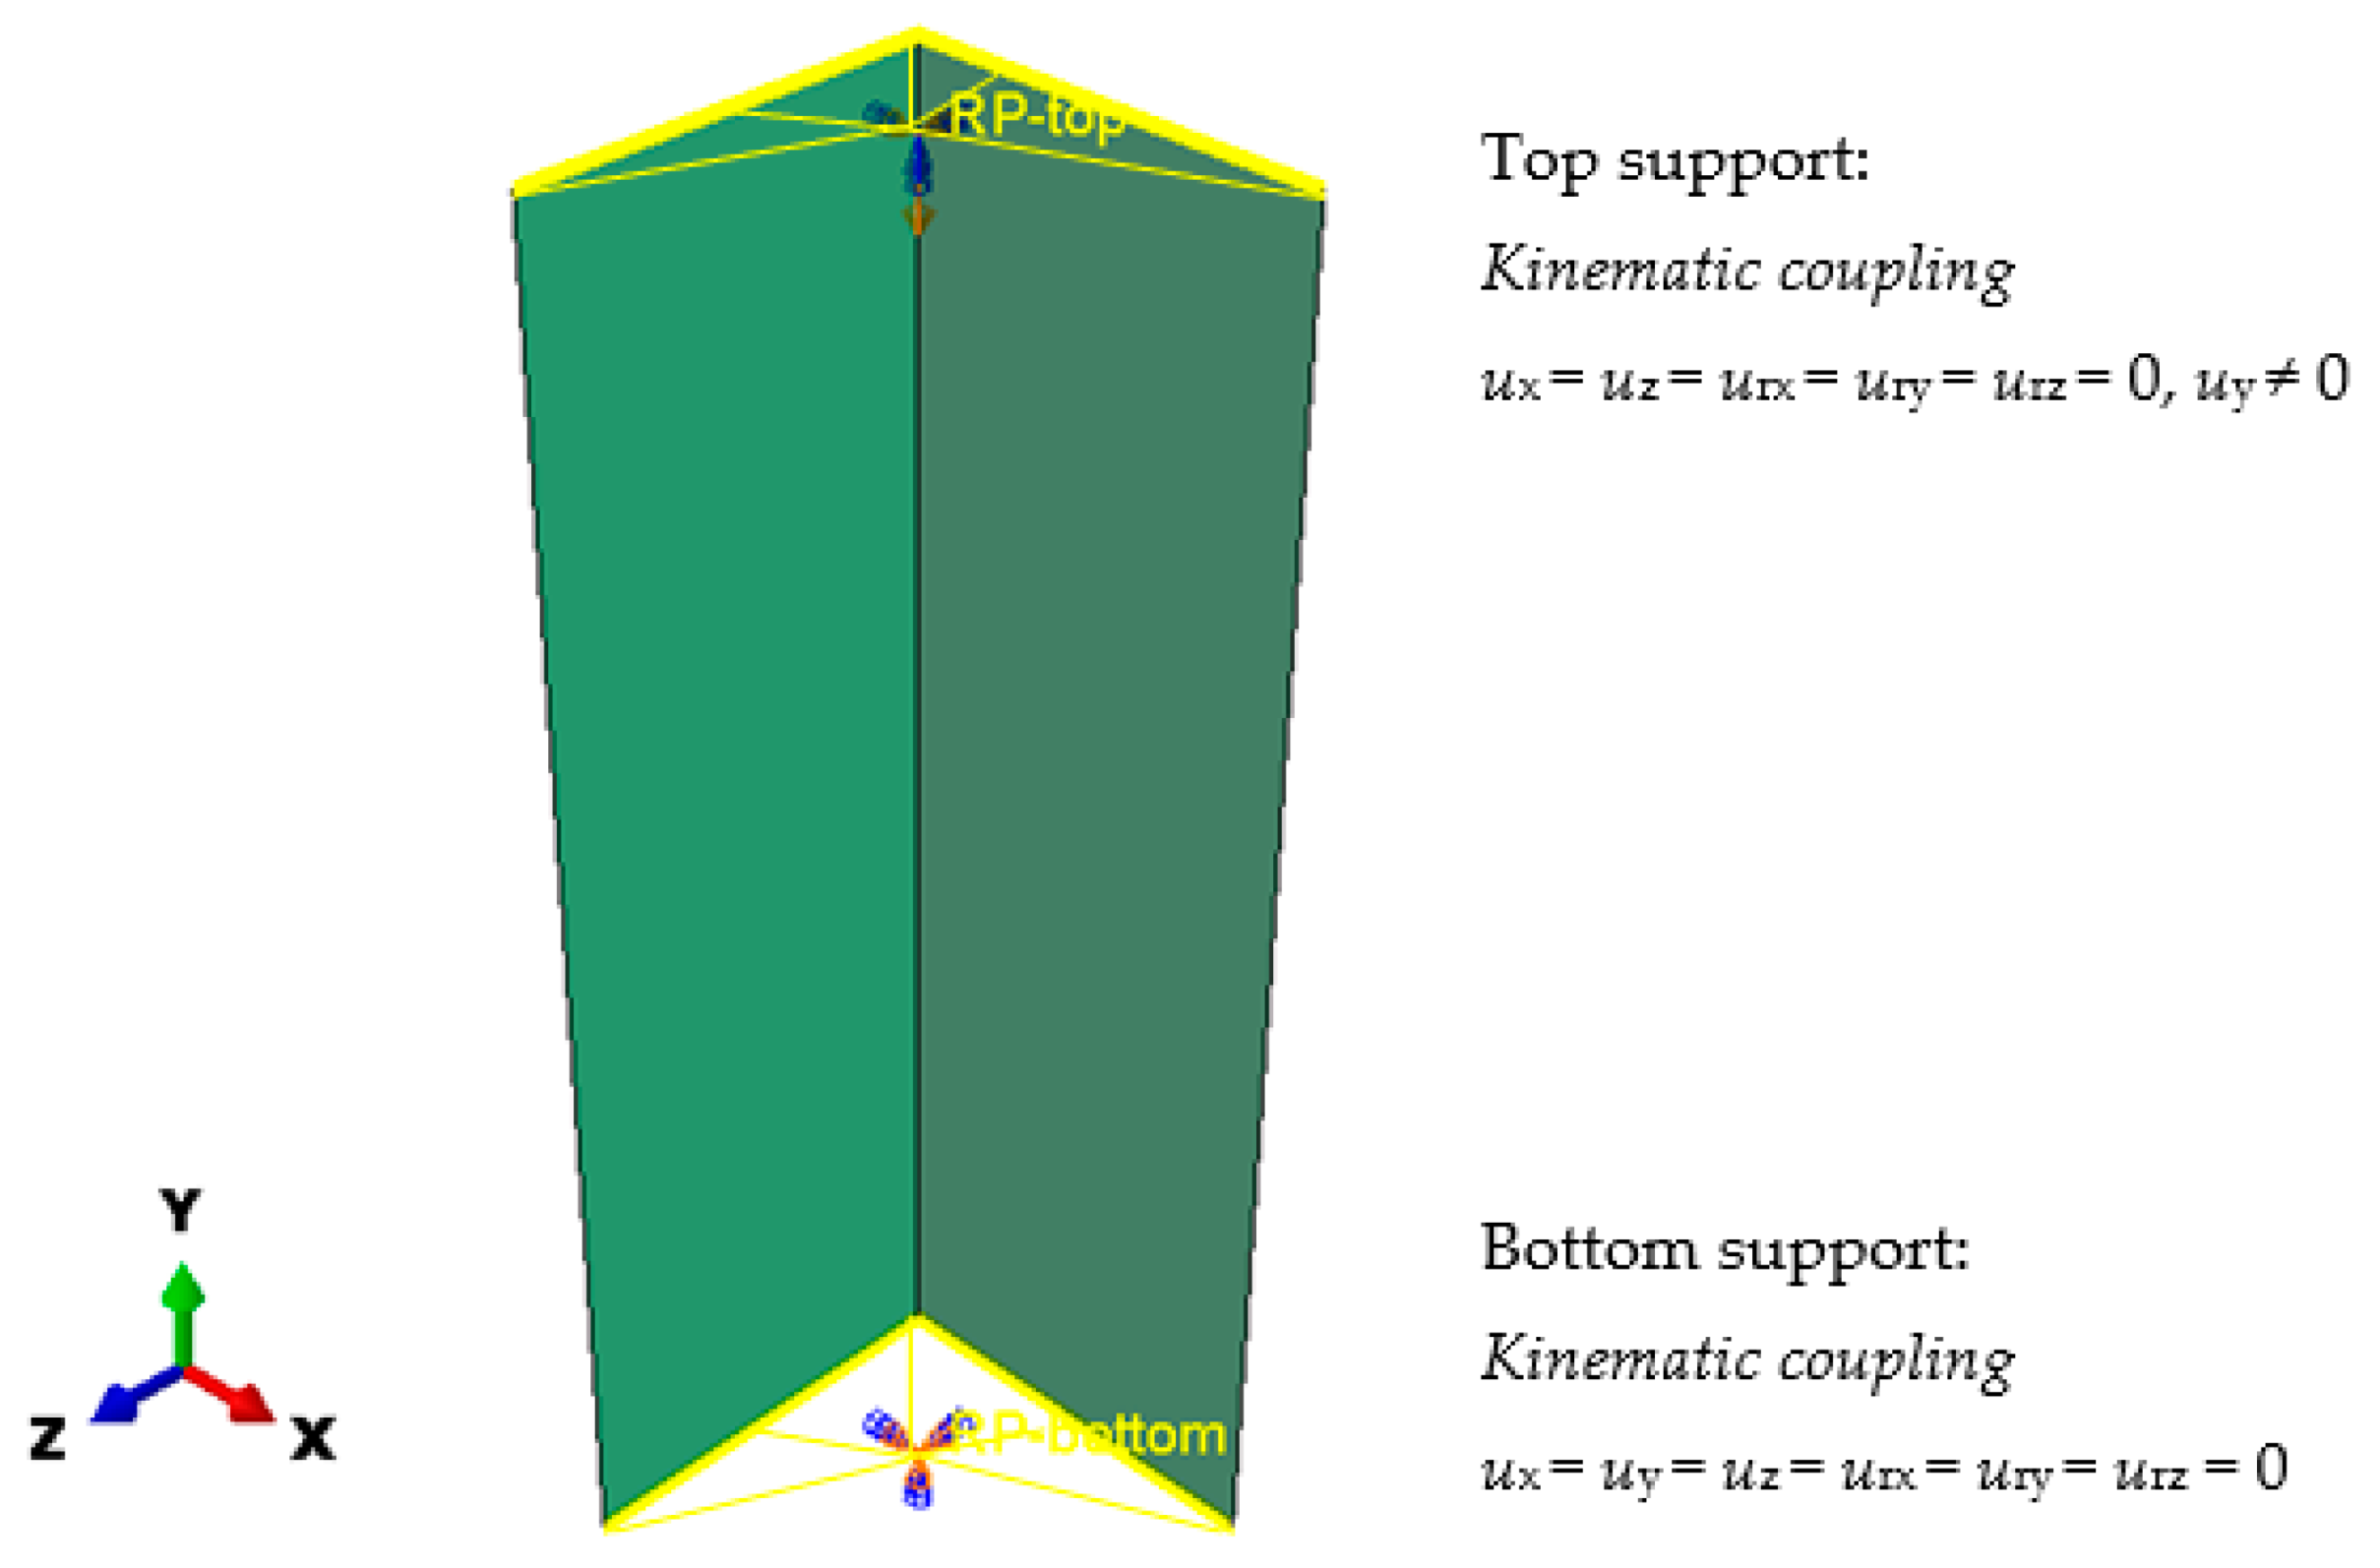
A mesh convergence study was executed to determine the optimum mesh size which allows for balance between accuracy and computational efficiency. A mesh size of 5 mm × 5 mm was found to provide accurate results for the present study. Fixed support conditions were applied at the end sections [3]. To do so, the top and bottom end sections were coupled through kinematic coupling constraints to corresponding reference points (RPs) defined at the cross-sectional centroid. The bottom RP was fully restrained against all translational and rotational degrees of freedom, whilst the top RP was only allowed to translate in the longitudinal direction. The geometry along with the corresponding boundary conditions and constraints of a typical stub column model are shown in Figure 2.
2.3. Material Modelling
Past reported studies [25,26,27] have demonstrated the capability of the Ramberg–Osgood material model [28,29] to accurately approximate the actual stress-strain behaviour of aluminium alloys. For this reason, the Ramberg–Osgood material model [28,29] was employed through the analytical Equations (1) and (2).
where σ the stress, ε the strain, E the elastic modulus, σ0.1 the 0.1% stress, σ0.2 the 0.2% proof stress and n the Ramberg–Osgood exponent.
Material nonlinearity was simulated by employing an elastic-plastic material model with a von Mises yield criterion and isotropic hardening rule. Complying with ABAQUS [7] regarding material modelling, the engineering (nominal) stress σnom and strain εnom values were converted to true stress σtrue and true plastic strain εpltrue values, respectively, using Equations (3) and (4):
2.4. Initial Geometric Imperfections and Nonlinear Analysis
Initial local geometric imperfections, i.e., deviations of the actual cross-sectional shape from the perfect one arisen during manufacturing, transporting and handling processes of thin-walled members, were also incorporated into the FE models. To do this, a linear eigenvalue buckling analysis was conducted for each modelled stub column to extract the different buckling mode shapes (eigenvectors). In line with past studies [23,30], the initial local geometric imperfection distribution pattern was assumed to be in the form of the lowest buckling mode shape and was incorporated in the models. Moreover, an initial imperfection sensitivity study was performed considering three fractions of the plate thickness, t: t/10, t/15 and t/50 [31,32,33]. In line with past studies [23,30], the local geometric imperfection amplitudes were taken as a function of the plate thickness, because the local buckling mode has a half-wavelength of the same order of magnitude as the thickness of the constituent plate elements [10].
2.5. Validation of the FE Models
The developed FE models were validated against experimental data reported in [3]. The experimental programme dealt with 6000 series heat-treated aluminium alloy fix-ended stub column tests along with corresponding material tensile coupon tests. For validation purposes, the reported data of 20 stub column tests, shown in Table 1, were used. The measured material properties obtained from coupon tests, included in Table 1 [3], were utilised for the material modelling of each examined cross-section, according to the assumptions of Section 2.2. It is noted that L is the specimens’ length and σt is the ultimate tensile stress.
The reported experimental, Nu,Exp, and numerical, Nu,FE, ultimate loads and the ratio of the experimental over the numerical ultimate loads, Nu,Exp/Nu,FE, are given in Table 2. As can be seen the mean value and the coefficient of variation (COV) of the Nu,Exp/Nu,FE ratio is 0.99 and 0.03, respectively, denoting a very good agreement between the numerical and experimental results.
The numerical results demonstrated quite low sensitivity of the cross-sectional response of angles to the initial local imperfection amplitude, while the factor of t/10 of the plate thickness provided the best agreement with the test results [31,37].
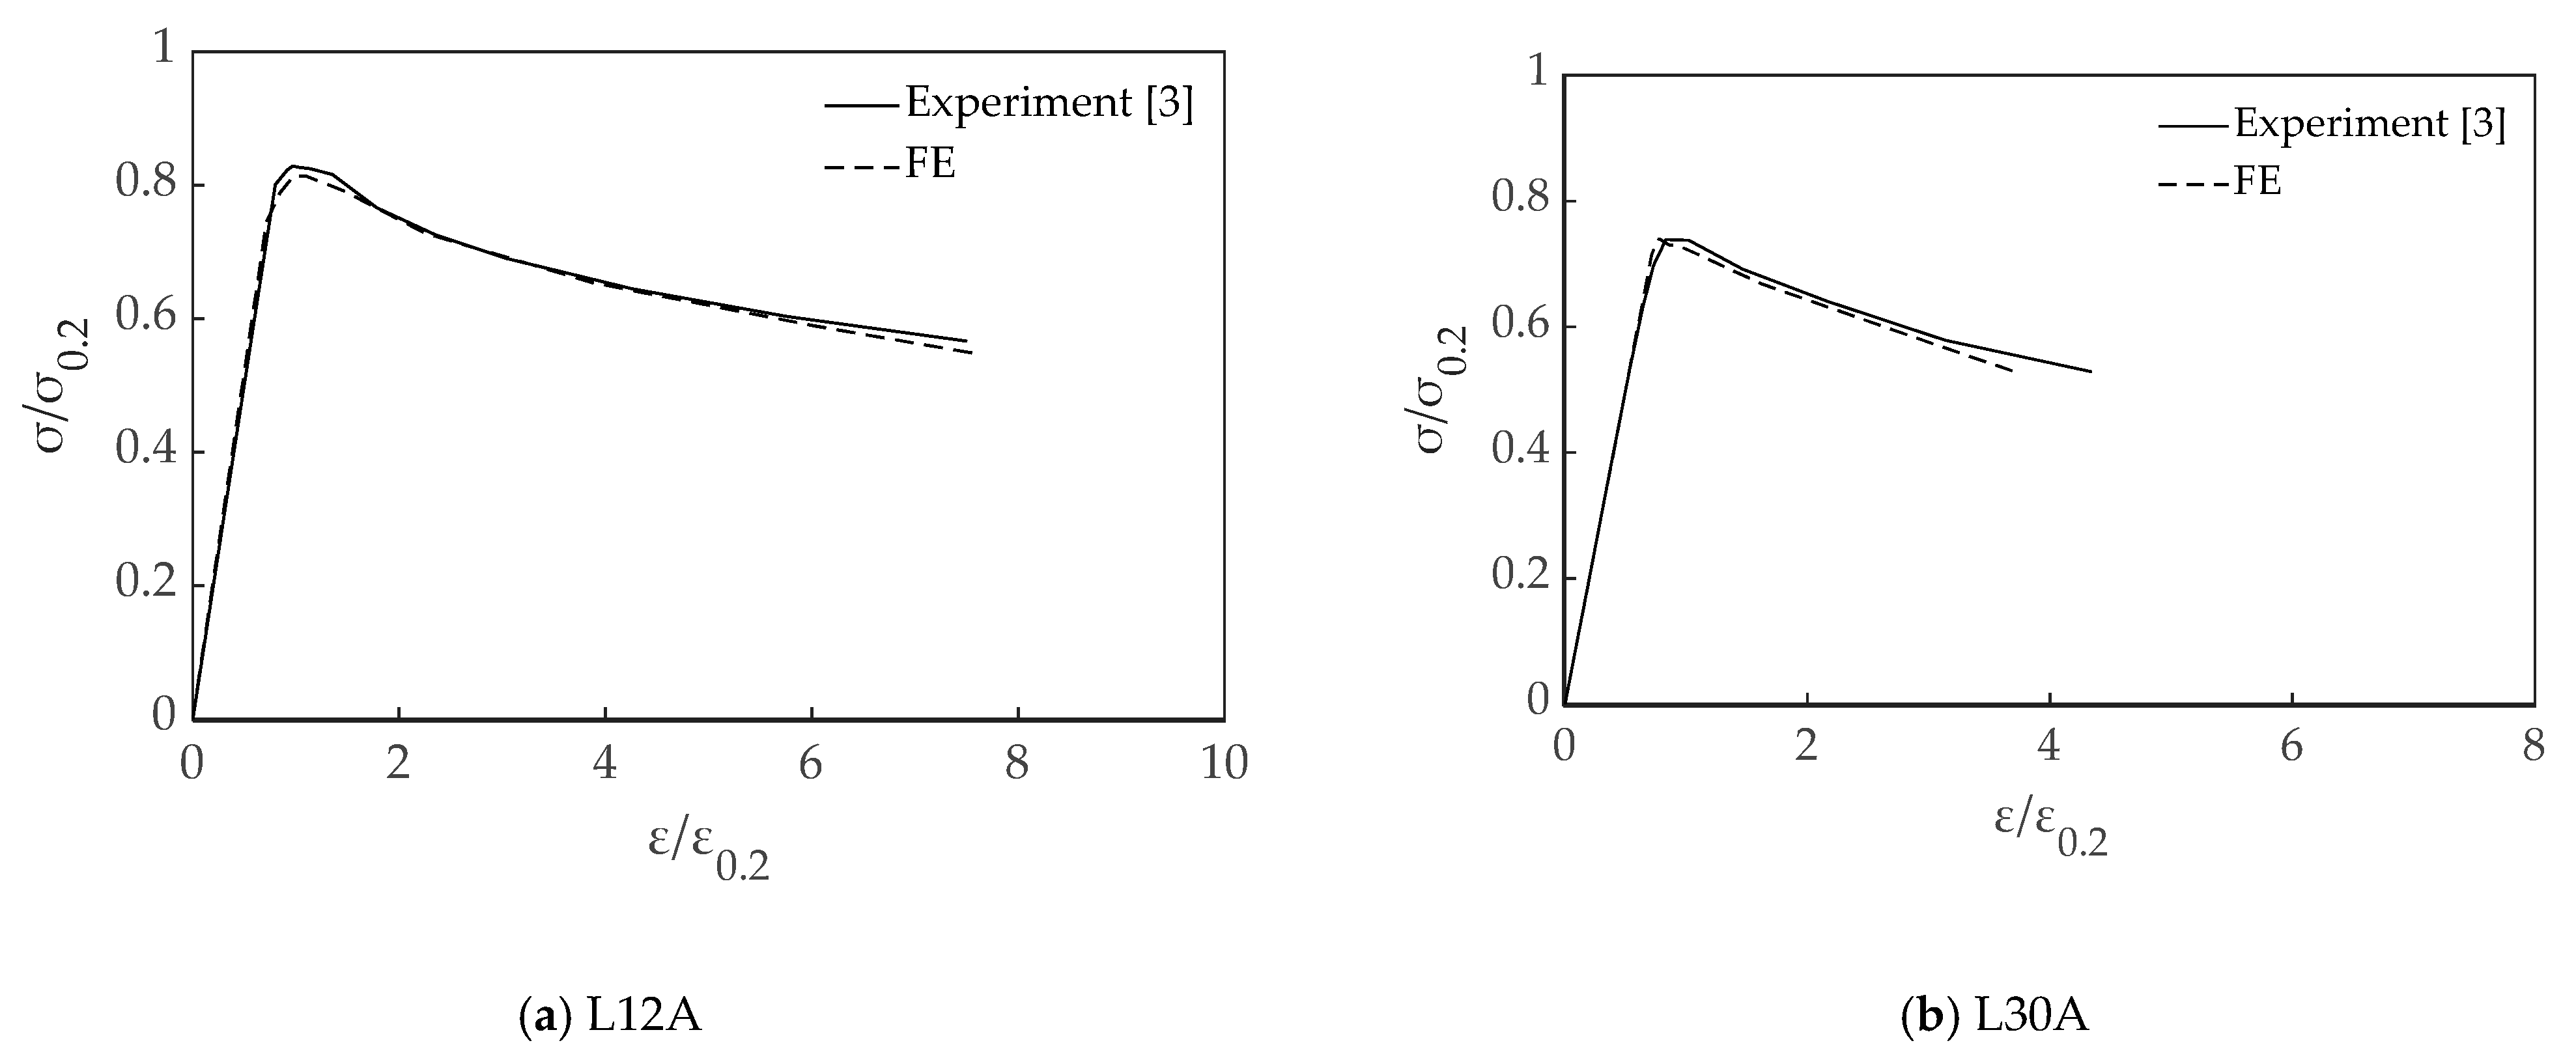
The accuracy of the developed FE models was further verified by comparing the numerically obtained normalised normal stress σ/σ0.2 versus longitudinal strain ε/ε0.2 curves (where ε0.2 = σ0.2/E.) against the corresponding experimental ones reported in [3]. Typical curves of L12A and L30A specimens are depicted in Figure 3a,b, respectively. It can be observed that the experimental initial stiffness, ultimate load and post-ultimate response exhibited during tests are successfully replicated by the developed FE models. With regards to failure modes, in all cases the numerical stub columns failed due to pure local buckling which is in accordance with the experimental observations [3]. Overall, it can be stated that the FE developed models can satisfactorily replicate the cross-sectional response of aluminium alloy angles.
2.6. Parametric Study
Having successfully validated the general ability of the developed FE models to replicate the behaviour of aluminium alloy angle sections subjected to axial compression, a series of parametric analyses was carried out. A broad range of cross-sectional aspect ratios, cross-sectional slenderness and two types of aluminium alloys were considered providing a sufficient amount of data for a comprehensive understanding of the cross-sectional behaviour of aluminium alloy angles. Particularly, the outer web depth α was set to 120 mm, whilst three different outer flange widths b, namely 120 mm, 80 mm and 60 mm were examined, resulting in three cross-sectional aspect ratios α/b of 1.0, 1.5 and 2.0, respectively. Aiming to study sections commonly applied in practice, the plate thickness varied between 6 mm and 30 mm (4 mm increment) covering a wide spectrum of cross-sectional slenderness and thus providing results for both stocky and slender cross-sections, i.e., β/ε in the range of 2.43–20.39. The ratio β = b/t (b is the flat part of the width and t is the plate thickness) is the slenderness parameter and is a material coefficient. The thickness was kept the same for both legs of the angles. The examined non-dimensional slenderness (defined in Section 4.3) was in the range of 0.29–2.46. The selected slenderness values were in line with past studies [23,24,30]. Note that the experimentally studied non-dimensional slenderness was in the range of 0.68–4.01 covering only slender cross-sections. A summary of the examined parameters is listed in Table 3.
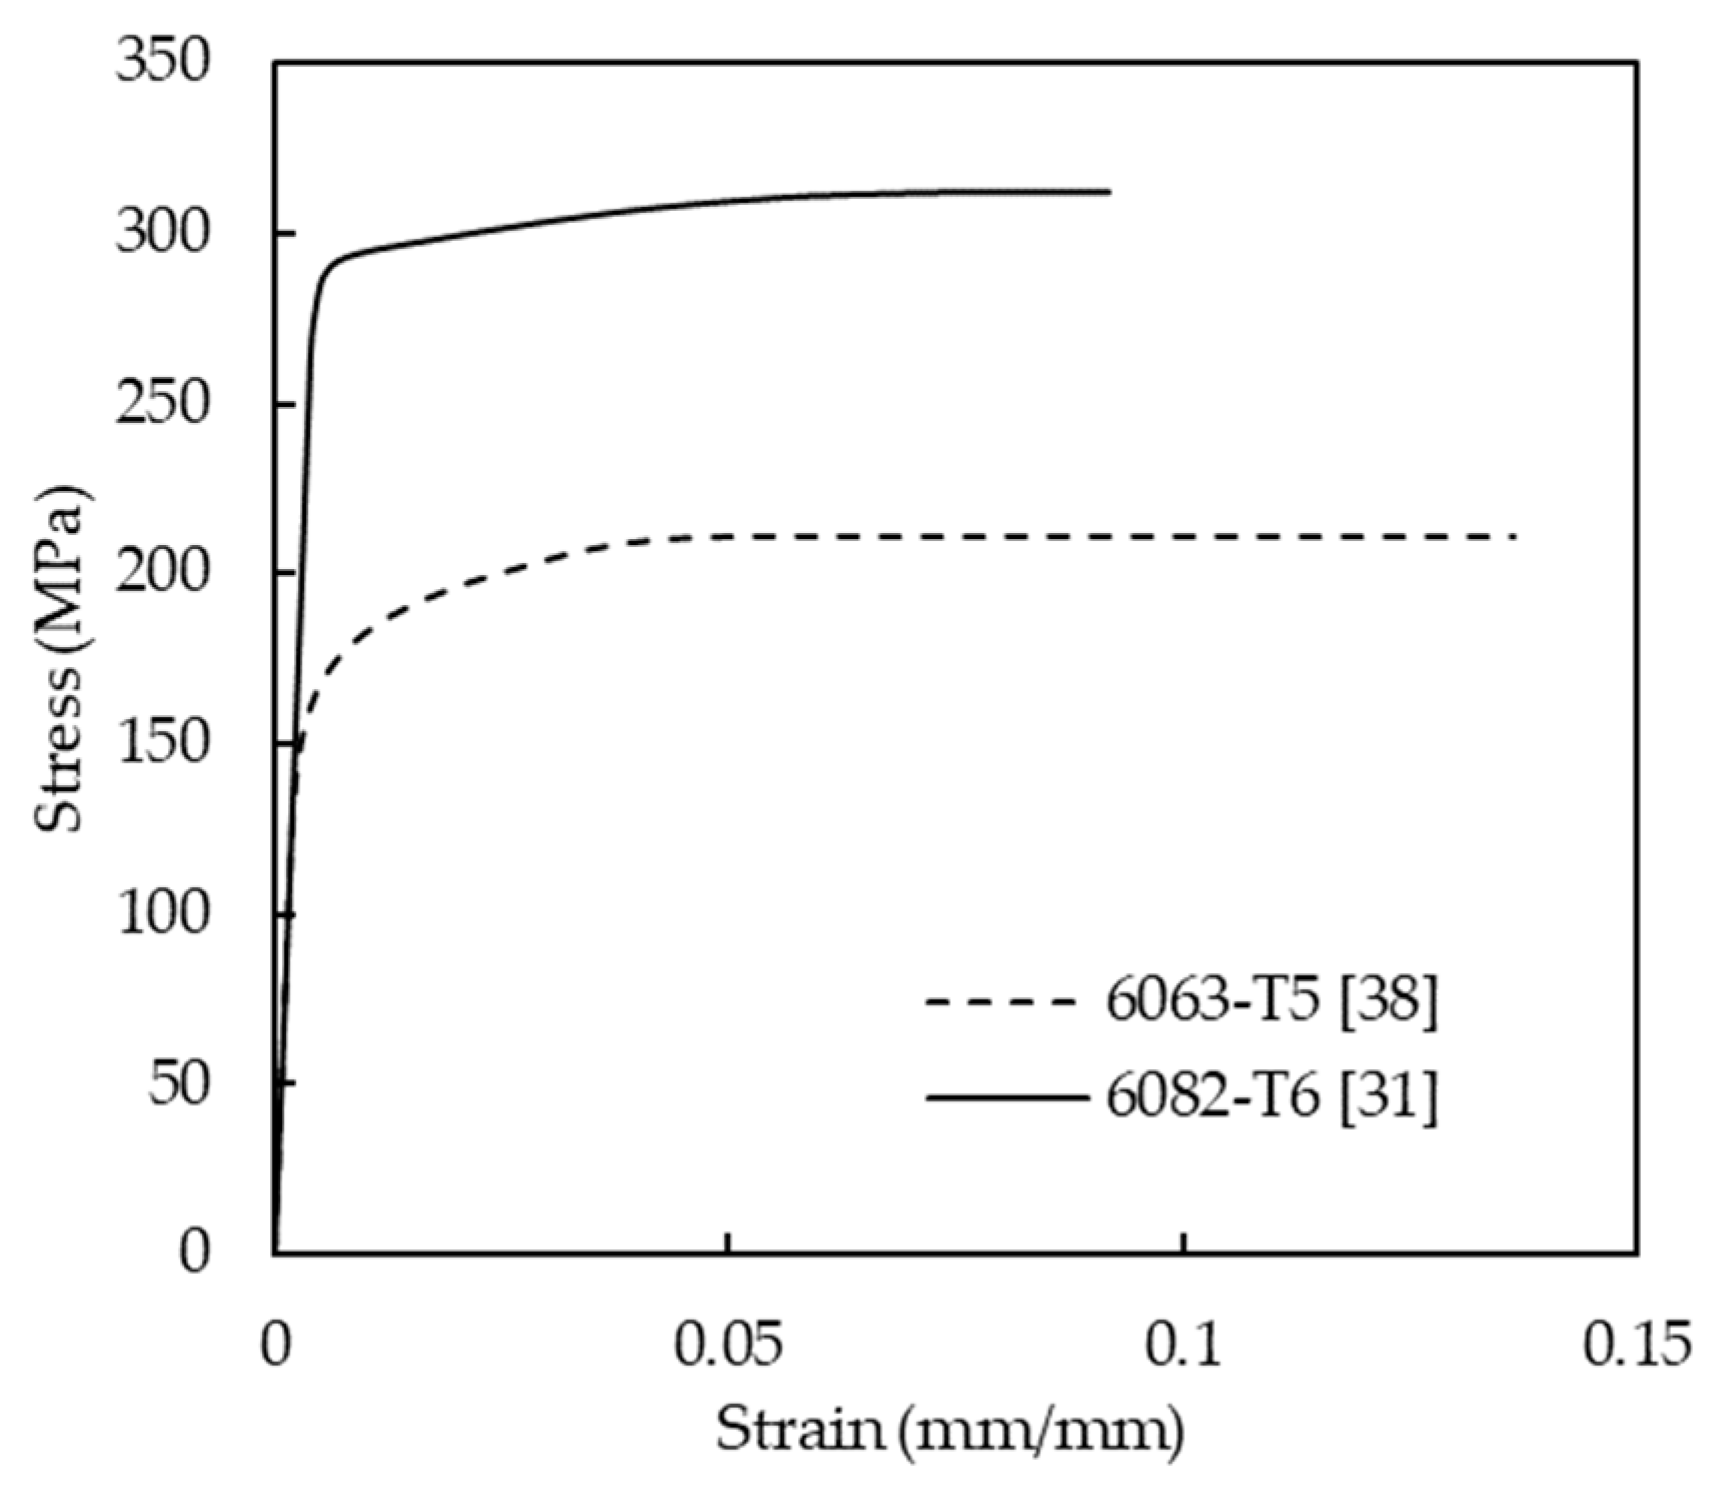
Moreover, two types of heat-treated aluminium alloys were considered, namely 6063-T5 and 6082-T6, representing a typical normal strength and high strength heat-treated aluminium alloy, respectively. The material properties for 6063-T5 [38] and 6082-T6 [31] adopted in the present study are shown in Table 4. Note that εu and εf are the strain at ultimate stress and at fracture, respectively. The stress-strain responses for both investigated aluminium alloys are plotted in Figure 4 utilising the Ramberg–Osgood material model [28,29] through Equations (1) and (2). As can be observed, the 6082-T6 aluminium alloy has higher (almost doubled) yield strength, although, it exhibits less pronounced strain hardening behaviour and ductility than the 6063-T5 aluminium alloy.
Aiming to simulate local buckling failure without involving any coupled instability phenomena, all FE models had a height H equal to three times the cross-sectional depth. The modelling methodology and assumptions presented in Section 2.1, Section 2.2, Section 2.3, Section 2.4 were adopted for all models and a total of 42 numerical analyses were executed.
3. Analysis and Discussion of the Results
3.1. Mechanical Behaviour and Failure Mode
Even though the angle sections are easy to extrude and connect with the adjacent elements, their behaviour is complex. This is because the shear centre is located at the corner of the cross-section and does not coincide with the centroid, resulting in any twisting combined with bending. For angle section stub columns subjected to uniform compression, the expected failure mode is pure local buckling. Although, in some cases [30] the buckling response is characterised by torsion in the form of rigid-body rotation about the shear centre of the cross-section. This behaviour is usually coupled with major-axis flexure, i.e., translation of the corner in the direction parallel to the minor principal axis, producing tortional-flexural buckling.
For all FE models, the ultimate compressive load, the full range load–end-shortening response and the failure mode were captured. As anticipated, all stub columns failed due to pure local buckling. Figure 5 displays failure modes, stress distribution patterns and longitudinal displacement patterns for typical 6063-T5 cross-sections. The captures show the stress and displacement state at failure load with a deformation scale factor equal to 5. Local buckling can be observed in the middle of each specimen where the developed compressive stresses are higher. In case of unequal-leg angles (Figure 5a,b), the longer leg exhibits higher deformations since it is more slender, i.e., larger β = b/t, and thus more susceptible to local buckling. Moreover, the presented cross-sections exceeded their yield stress (i.e., 164 MPa for 6063-T5), reaching plastic deformations before failing due to local buckling.
3.2. Effect of Cross-Sectional Aspect Ratio
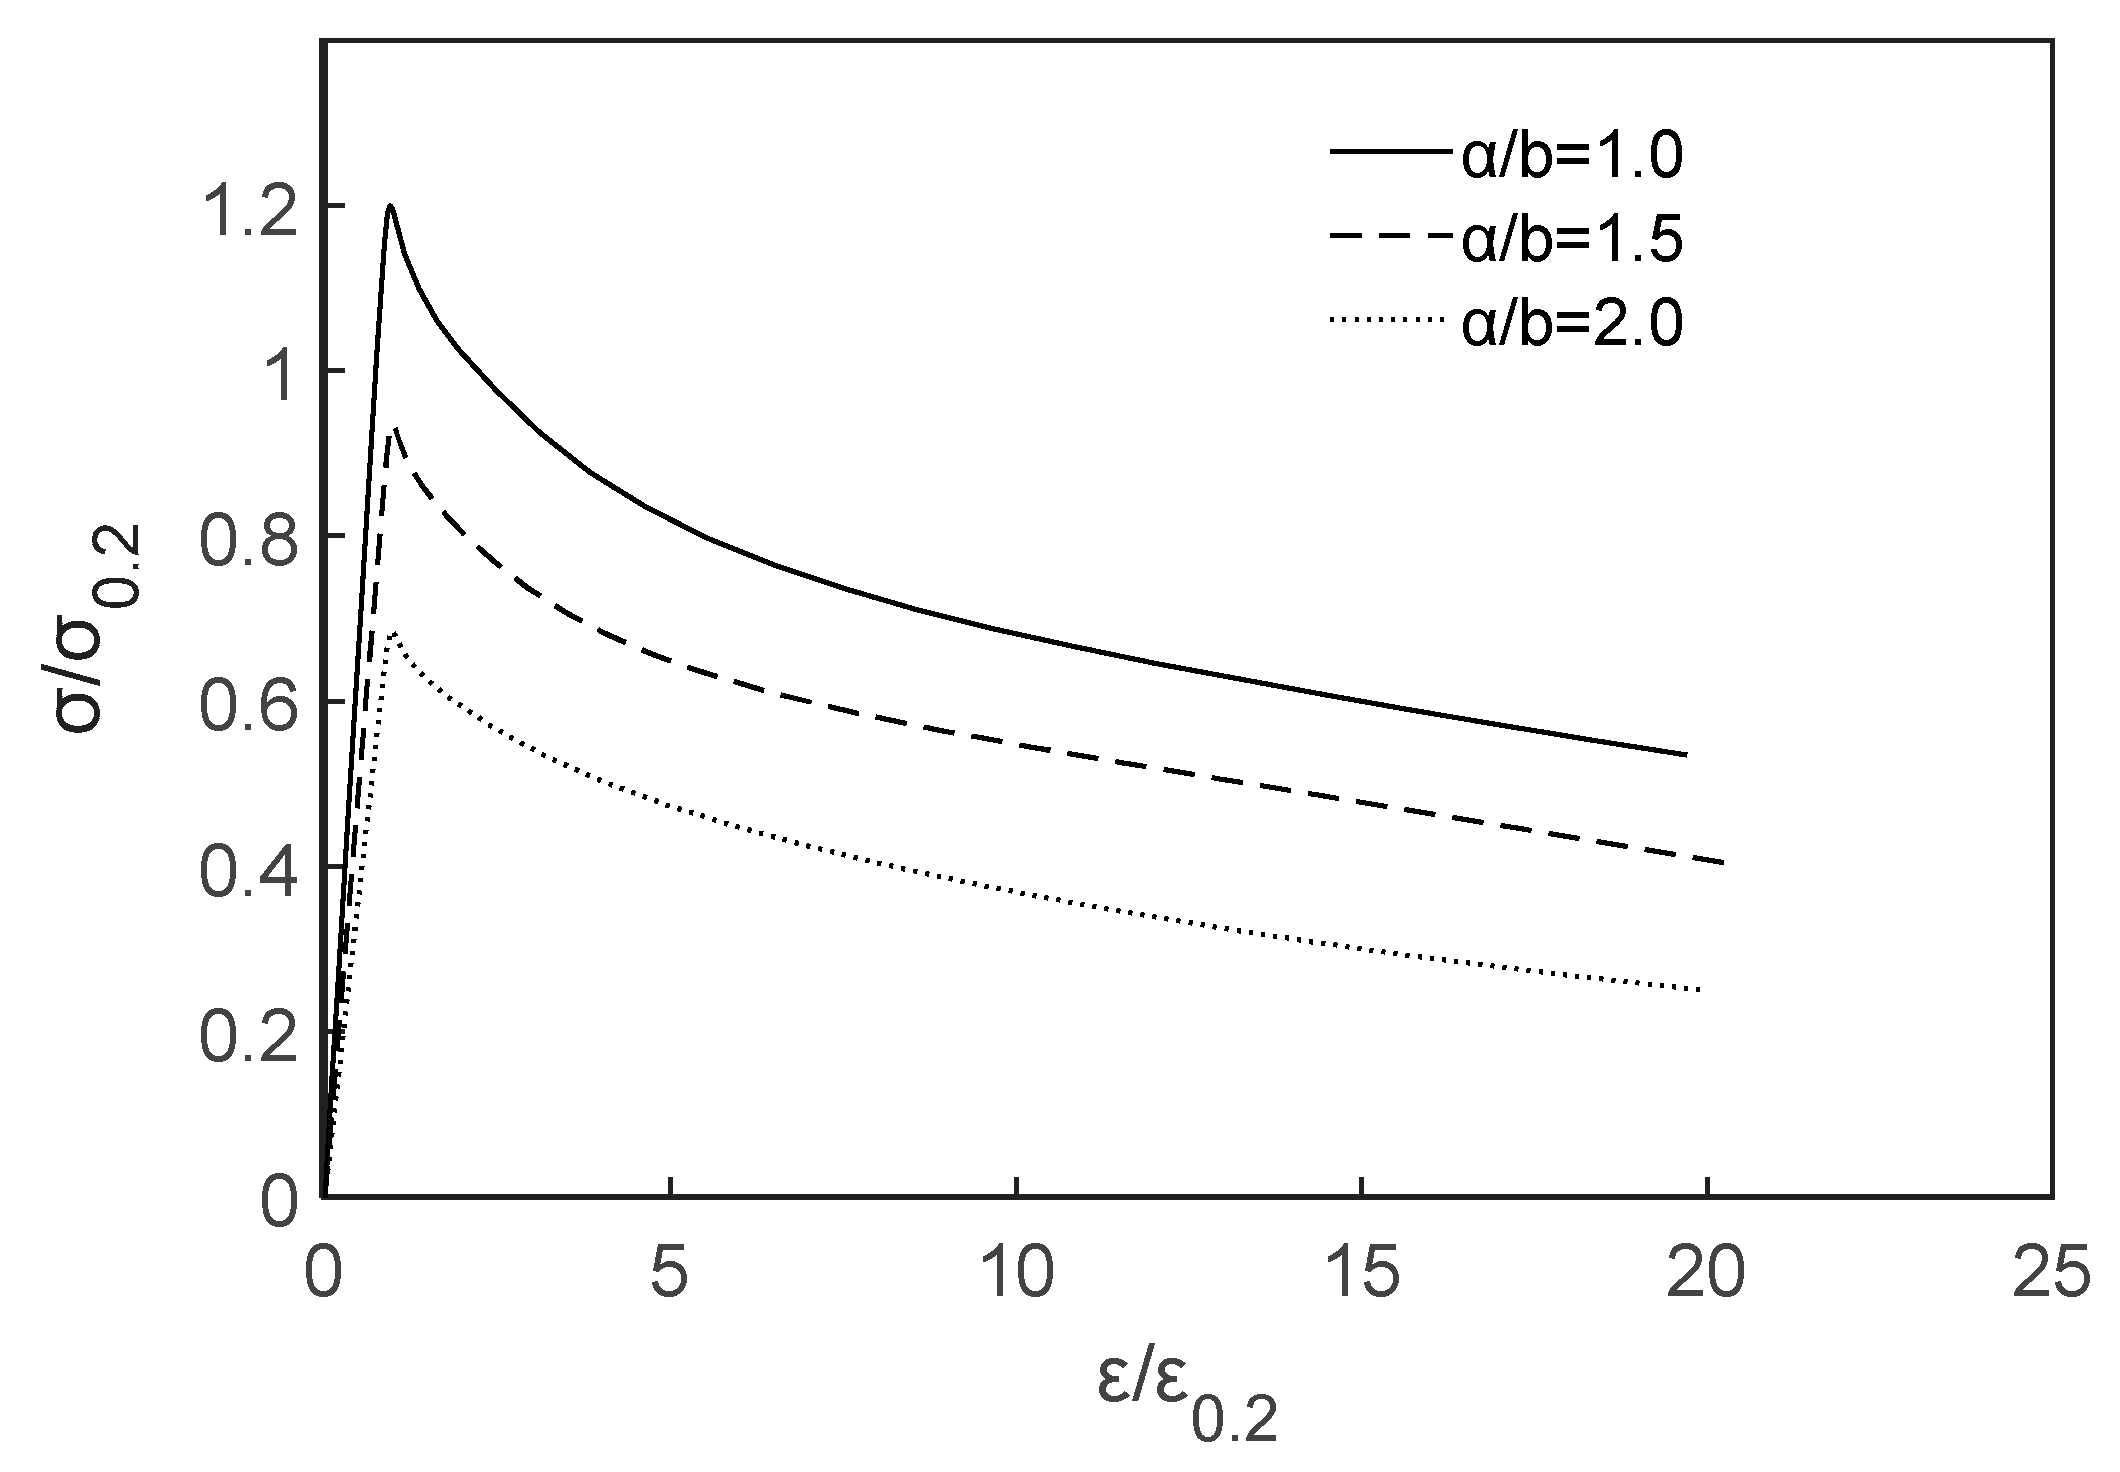
Examining the influence of the cross-sectional aspect ratio a/b on the cross-sectional strength, it was found that the ultimate compressive load increases with decreasing aspect ratios. This conclusion is related to the beneficial effect of the plate element interaction on the local buckling response of the cross-sections. This is also observed in Figure 6, that illustrates the normalised stress σ/σ0.2 versus strain ε/ε0.2 responses for 6082-T6 cross-sections with thickness t = 10 mm and the three considered aspect ratios, i.e., a/b = 1.0 (120 × 120), 1.5 (120 × 80) and 2.0 (120 × 60). In this case, the cross-sectional compressive capacity of the section with equal legs exceeded its yield strength, whilst for the angles with unequal legs (i.e., aspect ratio larger than one), the shorter leg provided smaller restraint, leading to local buckling failure of the slender leg in elastic deformations.
3.3. Effect of Cross-Sectional Slenderness
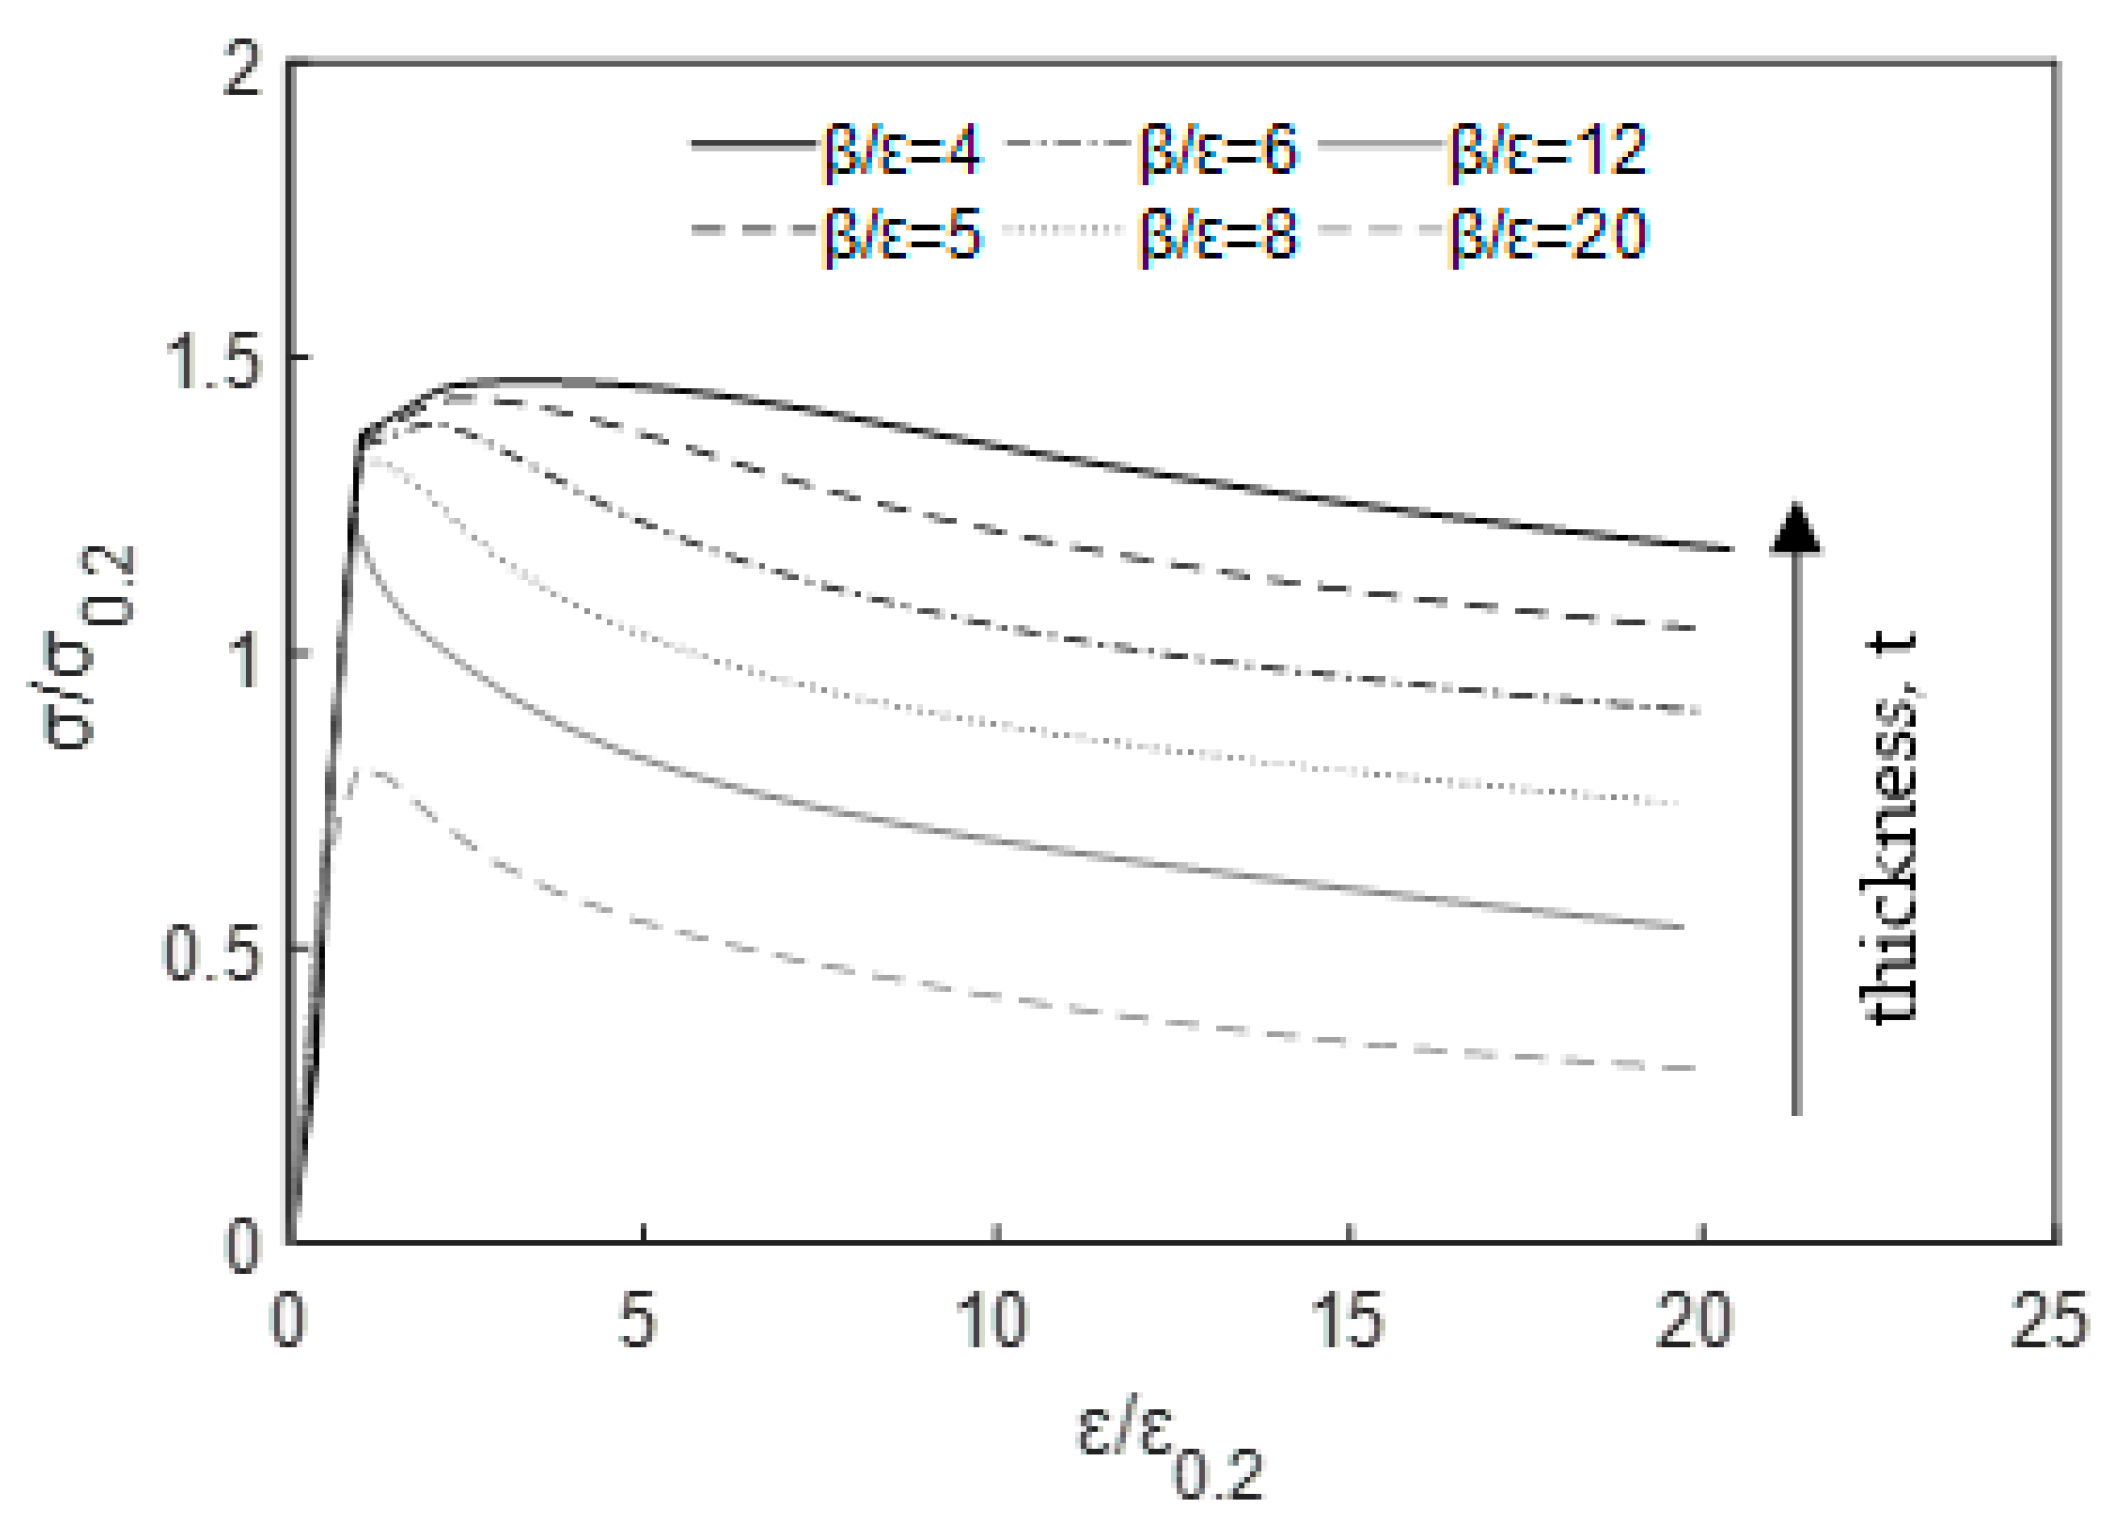
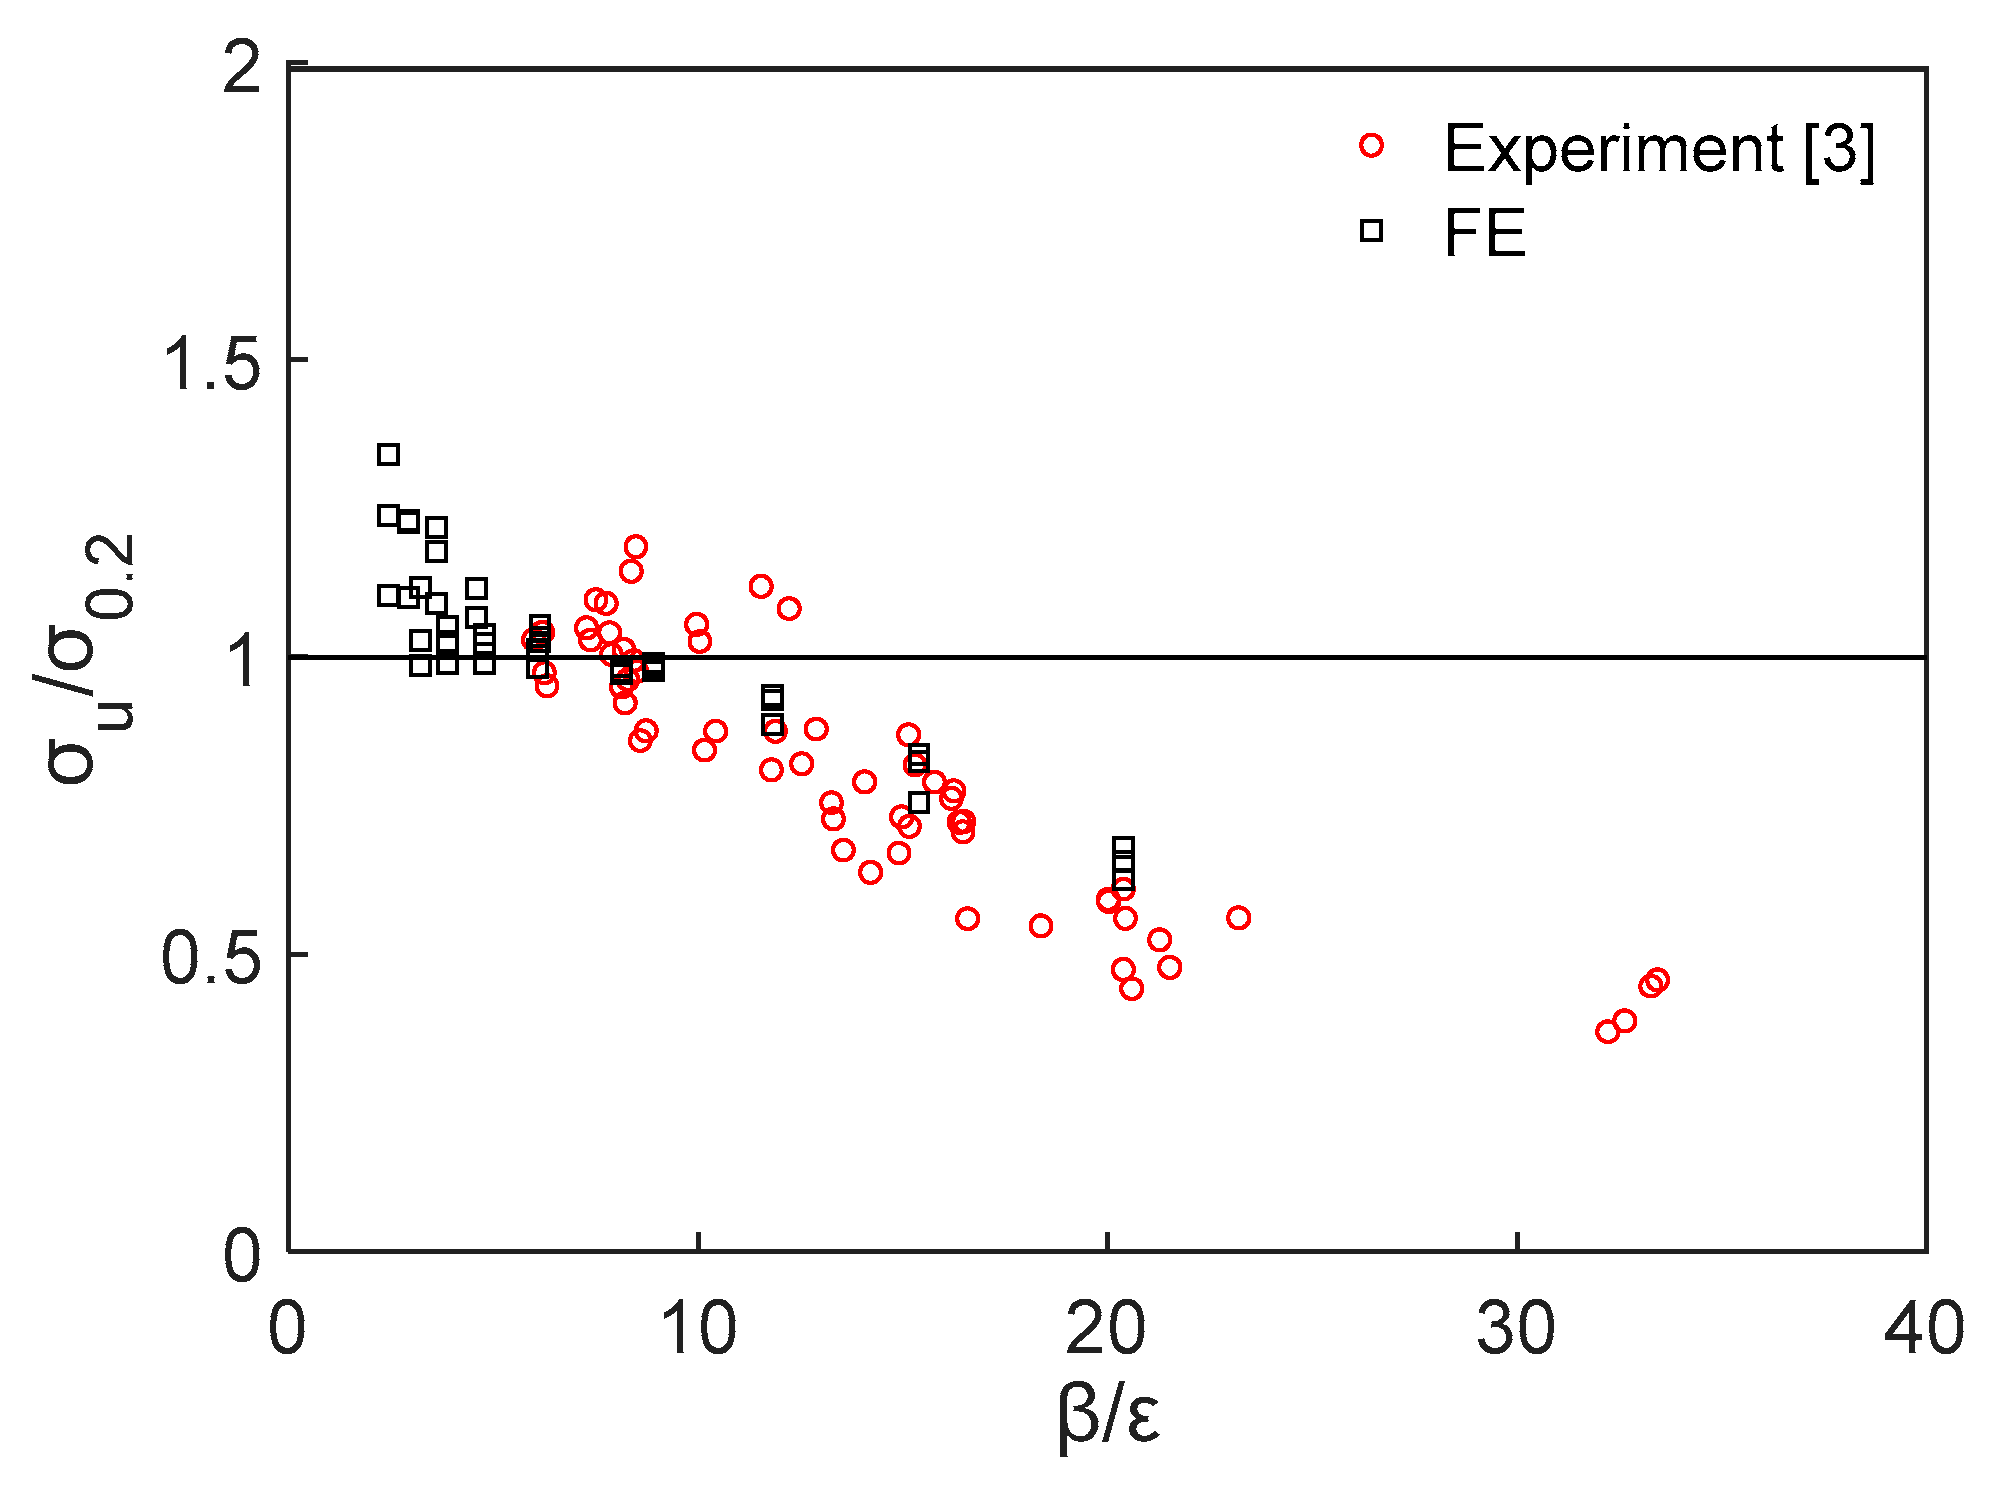
As the plate thickness t increases and thereby the cross-sectional slenderness β/ε decreases, the achieved ultimate compressive load increases. In case of stocky cross-sections, i.e., small value of β/ε, failure due to local buckling is significantly delayed allowing for response within the plastic range and thus for ultimate compressive load higher than the yield strength. The same can be drawn from Figure 7 where typical normalised stress σ/σ0.2 versus longitudinal strain ε/ε0.2 responses are plotted for 6082-T6 cross-sections with a/b = 1.0 and different cross-sectional slenderness β/ε. For example, the achieved normalised normal stress σ/σ0.2 for a slender (120 × 120 × 6) and a stocky (120 × 120 × 26) cross-section is 0.8 and 1.46, respectively. In addition, the observed smoother descending branch denotes the higher ductile behaviour exhibited by the stockiest cross-sections upon the attainment of the ultimate compressive load. Moreover, Figure 8 presents the stresses at ultimate load normalised with the yield stress (σu/σ0.2) versus the cross-sectional slenderness β/ε for the experimentally and numerically studied cross-sections, showing a trend of decreasing σu/σ0.2 for increasing slenderness. It can be observed that cross-sections with slenderness β/ε in the range of 2.43 to 12.22 exhibited plastic deformations before the attainment of the ultimate compressive load, developing stresses higher than their corresponding yield strength, i.e., σu/σ0.2 > 1.0. Particularly, the stockiest cross-section, i.e., lowest β/ε, reached stresses 40% higher than its yield strength.
3.4. Effect of Material Properties
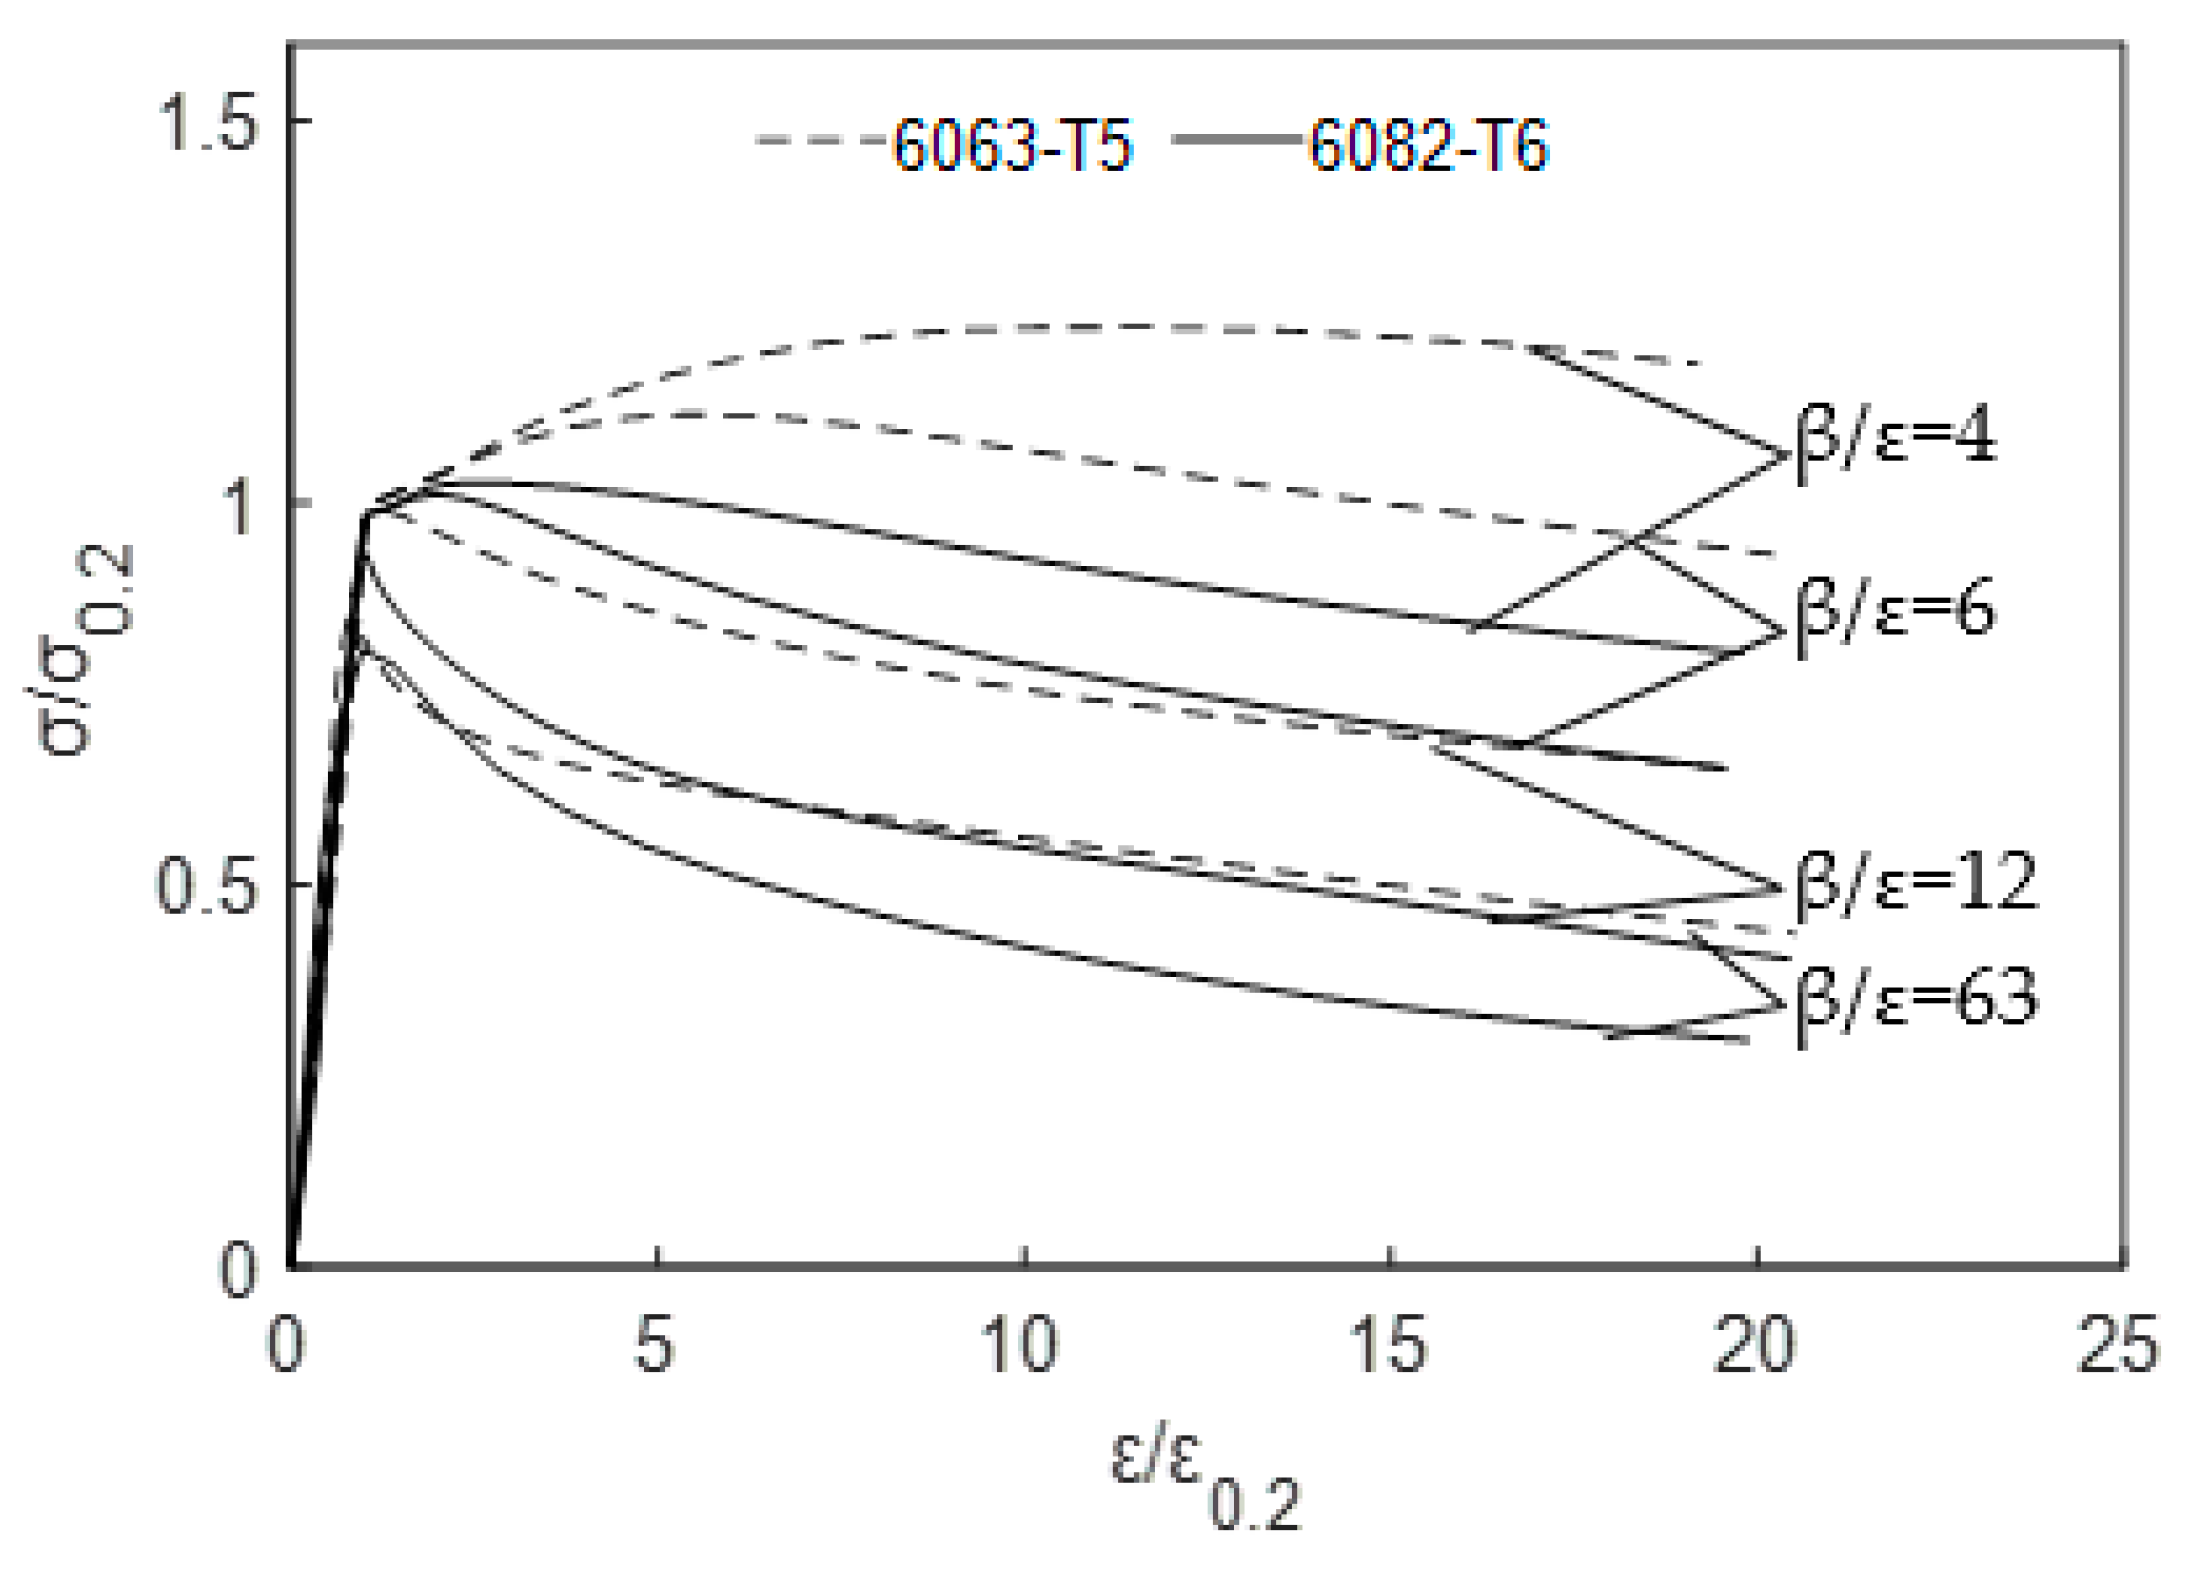
The 6063-Τ5 cross-sections achieved higher normalised ultimate compressive loads compared to the corresponding 6082-Τ6 counterparts, owing to their more favourable strain hardening and ductility properties. It is noteworthy that the normalised strength increase was more pronounced in case of stockier cross-sections. This conclusion is also demonstrated in Figure 9, where typical normalised stress-strain responses for 6082-T6 and 6063-T5 cross-sections with a/b = 1.5 and different slenderness β/ε are plotted.
4. Design Recommendations
In this section, the ultimate strengths Nu obtained from the numerical parametric study (for = 0.29–2.46) together with literature test data [3] (for = 0.68–4.01) are utilised to assess the applicability and accuracy of the design rules specified in EN 1999-1-1 (EC9) [5], American Aluminum Design Manual (AA) [6] and in two design approaches: the Continuous Strength Method (CSM) [8] and the Direct Strength Method (DSM) [9]. Note that throughout the comparisons, all partial safety factors were set equal to unity.
4.1. EN 1999-1-1
Section 6.1.5 specified in EN 1999-1-1 (EC9) [5] defines the cross-sectional resistance accounting for the material yield strength and the cross-sectional area (full or effective). To identify whether a cross-section is “fully effective” or not, EC9 [5] employs a cross-section classification framework considering the susceptibility of the most slender constituent plate element to local buckling. Particularly, EC9 [5] classifies the cross-sections in four discrete behavioural classes according to slenderness limits and determines to what extent the cross-sectional resistance is limited by the local buckling resistance. Class 1, Class 2 and Class 3 cross-sections are able to reach their yield (proof) strength and thus are considered as “fully effective”, whilst the Class 4 cross-sections fail due to local buckling before the attainment of their yield strength. In this case, the cross-sectional resistance should be reduced by replacing the gross cross-sectional area A by the effective cross-sectional area Aeff. Equations (5) and (6) are employed herein to define the cross-sectional resistance NEC9 of an angle section according to EC9 [5].
where Aeff is calculated applying a local buckling factor ρc to factor down the plate thickness.
where β and ε as previously defined. The constants C1 and C2 for outstand plate elements are set equal to 10 and 24, respectively, for material Class A (6082-T6) without welds, and 9 and 20, respectively, for material Class B (6063-T5 and material of [3]) without welds.
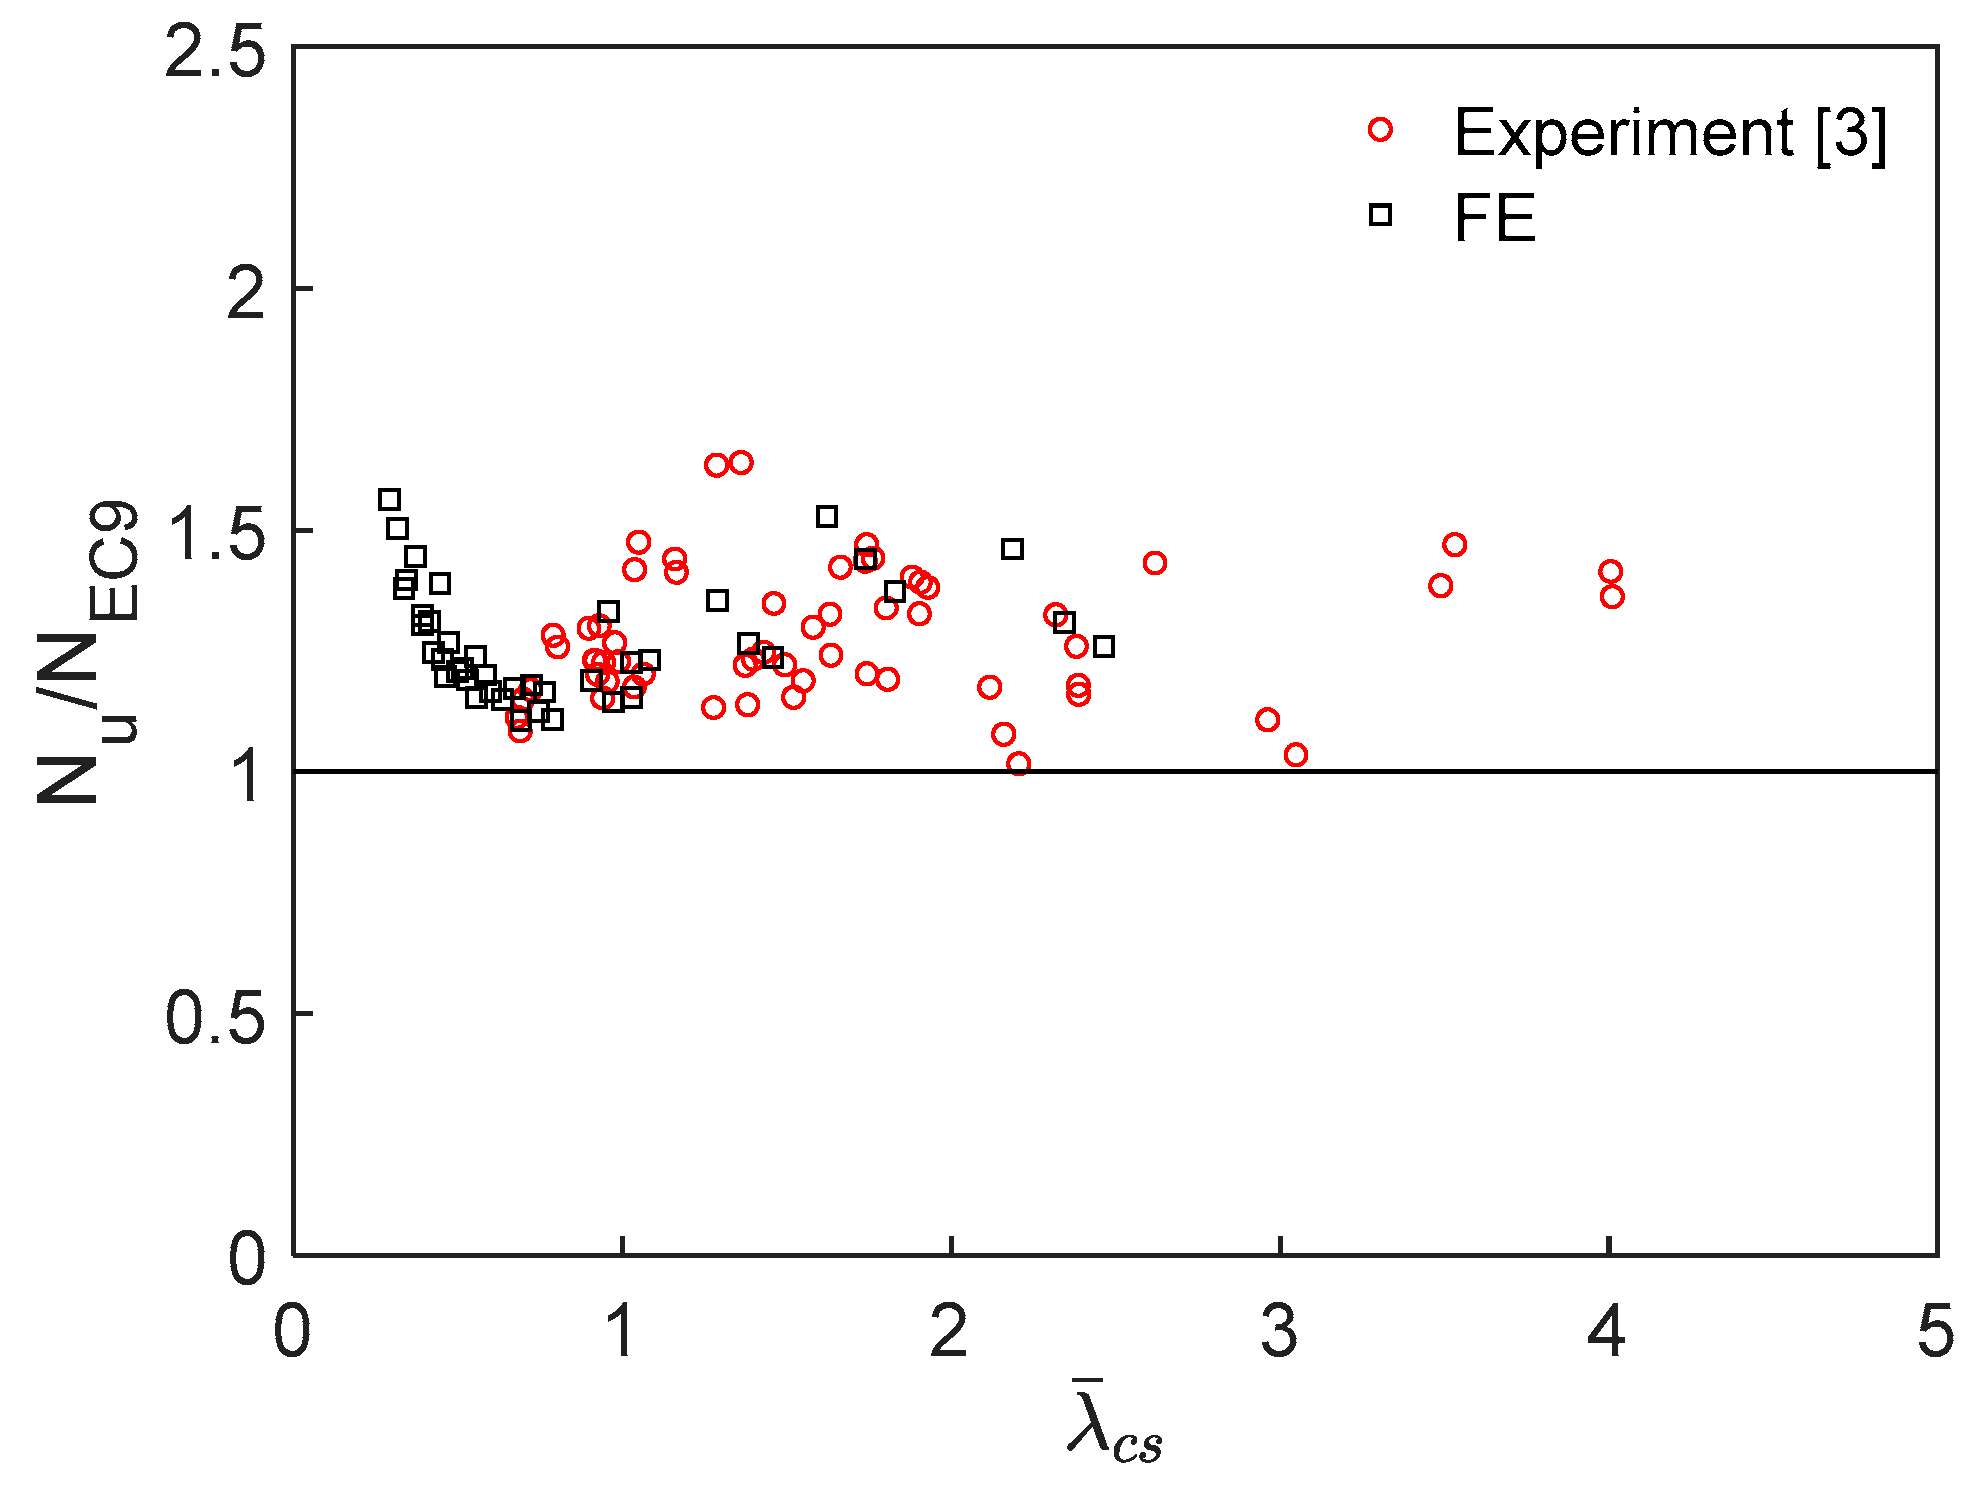
To assess the accuracy of the EC9 strength predictions, Figure 10 shows the ultimate-to-predicted Nu/NEC9 strength ratios plotted against the non-dimensional cross-sectional slenderness, (calculated according to Section 4.3). Note that the examined non-dimensional slenderness of the reported tests [3] was in the range of 0.68–4.01. As can be seen in Figure 9, the relevant data points are above the threshold line of 1.0, suggesting design safety.
4.2. American Aluminium Design Manual
Chapter E.4.1 of part I of the American Aluminum Design Manual (AA) [6] calculates the cross-sectional resistance of angles NAA as a weighted average of all the constituent plate elements employing Equation (7):
where Fci and Ai are the local buckling stress and the cross-sectional area of the i flat constituent element, Fcy is the compressive yield stress and Ag is the gross cross-sectional area.
The local buckling stress Fci of a flat element supported on one edge is determined by Equation (8) based on its slenderness ratio b/t, where b is the flat part of the width and t is the plate thickness.
In Equation (8), and are the slenderness limits defining three limit states: yielding, inelastic and elastic buckling. The buckling constants Bp, Dp and Cp are detailed in Table B.4.2 of the code.
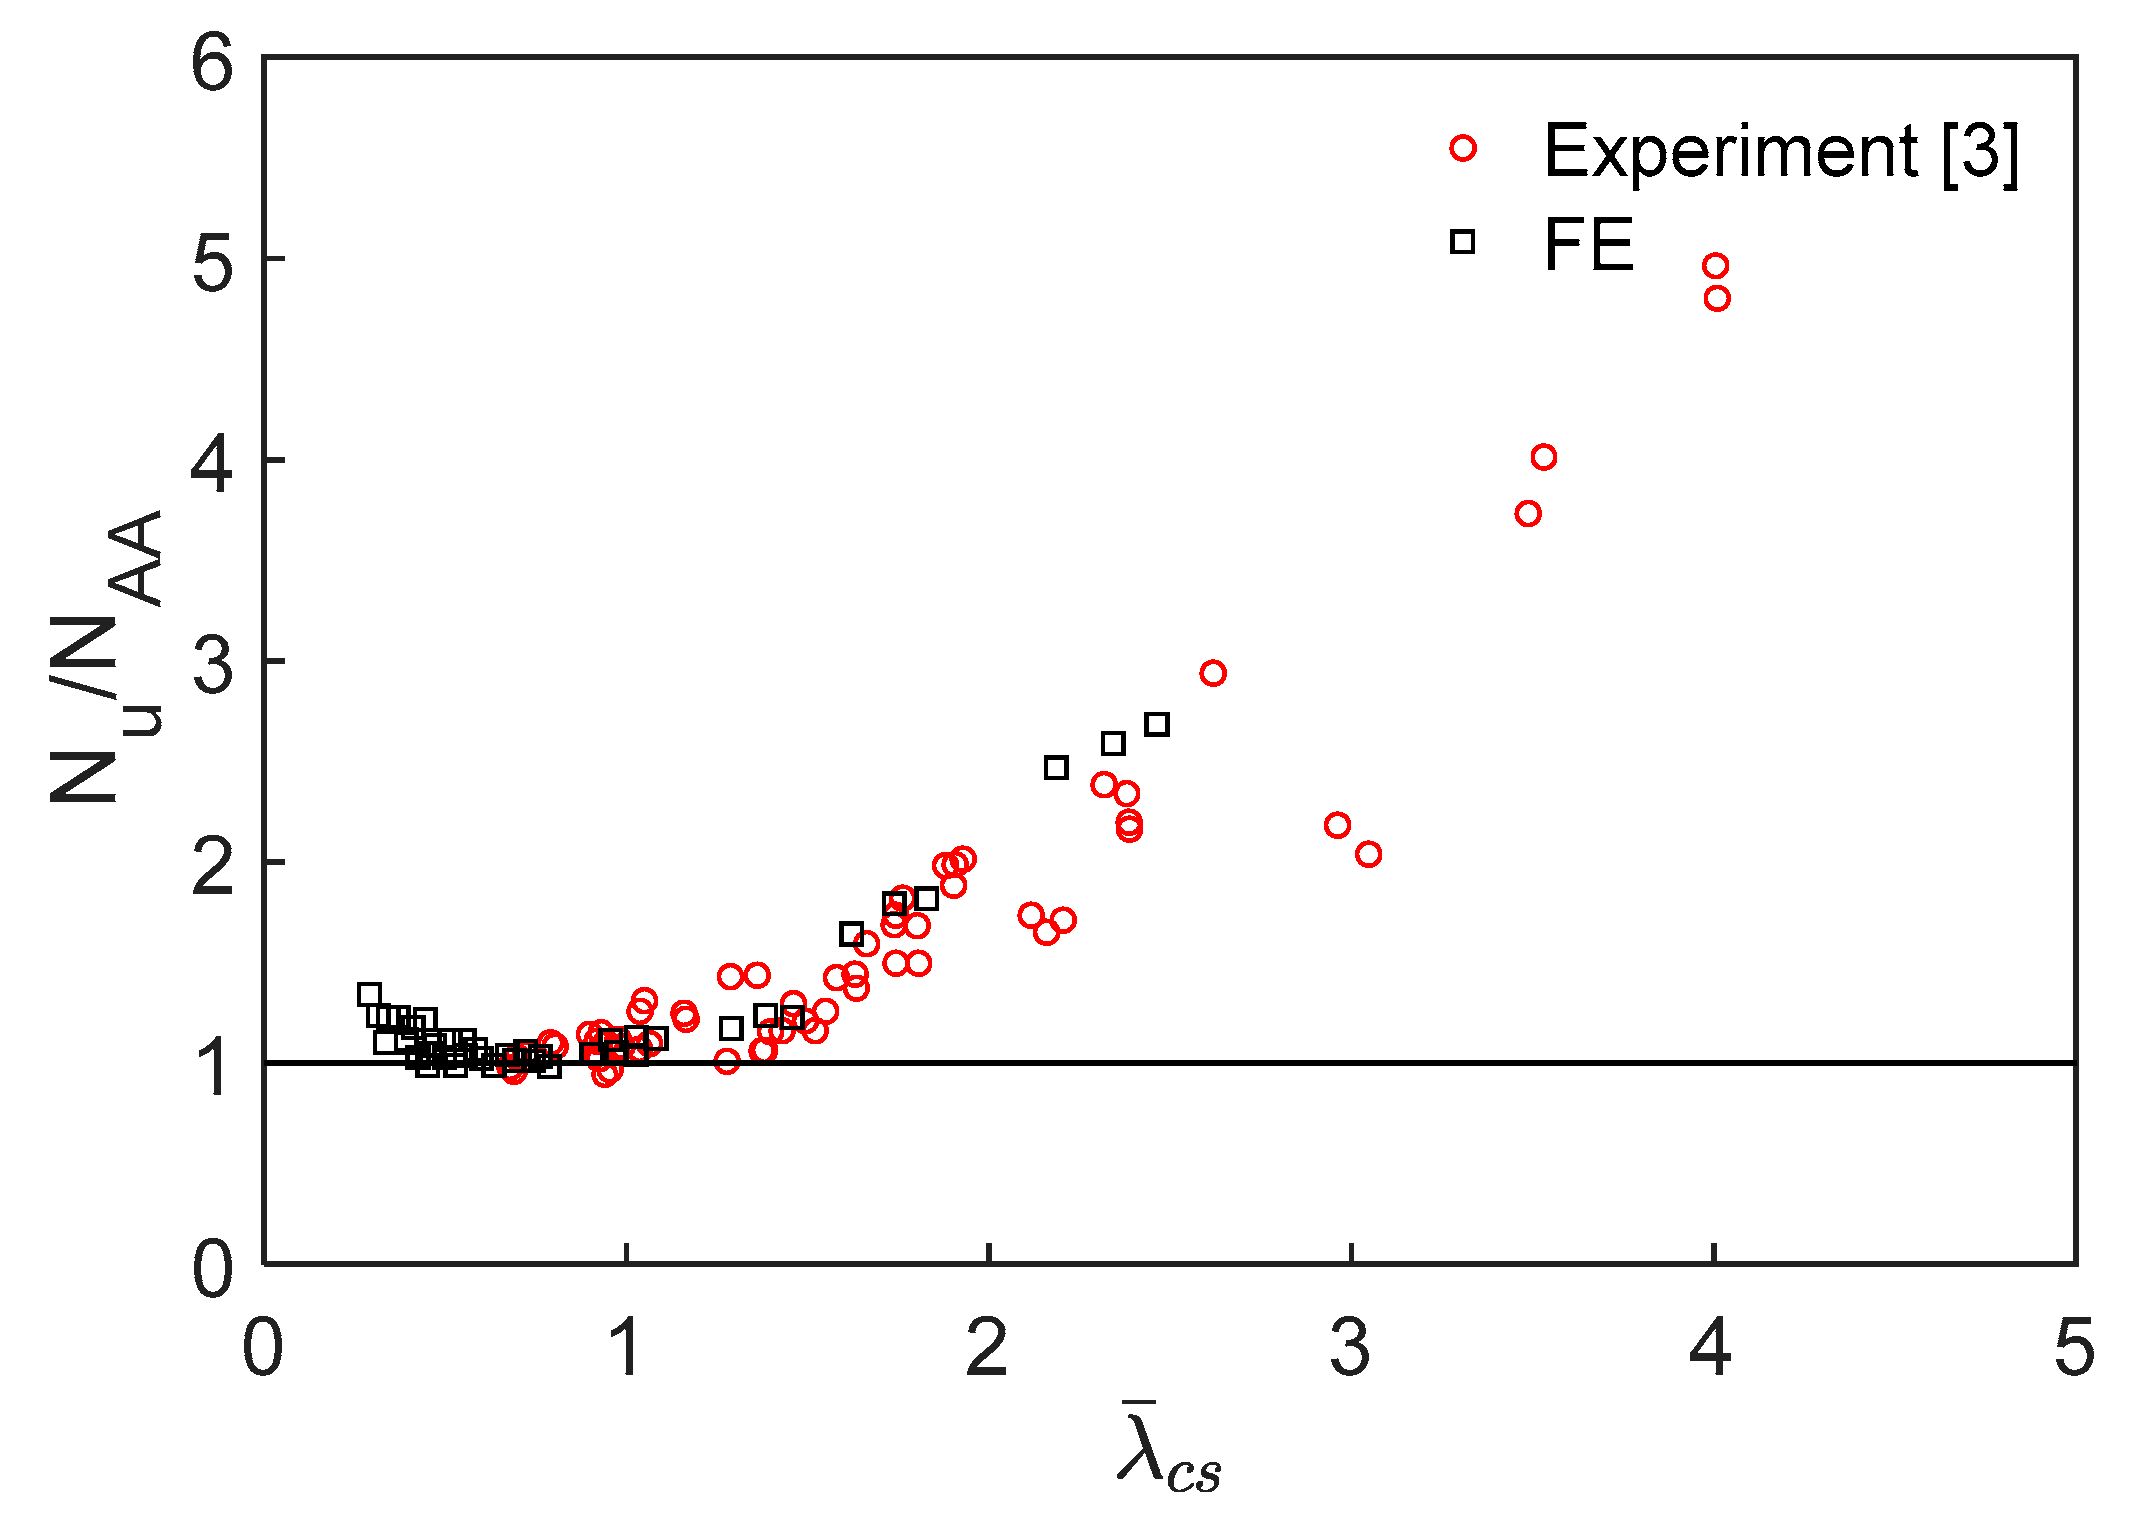
Τhe ultimate-to-predicted Nu/NAA strength ratios are plotted against the non-dimensional cross-sectional slenderness (calculated according to Section 4.3) in Figure 11. It can be seen that the AA design strength predictions for cross-sections with low slenderness are slightly conservative. However, the apparent scattering and pronounced lack of accuracy exhibited for cross-sections with large slenderness denote the significant underestimation and inconsistency provided by the AA [6] design specification.
4.3. Continuous Strength Method
The CSM is a deformation-based design approach allowing for a rational exploitation of material strain hardening in the design of stainless steel cross-sections [39,40,41]. The CSM was also extended to aluminium alloy cross-sections [42,43]. According to the CSM for aluminium cross-sections, the maximum attainable strain εCSM, of the cross-section is determined from an experimentally derived base curve based on the non-dimensional slenderness (Equations (9)–(11)). Consequently, this method provides explicit information about the deformation required to achieve the design cross-sectional resistance, i.e., cross-sectional ductility. Note that is the limiting slenderness which defines the transition between stocky cross-sections, i.e., those which benefit from material strain hardening and fail due to inelastic local buckling, and slender cross-sections, i.e., those in which no benefit arises from material strain hardening and fail due to elastic local buckling.
where εu is the strain corresponding to ultimate tensile stress and is the non-dimensional slenderness, taken from Equations (10) and (11), respectively.
where fu is the ultimate tensile stress.
where fcr is the elastic critical buckling stress of the cross-section accounting for the element interaction. It can be determined using either proposed analytical formulae [44] or numerical tools, such as CUFSM [45]. Herein, the fcr of each examined cross-section is calculated using the analytical formulae proposed by [40] as given by Equations (12) and (13).
where ν is the Poisson’s ratio equal to 0.3 for aluminium alloys and kw is the local plate buckling coefficient considering the boundary and loading conditions which is evaluated by Equation (13).
where α is the web depth and b is the flange width calculated based on centreline geometry.
To represent the nonlinear material stress-strain response, the CSM adopts a bilinear strain hardening material model where the strain hardening modulus Esh is calculated from Equation (14).
Upon determination of the maximum attainable strain εCSM and the strain hardening modulus Esh the cross-sectional resistance NCSM can be computed from Equation (15).
where σCSM is the CSM design stress given from Equation (16) for stocky cross-sections where the maximum attainable strain εCSM is greater than or equal to the yield strain ε0.2 (εCSM/ε0.2 ≥ 1.0), and for slender cross-sections where the maximum attainable strain εCSM is less than the yield strain ε0.2 (εCSM/ε0.2 < 1.0).
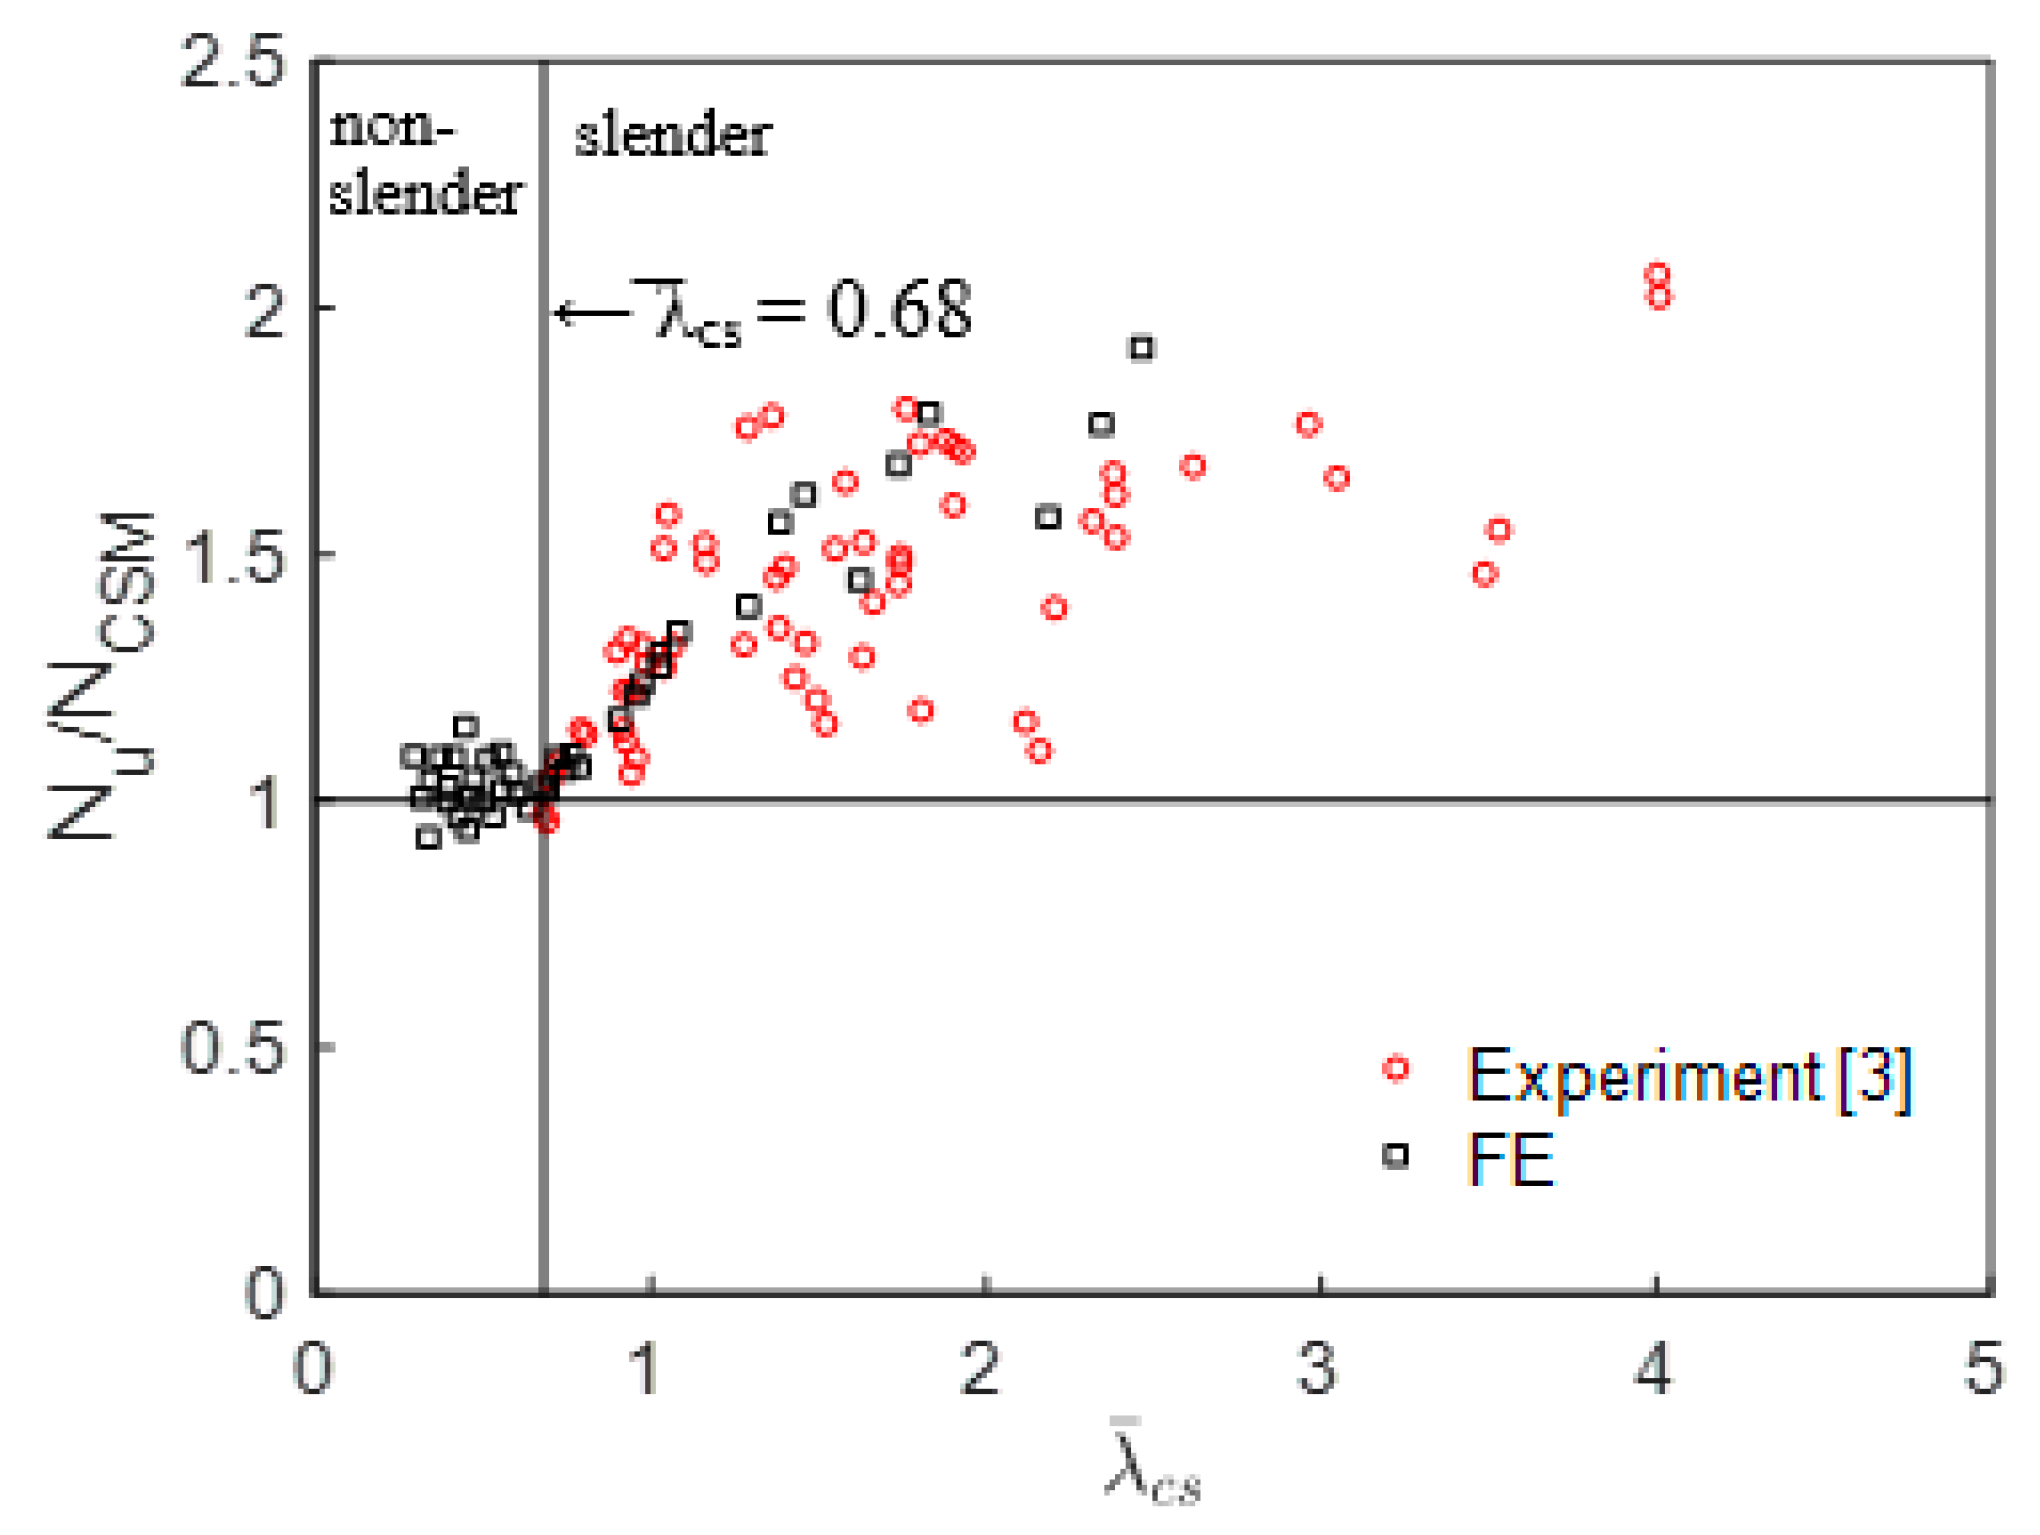
Figure 12 displays the ultimate-to-predicted Nu/NCSM strength ratios versus the non-dimensional cross-sectional slenderness . Compared to EC9 and AA, it can be observed that the CSM offers more accurate design strength predictions for stocky cross-sections. However, for slender cross-sections the CSM design strength predictions appear to be quite conservative and scattered.
4.4. Direct Strength Method
Aiming to overcome the cumbersome nature of the traditional effective width method in the design of cold-formed carbon steel cross-sections with complex geometrical shapes, Schafer and Peköz [46,47] proposed the DSM. The DSM is codified in Section E3.2.1 of [9] as an alternative and simplified design method for prediction of the cross-sectional resistance of cold-formed carbon steel cross-sections subjected to concentric axial compression. This method utilises the cross-sectional slenderness and adopts a “strength curve” allowing to directly obtain the cross-sectional resistance NDSM of a slender cross-section ( > 0.776). In case of a non-slender cross-section ( ≤ 0.776), the cross-sectional resistance NDSM equals to the yield strength of the cross-section. Equation (17) provides NDSM for these two cases:
where is the critical elastic local column buckling load and σcr is the elastic critical buckling stress of the cross-section as explained in Section 4.3.
The ultimate-to-predicted Nu/NDSM strength ratios are plotted against the non-dimensional cross-sectional slenderness in Figure 13. As can be observed, most data are above the threshold line of 1.0 suggesting generally safe design strength predictions.
4.5. Proposal for Modified Direct Strength Method
A modified DSM is proposed aiming to improve the accuracy of the design strength predictions for aluminium alloy angle sections. The modified design criteria were based on a numerical optimisation procedure so that the best agreement between the design strength predictions and the FE results and the reported test data [3] to be obtained. Thus, in Equation (17) the value of the exponent 0.4 was modified to 0.25, whilst the value of the coefficient 0.15 was adjusted to 0.10. Moreover, the limit value for the non-dimensional slenderness was altered from 0.776 to 0.90 to make smoother the transition between elastic and inelastic compressive strengths.
The compressive strength NDSM-M according to modified DSM is given in the following equation:
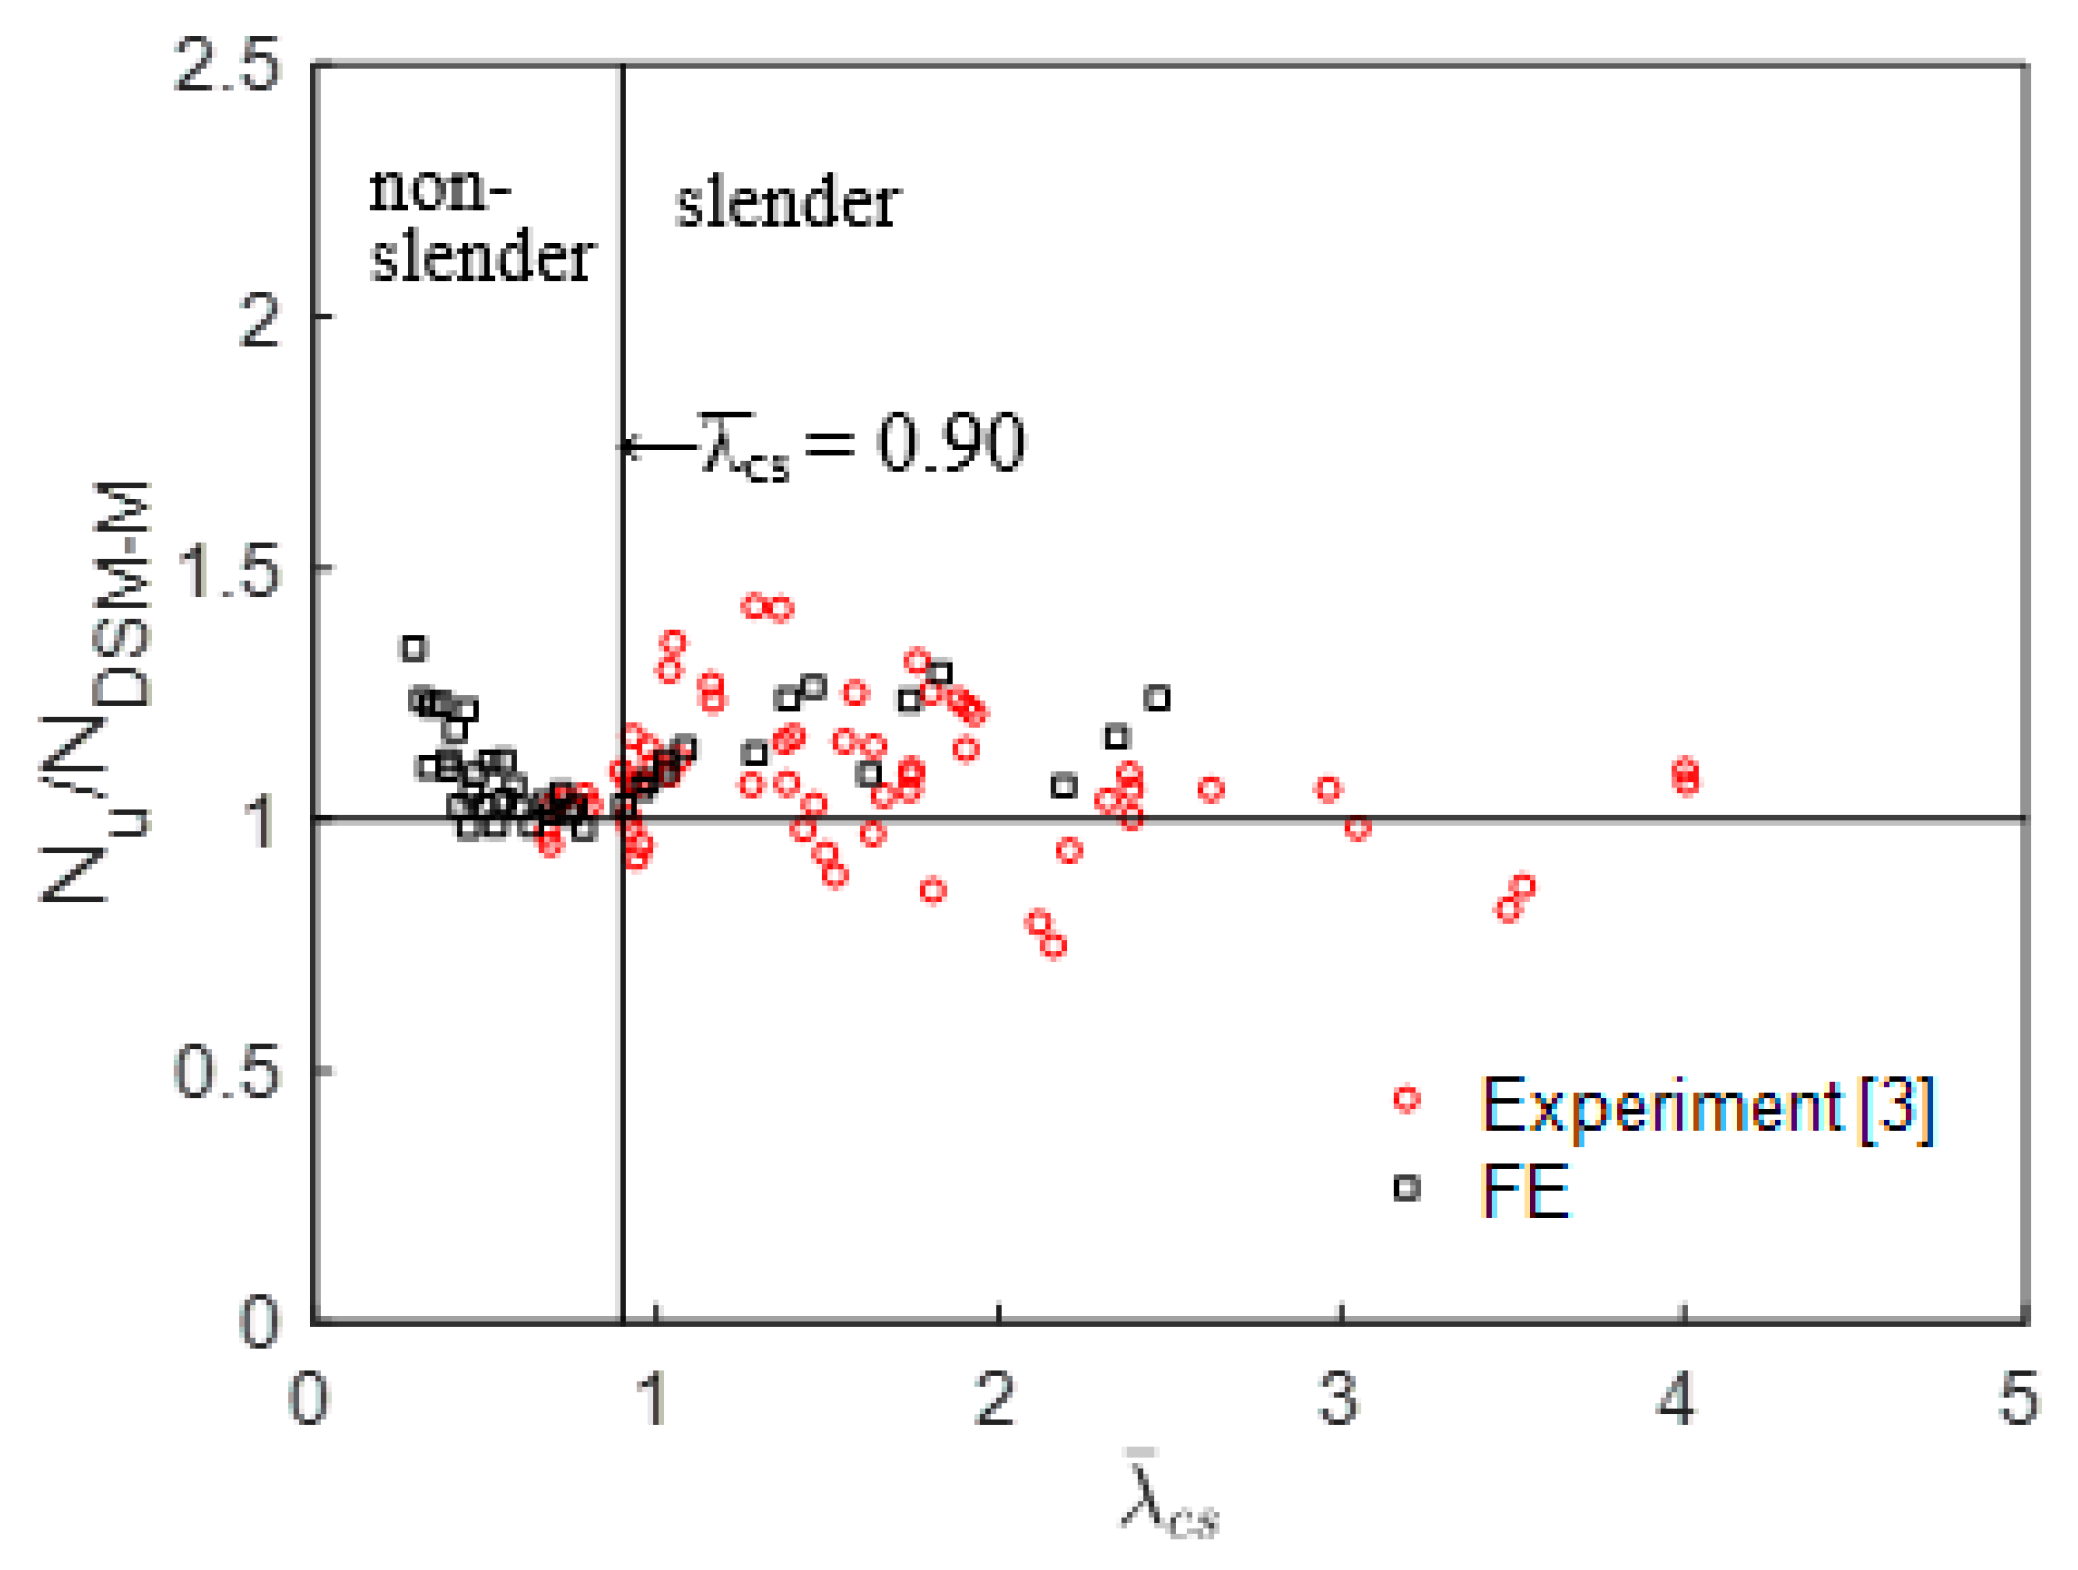
To assess graphically the accuracy level of the modified DSM design equation, the Nu/NDSM-M ratios are plotted against the non-dimensional slenderness in Figure 14. As can be observed, the Nu/NDSM-M ratios are closer to the threshold line of 1.0 than the corresponding Nu/NEC9, Nu/NAA, Nu/NCSM and Nu/NDSM ratios (in Section 4.1, Section 4.2, Section 4.3, Section 4.4) suggesting improved design accuracy.
4.6. Assessment of Design Strength Predictions
To further assess the applicability and accuracy of the international design specifications and methods, the ultimate strengths Nu obtained by the numerical analyses of this study and by the experiments on [3] were compared with the strengths Npred predicted by EC9 [5], AA [6], the CSM [8], the DSM [9] and the modified DSM. The calculated mean and COV values for the Nu/Npred ratios are summarised in Table 5 altogether and separately for the examined stocky and slender cross-sections. A mean value of Nu/Npred ratio higher than unity means that the experimental/numerical strength values are higher that the corresponding design ones and hence the latter provide conservative predictions. On the contrary, a lower than unity Nu/Npred ratio suggests that the design strength predictions are unsafe, while a ratio closer to unity implies accurate design strength predictions. The COV, which is defined as ratio of the standard deviation to the mean values of the Nu/Npred, is used to evaluate the scatter of the Nu/Npred ratios. Lower COV values denote less scattered and thus more reliable design strength predictions.
As can be seen from Table 5, for stocky cross-sections, all design codes and methods addressed herein provide safe strength predictions, as the Nu/Npred ratios are higher than unity. Particularly, EC9 [5] specification provides the most conservative design strength predictions with mean Nu/NEC9 ratio of 1.11 and a corresponding COV value of 0.09. Similar scatter is reported for AA [6], DSM [9] and the modified DSM strength predictions, but the corresponding mean Nu/NAA, Nu/NDSM and Nu/NDSM-M ratios of 1.10, 1.08 and 1.08 respectively, denote slightly improved design accuracy. The most precise and consistent design strength predictions for stocky cross-sections are provided by the CSM [8] with mean Nu/NCSM value equal to 1.03 and corresponding COV equal to 0.05.
Regarding the slender cross-sections, the comparisons suggest that the design strength predictions are safe but consistently conservative, significantly underestimating the compressive strength. Particularly, for EC9 [5] strength predictions, the resulted mean and COV values of Nu/NEC9 ratio are 1.22 and 0.12, respectively. DSM [9] exhibits slightly more accurate but more scattered predictions with mean Nu/NDSM ratio and corresponding COV value of 1.24 and 0.13, respectively. Lack of accuracy and consistency is more pronounced in case of the CSM [8] which exhibits mean Nu/NCSM ratio and corresponding COV value of 1.42 and 0.18, respectively. The AA [6] design strength predictions present the highest degree of conservatism and scatter with mean Nu/NAA ratio and a corresponding COV value of 2.03 and 0.44, respectively. The undue conservatism and scatter could be attributed to the unrealistic small design failure stresses suggested by the code. For example, the calculated design failure stress for the stub column L26B [3] is equal to 9.2% of the corresponding yield stress. Therefore, modifications should be made resulting in more rational design failure stress values for slender cross-sections. It can be seen that the modified DSM provides 12% more accurate and 15% more consistent strength predictions for slender cross-sections () compared to the current DSM [9], decreasing the overall mean Nu/NDSM ratio from 1.19 to 1.09 and the corresponding COV from 0.13 to 0.11.
Overall, for both stocky and slender angle sections, the design specifications and methods assessed in the current study were found to provide safe but quite conservative strength predictions (mean Nu/Npred ratios ranging from 1.09–1.48). Moreover, the predicted strengths exhibit different degrees of consistency with the calculated COV values ranging from 0.11–0.50. The proposed modified DSM [9] yields the most accurate and consistent design predictions with overall mean Nu/NDSM-M ratio of 1.09 and corresponding COV of 0.11.
4.7. Reliability Analyses
A series of reliability analyses were performed to evaluate the safety level of the examined design codes and methods, using the index β as an indicator of the design safety level. The employed methodology to calculate the index β is detailed in Section 1.3.2 of Appendix 1 of Part I in [6]. The design rules are deemed reliable whether the index β is greater or equal to 2.5, a target value for aluminium alloy columns specified in [6]. The load combination of 1.35DL + 1.5LL was employed for EC9 [5] and 1.2DL + 1.6LL for AA [6], CSM [8], DSM [9] and the modified DSM, where DL and LL are the dead and live loads, respectively, in line with [6]. The resistance factor φ is determined depending on the design code or method and the corresponding structural scenario being under consideration. Therefore, φ was taken as 0.91 (1/γΜ1, where γΜ1 = 1.1 is the partial safety factor for ultimate limit states of EC9 [5]) for EC9 [5] and 0.90 for AA [6], CSM [8], DSM [9] and the modified DSM. Moreover, the statistical parameters Mm, Fm, VM and VF regarding the material properties and fabrication processes were adopted from [6], where Mm = 1.0 or 1.10 for behaviour governed by the yield or ultimate stress, respectively, Vm = 0.06, Fm = 1.0 and VF = 0.05. Pm and Vp are the statistical parameters corresponding to the mean and COV values of the Nu/Npred ratio which are listed in Table 5. A correction factor is, also, used to consider the influence of the number of results n.
The evaluated reliability indices β for EC9 [5], CSM [8] and DSM [9] are 3.38, 2.82 and 2.84, respectively, which are greater than the target value of 2.50 indicating that these design rules provide reliable design strength predictions. Conversely, the resulted reliability index β for AA [6] is 1.71 and lower than the target value of 2.5 suggesting that this specification is not safe for the design of aluminium alloy angles under axial compression. Finally, the obtained reliability index β of 2.61 for the modified DSM demonstrates reliable strength predictions being closer to the target value of 2.5 compared to the current DSM [9]. This coupled with the improved design accuracy provided by the modified DSM encourages the potential of using this method for the design of aluminium alloy angle sections subjected to axial compression.
5. Conclusions
A comprehensive numerical study on the structural response of aluminium alloy angle sections has been carried out. FE models were developed in ABAQUS considering material and geometrical nonlinearities. Upon successful validation against experimental results, a thorough parametric study was executed to investigate the influence of the cross-sectional aspect ratio, cross-sectional slenderness and aluminium alloy type-high (6082-T6) and normal (6063-T5) strength- on the cross-sectional behaviour of aluminium alloy angles. It was found that the 6063-T5 cross-sections achieved higher normalised ultimate compressive loads compared to the corresponding 6082-T6 counterparts owing to their more favourable strain hardening properties and ductility. Moreover, the generated numerical results along with literature test data were utilised to assess the applicability and accuracy of the design formulae provided by EC9, AA, CSM and DSM. Relative comparisons showed that the design specifications provide safe but quite conservative strength predictions. A modified DSM was also proposed improving the design accuracy and consistency by 12% and 15%, respectively. Finally, reliability analyses demonstrated safety for all design methods except for AA, which failed to meet the target reliability level. Concluding, additional experimental work on equal-leg and non-equal leg aluminium alloy angle sections is recommended to further verify the suitability of the proposed modified DSM. Finally, studies to investigate and better understand the behaviour of aluminium angle sections under various loading scenarios (tension, shear, compression, combined loading) are also recommended.
Author Contributions
Conceptualization, E.G.; methodology, E.G.; software, E.G.; validation, E.G.; formal analysis, E.G.; investigation, E.G.; writing—original draft preparation, E.G.; review, M.G. and G.S.K.; supervision, M.G. and G.S.K. All authors have read and agreed to the published version of the manuscript.
Funding
This research received no external funding.
Data Availability Statement
Not applicable.
Acknowledgments
The financial support of the Faculty of Engineering and Technology of Liverpool John Moores University is gratefully acknowledged.
Conflicts of Interest
The authors declare no conflict of interest.
References
- All about Aluminium. Aluminium in Construction. Available online: https://www.aluminiumleader.com/application/construction/ (accessed on 30 May 2021).
- Georgantzia, E.; Gkantou, M.; Kamaris, G.S. Aluminium alloys as structural material: A review of research. Eng. Struct. 2021, 227, 111372. [Google Scholar] [CrossRef]
- Mazzolani, F.M.; Piluso, V.; Rizzano, G. Local Buckling of Aluminum Alloy Angles under Uniform Compression. J. Struct. Eng. 2011, 137, 173–184. [Google Scholar] [CrossRef]
- Wang, Y.Q.; Wang, Z.X.; Hu, X.G.; Han, J.K.; Xing, H.J. Experimental study and parametric analysis on the stability behavior of 7A04 high-strength aluminum alloy angle columns under axial compression. Thin Walled Struct. 2016, 108, 305–320. [Google Scholar] [CrossRef]
- European Committee for Standarization (EC9). Eurocode 9: Design of Aluminium Structures. Part 1-1: General Structural Rules—General Structural Rules and Rules for Buildings; BS EN 1999-1-1:2007, CEN:2007. BSI; European Committee for Standarization (EC9): Brussels, Belgium, 2007. [Google Scholar]
- The Aluminum Association (AA). Aluminum Design Manual; The Aluminum Association (AA): Washington, DC, USA, 2020. [Google Scholar]
- Hibbit, Karlsson, Sorensen. ABAQUS: Theory Manual. Providence, RI (USA); Dassault Systemes Corporation: Vélizy-Villacoublay, France, 2018. [Google Scholar]
- Zhao, O.; Gardner, L. The continuous strength method for the design of mono-symmetric and asymmetric stainless steel cross-sections in bending. J. Constr. Steel Res. 2018, 150, 141–152. [Google Scholar] [CrossRef]
- North American Specification for the Design of Cold-Formed Steel Structural Members; American Iron and Steel Institute (AISI): Washington, DC, USA, 2016.
- Ziemian, R.D. Guide to Stability Design Criteria for Metal Structures, 6th ed.; John Wiley & Sons: Hoboken, NJ, USA, 2010. [Google Scholar]
- Inoue, T.; Orihara, S.; Nishiyama, I.; Kuwamura, H. Stress-strain relations of cruciform section stub-columns. AIJ J. Struct. Eng. 1989, 35B, 323–336. [Google Scholar]
- Hopperstad, O.S.; Langseth, M.; Hanssen, L. Ultimate compressive strength of plate elements in aluminium: Correlation of finite element analyses and tests. Thin Walled Struct. 1997, 29, 31–46. [Google Scholar] [CrossRef]
- Hopperstad, O.S.; Langseth, M.; Tryland, T. Ultimate strength of aluminium alloy outstands in compression: Experiments and simplified analysis. Thin Walled Struct. 1999, 34, 279–294. [Google Scholar] [CrossRef]
- Galambos, T.V. Guide to Stability Design Criteria for Metal Structures, 5th ed.; Wiley: New York, NY, USA, 1998. [Google Scholar]
- Georgantzia, E.; Gkantou, M.; Kamaris, G.S.; Kansara, K.; Hashim, K. Aluminium alloy cross-sections under uniaxial bending and compression: A numerical study. IOP Conf. Ser. Mater. Sci. Eng. 2021, 1058, 012011. [Google Scholar] [CrossRef]
- Georgantzia, E.; Gkantou, M. Flexural buckling of concrete-filled aluminium alloy CHS columns: Numerical modelling and design. In Proceedings of the 3rd International Conference on Trends and Recent Advances in Civil Engineering, Uttar Pradesh, Noida, India, 20–21 August 2020; pp. 697–707. [Google Scholar]
- Gkantou, M. Numerical study of aluminium alloy square hollow section columns. In Proceedings of the 3rd International Conference on Trends and Recent Advances in Civil Engineering, Uttar Pradesh, Noida, India, 20–21 August 2020; pp. 709–717. [Google Scholar]
- Gkantou, M.; Bock, M.; Theofanous, M. Design of stainless steel cross-sections with outstand elements under stress gradients. J. Constr. Steel Res. 2021, 179, 106491. [Google Scholar] [CrossRef]
- Wang, J.; Afshan, S.; Gkantou, M.; Theofanous, M.; Baniotopoulos, C.; Gardner, L. Flexural behaviour of hot-finished high strength steel square and rectangular hollow sections. J. Constr. Steel Res. 2016, 121, 97–109. [Google Scholar] [CrossRef] [Green Version]
- Gkantou, M.; Antoniou, N.; Theofanous, M.; Baniotopoulos, C. Compressive behaviour of high-strength steel cross-sections. Struct. Build. 2017, 170, 1–12. [Google Scholar] [CrossRef]
- Young, B.; Ellobody, E. Buckling Analysis of Cold-Formed Steel Lipped Angle Columns. J. Struct. Eng. 2005, 131, 1570–1579. [Google Scholar] [CrossRef]
- Ellobody, E.; Young, B. Behavior of Cold-Formed Steel Plain Angle Columns. J. Struct. Eng. 2005, 131, 457–466. [Google Scholar] [CrossRef]
- Zhang, L.; Tan, K.; Zhao, O. Experimental and numerical studies of fixed-ended cold-formed stainless steel equal-leg angle section columns. Eng. Struct. 2019, 184, 134–144. [Google Scholar] [CrossRef]
- Zhang, L.; Tan, K.; Zhao, O. Press-braked S690 high strength steel equal-leg angle and plain channel section stub columns: Testing, numerical simulation and design. Eng. Struct. 2019, 201, 109764. [Google Scholar] [CrossRef]
- Yun, X.; Wang, Z.; Gardner, L. Full-Range Stress—Strain Curves for Aluminum Alloys. J. Struct. Eng. 2021, 147, 04021060. [Google Scholar] [CrossRef]
- Liu, M.; Zhang, L.; Wang, P.; Chang, Y. Experimental investigation on local buckling behaviors of stiffened closed-section thin-walled aluminum alloy columns under compression. Thin Walled Struct. 2015, 94, 188–198. [Google Scholar] [CrossRef]
- Guy, O.A.; Feng, F.; Wang, Y.; Zhai, X. Structures Stability of 6082-T6 aluminium alloy columns with H-section and rectangular hollow sections. Thin Walled Struct. 2015, 89, 1–16. [Google Scholar]
- Ramberg, W.; Osgood, W.R. Description of Stress-Strain Curves by Three Parameters; Volume Technical; National Advisory Committe for Aeronautics: Washington, DC, USA, 1943. [Google Scholar]
- Hill, H.N.; Clark, J.W.; Brungraber, R.J. Design of welded aluminum structures. J. Struct. Div. ASCE 1960, 86, 101–124. [Google Scholar] [CrossRef]
- Wang, F.; Zhao, O.; Young, B. Testing and numerical modelling of S960 ultra-high strength steel angle and channel section stub columns. Eng. Struct. 2020, 204, 109902. [Google Scholar] [CrossRef]
- Georgantzia, E.; Bin Ali, S.; Gkantou, M.; Kamaris, G.S.; Kansara, K.; Atherton, W. Flexural buckling performance of concrete-filled aluminium alloy tubular columns. Eng. Struct. 2021, 242, 112546. [Google Scholar] [CrossRef]
- Zhu, J.H.; Li, Z.Q.; Su, M.N.; Young, B. Behaviour of aluminium alloy plain and lipped channel columns. Thin Walled Struct. 2019, 135, 306–316. [Google Scholar] [CrossRef] [Green Version]
- Wang, Y.Q.; Yuan, H.X.; Chang, T.; Du, X.X.; Yu, M. Compressive buckling strength of extruded aluminium alloy I-section columns with fixed-pinned end conditions. Thin Walled Struct. 2017, 119, 396–403. [Google Scholar] [CrossRef]
- Mazzolani, F.M. Aluminum Alloy Structures, 2nd ed.; E& FN Spon: London, UK, 1995. [Google Scholar]
- Feng, R.; Liu, J. Numerical investigation and design of perforated aluminium alloy SHS and RHS columns. Eng. Struct. 2019, 199, 109591. [Google Scholar] [CrossRef]
- Wang, F.; Young, B.; Gardner, L. Compressive testing and numerical modelling of concrete- filled double skin CHS with austenitic stainless steel outer tubes. Thin Walled Struct. 2019, 141, 345–359. [Google Scholar] [CrossRef]
- Zhu, J.H.; Li, Z.Q.; Su, M.N.; Young, B. Numerical study and design of aluminium alloy channel section columns with welds. Thin Walled Struct. 2019, 139, 139–150. [Google Scholar] [CrossRef]
- Su, M.N.; Young, B.; Gardner, L. Flexural response of aluminium alloy SHS and RHS with internal stiffeners. Eng. Struct. 2016, 121, 170–180. [Google Scholar] [CrossRef]
- Gardner, L.; Theofanous, M. Discrete and continuous treatment of local buckling in stainless steel elements. J. Constr. Steel Res. 2008, 64, 1207–1216. [Google Scholar] [CrossRef]
- Afshan, S.; Gardner, L. The continuous strength method for structural stainless steel design. Thin Walled Struct. 2013, 68, 42–49. [Google Scholar] [CrossRef] [Green Version]
- Zhao, O.; Afshan, S.; Gardner, L. Structural response and continuous strength method design of slender stainless steel cross-sections. Eng. Struct. 2017, 140, 14–25. [Google Scholar] [CrossRef] [Green Version]
- Su, M.N.; Young, B.; Gardner, L. The continuous strength method for the design of aluminium alloy structural elements. Eng. Struct. 2016, 122, 338–348. [Google Scholar] [CrossRef]
- Su, M.N.; Young, B.; Gardner, L. Testing and design of aluminum alloy cross sections in compression. J. Struct Eng. 2014, 140, 04014047. [Google Scholar] [CrossRef] [Green Version]
- Seif, M.; Schafer, B.W. Local buckling of structural steel shapes. J. Constr. Steel Res. 2010, 66, 1232–1247. [Google Scholar] [CrossRef]
- Li, Z.; Schafer, B.W. Buckling analysis of cold-formed steel members with general boundary conditions using CUFSM: Conventional and constrained finite strip methods. In Proceedings of the 20th International Specialty Conference on Cold-Formed Steel Structures, St. Louis, MI, USA, 3 November 2010. [Google Scholar]
- Schafer, B.W.; Peköz, T. Direct strength prediction of cold-formed steel members using numerical elastic buckling solutions. In Proceedings of the International Specialty Conference on Cold-Formed Steel Structures, St. Louis, MI, USA, 15–16 October 1998; pp. 69–76. [Google Scholar]
- Schafer, B.W. Review: The Direct Strength Method of cold-formed steel member design. J. Constr. Steel Res. 2008, 64, 766–778. [Google Scholar] [CrossRef]
Figure 1.
Cross-section geometry and adopted notation for angles.

Figure 2.
Geometry of a typical stub column model and applied boundary conditions and constraints.

Figure 3.
Comparison between typical numerical and experimental [3] response curves.
Figure 3.
Comparison between typical numerical and experimental [3] response curves.

Figure 4.
Stress-strain responses of 6063-T5 [38] and 6082-T6 [31] aluminium alloys adopted in parametric study.

Figure 5.
Deformed shapes (top), stress distribution patterns (middle) and longitudinal displacement patterns (bottom) at failure load for typical 6063-T5 cross-sections.
Figure 5.
Deformed shapes (top), stress distribution patterns (middle) and longitudinal displacement patterns (bottom) at failure load for typical 6063-T5 cross-sections.

Figure 6.
Typical normalised stress-strain responses for 6082-T6 cross-sections with thickness t = 10 mm and different aspect ratios a/b.
Figure 6.
Typical normalised stress-strain responses for 6082-T6 cross-sections with thickness t = 10 mm and different aspect ratios a/b.

Figure 7.
Typical normalised stress-strain responses for 6082-T6 cross-sections with a/b = 1.0 and different slenderness β/ε.
Figure 7.
Typical normalised stress-strain responses for 6082-T6 cross-sections with a/b = 1.0 and different slenderness β/ε.

Figure 8.
Normalised maximum stresses σu/σ0.2 versus slenderness β/ε.

Figure 9.
Typical normalised stress-strain responses for 6082-T6 and 6063-T5 cross-sections with a/b = 1.5 and different slenderness β/ε.
Figure 9.
Typical normalised stress-strain responses for 6082-T6 and 6063-T5 cross-sections with a/b = 1.5 and different slenderness β/ε.

Figure 10.
Assessment of EC9 design strength predictions.

Figure 11.
Assessment of AA design strength predictions.

Figure 12.
Assessment of CSM design strength predictions.

Figure 13.
Assessment of DSM design strength predictions.

Figure 14.
Assessment proposed modified DSM design strength predictions.


Table 1.
Summary of reported results for angle section stub columns [3].
Table 1.
Summary of reported results for angle section stub columns [3].
| Specimen | α (mm) | b (mm) | tα (mm) | tb (mm) | L (mm) | E (MPa) | σ0.1 (MPa) | σ0.2 (MPa) | σt (MPa) | n |
|---|---|---|---|---|---|---|---|---|---|---|
| L4A | 43.55 | 22.25 | 3.10 | 3.00 | 141.00 | 64,863 | 217.20 | 222.50 | 244.80 | 28.90 |
| L5A | 43.05 | 32.80 | 4.00 | 4.00 | 130.00 | 70,211 | 169.90 | 175.70 | 202.90 | 20.60 |
| L6A | 42.45 | 42.25 | 4.30 | 4.15 | 152.95 | 64,090 | 198.10 | 202.06 | 225.20 | 30.60 |
| L8A | 45.30 | 43.75 | 2.95 | 2.95 | 134.40 | 64,863 | 217.20 | 222.50 | 244.80 | 28.90 |
| L9A | 39.25 | 17.25 | 3.95 | 3.85 | 119.50 | 69,329 | 184.00 | 188.90 | 212.40 | 26.80 |
| L10A | 32.95 | 22.55 | 4.00 | 3.85 | 105.25 | 70,211 | 169.90 | 175.70 | 202.90 | 20.60 |
| L11A | 37.00 | 36.95 | 4.00 | 3.90 | 120.00 | 69,329 | 184.00 | 188.90 | 212.40 | 26.80 |
| L13A | 60.25 | 33.00 | 4.00 | 4.00 | 178.20 | 70,211 | 169.90 | 175.70 | 202.90 | 20.60 |
| L14A | 38.85 | 37.80 | 1.90 | 1.95 | 108.20 | 65,125 | 182.10 | 186.70 | 203.90 | 27.50 |
| L15A | 38.90 | 26.10 | 1.90 | 2.00 | 120.65 | 65,125 | 182.10 | 186.70 | 203.90 | 27.50 |
| L16A | 41.45 | 30.00 | 3.00 | 3.20 | 139.60 | 70,873 | 209.80 | 217.40 | 242.50 | 19.50 |
| L17A | 93.75 | 19.00 | 4.00 | 4.00 | 265.20 | 68,796 | 212.40 | 224.60 | 255.50 | 13.50 |
| L18B | 53.10 | 40.10 | 2.45 | 2.45 | 146.10 | 62,761 | 229.40 | 234.60 | 258.90 | 31.30 |
| L20A | 42.90 | 23.50 | 4.30 | 4.10 | 146.60 | 64,090 | 198.10 | 202.06 | 225.20 | 30.60 |
| L21A | 47.70 | 34.10 | 5.85 | 5.85 | 143.00 | 65,321 | 286.00 | 293.50 | 323.70 | 26.90 |
| L24A | 77.50 | 72.85 | 2.00 | 2.00 | 239.00 | 65,125 | 182.10 | 186.70 | 203.90 | 27.50 |
| L25B | 52.20 | 39.50 | 1.90 | 1.85 | 167.80 | 65,125 | 182.10 | 186.70 | 203.90 | 27.50 |
| L26A | 77.00 | 38.35 | 2.00 | 1.90 | 219.35 | 65,125 | 182.10 | 186.70 | 203.90 | 27.50 |
| L30A | 79.70 | 70.65 | 4.00 | 4.10 | 242.00 | 71,733 | 189.20 | 194.20 | 220.30 | 26.80 |
| L32A | 59.55 | 47.10 | 5.85 | 5.75 | 175.75 | 65,321 | 286.00 | 293.50 | 323.70 | 26.90 |
Table 2.
Comparison between experimental [3] and numerical ultimate loads.
Table 2.
Comparison between experimental [3] and numerical ultimate loads.
| Specimen | Nu,Exp (kN) | Nu,FE (kN) | Νu,Exp/Nu,FE |
|---|---|---|---|
| L4A | 34.94 | 35.49 | 0.98 |
| L5A | 51.15 | 50.20 | 1.02 |
| L6A | 65.25 | 67.28 | 0.97 |
| L8A | 38.17 | 37.53 | 1.02 |
| L9A | 38.92 | 37.85 | 1.03 |
| L10A | 37.05 | 36.03 | 1.03 |
| L11A | 54.79 | 54.68 | 1.00 |
| L13A | 50.83 | 49.88 | 1.02 |
| L14A | 15.04 | 15.45 | 0.97 |
| L15A | 16.58 | 17.05 | 0.97 |
| L16A | 51.54 | 50.10 | 1.03 |
| L17A | 51.23 | 54.88 | 0.93 |
| L18B | 30.73 | 33.63 | 0.91 |
| L20A | 50.79 | 51.69 | 0.98 |
| L21A | 142.18 | 138.26 | 1.03 |
| L24A | 21.48 | 21.29 | 1.01 |
| L25B | 17.66 | 18.13 | 0.97 |
| L26A | 18.43 | 19.04 | 0.97 |
| L30A | 81.21 | 83.04 | 0.98 |
| L32A | 176.18 | 168.69 | 1.04 |
| mean | 0.99 | ||
| COV | 0.03 |
Table 3.
List of examined parameters in parametric studies.
| Total FE Analyses: 42 | |
|---|---|
| 2 aluminium alloys | 6063-T5 6082-T6 |
| 3 aspect ratios α/b (α × b) | 1.0 (120 × 120), L = 360 mm 1.5 (120 × 80), L = 360 mm 2.0 (120 × 60), L = 360 mm |
| 7 thicknesses ta = tb (mm) | 6, 10, 14, 18, 22, 26, 30 |
| Resulting slenderness | |
| β/ε: 2.43–20.39 | |
| : 0.29–2.46 |
Table 4.
Material properties of 6063-T5 [38] and 6082-T6 [31] aluminium alloys adopted in parametric study.
| E (MPa) | σ0.2 (MPa) | σt (MPa) | n | εu (mm/mm) | εf (mm/mm) | |
|---|---|---|---|---|---|---|
| 6063-T5 | 69,000 | 164 | 211 | 10.0 | 7.28 | 13.65 |
| 6082-T6 | 66,805 | 290 | 312 | 55.4 | 7.30 | 9.19 |
Table 5.
Comparison of experimental [3] and FE results with design strength predictions.
Table 5.
Comparison of experimental [3] and FE results with design strength predictions.
| Nu/Npred | ||||
|---|---|---|---|---|
| No Experiments [3] | No FE | Mean | COV | |
| Stocky cross-sections | ||||
| EC9 [5] (Classes 1–3) | 0 | 21 | 1.11 | 0.09 |
| AA [6] (b/t < S2) | 28 | 33 | 1.10 | 0.10 |
| CSM [8] ≤ 0.68) | 1 | 22 | 1.03 | 0.05 |
| DSM [9] ≤ 0.776) | 4 | 26 | 1.08 | 0.09 |
| ≤ 0.90) | 4 | 27 | 1.08 | 0.09 |
| Slender cross-sections | ||||
| EC9 [5] (Class 4) | 61 | 21 | 1.22 | 0.12 |
| AA [6] (b/t ≥ S2) | 33 | 9 | 2.03 | 0.44 |
| CSM [8] > 0.68) | 60 | 20 | 1.42 | 0.18 |
| DSM [9] > 0.776) | 57 | 16 | 1.24 | 0.13 |
| > 0.90) | 57 | 15 | 1.09 | 0.11 |
| All cross-sections | ||||
| EC9 [5] (All) | 61 | 42 | 1.20 | 0.12 |
| AA [6] (All) | 61 | 42 | 1.48 | 0.50 |
| CSM [8] (All) | 61 | 42 | 1.33 | 0.21 |
| DSM [9] (All) | 61 | 42 | 1.19 | 0.13 |
| modified DSM (All) | 61 | 42 | 1.09 | 0.11 |
Publisher’s Note: MDPI stays neutral with regard to jurisdictional claims in published maps and institutional affiliations. |
© 2021 by the authors. Licensee MDPI, Basel, Switzerland. This article is an open access article distributed under the terms and conditions of the Creative Commons Attribution (CC BY) license (https://creativecommons.org/licenses/by/4.0/).
Share and Cite
MDPI and ACS Style
Georgantzia, E.; Gkantou, M.; Kamaris, G.S. Numerical Modelling and Design of Aluminium Alloy Angles under Uniform Compression. CivilEng 2021, 2, 632-651. https://0-doi-org.brum.beds.ac.uk/10.3390/civileng2030035
AMA Style
Georgantzia E, Gkantou M, Kamaris GS. Numerical Modelling and Design of Aluminium Alloy Angles under Uniform Compression. CivilEng. 2021; 2(3):632-651. https://0-doi-org.brum.beds.ac.uk/10.3390/civileng2030035
Chicago/Turabian StyleGeorgantzia, Evangelia, Michaela Gkantou, and George S. Kamaris. 2021. "Numerical Modelling and Design of Aluminium Alloy Angles under Uniform Compression" CivilEng 2, no. 3: 632-651. https://0-doi-org.brum.beds.ac.uk/10.3390/civileng2030035