Development of a Low-Cost Experimental Procedure for the Production of Laboratory Samples of Torrefied Biomass

 ,
,  and
and
Abstract
:1. Introduction
2. State-of-the-Art
2.1. Framework
2.2. Torrefaction Parameters
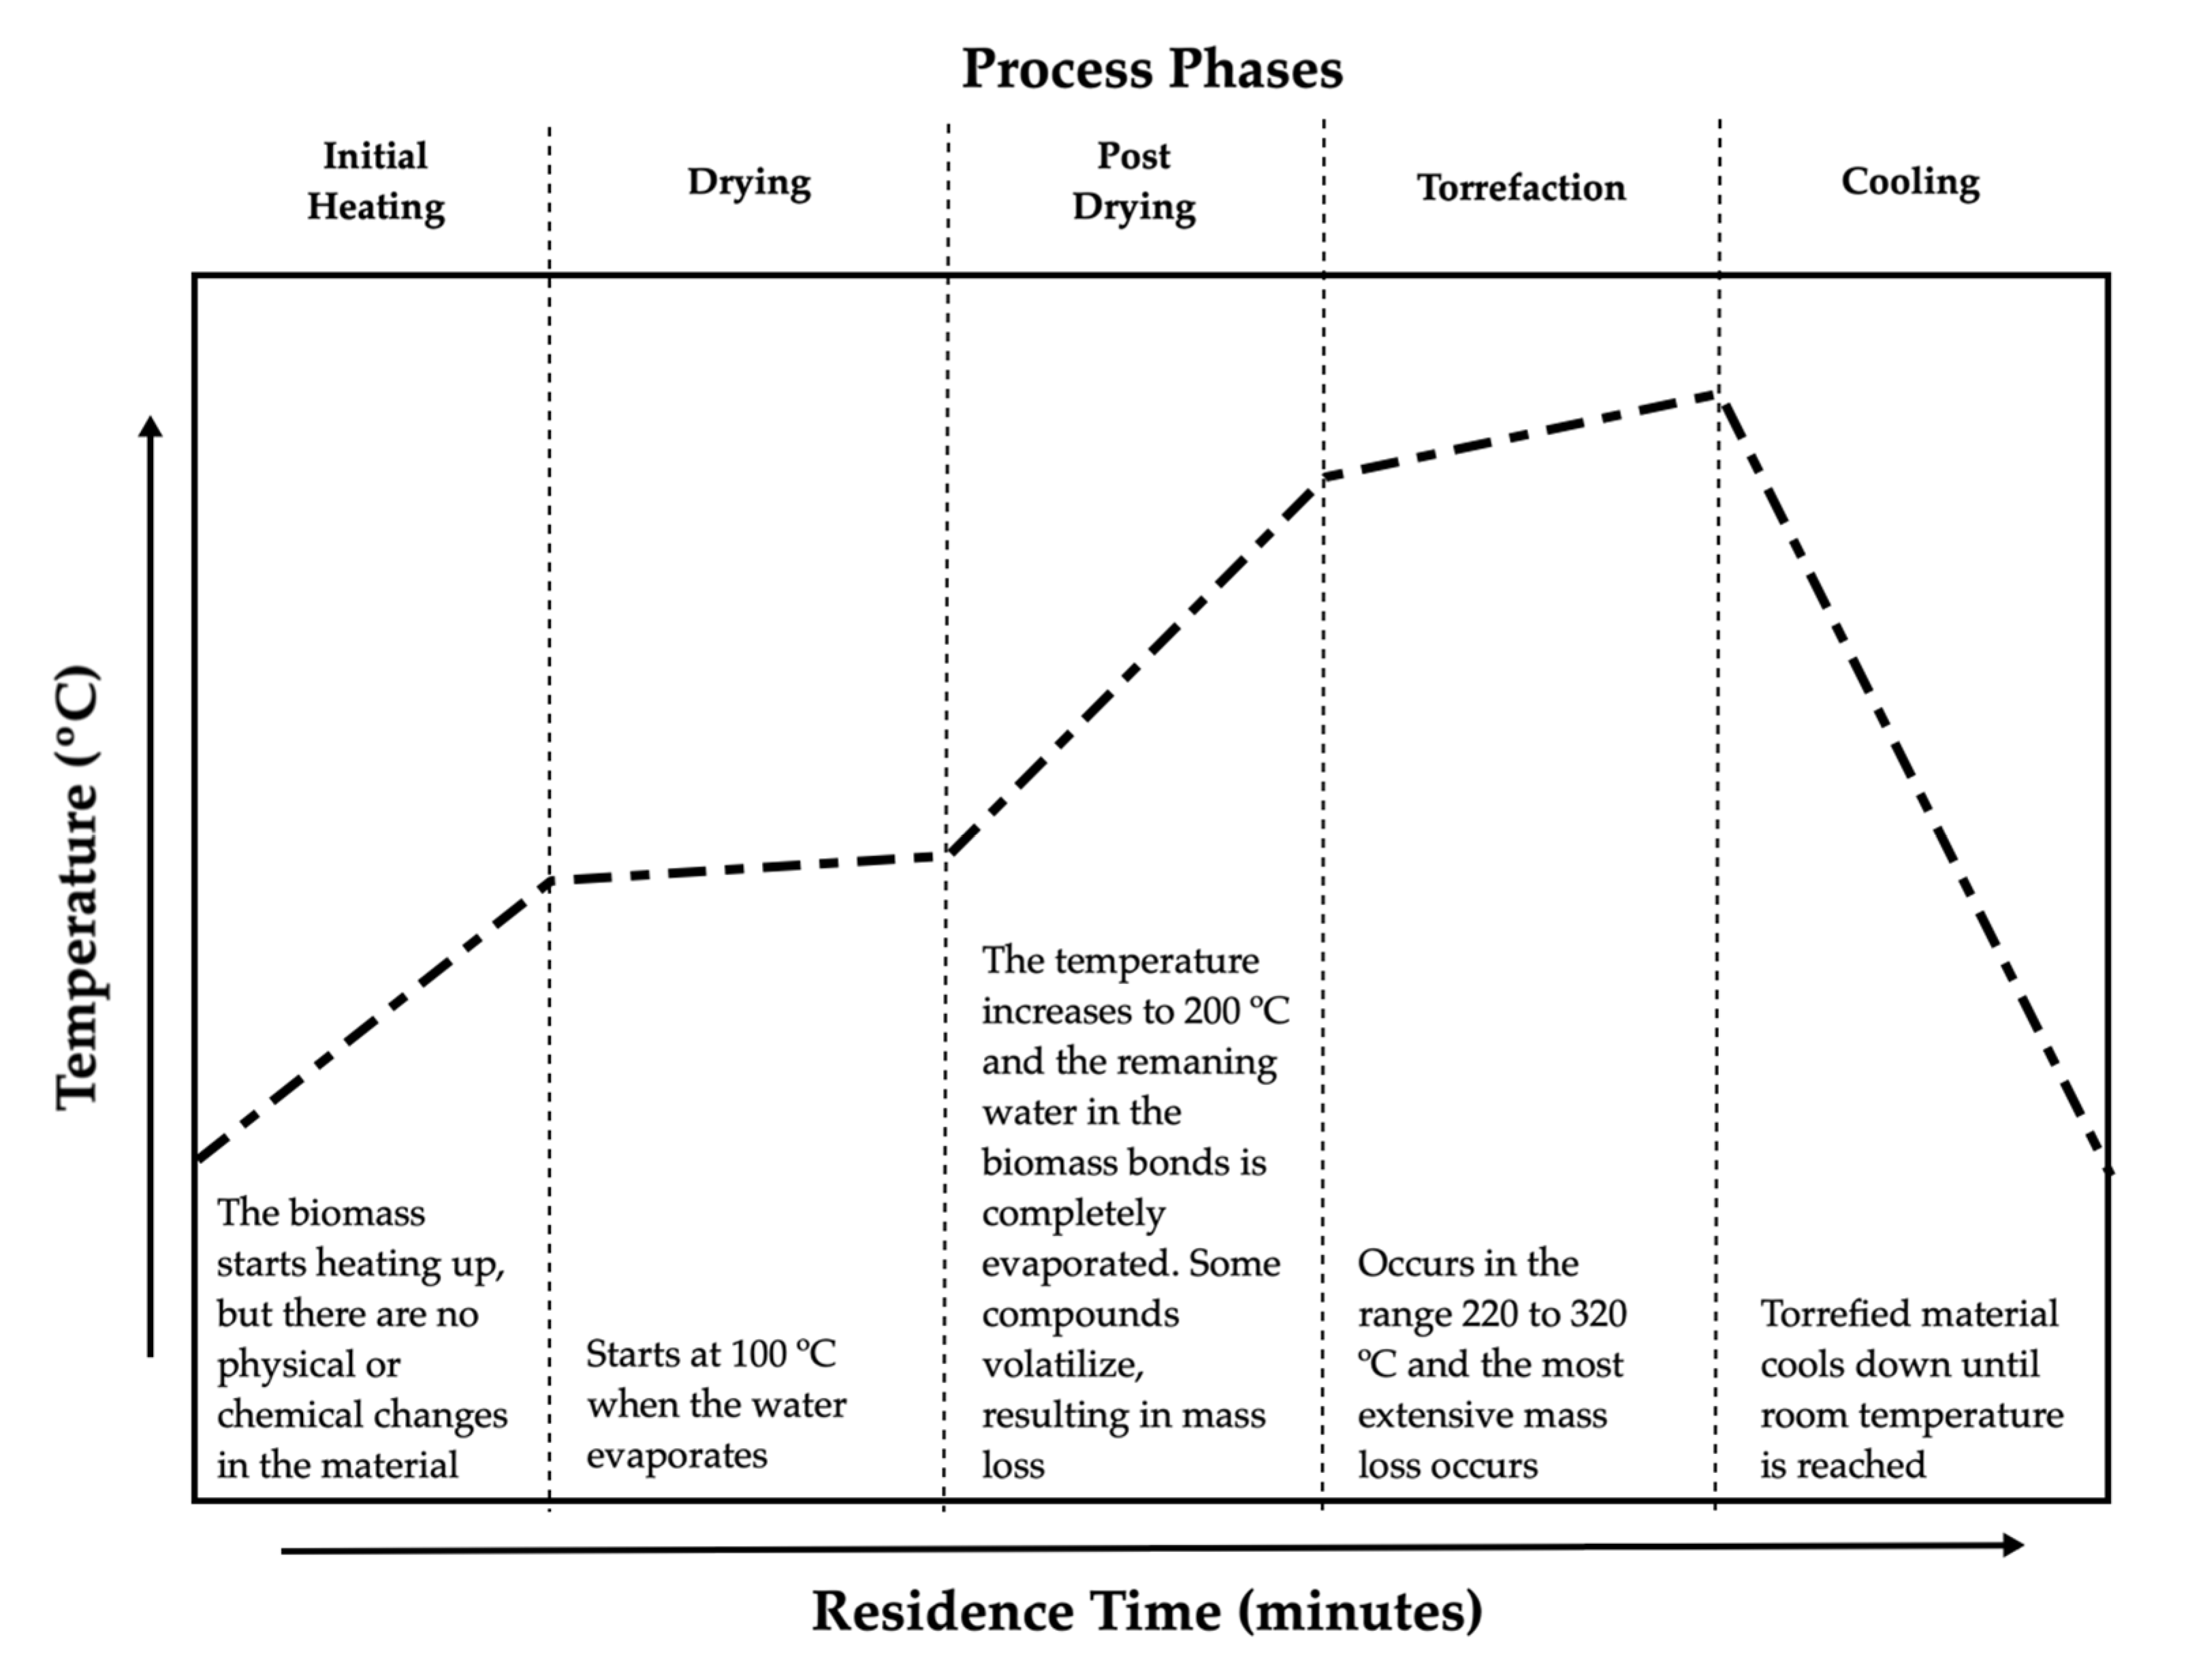
2.2.1. Temperature and Residence Time
2.2.2. Heating Rate
2.2.3. Process Atmosphere Composition
2.2.4. Instability Control
2.2.5. Torrefaction Reactors
- The batch reactor is considered the most simplistic one. A certain amount of material is loaded in the reactor and heated with an electric resistance. It is a reactor that has a higher occurrence of exothermic reactions, raising the temperature of the biomass core. Possible temperature variations occur along the reactor. The heated inert gases pass through a packed or fixed bed, which can create agglomerations of material. They can be vertical or with a horizontal grid. Heat transfer is done indirectly, causing a greater energy expenditure [26];
- The microwave reactor uses high-frequency electromagnetic waves, forcing the vibration of water molecules, increasing temperature. It is a reactor that has less heating time and greater temperature uniformity, with a compact design. It is also a conceptual system, with only qualitative assessments. Heating is achieved through the vibration and friction of the molecules (300 MHz to 300 GHz), which is why it is a volumetric heating reactor [28];
- The rotary drum reactor is the most common, receiving biomass (inflow) and discharging it (outflow). There is the possibility of direct and indirect heating of biomass. There is a difficulty in controlling the process temperature due to occurrence of radiative heat on the drum surface. Direct or indirect heating of biomass and a hybrid model may also occur. There is constant mixing of biomass [8];
- The fluidized bed reactor guarantees a uniform temperature of the biomass on a grid, with the hot gas flowing from the bottom, with the solid particles floating and behaving like a fluid. There is a high heat transfer rate. There is difficulty in separating the bed material, if used, from biomass. A drag of fine particles may occur. A high heat transfer coefficient and temperature uniformity in the bed occurs. There is a high quality of torrefied biomass [29].
2.3. Properties of Torrefied Biomass
3. Materials and Methods
3.1. Torrefaction Process
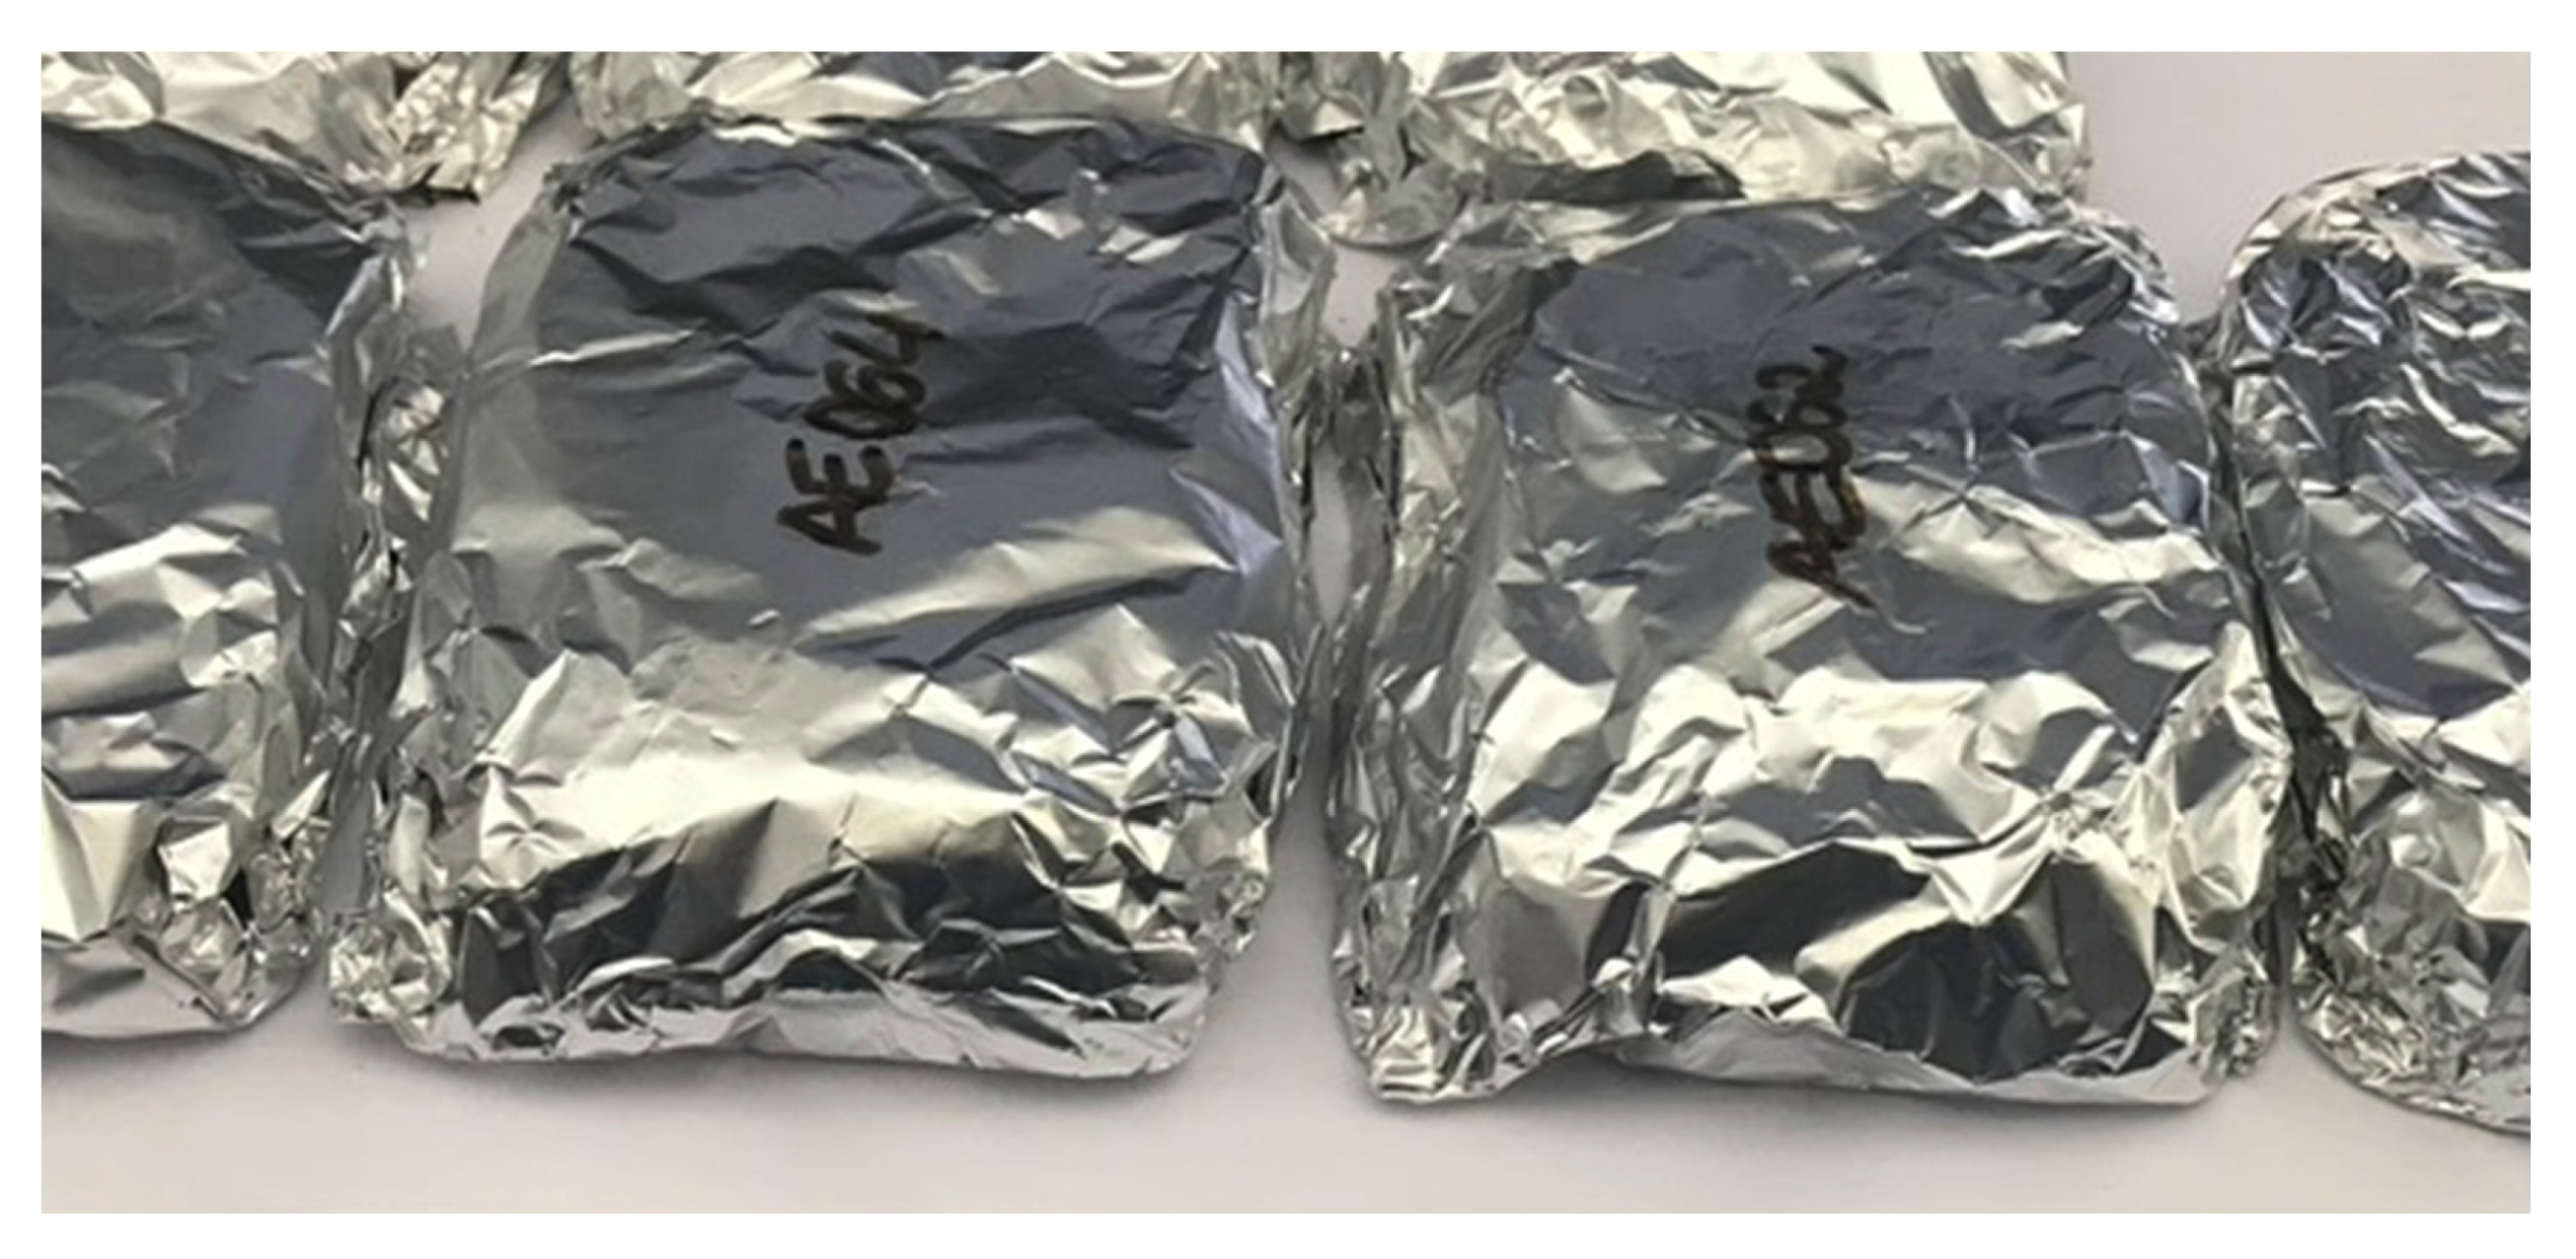
3.1.1. Sample Preparation
3.1.2. Equipment Used for Torrefaction
3.1.3. Definition of Parameters
3.2. Sample Laboratorial Characterization
3.2.1. Moisture Content
3.2.2. Thermogravimetric Analysis
3.2.3. Elemental Analysis
3.2.4. Heating Value
3.2.5. Energy Density and Mass and Energy Yield
4. Results and Discussion
4.1. Torrefaction Severity
4.2. Sample Characterization
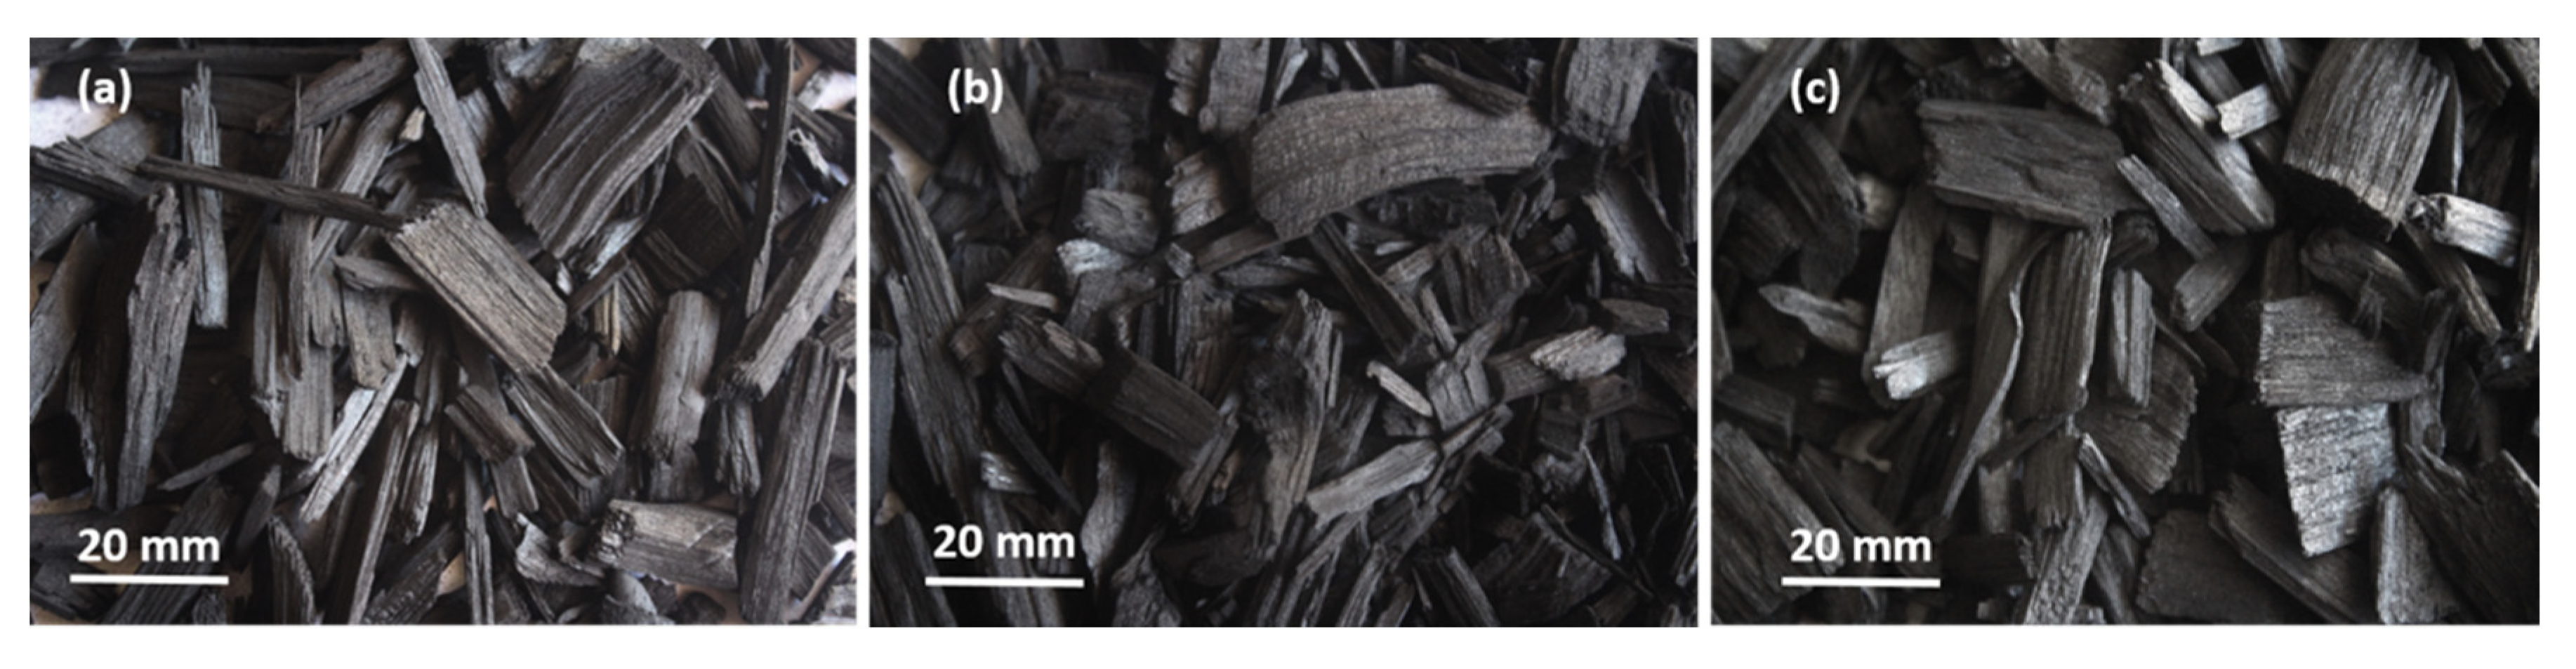
4.2.1. Overview
4.2.2. Moisture Content
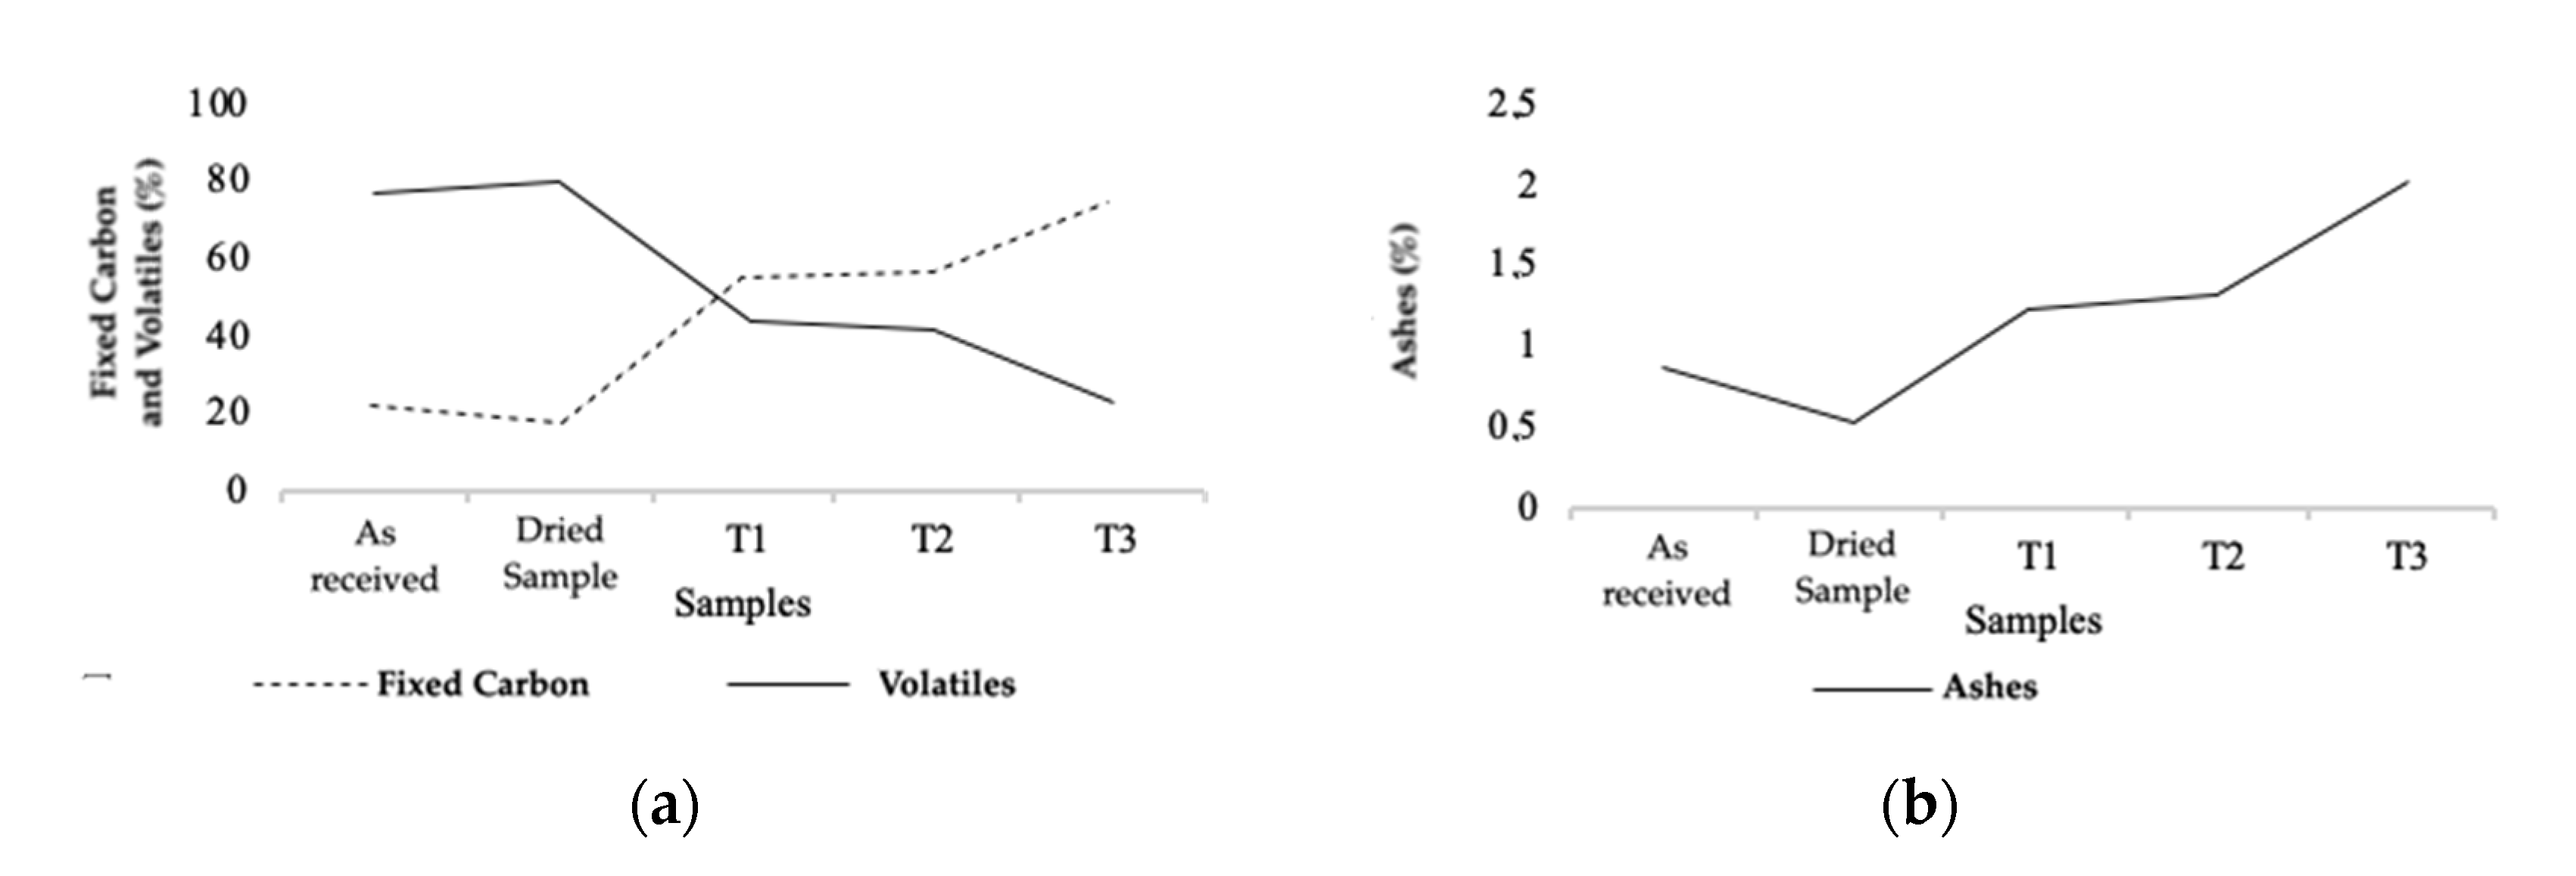
4.2.3. Thermogravimetric Analysis (TGA)
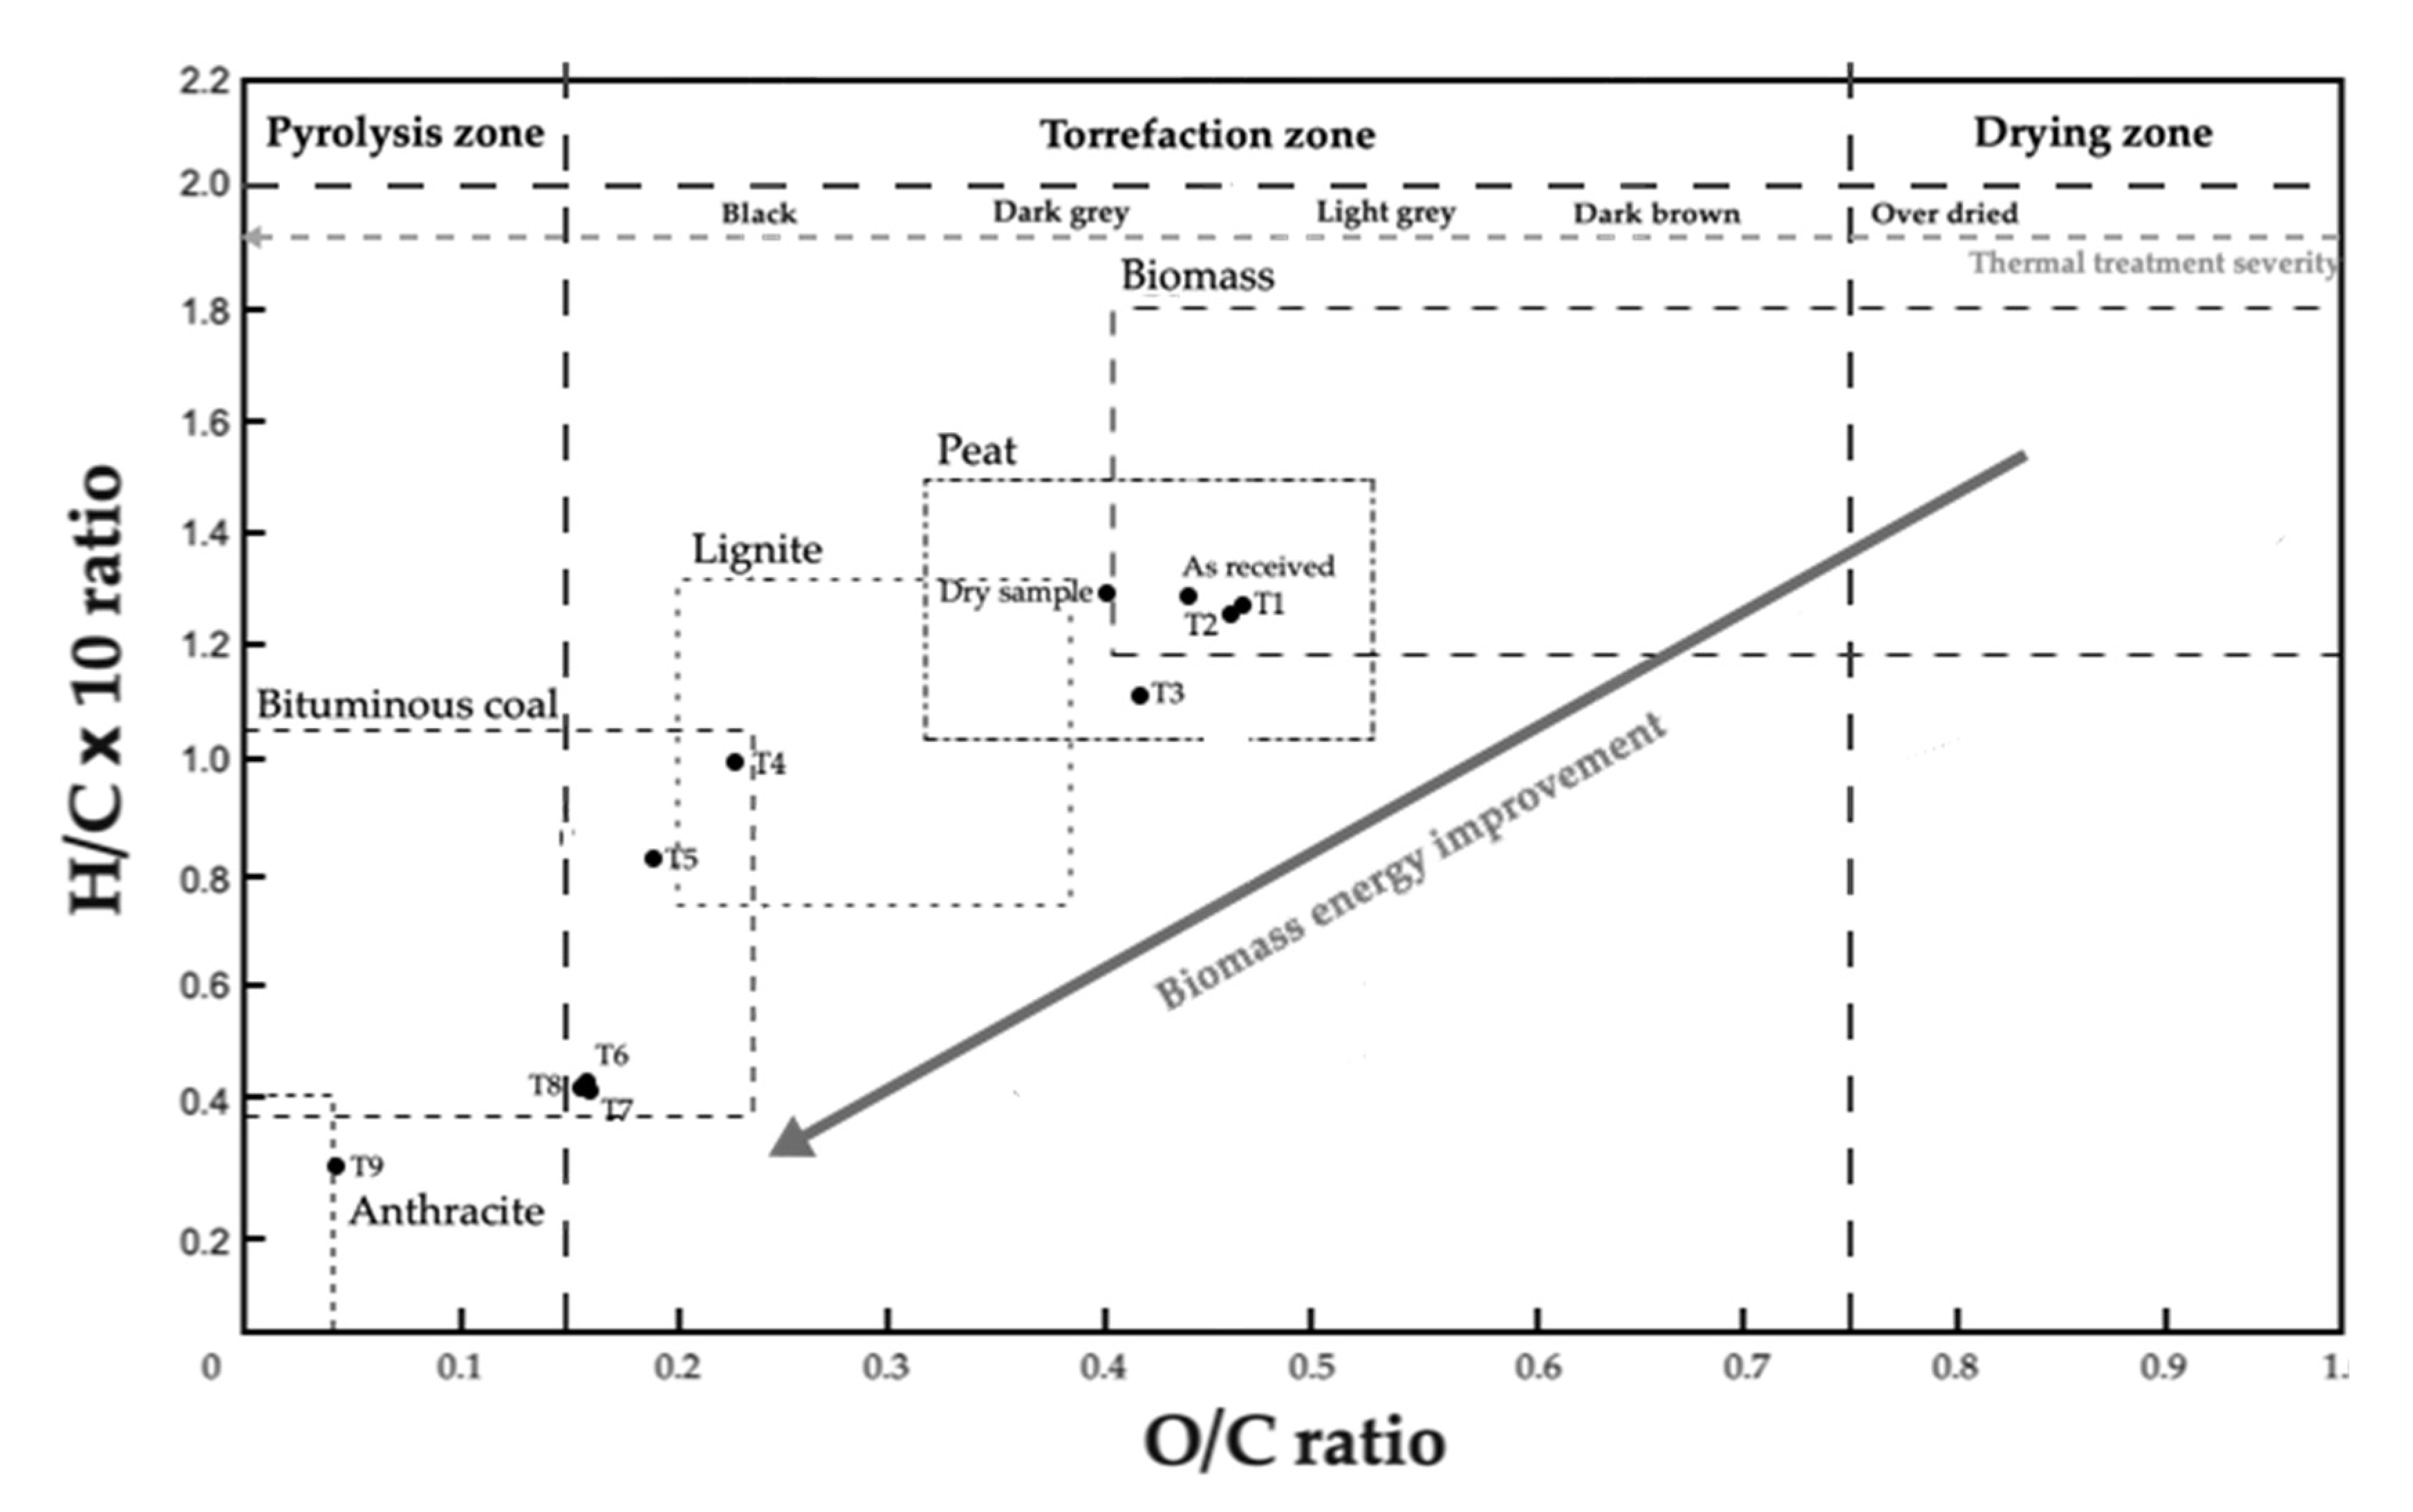
4.2.4. Elemental Analysis (CHN)
4.2.5. Heating Value
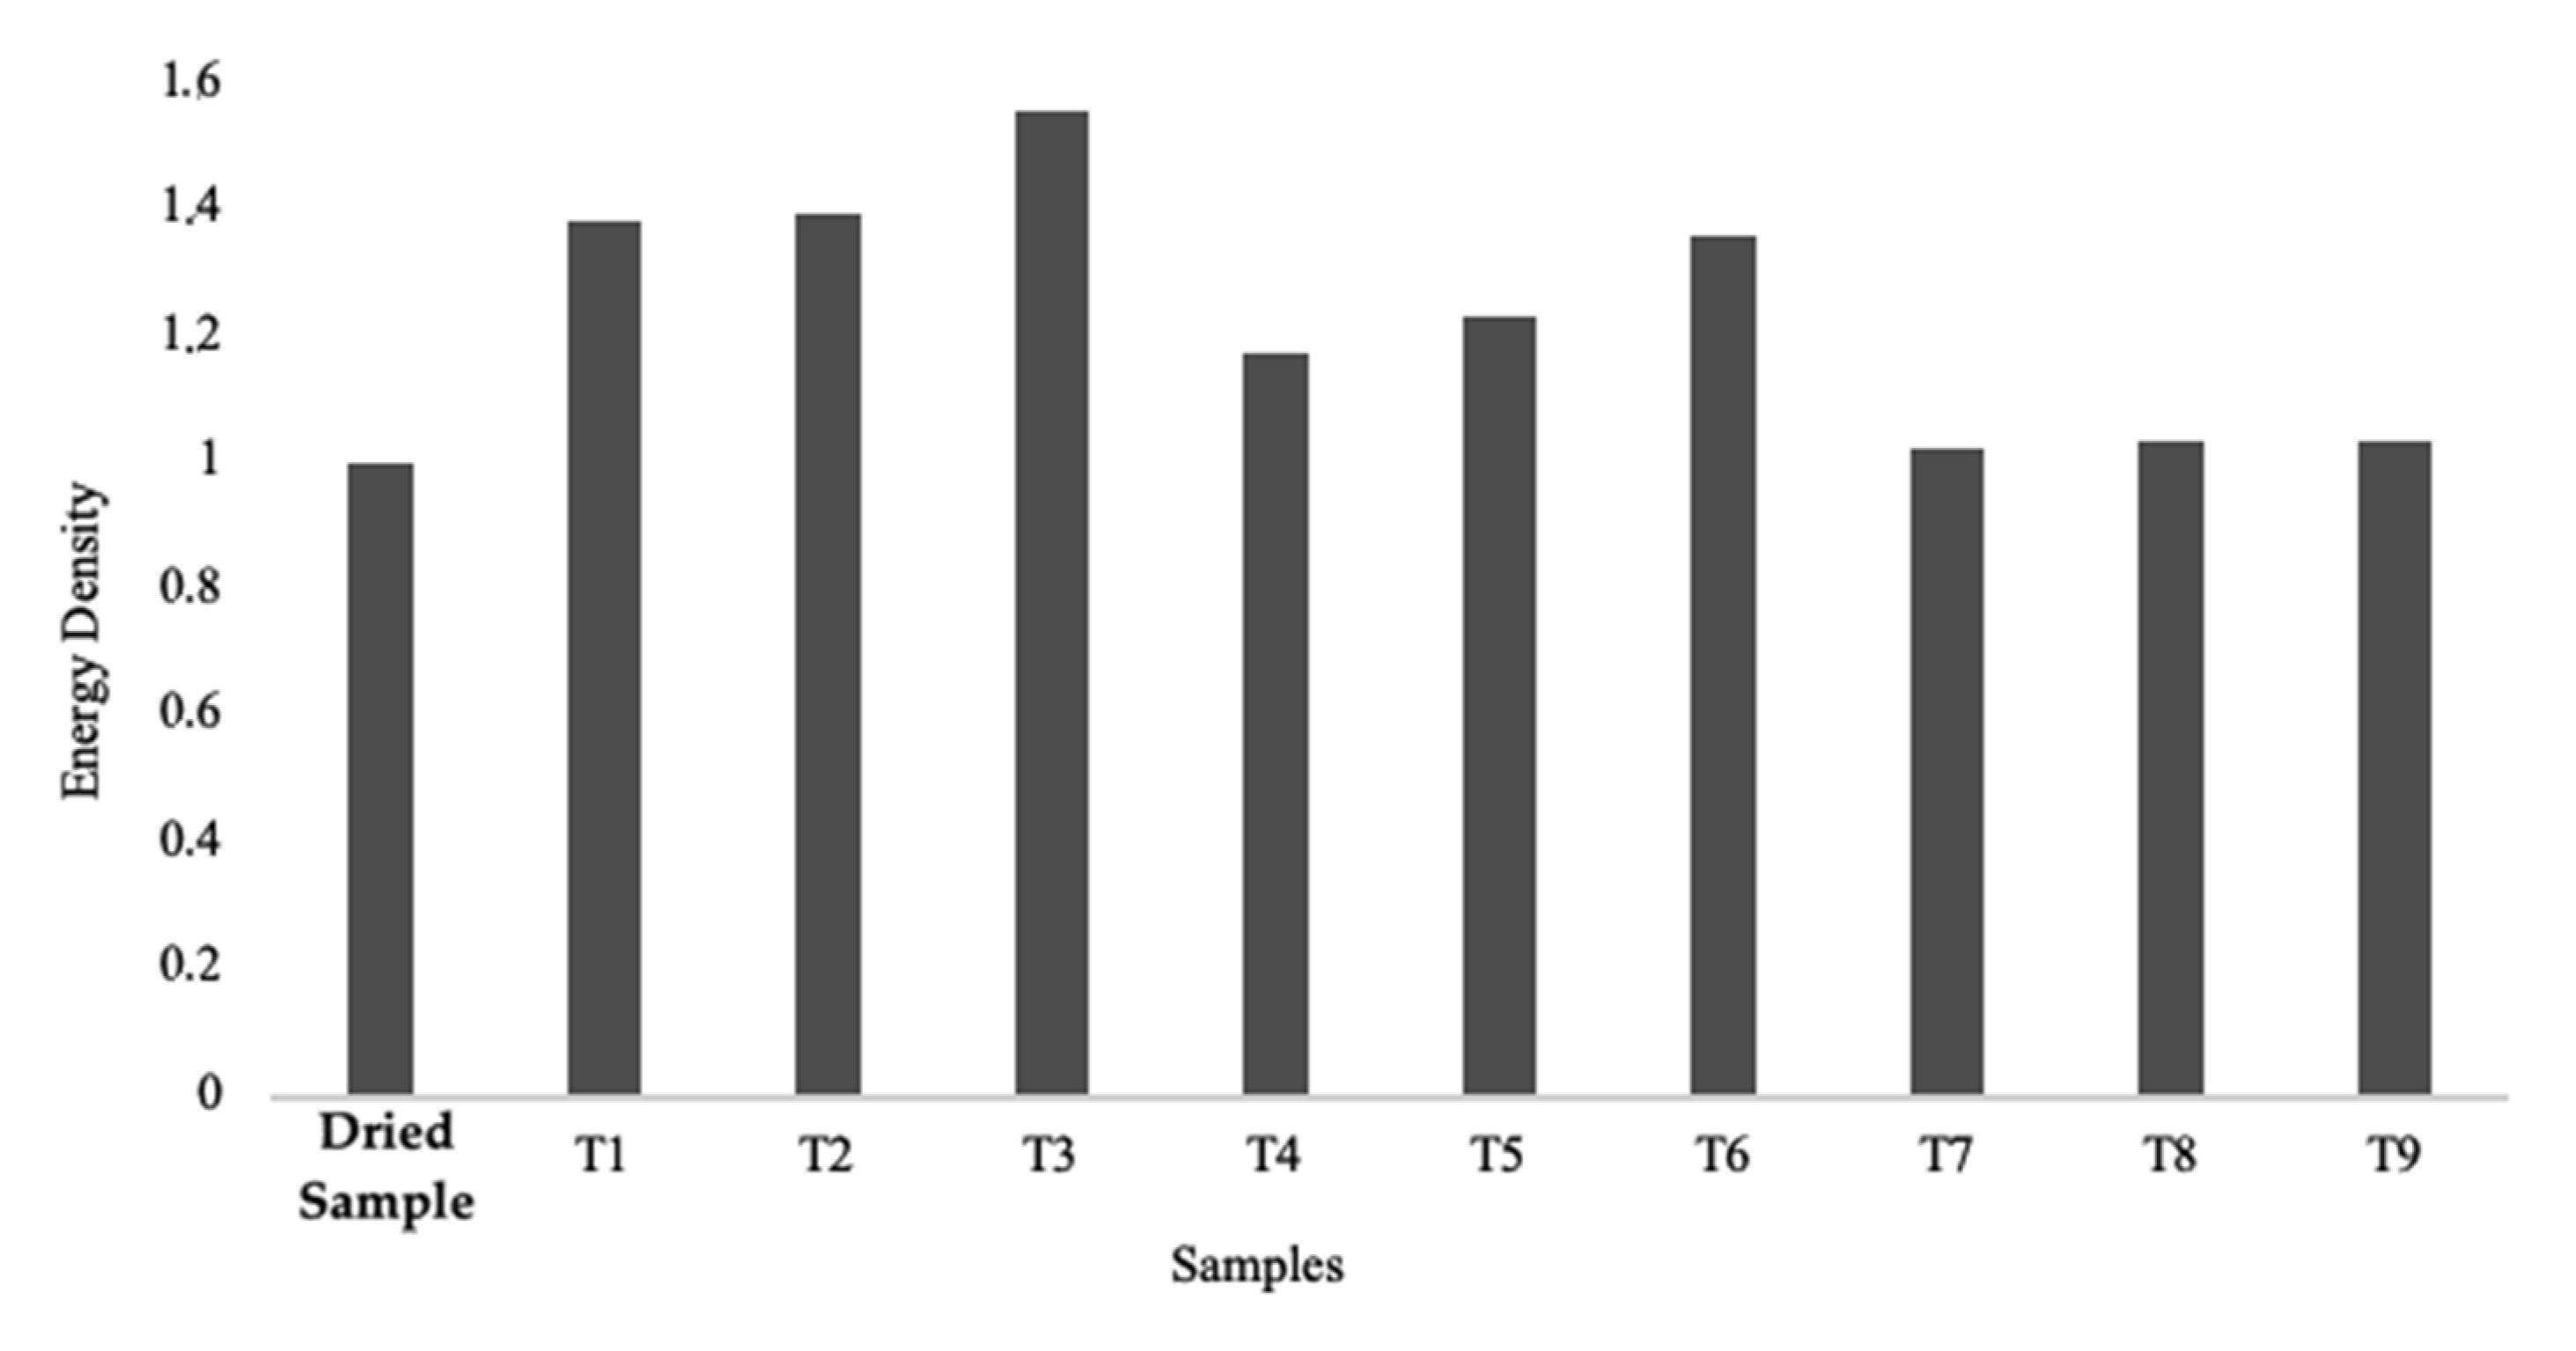
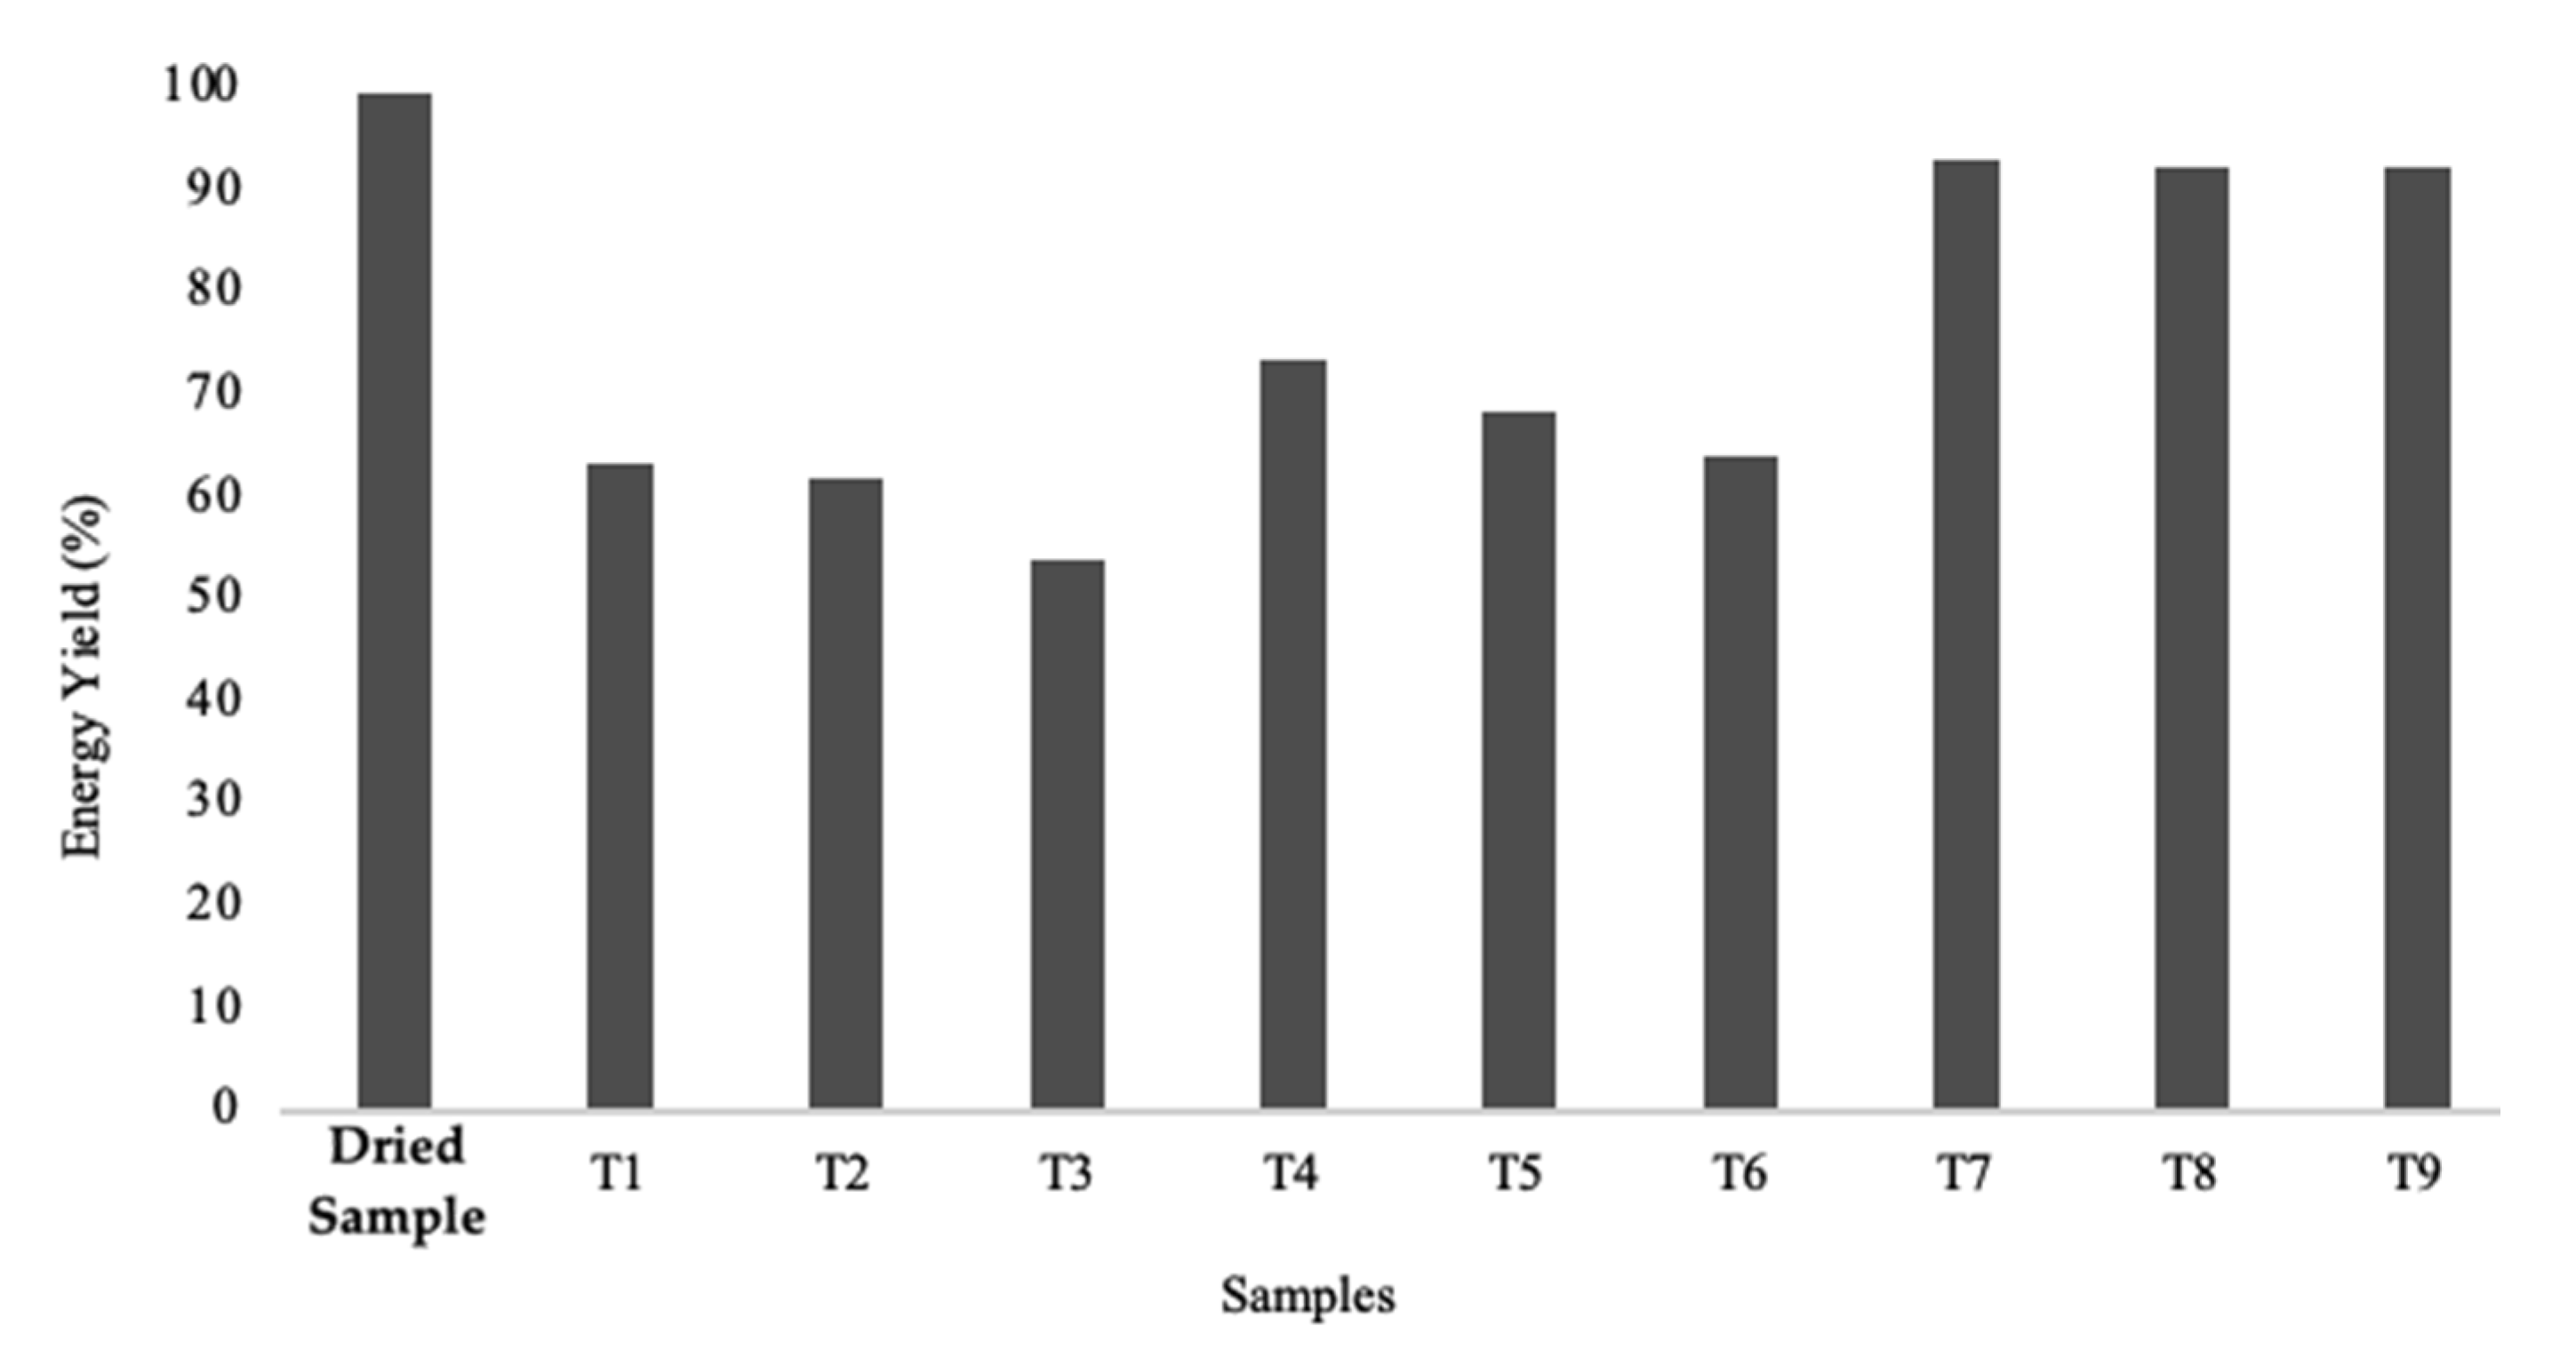
4.2.6. Energy Density and Mass and Energy Yields
4.3. Experimental Protocol
- Biomass samples must be prepared according to the procedure presented and described in Section 3.1.1. Sample Preparation;
- The muffle must be programmed according to the parameters presented in Table 5, and must therefore allow the programming of at least four temperature levels and timed heating ramps;
- After removing the material from the muffle, when a temperature sufficiently safe to open the oven is reached, it must rest inside a desiccator, until it reaches room temperature, in order to prevent the sample from acquiring moisture.
5. Conclusions and Future Work
Author Contributions
Funding
Acknowledgments
Conflicts of Interest
References
- De Matias, J.C.O.; Devezas, T.C. Consumption dynamics of primary-energy sources: The century of alternative energies. Appl. Energy 2007, 84, 763–770. [Google Scholar] [CrossRef]
- Joshi, Y.; de Vries, H.; Woudstra, T.; de Jong, W. Torrefaction: Unit operation modelling and process simulation. Appl. Therm. Eng. 2015, 74, 83–88. [Google Scholar] [CrossRef]
- Lu, K.-M.; Lee, W.-J.; Chen, W.-H.; Liu, S.-H.; Lin, T.-C. Torrefaction and low temperature carbonization of oil palm fiber and eucalyptus in nitrogen and air atmospheres. Bioresour. Technol. 2012, 123, 98–105. [Google Scholar] [CrossRef] [PubMed]
- Vassilev, S.V.; Vassileva, C.G.; Vassilev, V.S. Advantages and disadvantages of composition and properties of biomass in comparison with coal: An overview. Fuel 2015, 158, 330–350. [Google Scholar] [CrossRef]
- Nunes, L.J.; Matias, J.C. Biomass torrefaction as a key driver for the sustainable development and decarbonization of energy production. Sustainability 2020, 12, 922. [Google Scholar] [CrossRef] [Green Version]
- Tumuluru, J.S.; Wright, C.T.; Boardman, R.D.; Hess, R.J.; Sokhansanj, S. Review on biomass torrefaction process and product properties and design of moving bed torrefaction system model development. In 2011 Louisville, Kentucky, August 7–10, 2011; American Society of Agricultural and Biological Engineers: St. Joseph, MI, USA, 2011; p. 1. [Google Scholar]
- Yang, Z.; Wu, Y.; Zhang, Z.; Li, H.; Li, X.; Egorov, R.I.; Strizhak, P.A.; Gao, X. Recent advances in co-thermochemical conversions of biomass with fossil fuels focusing on the synergistic effects. Renew. Sustain. Energy Rev. 2019, 103, 384–398. [Google Scholar] [CrossRef]
- Nunes, L.J. A case study about biomass torrefaction on an industrial scale: Solutions to problems related to self-heating, difficulties in pelletizing, and excessive wear of production equipment. Appl. Sci. 2020, 10, 2546. [Google Scholar] [CrossRef] [Green Version]
- Ribeiro, J.M.C.; Godina, R.; Matias, J.C.d.O.; Nunes, L.J.R. Future perspectives of biomass torrefaction: Review of the current state-of-the-art and research development. Sustainability 2018, 10, 2323. [Google Scholar] [CrossRef] [Green Version]
- Tran, K.-Q.; Luo, X.; Seisenbaeva, G.; Jirjis, R. Stump torrefaction for bioenergy application. Appl. Energy 2013, 112, 539–546. [Google Scholar] [CrossRef]
- Van der Stelt, M.; Gerhauser, H.; Kiel, J.; Ptasinski, K. Biomass upgrading by torrefaction for the production of biofuels: A review. Biomass Bioenergy 2011, 35, 3748–3762. [Google Scholar] [CrossRef]
- Proskurina, S.; Heinimö, J.; Schipfer, F.; Vakkilainen, E. Biomass for industrial applications: The role of torrefaction. Renew. Energy 2017, 111, 265–274. [Google Scholar] [CrossRef]
- Chen, W.-H.; Peng, J.; Bi, X.T. A state-of-the-art review of biomass torrefaction, densification and applications. Renew. Sustain. Energy Rev. 2015, 44, 847–866. [Google Scholar] [CrossRef]
- Bergman, P.C.; Boersma, A.; Zwart, R.; Kiel, J. Torrefaction for Biomass Co-Firing in Existing Coal-Fired Power Stations; ECN-C-05-013; Energy Research Centre of the Netherlands: Sint Maartensvlotbrug, The Netherlands, 2005. [Google Scholar]
- Shankar Tumuluru, J.; Sokhansanj, S.; Hess, J.R.; Wright, C.T.; Boardman, R.D. A review on biomass torrefaction process and product properties for energy applications. Ind. Biotechnol. 2011, 7, 384–401. [Google Scholar] [CrossRef] [Green Version]
- Araújo, S.; Neiva, D.M.; Gominho, J.; Esteves, B.; Pereira, H. Chemical effects of a mild torrefaction on the wood of eight Eucalyptus species. Holzforschung 2017, 71, 291–298. [Google Scholar] [CrossRef]
- Lipinsky, E.S.; Arcate, J.R.; Reed, T.B. Enhanced wood fuels via torrefaction. Fuel Chem. Div. Prepr. 2002, 47, 408–410. [Google Scholar]
- Prins, M.J.; Ptasinski, K.J.; Janssen, F.J. Torrefaction of wood: Part 2. Analysis of products. J. Anal. Appl. Pyrolysis 2006, 77, 35–40. [Google Scholar] [CrossRef]
- Prins, M.J.; Ptasinski, K.J.; Janssen, F.J. Torrefaction of wood: Part 1. Weight loss kinetics. J. Anal. Appl. Pyrolysis 2006, 77, 28–34. [Google Scholar] [CrossRef]
- Viana, H.; Rodrigues, A.; Godina, R.; Matias, J.C.O.; Nunes, L.J. Evaluation of the physical, chemical and thermal properties of Portuguese maritime pine biomass. Sustainability 2018, 10, 2877. [Google Scholar] [CrossRef] [Green Version]
- Strezov, V.; Popovic, E.; Filkoski, R.V.; Shah, P.; Evans, T. Assessment of the thermal processing behavior of tobacco waste. Energy Fuels 2012, 26, 5930–5935. [Google Scholar] [CrossRef]
- Karim, A.A.; Kumar, M.; Singh, S.K.; Panda, C.R.; Mishra, B.K. Potassium enriched biochar production by thermal plasma processing of banana peduncle for soil application. J. Anal. Appl. Pyrolysis 2017, 123, 165–172. [Google Scholar] [CrossRef]
- Medic, D.; Darr, M.; Shah, A.; Rahn, S. The effects of particle size, different corn stover components, and gas residence time on torrefaction of corn stover. Energies 2012, 5, 1199–1214. [Google Scholar] [CrossRef] [Green Version]
- Prins, M.J.; Ptasinski, K.J.; Janssen, F.J. More efficient biomass gasification via torrefaction. Energy 2006, 31, 3458–3470. [Google Scholar] [CrossRef]
- Zhao, L.; Zhang, J.; Sheng, C.; Wang, K.; Ding, Q. Dissolution characteristics of inorganic elements existing in biomass during the supercritical water gasification process. Energy Sources Part A 2012, 34, 1893–1900. [Google Scholar] [CrossRef]
- Junsatien, W.; Soponpongpipat, N.; Phetsong, S. Torrefaction reactors. J. Sci. Technol. Mahasarakham Univ. 2013, 32, 84–91. [Google Scholar]
- Pérez, J.F.; Pelaez-Samaniego, M.R.; Garcia-Perez, M. Torrefaction of fast-growing Colombian wood species. Waste Biomass Valorization 2019, 10, 1655–1667. [Google Scholar] [CrossRef]
- Wang, M.; Huang, Y.; Chiueh, P.; Kuan, W.; Lo, S. Microwave-induced torrefaction of rice husk and sugarcane residues. Energy 2012, 37, 177–184. [Google Scholar] [CrossRef]
- Chang, S.; Zhao, Z.; Zheng, A.; He, F.; Huang, Z.; Li, H. Characterization of products from torrefaction of sprucewood and bagasse in an auger reactor. Energy Fuels 2012, 26, 7009–7017. [Google Scholar] [CrossRef]
- Phanphanich, M.; Mani, S. Impact of torrefaction on the grindability and fuel characteristics of forest biomass. Bioresour. Technol. 2011, 102, 1246–1253. [Google Scholar] [CrossRef]
- Chew, J.J.; Doshi, V. Recent advances in biomass pretreatment—Torrefaction fundamentals and technology. Renew. Sustain. Energy Rev. 2011, 15, 4212–4222. [Google Scholar] [CrossRef]
- Parikh, J.; Channiwala, S.; Ghosal, G. A correlation for calculating HHV from proximate analysis of solid fuels. Fuel 2005, 84, 487–494. [Google Scholar] [CrossRef]
- Grigiante, M.; Antolini, D. Experimental results of mass and energy yield referred to different torrefaction pathways. Waste Biomass Valorization 2014, 5, 11–17. [Google Scholar] [CrossRef]
- Van Krevelen, D. Graphical-statistical method for the study of structure and reaction processes of coal. Fuel 1950, 29, 269–284. [Google Scholar]
- Bergman, P.C.; Kiel, J.H. Torrefaction for biomass upgrading. In Proceedings of the 14th European Biomass Conference, Paris, France, 17–21 October 2005; pp. 17–21. [Google Scholar]


| Stage | Phase | Temperature (°C) | Residence Time (Minutes) |
|---|---|---|---|
| 1 | Heating/Drying | Tamb (18 °C) to X1 | Y1 |
| 2 | Post-drying | X1 a X2 | Y2 |
| 3 | Torrefaction | X2 | Y3 |
| 4 | Cooling | X2 to 50 °C | Y4 |
| Tests | T1 | T2 | T3 | T4 | T5 | T6 | T7 | T8 | T9 |
|---|---|---|---|---|---|---|---|---|---|
| Temperature (°C) | Residence Time (Minutes) | ||||||||
| 18–250 | 15 | 30 | 60 | 60 | 60 | 60 | 60 | 60 | 60 |
| 250–285 | 60 | 90 | 120 | 60 | 90 | 120 | 60 | 60 | 60 |
| 285 | 60 | 90 | 120 | 60 | 90 | 120 | 10 | 20 | 30 |
| 285–50 | 60 | 60 | 60 | 60 | 90 | 60 | 60 | 60 | 60 |
| Parameters | Moisture (wt %) | Thermogravimetric Analysis (wt %) | Elemental Analysis (wt %) | |||||
|---|---|---|---|---|---|---|---|---|
| Sample | wH2O | Fixed Carbon | Volatiles | Ash | C | H | N | O |
| Natural | 38.81 | 22.60 | 76.44 | 0.87 | 60 | 5.52 | 0.25 | 33.36 |
| Dry | 1.21 | 18.23 | 81.23 | 0.53 | 59.1 | 6.13 | 2.80 | 31.44 |
| T1 | 2.2 | 55.70 | 43.07 | 1.22 | 78.15 | 4.46 | 0.44 | 15.64 |
| T2 | 1.28 | 57.08 | 41.60 | 1.32 | 77.6 | 4.27 | 0.38 | 16.41 |
| T3 | 1.39 | 74.23 | 23.70 | 2.02 | 85.8 | 3.58 | 0.43 | 8.09 |
| T4 | 1.06 | 35.28 | 64.37 | 0.80 | 67.1 | 5.33 | 0.28 | 26.86 |
| T5 | 1.2 | 40.65 | 58.47 | 0.88 | 70.38 | 5.25 | 0.21 | 23.23 |
| T6 | 2.52 | 53.36 | 45.33 | 1.30 | 78.38 | 4.47 | 0.29 | 15.5 |
| T7 | 0.86 | 20.68 | 78.81 | 0.51 | 56.15 | 5.85 | 0.17 | 37.27 |
| T8 | 0.99 | 21.79 | 77.67 | 0.60 | 56.51 | 5.74 | 0.21 | 36.89 |
| T9 | 0.86 | 22.01 | 77.26 | 0.73 | 57.46 | 5.88 | 0.20 | 35.67 |
| Par.* | S1 | S2 | S3 | ||||||||
|---|---|---|---|---|---|---|---|---|---|---|---|
| Nat. | Dry | T1 | T2 | T3 | T4 | T5 | T6 | T7 | T8 | T9 | |
| HHV (MJ/kg) | 19.90 | 19.11 | 26.35 | 26.60 | 29.85 | 22.50 | 23.48 | 25.93 | 19.60 | 19.81 | 19.82 |
| Gain (%) | - | 37.9 | 39.2 | 56.3 | 17.8 | 22.9 | 35.7 | 2.6 | 3.7 | 3.7 | |
| Temperature (°C) | Residence Time (Minutes) |
|---|---|
| 18–250 | 60 |
| 250–285 | 60 |
| 285 | 60 |
| 285–50 | 60 |
© 2020 by the authors. Licensee MDPI, Basel, Switzerland. This article is an open access article distributed under the terms and conditions of the Creative Commons Attribution (CC BY) license (http://creativecommons.org/licenses/by/4.0/).
Share and Cite
Nunes, L.J.R.; Ribeiro, J.M.C.; Sá, L.C.R.; Loureiro, L.M.E.F.; Godina, R.; Matias, J.C.O. Development of a Low-Cost Experimental Procedure for the Production of Laboratory Samples of Torrefied Biomass. Clean Technol. 2020, 2, 406-421. https://0-doi-org.brum.beds.ac.uk/10.3390/cleantechnol2040025
Nunes LJR, Ribeiro JMC, Sá LCR, Loureiro LMEF, Godina R, Matias JCO. Development of a Low-Cost Experimental Procedure for the Production of Laboratory Samples of Torrefied Biomass. Clean Technologies. 2020; 2(4):406-421. https://0-doi-org.brum.beds.ac.uk/10.3390/cleantechnol2040025
Chicago/Turabian StyleNunes, Leonel J. R., Jorge M. C. Ribeiro, Letícia C. R. Sá, Liliana M. E. F. Loureiro, Radu Godina, and João C. O. Matias. 2020. "Development of a Low-Cost Experimental Procedure for the Production of Laboratory Samples of Torrefied Biomass" Clean Technologies 2, no. 4: 406-421. https://0-doi-org.brum.beds.ac.uk/10.3390/cleantechnol2040025