
Quantifying Interactive Cooling Effects of Morphological Parameters and Vegetation-Related Landscape Features during an Extreme Heat Event


School of Public and International Affairs, Virginia Polytechnic Institute and State University, Blacksburg, VA 24061, USA
*
Author to whom correspondence should be addressed.
Climate 2022, 10(4), 60; https://0-doi-org.brum.beds.ac.uk/10.3390/cli10040060
Submission received: 24 February 2022
/
Revised: 5 April 2022
/
Accepted: 6 April 2022
/
Published: 9 April 2022
Abstract
:In this study, we apply the ENVI-met model to evaluate the effects of combinations of morphological and vegetation-related landscape features on urban temperatures and thermal comfort. We simulated the thermal conditions of 126 scenarios, varying the aspect ratios of street canyons, vegetation cover and density, surface materials, and orientations toward the prevalent winds under an extreme heat situation. Our results show how the effects of physical and vegetation parameters interact and moderate each other. We also demonstrate how sensitive thermal comfort indices such as temperature and relative humidity are to the built environment parameters during different hours of a day. This study’s findings highlight the necessity of prioritizing heat mitigation interventions based on the site’s physical characteristics and landscape features and avoiding generic strategies for all types of urban environments.
1. Introduction
Within cities, urban heat islands and extreme heat events such as heatwaves are some of the most tangible outcomes of climate change that pose direct and indirect effects on citizens’ quality of life. Effects range from slight thermal discomfort to extreme heat stress and even heat-related mortalities [1]. According to the United States Center for Disease Control and Prevention, from 2004 to 2018, 702 heat-related deaths occurred on average annually throughout the US [2]. Although the extent of physical and infrastructure loss due to the different levels of vulnerability and exposure may vary spatially and temporally [3], the higher global frequency and intensity of extreme heat events due to climate change [4] is expected to exacerbate the issue even further [5].
In cities worldwide, synergistic interactions between the urban heat island effect and heatwaves can expose a vast number of people to risk [6]. Unfavorable thermal conditions and excessive heat-related mortality, especially among racial minorities and vulnerable groups—such as the case of the Chicago Heat Wave in 1995 illustrated in [7]—are some inevitable outcomes of those situations. Cities, due to the special elements of urbanization (such as imperviousness and land cover) and morphological characteristics [8,9,10], are more vulnerable to the severe impacts of such events. As risk is a function of hazard, exposure, and vulnerability [11], higher risk will be associated with extreme heat events throughout the cities. The impacts of extreme heat exposure can potentially be alleviated through planning strategies for the built environment [12,13]. This notion makes the study of the contributing factors and strategies relevant to the urban planners who are responsible for providing healthy and safe environments for all residents.
The severity, magnitude, and frequency of such extreme heat events in cities are influenced by multiple local-scale factors. Site-specific features such as urban layout, pavement and building materials, and the balance between urban environment, human activities and meteorological conditions can modify microclimates and generate temperature variation within any given city [14,15]. The airflow in urban environments depends mainly on the urban canopy layer characteristics and the temperature differences between ambient air, ground, and surfaces due to radiative and thermal heating [16]. Physical and landscape features of cities such as the geometry of street canyons determined through aspect ratio or sky view factor [10,17,18,19], street orientations or inflow direction [20,21,22], vegetation (location, distribution, type, and density) [13,23,24,25], the albedo of surface materials [26,27,28], the presence of water bodies, traffic, and human activities proved to be the most influential in changing temperatures in cities. In addition, the interactions between these parameters and climate-related variables—through altering air and surface temperatures—can also modify thermal conditions in cities [29].
While the effects of aspect ratio, street orientation, vegetation, or surface albedo on temperature variations have been quantified in previous studies, those parameters under different conditions may exhibit different effects [12,30,31] which need to be further scrutinized. For example, tree planting is advocated by many studies as a useful strategy for reducing temperature throughout cities [24,32,33]. However, it appears the cooling effect of trees is largely controlled by background meteorological and morphological conditions. For example, it has been shown that trees and vegetation have a higher cooling impact in sites with taller buildings, higher temperatures, and lower relative humidity [34]. Other results have also shown that trees with high trunk and low canopy density are most effective in improving daytime thermal comfort in deeper canyons [24]. The cooling performance of trees is also dependent on the orientations and surface materials of streets [14,35].
There are many empirical studies that use ground measurements, meteorological data, or remotely sensed imagery to explain the contribution of influential parameters in altering temperature [36,37,38,39]. Yet, due to the complexity of urban areas, high heterogeneity, and high spatial correlation effects, it is difficult both to isolate the causal effects of morphological, meteorological and landscape factors on spatial thermal variation in cities and to understand the contexts in which specific changes to the built environment may exhibit interactive effects that may either amplify or negate improvement to thermal comfort. Physical simulation-based modeling, however, has the capacity to test both the isolated and interactive impacts of vegetation and urban morphological parameters. In addition, the analysis of the temporal outputs from models also allows the examination of the duration of extreme heat conditions, which has important implications for public health and safety.
The purpose of this study is to explore the relative and interactive impacts of potential changes to the built environment during an extreme heat event by analyzing sensitivities of varying parameters that correspond with potential interventions. We do this by simulating a large number of scenarios of an idealized urban street canyon in which the built environment parameters are perturbed in different combinations. Specifically, the following questions will be addressed throughout this paper:
- RQ.1
- Which physical and vegetation parameters cause the largest variations in thermal conditions?
- RQ.2
- What is the effect magnitude of those parameters on changing thermal comfort indices (such as temperature and relative humidity) during different hours of a day?
- RQ.3
- What is the interactive effect of morphological and vegetation-related landscape features in changing thermal comfort levels during an extreme heat event?
- RQ.4
- What is the cooling performance of different vegetation scenarios in various street canyon layouts, and how might they affect the duration of thermal stress and exposure to extreme heat?
Due to the limited capacity of cities for new developments, answers to the above questions would be of exceptional interest to the planners and decision-makers and give new insights into prioritized heat mitigation interventions based on sites’ characteristics.
2. Materials and Methods
For simulating our idealized urban street canyon, we chose the ENVI-met software (version 4.4.1), a popular microclimate computational fluid dynamic (CFD) model, which has been developed to simulate surface–plant–air interactions [40]. ENVI-met has the capacity to provide a typical horizontal resolution of 0.5 to 10 m and a timestep of 1 to 5 s [41]. These relatively high spatial and temporal resolutions facilitate the analysis of complex urban environments. It is also frequently used in scenario analysis for thermal impacts of various kinds of development alternatives [42] and has been tested and validated for heat-related studies in different climates by previous studies [43,44,45]. Since its development in 1998, a keyword search on the Web of Science reveals that ENVI-met appears in 600 academic articles (by the time of writing this paper in 2021).
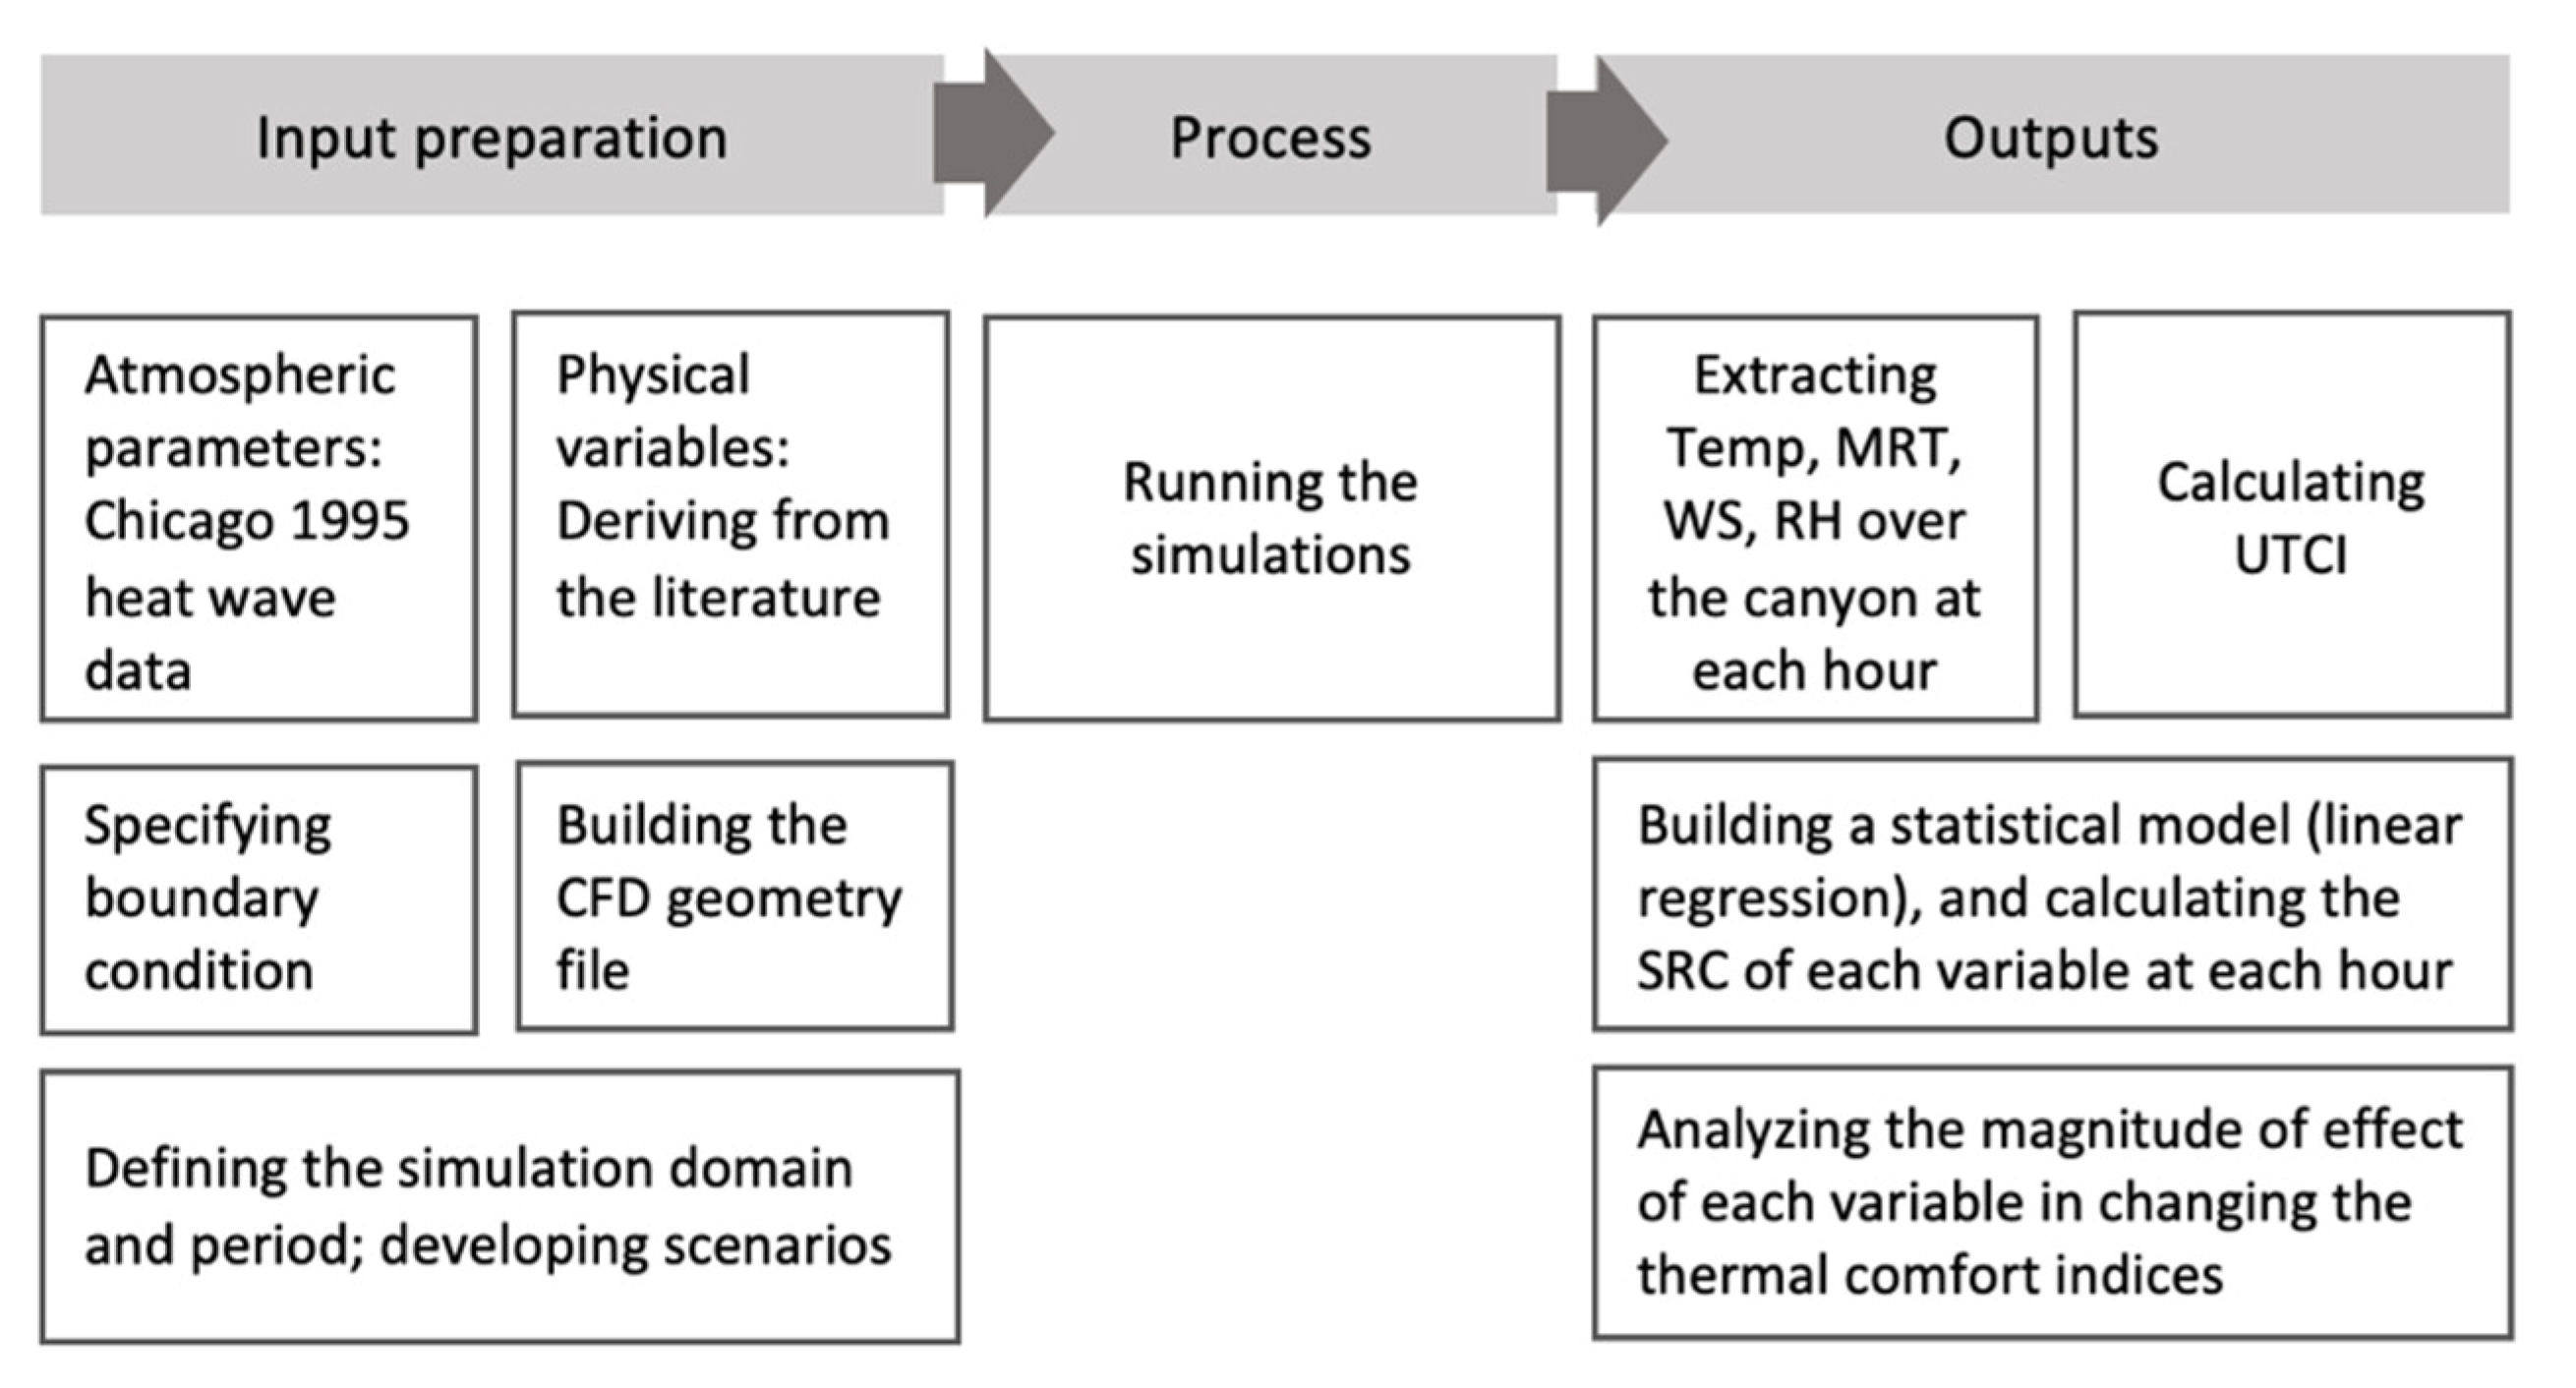
All of our simulations utilize meteorological forcing conditions that are based on the 1995 Chicago Heat Wave [46]. Variables of the physical simulation domain identified thorough analysis of previous studies (Appendix A Table A1). After developing the scenarios, running the simulations, and obtaining the outputs, relevant indices of thermal comfort were extracted and used for descriptive and inferential statistical analysis. The schematic procedure of our study is shown in Figure 1.
2.1. Model Setup and Scenario Development
ENVI-met for running simulations needs two separate input files: area input file (.IN/.IN3) and model configuration file (.cf/.sim). Each of these two files contains specific sources of data that are essential for the model calculations. In the area input file, mostly physical and spatial parameters such as building shapes and geometry, surface materials, soil profile, vegetation variables, pollutant source, and the receptor location can be identified. In the model configuration file, meteorological parameters such as air temperature, relative humidity, specific humidity, wind speed, wind direction, roughness length, cloudiness level, date, and time of simulation would be modeled. ENVI-met, by matching these two separate files, generates outputs for each hour of simulation [47].
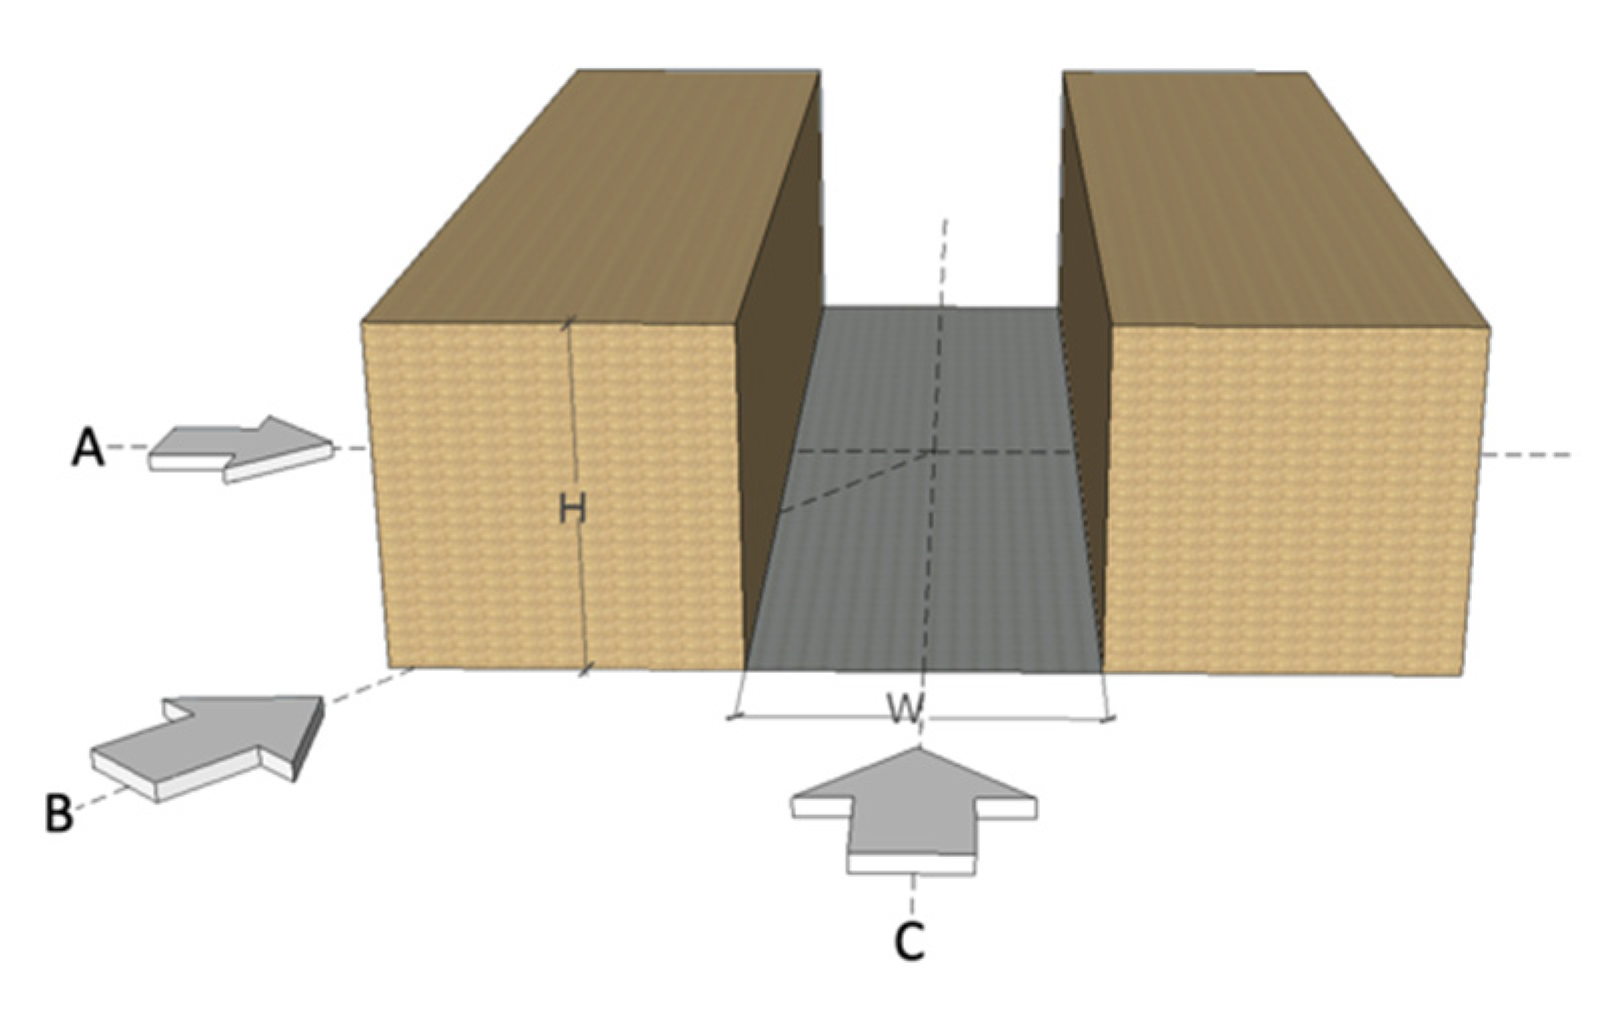
The choice of variables and their values took place based on reviewing the literature, which is reflected in Table A1. In this table, we included the variables, number of scenarios, and main purpose of different studies in which simulation models were used as the primary method. Upon the complexity of dynamic systems, the specification of appropriate initial and boundary conditions could not be overly certain [48]. This in-depth literature review was helpful in the process of parameter calibration and thus made the model predictions more reliable. We developed 126 scenarios based on the specified parameters, selected variables, and their different interactions to holistically analyze the solo and interactive effects of variables. Buildings and street canyon geometry (defined by aspect ratio), vegetation type, density and location, street orientation (i.e., toward the prevalent wind direction), and pavement material are among the variables that were analyzed in this study (Table 1). The interaction of physical and vegetation variables resulted in 108 scenarios which were complemented by 18 scenarios with no vegetation, resulting in overall 126 scenarios. It should be noted here that this study is grounded on microclimate modeling and simulation rather than empirical research. Thus, the scale of analysis is constrained by the limitations of such models. In this study, we focused on an idealized street canyon (the basic component of city structures and urban layouts) which is suited for the purpose of this study and the sensitivity analysis of corresponding parameters. For demonstration purposes, a graphical layout of an idealized street canyon that is simulated in the model has been plotted in Figure 2. In this plot, the H/W ratio (aspect ratio) concept and different wind directions are sketched graphically.
For initializing simulations in addition to variables that are changing through each scenario, in ENVI-met, we need some parameters which are constant for all scenarios. Atmospheric data such as air temperature, relative humidity, and wind speed are among those. For such parameters, we used the meteorological database available for Chicago metropolitan area during the heatwave of July 1995 [46]. Considered values for initial atmospheric boundary layer condition, spatial parameters, and other information regarding location, date, time, and duration of simulations are reflected in Table 1.
2.2. ENVI-met Output Post-Processing and Statistical Analysis
The ENVI-met model binary output files (EDX/EDT) were exported to netCDF files, allowing the further analysis of output files in the other platforms. For each scenario, a three-dimensional array (x = 50, y = 50, z = 40) representing the domain conditions at each hour was output for each of 12 timesteps. To avoid the flow inside the canyon being influenced by the domain size, we considered a sufficient number of grids from the borders. All model outputs from the computational fluid dynamics portion of ENVI-met were converted to Universal Thermal Comfort Index (UTCI) using a Python package called “Pythermalcomfort” [49]. Beyond meteorological conditions such as air temperature, thermal comfort needs to take into account various indices of human energy balance such as skin wittedness, clothing, and metabolism [50]. There are several metrics for measuring thermal comfort, such as Predicted Mean Vote (PMV) [51], Perceived Temperature (PT) [52], Outdoor Standard Equivalent Temperature (OUT_SET) [53], Physiologically Equivalent Temperature (PET) [54] and UTCI [55]. UTCI is based on a state-of-the-art thermo-physiological model and has been validated for different climates, seasons, time, and spatial scales and is derived using a non-linear combination of air temperature, relative humidity, wind speed, and mean radiant temperature. The reliability of this indicator for extreme heat situations and comprehensibility of its results by decision-makers (due to the reporting outcomes in centigrade) have made this thermal comfort indicator an appropriate means for comparing the results in this study.
For summarizing and reporting outputs, we used the average values of the response variables (i.e., temperature, relative humidity, wind speed, and mean radiant temperature) throughout the non-building horizontal domain area at the near-surface (pedestrian level) height (<2 m) at each simulation hour t, as is shown in Equation (1) for air temperature.
where and denote the position of each grid cell in the horizontal domain at z = 2 m, T refers to air temperature, building footprint refers to cells within the building footprint in the domain, is the mean for each simulated output in a timestep which was then used to calculate the UTCI at that timestep, as is shown in Equation (2) below:
where refers to mean air temperature, refers to mean relative humidity, refers to mean windspeed, and refers to the mean of mean radiant temperature, all at timestep t; f refers to the non-linear function executed using Pythermalcomfort package in Python, and refers to UTCI at timestep t.
2.2.1. RQ.1: UTCI Level Sensitivity Analysis
To analyze the sensitivity of UTCI level to different categories of physical and vegetation parameters and examine which parameters cause the largest variations in the UTCI level, we compared the “UTCI level change” of each scenario. The UTCI level change for each scenario indicates the difference between the average UTCI level of the whole canyon at 15:00 (peak time of temperature) and the average UTCI level of the scenario with the highest UTCI level at the same time.
2.2.2. RQ.2: Temporal Analysis
To estimate the effect magnitude of each independent variable temporally, we used a regression-based analysis. Due to the model’s long simulation time, we did the simulations for 12 h (10:00 to 22:00) and reported the results of regression analysis starting from 12:00 to 22:00 (the first two hours due to the inaccuracy of the initial simulation hours were cut off from the reports). In Equation (3), we provided the statistical specification of this regression model. Through analyzing the variance of corresponding input parameters and the model response (i.e., thermal comfort indices), we calculated a standardized regression coefficient (SRC) to quantitatively estimate the influence of input parameters on the modeled response. SRC performed as a stable index, especially in linear models and sophisticated global sensitivity methods [56]. SRC values for each timestep were obtained by running the regression model on the standardized form of variables. Standardization happened by implementing the so-called formula for calculating the Z-score (Equation (4)) of the observations of the response variables. SRC can provide good insights on the direction and magnitude of changes in the response with the changes of corresponding input parameters. Ranging from −1 to +1, the sign of SRC explains whether there is a negative or positive effect of the independent variable on the dependent variable, while the zero SRC value demonstrates zero estimated effect of the variable. Moreover, the absolute magnitude of the SRC signifies the parameter’s importance, in which higher values indicate the parameter’s higher impact on changing the model output while holding the other variables’ effect constant. In this study, as all independent variables are categorical, the SRC of each variable is interpreted as the difference in the predicted value of the response (thermal comfort indices) when each category of independent variables switches from the reference point. Here, the reference categories are the shallow canyon, perpendicular orientation toward the wind, the asphalt surface material, and no vegetation for both green type and density variables.
where refers toin 1~I, where I = 126 (number of scenarios), t refers to t in 12~T, where T = 24, refers to the error associated with each scenario, refers to the error associated with each scenario’s timestep, refers to the intercept, to refers to the estimated coefficients of explanatory variables, and refers to the dependent variable (e.g., temperature and relative humidity).
where refers to variable observations, refers to the mean of variable observations, refers to the standard deviation of variable observations, and refers to the standard score.
2.2.3. RQ.3: Exploration of Parameter’s Interactive Effect
To explore the interactive effect of physical and vegetation parameters and their maximum UTCI reduction potential in different contexts, we estimated the average effect of parameters in UTCI reduction when grouped by other parameters. The reported UTCI reduction in these analyses refers to the difference between the modeled UTCI level of each scenario (which is the average UTCI level of the whole canyon area below the 2-m height at 15:00) and the average UTCI of the whole canyon below the 2-m height in the worst-case scenario (the scenario with the highest average UTCI level) at 15:00.
2.2.4. RQ.4: Scenario Analysis
To compare scenarios temporally in terms of thermal stress level and duration, we plotted the UTCI value distributions (minimum, maximum, average, and quartiles) of scenarios with different green types and densities during simulation hours (12:00 to 22:00) in different canyon types. Moreover, we used the average UTCI values of the grid points of whole canyon areas below 2 m in height to present the hourly UTCI level change in six selected scenarios of vegetation and physical layouts to demonstrate average and extreme scenarios in terms of thermal stress level and duration.
3. Results and Discussion
3.1. UTCI Level Sensitivity Analysis
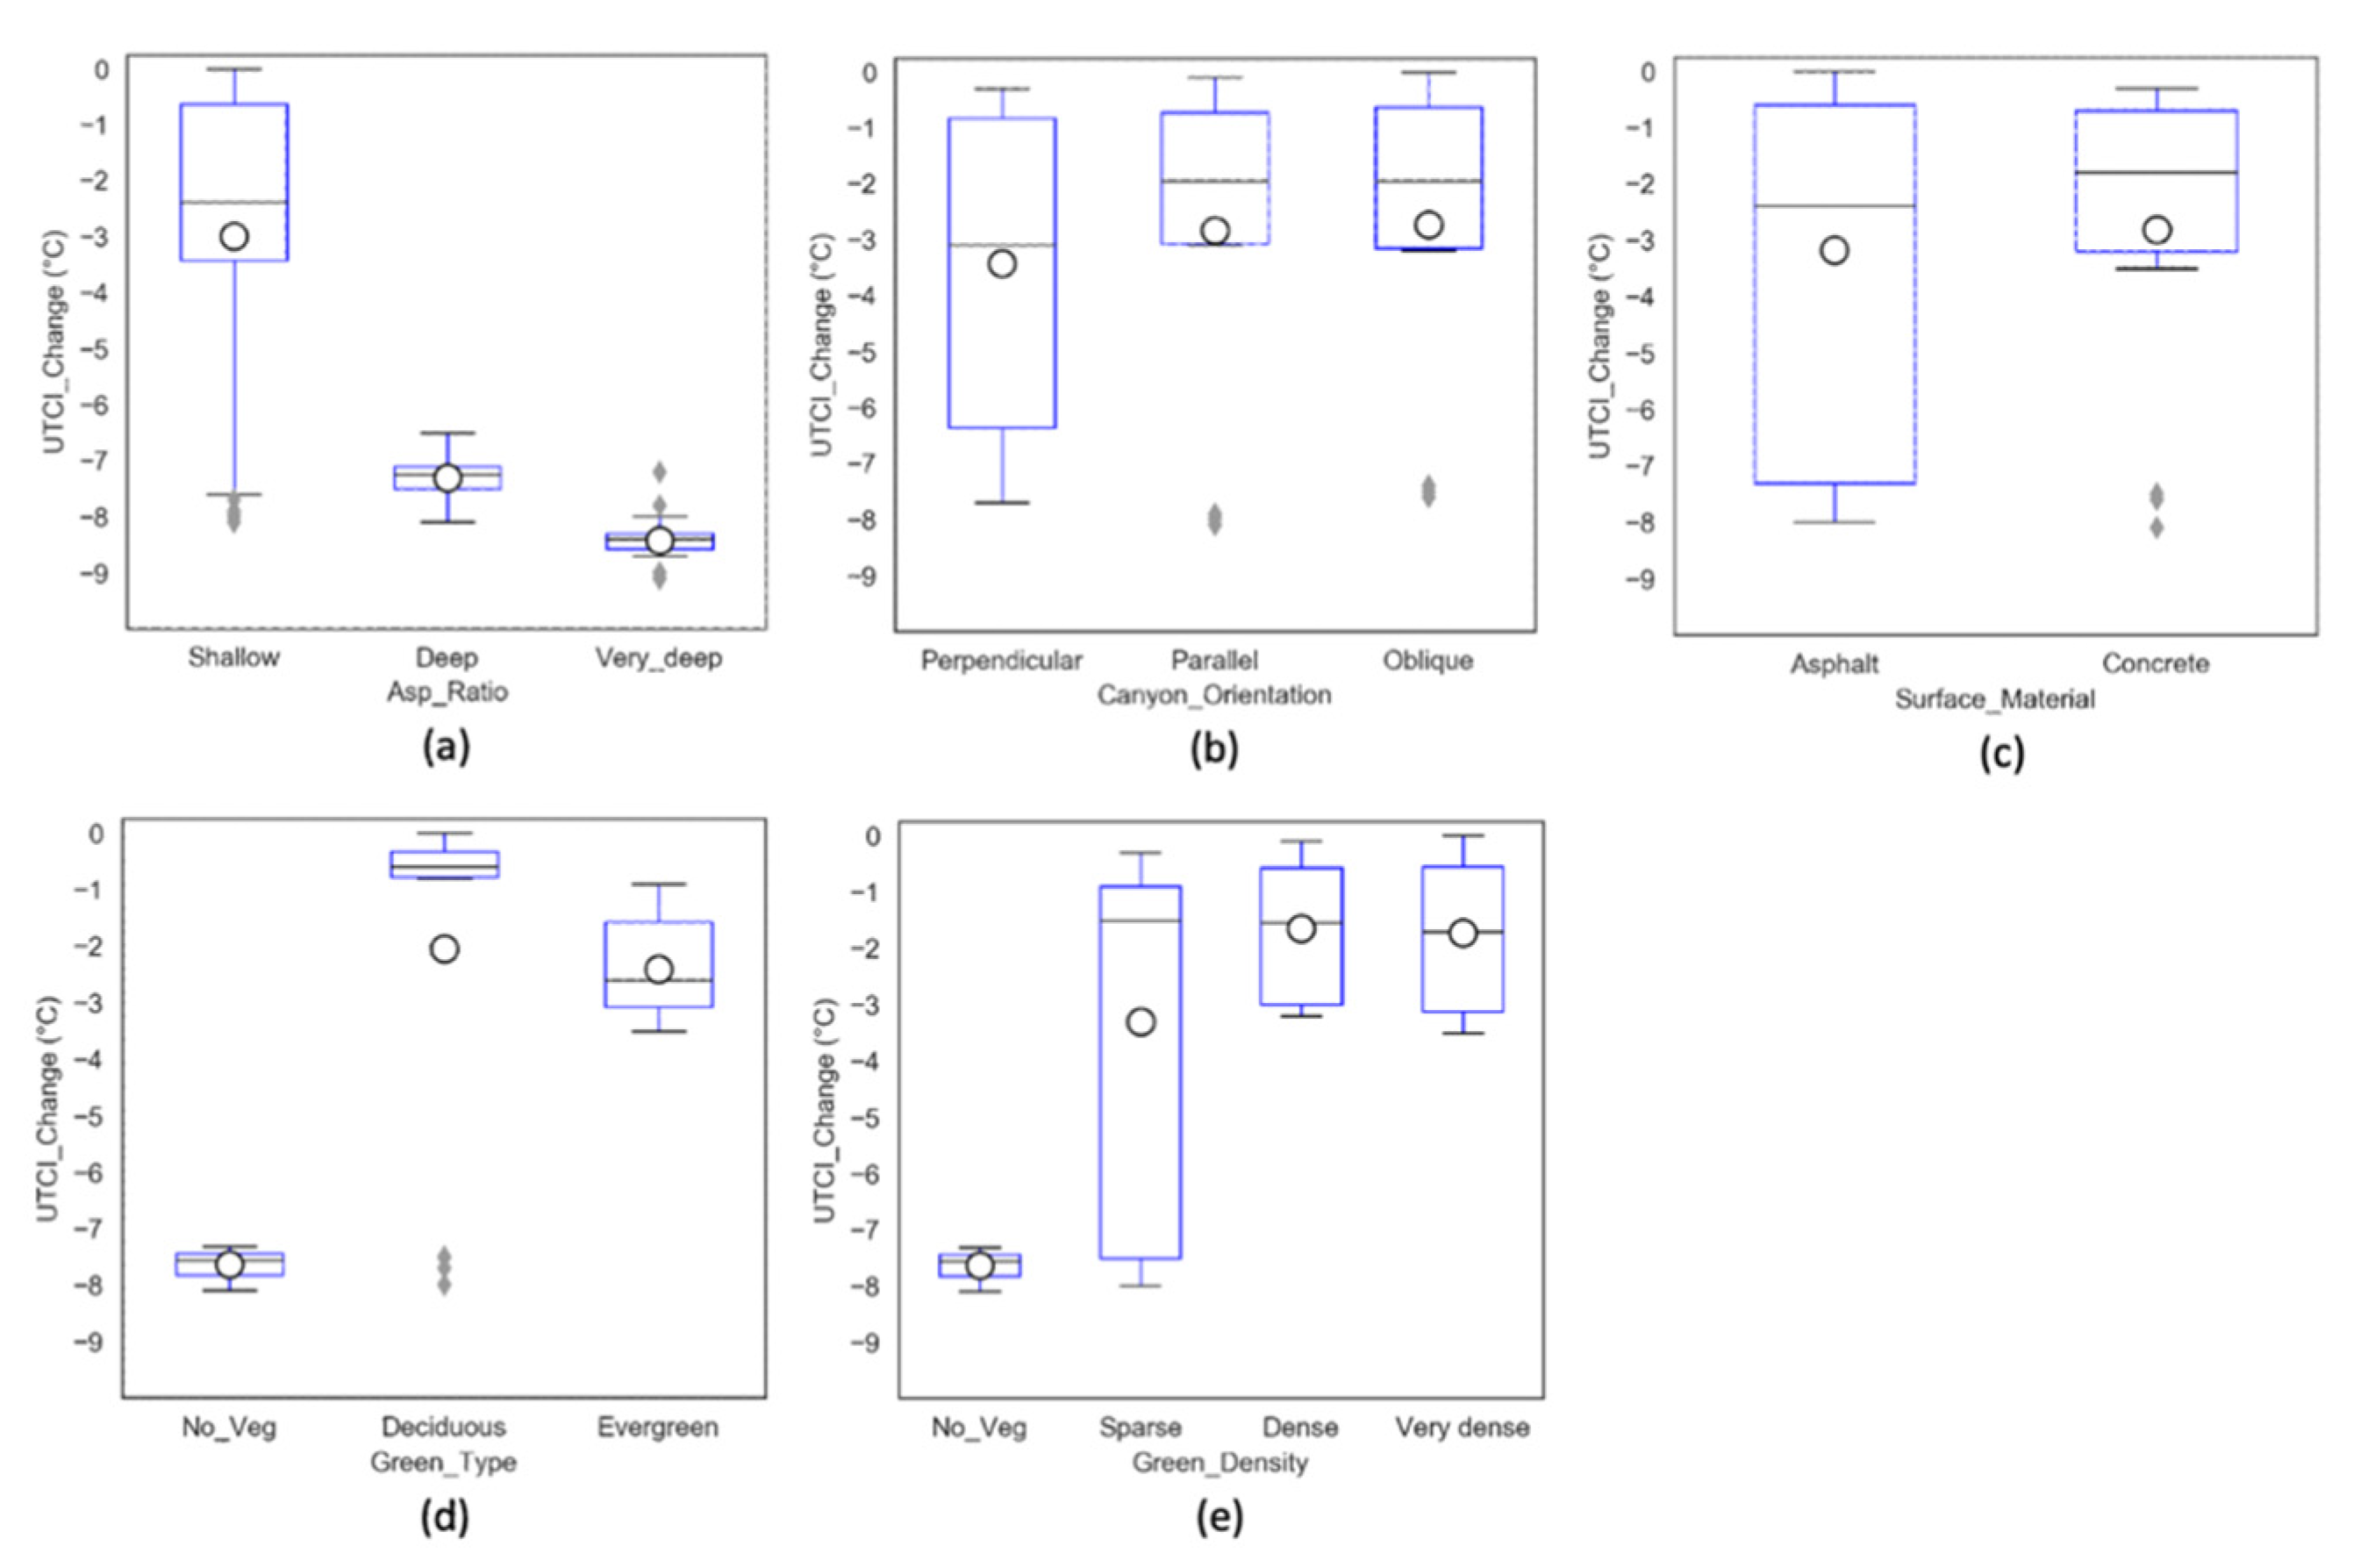
In Figure 3, we presented the UTCI level’s sensitivity to different categories of parameters. Analyses showed that the UTCI level change is most sensitive to the aspect ratio and changing the depths of the street canyon gives the most control over the UTCI level change. According to Figure 3a, scenarios with very deep street canyons (ratio of 3:1), on average, have the lowest UTCI level and highest potential in UTCI reduction. However, as the highest variance in UTCI level was observed in shallow canyons, we conducted further analyses for the sensitivity of other physical and vegetation parameters to the UTCI level change among this category of street canyons (Figure 3b–e). Comparing the average UTCI level change in canyons with a different orientation toward the prevailing wind showed that the perpendicular orientation has the highest impact in changing and reducing UTCI level compared to the parallel and oblique directions (Figure 3b). The performance of parallel and oblique directions was observed to be almost equal. Among physical parameters, in this study, different categories of surface materials (including asphalt and concrete) did not show a very significant difference to each other in the average UTCI level change and reduction (Figure 3c). However, the variance of UTCI level was higher among canyons with the asphalt material. Comparing the average UTCI level of shallow canyons with different vegetation types and densities showed that in the case of the presence of vegetation in the canyon, evergreen types of trees in the sparser form of tree planting can have a higher positive impact in reducing the UTCI level (Figure 3d,e). The impact of vegetation in other types of canyons and possible explanations for the previous observation will be discussed in the next sections.
3.2. Temporal Analysis
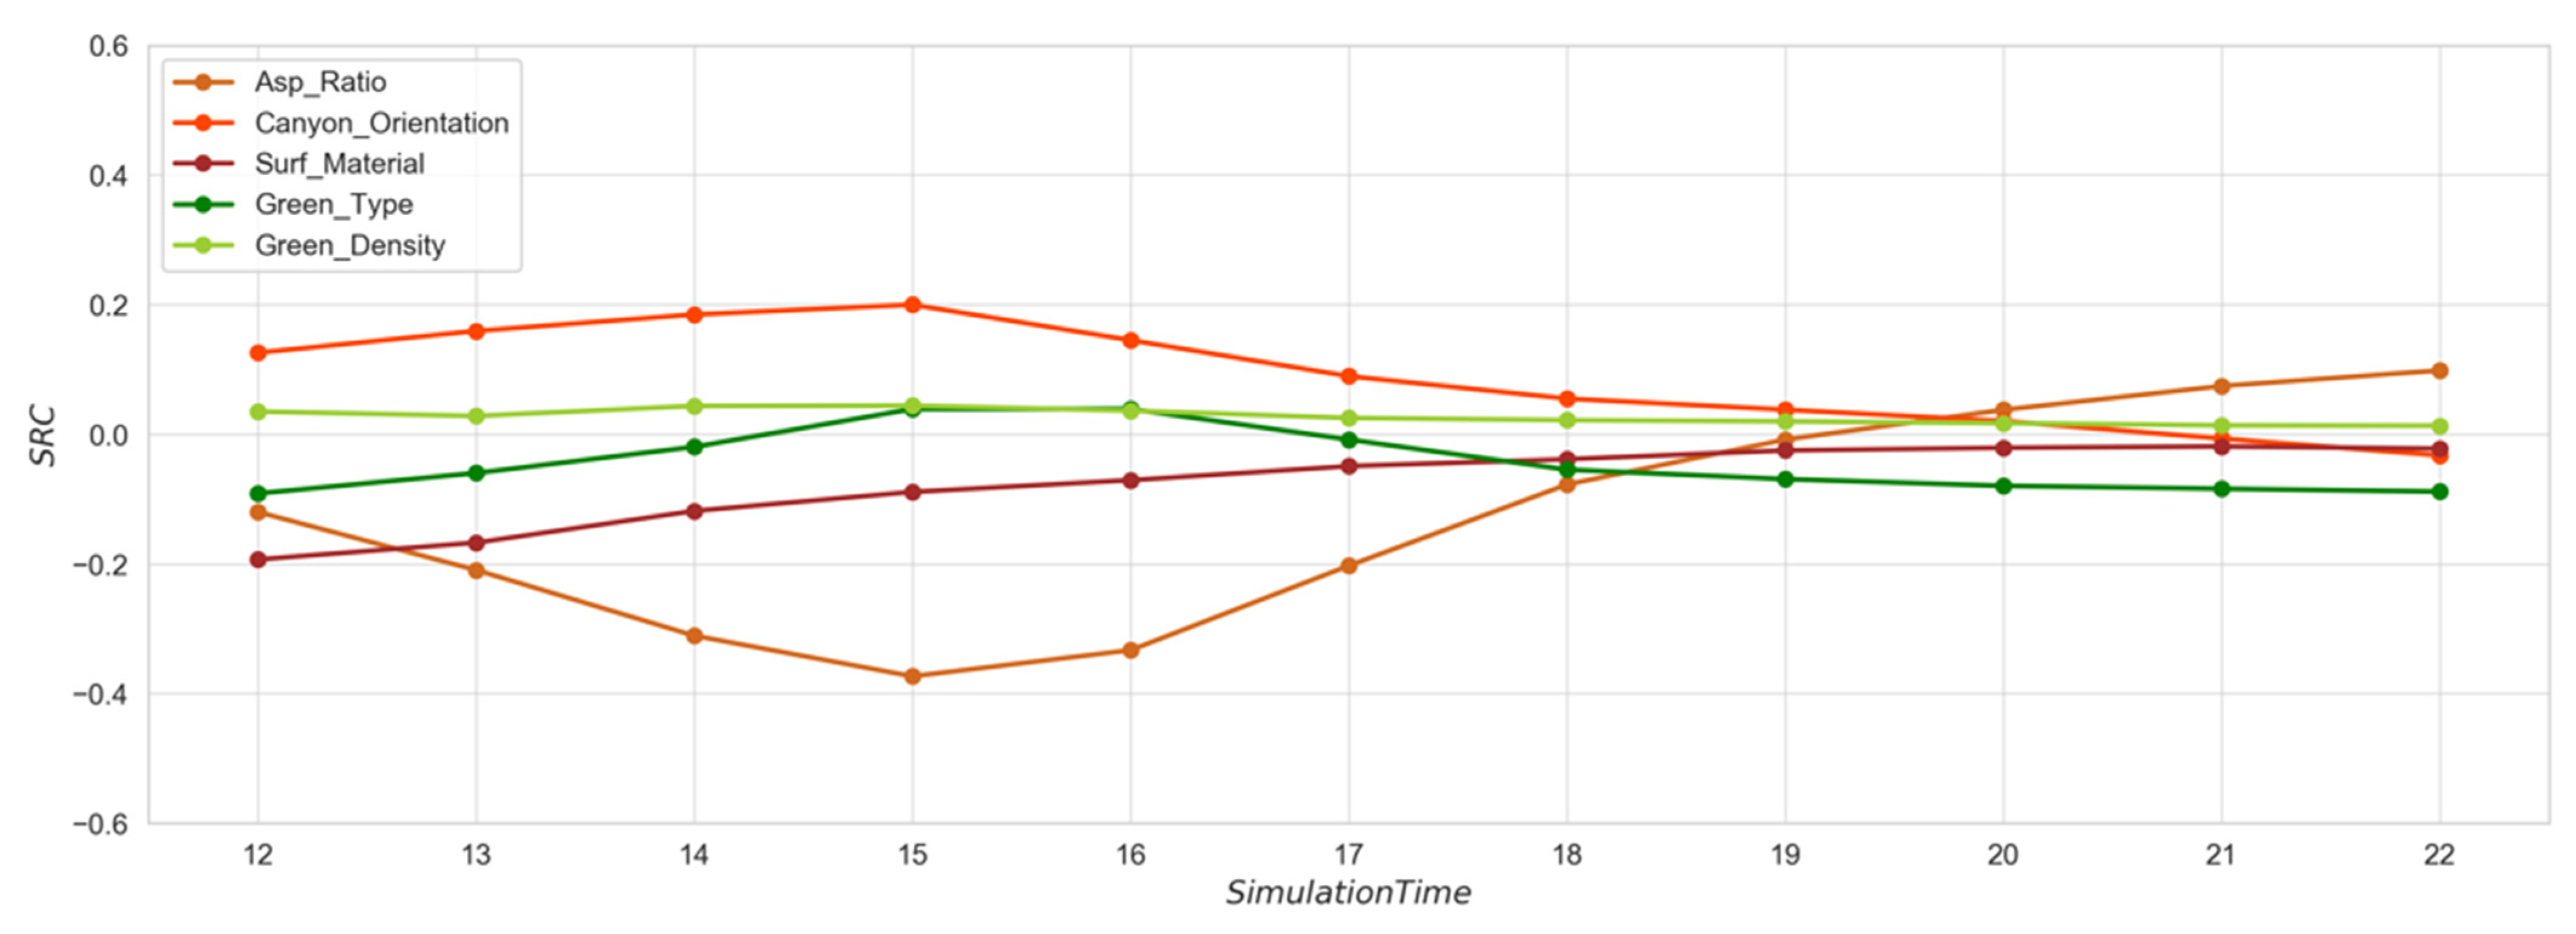
As reflected in Figure 4, the magnitude of effect (i.e., SRC values) of physical parameters on thermal comfort indices such as temperature varies during a day (simulation time). This issue is mainly due to the natural diurnal fluctuations of thermal comfort indices, which are impacted by the urban canopy parameters. The temporal variations of temperature and relative humidity and the effect of built environments on these changes have also been reported in other studies [57,58].
According to our simulations, the impacts of physical factors such as aspect ratio and canyon orientation toward the prevailing wind on changing the near-surface temperature and relative humidity were not constant during different hours of a day. The maximum effects of aspect ratio and canyon orientation on the temperature variation were obtained at 15:00 (maximum temperature hour), while minimum effects were observed at the early hours of the day. The negative SRC values of the aspect ratio in Figure 4 shows that changing to deeper canyons (higher aspect ratios) can lower near-surface temperatures during the daytime. The positive value of canyon orientation in the same plot shows that changing the canyon orientation toward the prevailing wind from the perpendicular to parallel and oblique would result in an increase in the canyon near-surface temperature during the daytime. Moreover, in this study, changing the canyon pavement’s surface material from asphalt to concrete resulted in a slight decrease in near-surface temperature during the daytime; however, this effect faded through the later hours of simulation time. To further investigate the significance of each variable on changing temperature, in Table 2, we reported the regression p-values at each timestep. According to this table, there was a statistically significant relationship between the physical parameters and temperature variations in most timesteps.
As it was expected, the effect magnitude of physical parameters on changing relative humidity shows an opposite trend, yet the maximum effects still were obtained at 15:00. Extracting the hourly SRC value of physical parameters for the wind speed and mean radiant temperature (the other two important indices of thermal comfort) showed a constant value of SRC, which implies the time independence of physical parameters’ effects on these two parameters.
Unlike physical parameters, vegetation parameters represented an almost constant effect on changing temperature and relative humidity during different hours of a day. Overall, compared to the physical parameters, vegetation parameters (type and density) showed a lower impact on changing temperature and relative humidity. This result is in line with other studies using CFD models, which investigated the role of greenery quantity and type and reported the slight ambient cooling effects of high-density vegetation [59,60,61]. The blocking effect of vegetation, especially when planted with high densities on wind speed and outgoing longwave radiation, has been identified as the main reason for its lower impact on thermal comfort enhancement at the street canyon scale [62,63].
However, other studies have shown that vegetation can minimize the solar radiant absorption and lower surface and air temperature through shading and evapotranspiration [64,65]. Thus, when vegetation is planned to be implemented as a heat mitigation strategy, decision-makers might need to consider different approaches to maximize their positive impact and reduce the blocking effect. For example, promoting other forms of vegetation cover, such as building-facade and rooftop greening, using particular types of trees, or spatial considerations of new greenery, can be among those strategies.
3.3. Parameter Interactive Effects
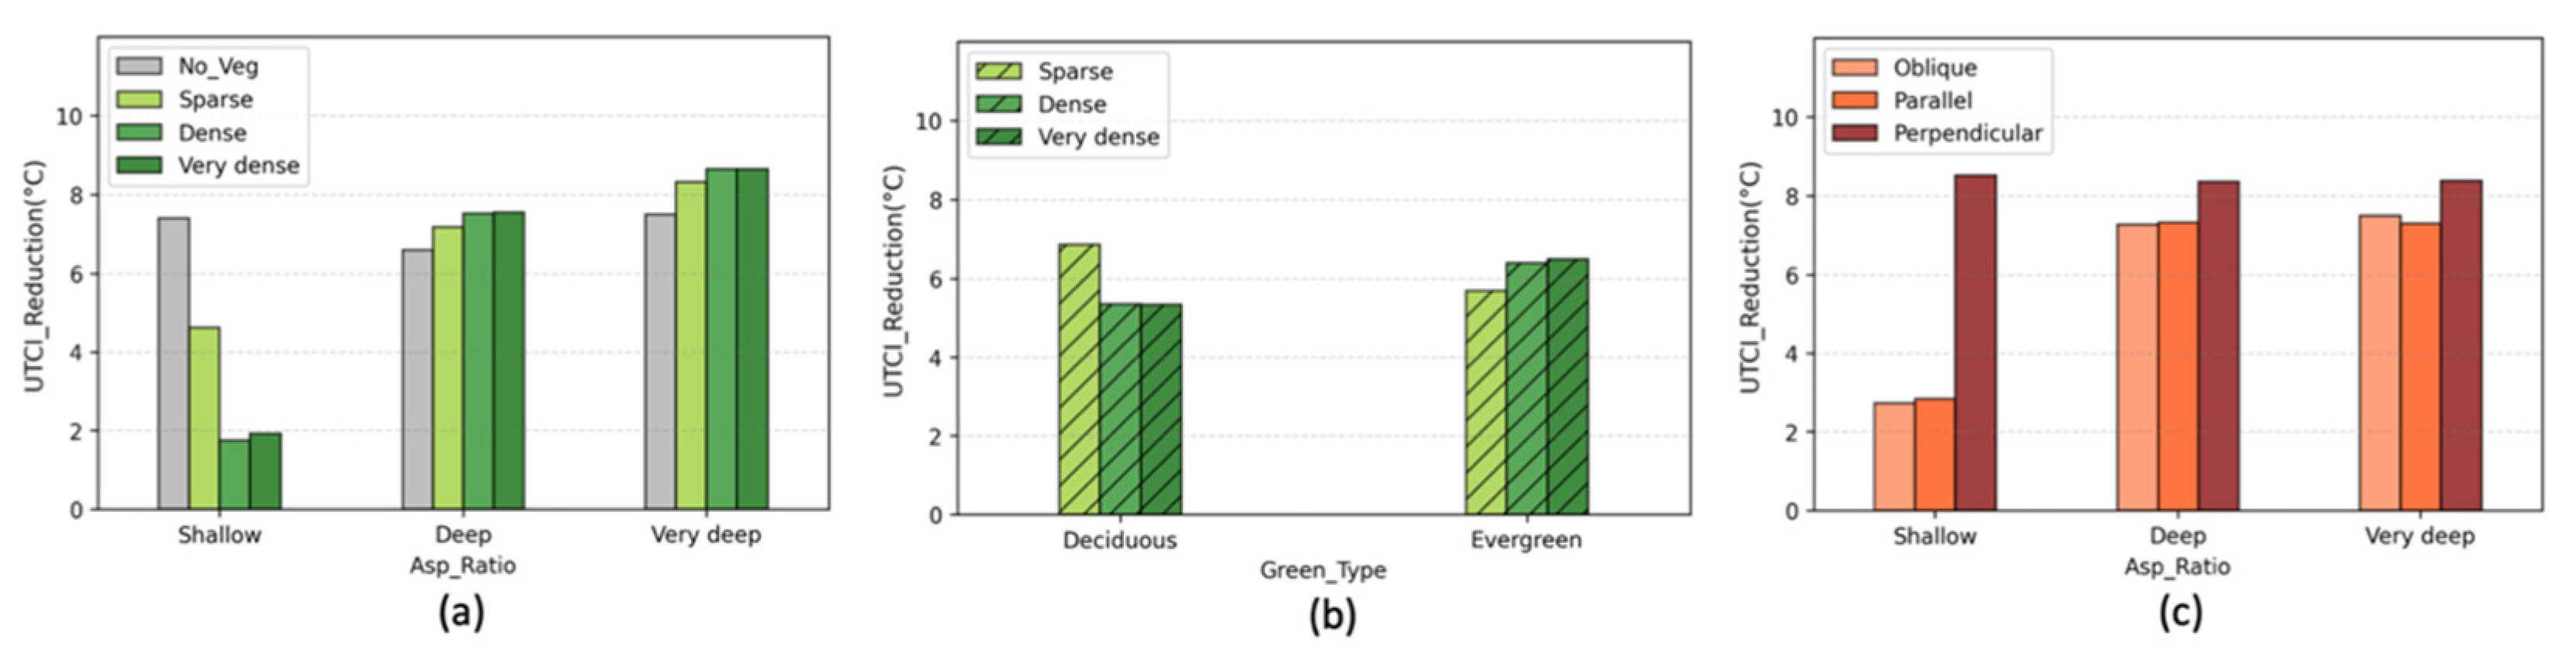
According to Figure 5a, in the shallow canyon, the presence of high-density vegetation did not considerably reduce the UTCI level, while in deeper canyons, a higher density of vegetation resulted in a significant UTCI level reduction. In Figure 5b, we examined the potential impact of two different tree types (deciduous and evergreen) with different densities. The result showed the sparser density of the deciduous and higher density of evergreen tree types are more effective in reducing the average UTCI level in canyons. Figure 5c represents the relative effect of different orientations of street canyons toward the prevalent wind with respect to the aspect ratio. Overall, the perpendicular orientation appeared to be more effective in reducing UTCI level; however, in shallow canyons, this orientation was significantly more favorable for UTCI reduction rather than oblique and parallel directions.
3.4. Scenario Analysis
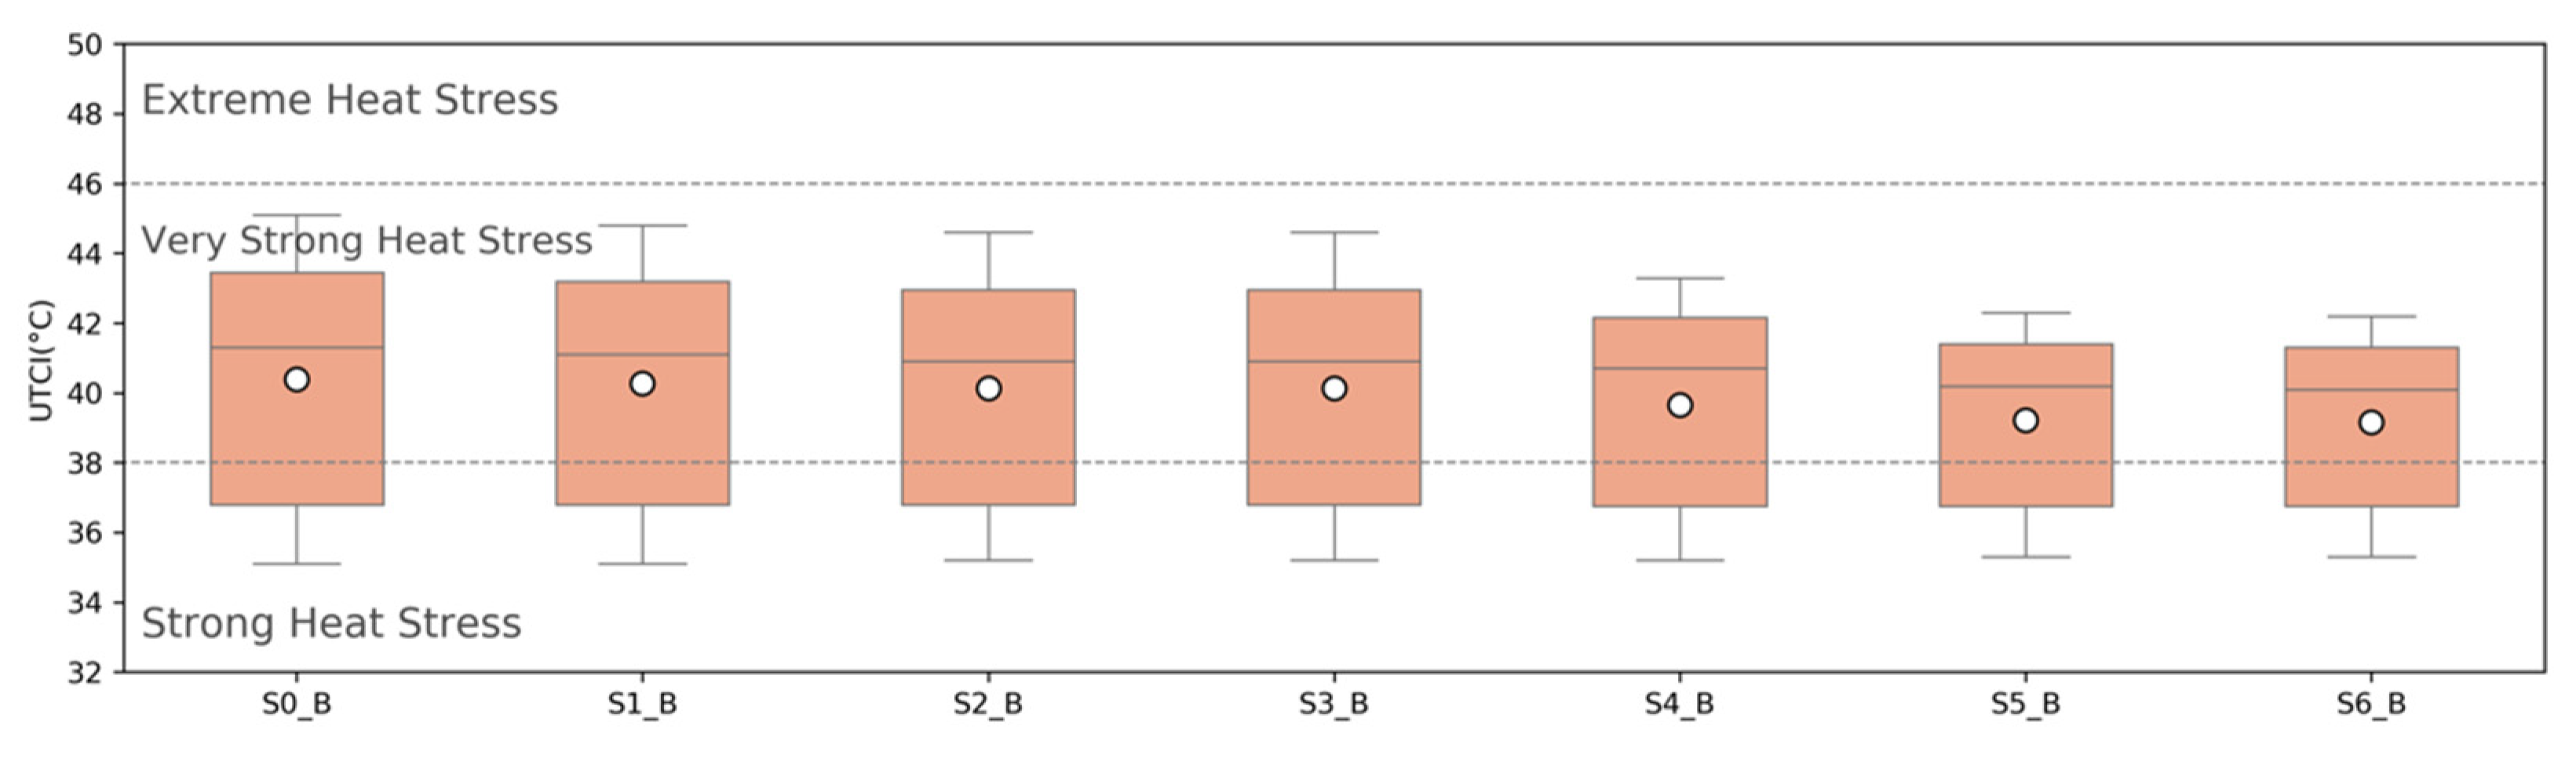
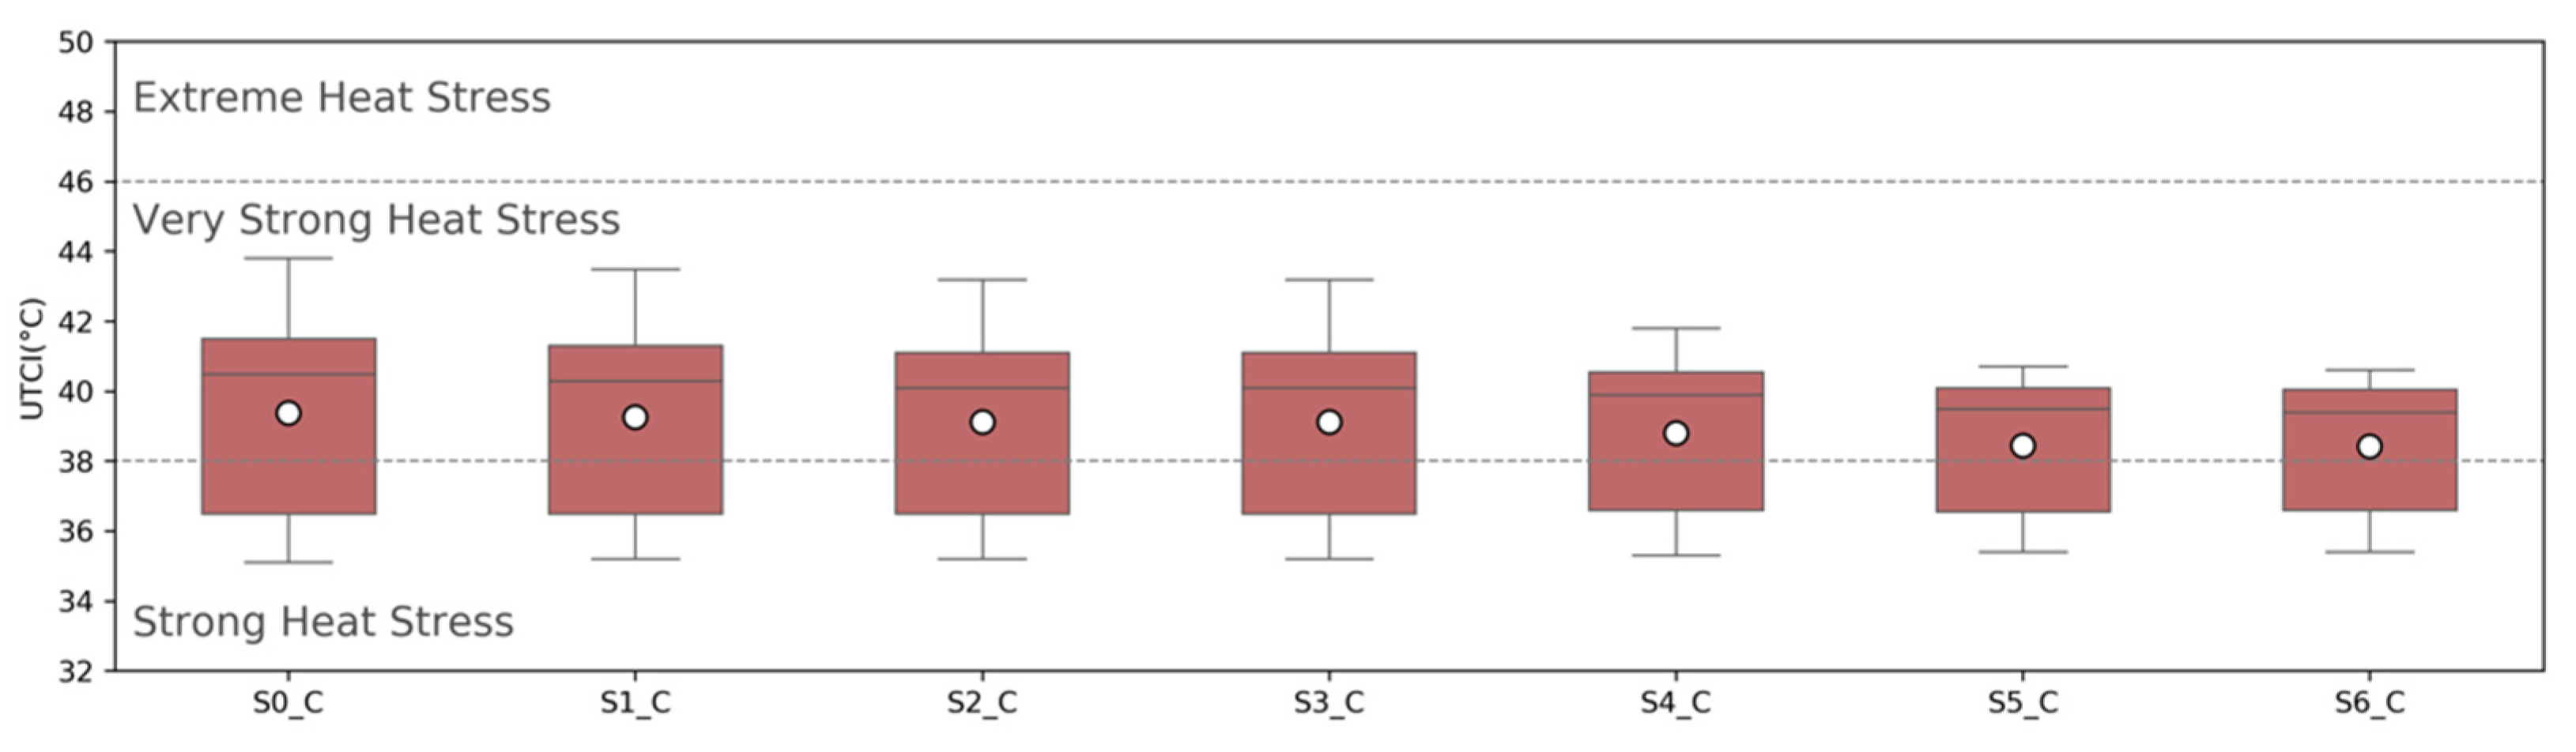
To further examine vegetation parameters’ contextual impacts on street canyons’ thermal condition and the duration of heat stress, in Figure 6, Figure 7 and Figure 8 we plotted the UTCI distributions (minimum, maximum, average, and quartiles) of scenarios with different green types and densities (Table 3) during simulation hours (12:00 to 22:00) in different canyon types. Each boxplot corresponds to the UTCI range of a single scenario over the simulation hours. According to these plots, in most scenarios in shallow canyons, the UTCI reached the extreme heat-stress level (with an average duration of 2 h and 15 min). However, in deep and very deep canyons, none of the scenarios’ peaks reached the extreme heat stress level. The average duration of the very strong heat stress level for shallow canyon scenarios was observed to be 5 h and 16 min, and for deep and very deep canyons, it was observed to be 4 h (Figure 9). Moreover, the UTCI level fluctuation was more significant in shallow canyons; this can be attributed to the greater exposure of such canyons to solar radiation and more absorption and reflection. In contrast, in deeper canyons, the enclosure of the street area by tall buildings can hamper both the ventilation and radiant reflection and result in a more constant thermal situation and a lower difference between the minimum and maximum UTCI levels. Comparing different vegetation scenarios in different canyon types also shows that in shallow canyons, the presence of vegetation (especially in higher density and with deciduous green type) raised the average UTCI level, while in deeper canyons, the presence of a higher density of evergreen types of trees lowered both the average UTCI level and the duration of very strong heat stress level.
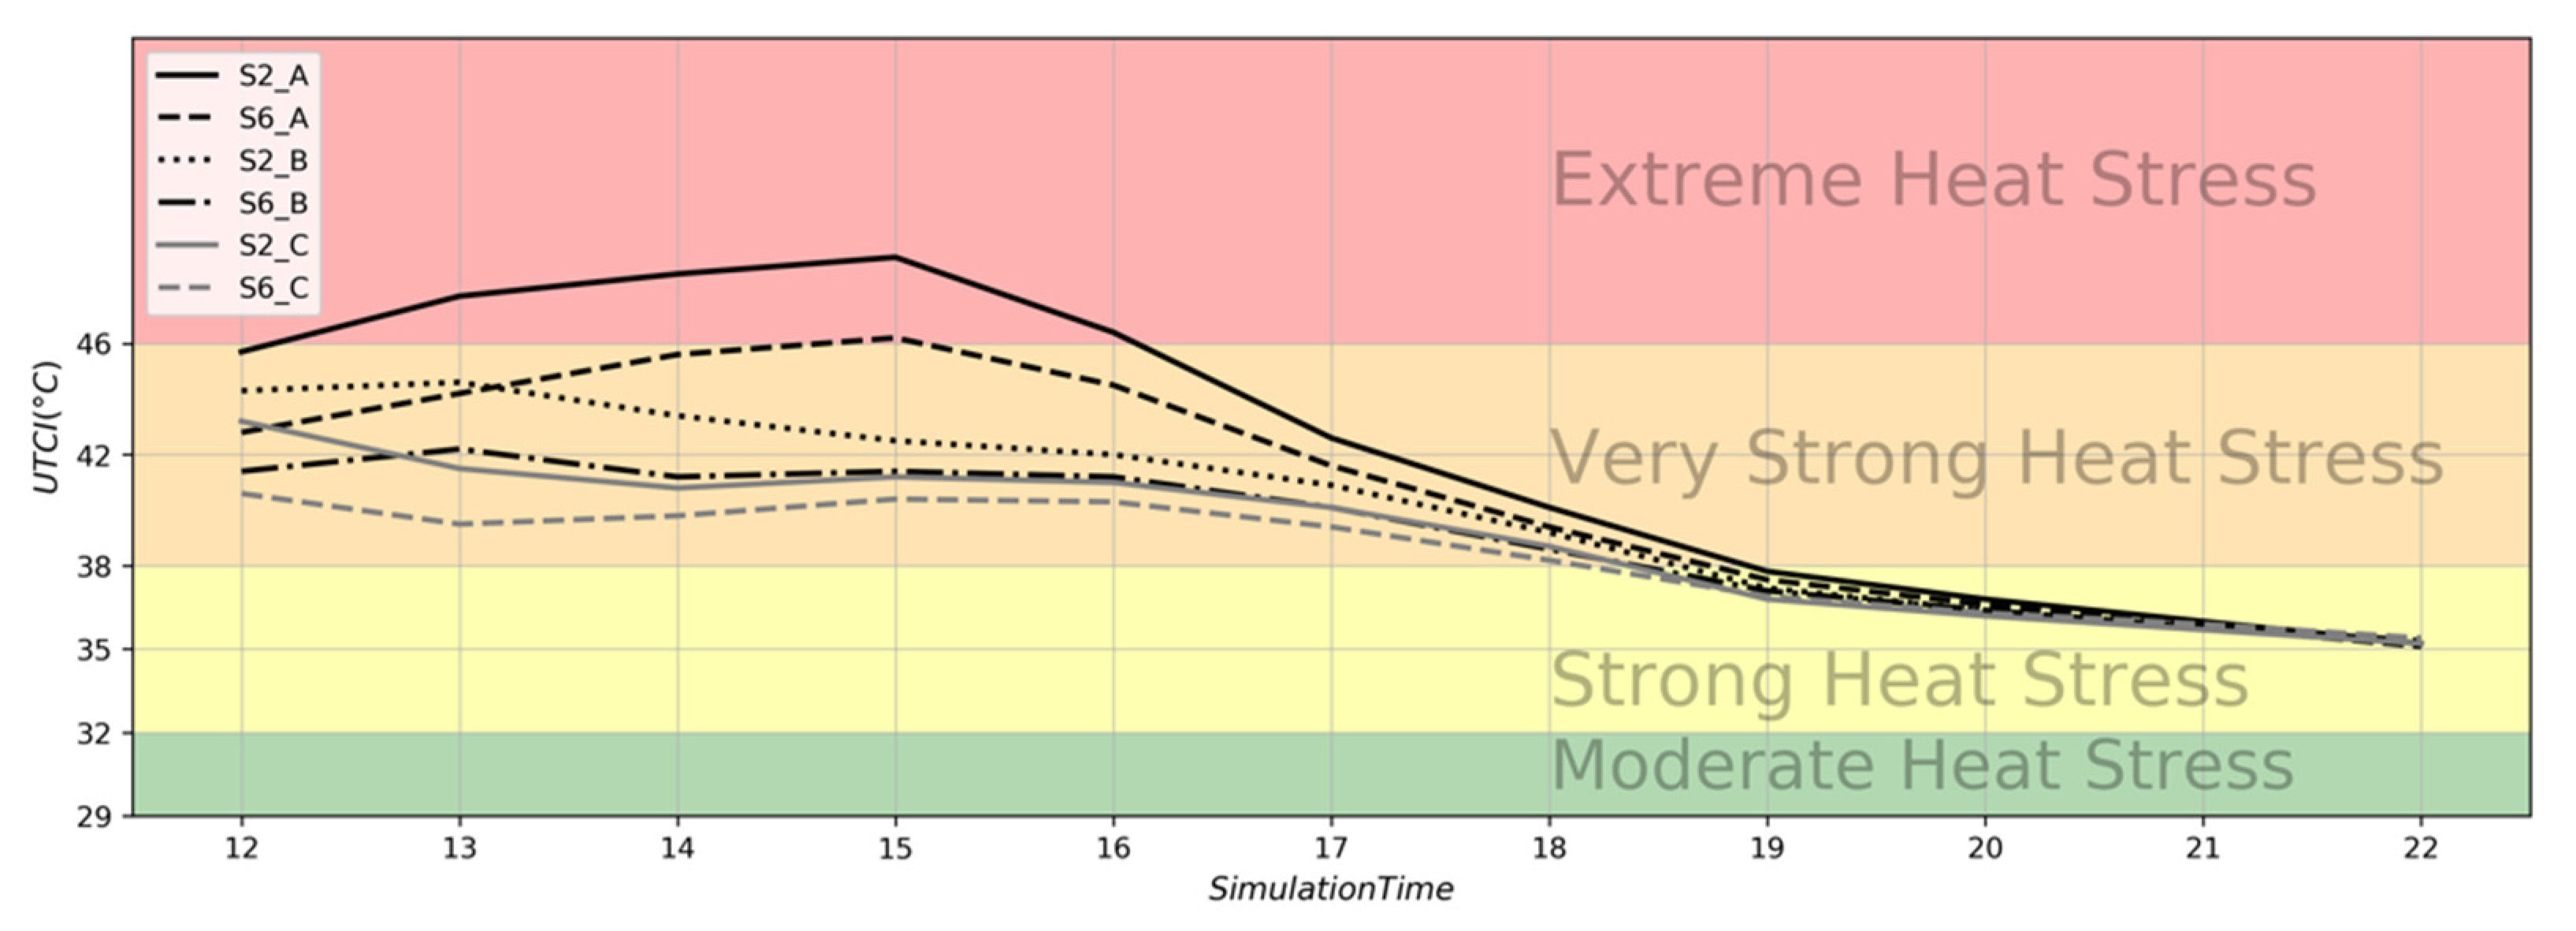
In Figure 9, we presented the UTCI level change in six selected scenarios (their characteristics can be found in Table 3) during simulation hours. Those scenarios were chosen based on analyzing the hourly distribution of the UTCI level data points of all scenarios. The fluctuations and a spike in UTCI level at 15:00 in shallow canyons are also evident in this plot (S2_A and S6_A). The 8.5 °C difference between the maximum temperature of worst and best-case scenarios (S2_A and S6_C) in terms of UTCI level shows the impact of both physical (aspect ratio) and vegetation (type and density) parameters in changing the hourly thermal comfort level.
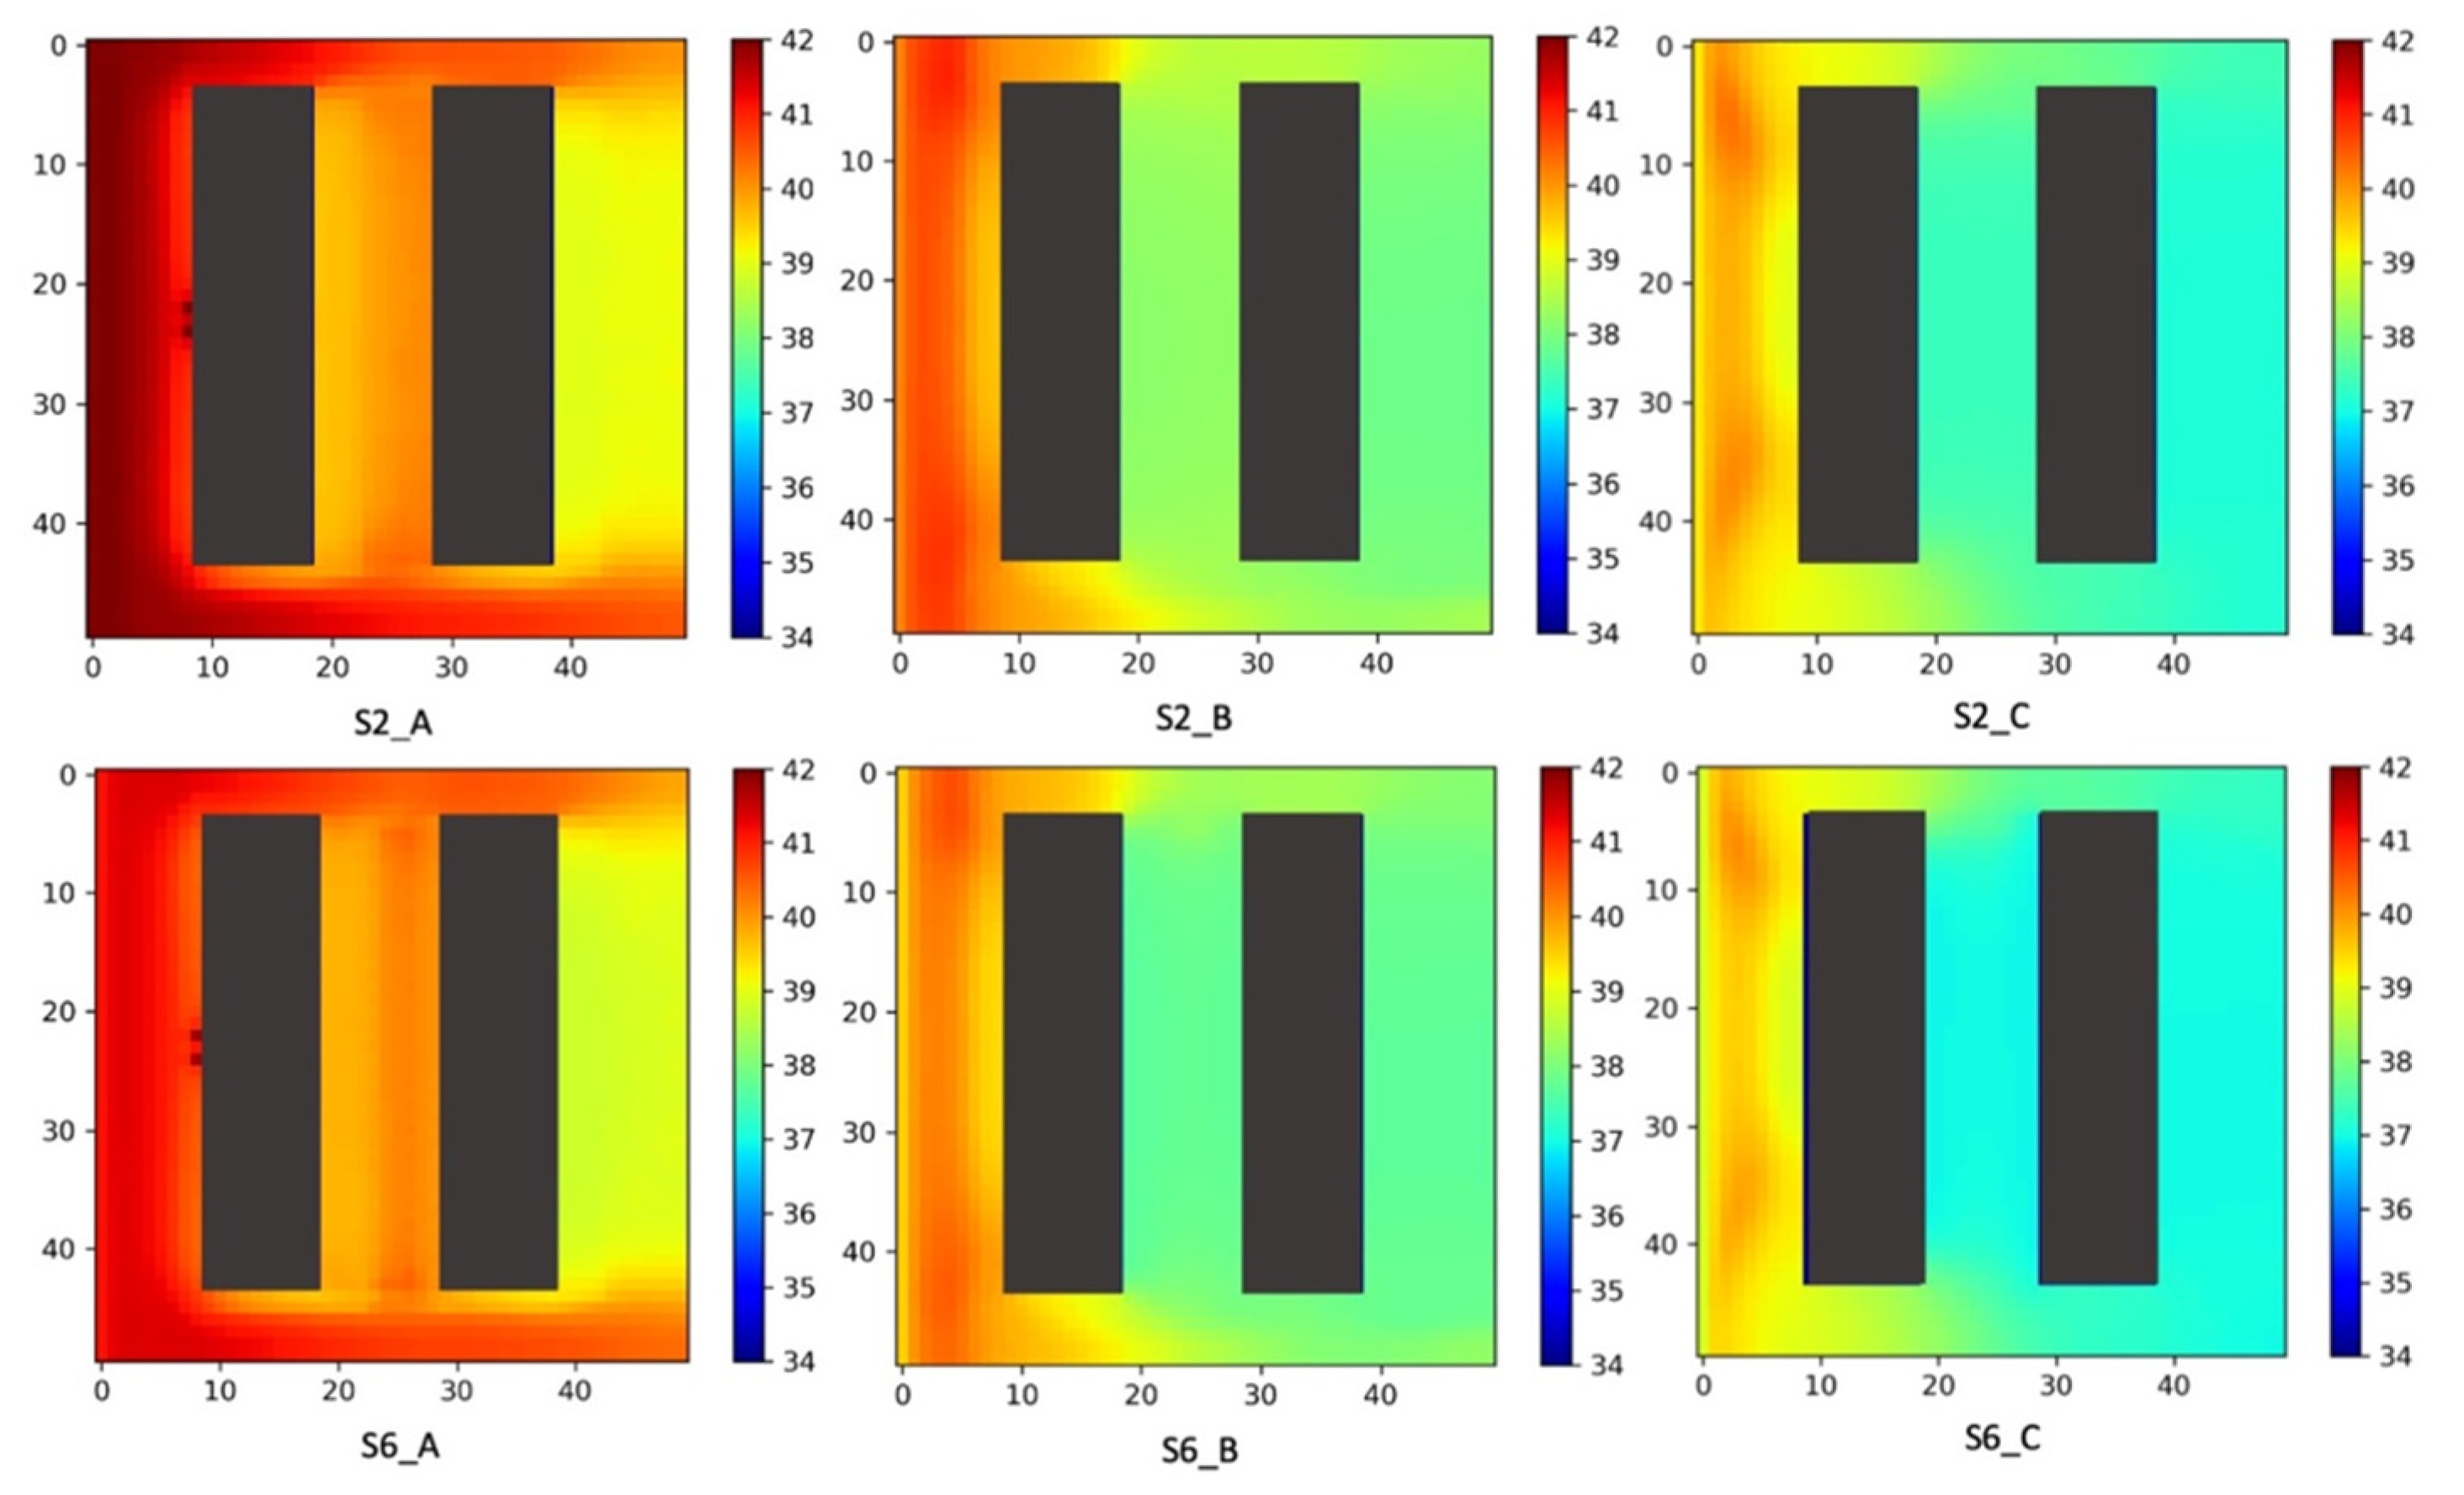
Figure 10 also shows the spatial distribution of simulated air temperature at 15:00 in these scenarios. Red and yellow colors in these plots demonstrate higher air temperatures, whereas the green and blue colors represent lower air temperatures. The overall temperature level of different scenarios is in line with the UTCI performance, where green scenarios in shallower canyons exhibit higher temperatures and in deeper canyons demonstrate lower temperatures. However, the distribution of air temperature in all those plots follows a similar pattern, in which shaded areas (including inside canyons) have lower temperatures compared to the unshaded areas (at 15:00).
4. Limitations
The results of this study were confined by limitations related to the applied microclimate model. Although we attempted to increase the robustness of our results by considering multiple scenarios and changing the input values, like other numerical simulation models, the ENVI-met model is sensitive to initial boundary conditions and input parameters. Therefore, in future studies, by applying a variety of meteorological conditions, we can analyze both the model and parameter sensitivity under various thermal situations to reduce the model uncertainty and expand the applicability of its results for various climatic conditions. The study is also completely based on numerical simulation, which allows for controlled testing of the interactive and isolated effects of various parameters but would be complemented by additional empirical data collection in diverse urban canyon environments.
In addition, in this study, the higher-level effects of parameters such as vegetation have not been considered. For example, the influence of vegetation on the local air quality might change the radiation balance and hence the thermal condition. Another important fact that should be mentioned here is the distinction between the microscale and mesoscale effect of the mitigation strategies such as vegetation. While the current study mainly focused on the microclimate in an idealized street canyon, the vegetation effect might have a different range on a broader scale. For example, comparing microscale and mesoscale simulations’ results demonstrates that a more intensive green scenario has a more accentuated effect on thermal comfort level at the mesoscale rather than the microscale [66]. Thus, estimating the trade-offs between the microscale and mesoscale impact of mitigation strategies for obtaining a more vivid picture of their actual effects seems important and necessary.
5. Conclusions
This paper analyzed the isolated and interactive effects of physical and vegetation parameters on thermal conditions in an idealized street canyon under an extreme heat situation. We conducted a sensitivity analysis of varying parameters that correspond with potential interventions such as greening and surface materials in various canyon geometries and orientations. Our results confirmed that the aspect ratio has a pivotal role in changing the UTCI level and can control other variables’ impact, such as vegetation. Analyzing the hourly UTCI level of scenarios with different vegetation types and densities demonstrated that the duration and magnitude of heat stress is largely controlled by the morphological context. We also analyzed the daily patterns of physical and vegetation parameters’ impacts on thermal comfort indices (temperature and relative humidity) and noticed the magnitude of the aspect ratio and canyon orientation’s effects fluctuate over a day, being magnified during the hottest hours of the day.
Comparing the hourly UTCI level of several scenarios and their characteristics proved that no fixed strategy exists for providing better thermal conditions, and the combination of different parameters can create various thermal situations. Therefore, special attention should be paid to the morphological and landscape features of urban areas when choosing heat mitigation strategies. Mitigating extreme heat and reducing the duration of exposure in cities would have critical implications for public health and safety. Regarding the limited capacity of cities for new developments, the results of such studies can be useful for urban planners and decision-makers to prioritize interventions based on sites’ characteristics. Such results can help avoid generic and inefficient heat mitigation strategies, which might even worsen the situation during an extreme heat event.
Author Contributions
Conceptualization, A.K. and T.C.L.; formal analysis, A.K.; writing—original draft preparation, A.K.; writing—review and editing, A.K. and T.C.L.; supervision, T.C.L.; funding acquisition, T.C.L. All authors have read and agreed to the published version of the manuscript.
Funding
This material is supported by the National Science Foundation under grant number 1735139, the Virginia Tech Open Access Subvention Fund, and the Virginia Tech Institute for Society, Culture, and Environment, through a seed grant awarded to Theodore Lim. Any opinions, findings, and conclusions or recommendations expressed in this material are those of the authors and do not necessarily reflect the views of the funding organizations.
Data Availability Statement
Data and analysis can be found in this repository.
Conflicts of Interest
The authors declare no conflict of interest.
Appendix A

Table A1.
Review of previous studies.
| Study | Case Study | Summary of Study Purpose | Model | Simulated Variables | Scenarios |
|---|---|---|---|---|---|
| [56] | Chongqing, China | Study the cooling effect of 4.5 ha urban forest park under different wind directions, wind speeds | ENVI-met | Wind direction, wind speed, building height (aspect ratio) | 12 |
| [25] | Hong Kong | Study the effect of different greening strategies under different building heights on ambient air temperature at pedestrian level | ENVI-met | Green coverage ratio, vegetation type, building type, building height (aspect ratio) | 33 |
| [24] | Hong Kong | Investigate the effect of two types of shading (vegetation and buildings) on pedestrian thermal comfort | ENVI-met | Vegetation type, building type, building height, street width (aspect ratio) | 46 |
| [67] | Bilbao, Spain | Study the effect of different vegetation types on thermal conditions in urban environments under various compactness levels (compact, low rise, compact mid-rise, open set high rise) | ENVI-met | Vegetation type, compactness (aspect ratio) | 21 |
| [68] | Beijing, China | Investigate the effect of urban green spaces within 18 sub-areas of a belt-shaped park in Beijing to determine how different types of green coverage can modify thermal comfort. | ENVI-met | Vegetation type, building ratio percentage | 18 |
| [33] | Phoenix, Arizona, US | Study how tree quantity and layout can change thermal condition in an existing neighborhood in Phoenix | ENVI-met | Vegetation density (number of trees), vegetation layout | 9 |
| [69] | Netherland | Study the impact of different urban forms (singular East-West and North-South, linear East-West and North-South, and a courtyard form) on thermal comfort | ENVI-met | Building configuration (compactness and direction) | 5 |
| [70] | Worcester, Massachusetts, US | Study the impact of urban geometry on the microclimate of open spaces | ENVI-met | Aspect ratio, surface materials, street canyon orientation | 4 |
| [71] | NA | Study the impact of tree planting patterns in street canyons with different aspect ratios | ENVI-met | Aspect ratio, vegetation density (tree aspect ratio and tree covered area), planting pattern, wind direction | 12 |
| [72] | Manchester, UK | Study the effect of green spaces on reducing surface and air temperature | ENVI-met | Vegetation type, vegetation density | 7 |
| [73] | Wuhan, China | Study the impact of vegetation type and layout | ENVI-met | Vegetation type, vegetation distribution (ART: aspect ratio of trees) | 3 |
| [32] | Toronto, Canada | How cool surfaces (roofs and pavements materials and vegetation) can control the duration of direct sun and mean radiant temperature | ENVI-met | Land surface cover (vegetation and surface material percentages), average building heights | 15 (5 models for each of three locations) |
| [23] | Phoenix, Arizona, US | Study the impact of urban form and landscape types on mid-afternoon temperature. Investigating effective urban form and design strategies for ameliorating the adverse effect of extreme heat in Phoenix, Arizona | ENVI-met | Sky view factor, mean building height, building surface fraction, impervious surface fraction, surface albedo | 13 |
| [74] | Mendoza, Argentina | Study the thermal behavior and energy consumption of three low-density social housing neighborhoods | ENVI-met | Street widths, layout grids, street orientations | 48 |
| [21] | Ghardaia, Algeria | Study the impact of aspect ratio and solar orientation on the pedestrian-level thermal comfort | ENVI-met | Aspect ratio, solar orientation | 16 |
| [75] | Tehran, Iran | Evaluating different strategies for daytime thermal comfort | ENVI-met | Roof and surface vegetation cover, surface albedo, building orientations | 6 |
| [76] | Mashhad, Iran | Proposing a new approach for city zoning based on the thermal comfort criteria | ENVI-met | Aspect ratio, tree canopy cover, canyon orientation, building surface material | NA (not mentioned) |
| [77] | Panama | Study the effectiveness of strategies based on biomimicry for mitigating the urban heat island effect | ENVI-met | Vegetation cover, roof, and pavement material | 3 |
| [78] | Erzurum, Turkey | Providing winter thermal comfort through design strategies | ENVI-met | Presence of hard pavement material, presence of site-specific plants, street top coverage, presence of ornamental pool | 5 |
| [66] | Toronto, Canada | Comparing the effect of greenery enhancement on both microscale and mesoscale | WRF and ENVI-met | Greenery density | 2 |
| [79] | Shenzhen, China | Simulating thermal comfort within a complex district of a low carbon city | an Urban Energy Balance model (UDC) | Land use and land cover | NA |
| [80] | Delhi, India | Study the impact of urbanization related changes on thermal comfort and urban heat island intensity using different types of land use/land cover data | WRF (Weather Research and Forecasting) | Land use and land cover | 4 |
| [81] | Mexico City, Mexico | Simulating the urban heat island effect based on the physical, urban, climatic characteristics of the site and its effect on indoor temperature | Energy Plus | Reflective materials, shading vegetation, urban convection, and radiation coefficient (height of buildings) | 3 |
| [82] | Kuala Lumpur, Malaysia | Study the efficiency of Road Pavement Solar Collector (RPSC) in mitigating urban heat island effect | ANSYS Fluent | RPSC setting, aspect ratio (H/W), L/W | 12 |
| [83] | Klang Valley, Malaysia | Evaluating the contribution of urbanization on urban climate and thermal comfort in Klang Valley (Greater Kuala Lumpur) | WRF/UCM (Urban Canopy Model) | Urban/vegetation fraction | 4 |
| [84] | London, UK | Assessing how the urban heat island effect influences the summertime adaptive capacity of traditional residential buildings | UWG (Urban Weather Generator) | Cooling load | 5 |
| [85] | Melbourne, Australia | Evaluating the contribution of urban greenery to human thermal comfort | VTUF-3D (Vegetated Temperatures of Urban Facets) | Vegetation variety and mix | 5 |
| [86] | Tehran, Iran | Evaluating various green scenarios on mitigating the urban heat island effect and improving the thermal comfort level | WRF/SLUCM (Single-Layer Urban Canopy Model) | Surface vegetation, green roof | 6 |
| [87] | Singapore | Predicting solar irradiance reaching urban surfaces due to urbanization and assessing thermal comfort | RADIANCE | Building orientation, pavement, vegetation | 4 |
| [88] | Beirut, Lebanon | Study the effect of building density, artificial surfaces, and vegetation on urban heat island effect | TEB (Town Energy Balance model) | Building, road, and vegetation area fraction | 6 |
References
- Theoharatos, G.; Pantavou, K.; Mavrakis, A.; Spanou, A.; Katavoutas, G.; Efstathiou, P.; Mpekas, P.; Asimakopoulos, D. Heat Waves Observed in 2007 in Athens, Greece: Synoptic Conditions, Bioclimatological Assessment, Air Quality Levels and Health Effects. Environ. Res. 2010, 110, 152–161. [Google Scholar] [CrossRef] [PubMed]
- Vaidyanathan, A. Heat-Related Deaths—United States, 2004–2018. MMWR Morb. Mortal. Wkly. Rep. 2020, 69, 729. [Google Scholar] [CrossRef] [PubMed]
- Managing the Risks of Extreme Events and Disasters to Advance Climate Change Adaptation: Special Report of the Intergovernmental Panel on Climate Change; Field, C.B.; Barros, V.; Stocker, T.F.; Dahe, Q. (Eds.) Cambridge University Press: Cambridge, UK, 2012; ISBN 978-1-139-17724-5. [Google Scholar]
- Alexander, L.V.; Arblaster, J.M. Assessing Trends in Observed and Modelled Climate Extremes over Australia in Relation to Future Projections. Int. J. Climatol. 2009, 29, 417–435. [Google Scholar] [CrossRef]
- Grundstein, A.J.; Williams, C.A. Heat Exposure and the General Public: Health Impacts, Risk Communication, and Mitigation Measures. In Human Health and Physical Activity during Heat Exposure; Hosokawa, Y., Ed.; SpringerBriefs in Medical Earth Sciences; Springer International Publishing: Cham, Germany, 2018; pp. 29–43. ISBN 978-3-319-75889-3. [Google Scholar]
- Li, D.; Bou-Zeid, E. Synergistic Interactions between Urban Heat Islands and Heat Waves: The Impact in Cities Is Larger than the Sum of Its Parts*. J. Appl. Meteorol. Climatol. 2013, 52, 2051–2064. [Google Scholar] [CrossRef] [Green Version]
- Klinenberg, E. Heat Wave: A Social Autopsy of Disaster in Chicago; University of Chicago Press: Chicago, IL, USA, 2002. [Google Scholar] [CrossRef]
- Grimm, N.B.; Faeth, S.H.; Golubiewski, N.E.; Redman, C.L.; Wu, J.; Bai, X.; Briggs, J.M. Global Change and the Ecology of Cities. Science 2008, 319, 756–760. [Google Scholar] [CrossRef] [Green Version]
- Landsberg, H.E. Man-Made Climatic Changes: Man’s Activities Have Altered the Climate of Urbanized Areas and May Affect Global Climate in the Future. Science 1970, 170, 1265–1274. [Google Scholar] [CrossRef]
- Oke, T.R. Climatic Impacts of Urbanization. In Interactions of Energy and Climate, Proceedings of an International Workshop Held in Münster, Germany, March 3–6, 1980; Bach, W., Pankrath, J., Williams, J., Eds.; Springer: Dordrecht, The Netherlands, 1980; pp. 339–361. ISBN 978-94-009-9111-8. [Google Scholar]
- Highfield, W.E.; Peacock, W.G.; Van Zandt, S. Mitigation Planning: Why Hazard Exposure, Structural Vulnerability, and Social Vulnerability Matter. J. Plan. Educ. Res. 2014, 34, 287–300. [Google Scholar] [CrossRef]
- Yoo, S. Investigating Important Urban Characteristics in the Formation of Urban Heat Islands: A Machine Learning Approach. J. Big Data 2018, 5, 2. [Google Scholar] [CrossRef] [Green Version]
- Zhang, Y.; Murray, A.T.; Turner, B.L. Optimizing Green Space Locations to Reduce Daytime and Nighttime Urban Heat Island Effects in Phoenix, Arizona. Landsc. Urban Plan. 2017, 165, 162–171. [Google Scholar] [CrossRef]
- Erell, E.; Pearlmutter, D.; Boneh, D.; Kutiel, P.B. Effect of High-Albedo Materials on Pedestrian Heat Stress in Urban Street Canyons. Urban Clim. 2014, 10, 367–386. [Google Scholar] [CrossRef]
- Grimmond, S. Urbanization and Global Environmental Change: Local Effects of Urban Warming. Geogr. J. 2007, 173, 83–88. [Google Scholar] [CrossRef]
- Sini, J.-F.; Anquetin, S.; Mestayer, P.G. Pollutant Dispersion and Thermal Effects in Urban Street Canyons. Atmos. Environ. 1996, 30, 2659–2677. [Google Scholar] [CrossRef]
- Arnfield, A.J. Two Decades of Urban Climate Research: A Review of Turbulence, Exchanges of Energy and Water, and the Urban Heat Island. Int. J. Climatol. 2003, 23, 1–26. [Google Scholar] [CrossRef]
- Fahmy, M.; Sharples, S. On the Development of an Urban Passive Thermal Comfort System in Cairo, Egypt. Build. Environ. 2009, 44, 1907–1916. [Google Scholar] [CrossRef]
- Montávez, J.P.; Jiménez, J.I.; Sarsa, A. A Monte Carlo Model Of The Nocturnal Surface Temperatures In Urban Canyons. Bound. -Layer Meteorol. 2000, 96, 433–452. [Google Scholar] [CrossRef] [Green Version]
- Achour-Younsi, S.; Kharrat, F. Outdoor Thermal Comfort: Impact of the Geometry of an Urban Street Canyon in a Mediterranean Subtropical Climate—Case Study Tunis, Tunisia. Procedia-Soc. Behav. Sci. 2016, 216, 689–700. [Google Scholar] [CrossRef] [Green Version]
- Ali-Toudert, F.; Mayer, H. Numerical Study on the Effects of Aspect Ratio and Orientation of an Urban Street Canyon on Outdoor Thermal Comfort in Hot and Dry Climate. Build. Environ. 2006, 41, 94–108. [Google Scholar] [CrossRef]
- Pearlmutter, D.; Berliner, P.; Shaviv, E. Integrated Modeling of Pedestrian Energy Exchange and Thermal Comfort in Urban Street Canyons. Build. Environ. 2007, 42, 2396–2409. [Google Scholar] [CrossRef]
- Middel, A.; Häb, K.; Brazel, A.J.; Martin, C.A.; Guhathakurta, S. Impact of Urban Form and Design on Mid-Afternoon Microclimate in Phoenix Local Climate Zones. Landsc. Urban Plan. 2014, 122, 16–28. [Google Scholar] [CrossRef]
- Morakinyo, T.E.; Kong, L.; Lau, K.K.-L.; Yuan, C.; Ng, E. A Study on the Impact of Shadow-Cast and Tree Species on in-Canyon and Neighborhood’s Thermal Comfort. Build. Environ. 2017, 115, 1–17. [Google Scholar] [CrossRef]
- Ng, E.; Chen, L.; Wang, Y.; Yuan, C. A Study on the Cooling Effects of Greening in a High-Density City: An Experience from Hong Kong. Build. Environ. 2012, 47, 256–271. [Google Scholar] [CrossRef]
- Bretz, S.; Akbari, H.; Rosenfeld, A. Practical Issues for Using Solar-Reflective Materials to Mitigate Urban Heat Islands. Atmos. Environ. 1998, 32, 95–101. [Google Scholar] [CrossRef] [Green Version]
- Santamouris, M. Using Cool Pavements as a Mitigation Strategy to Fight Urban Heat Island—A Review of the Actual Developments. Renew. Sustain. Energy Rev. 2013, 26, 224–240. [Google Scholar] [CrossRef]
- Santamouris, M.; Synnefa, A.; Karlessi, T. Using Advanced Cool Materials in the Urban Built Environment to Mitigate Heat Islands and Improve Thermal Comfort Conditions. Sol. Energy 2011, 85, 3085–3102. [Google Scholar] [CrossRef]
- Oke, T.R. The Energetic Basis of the Urban Heat Island. Q. J. R. Meteorol. Soc. 1982, 108, 1–24. [Google Scholar] [CrossRef]
- Middel, A.; Lukasczyk, J.; Zakrzewski, S.; Arnold, M.; Maciejewski, R. Urban Form and Composition of Street Canyons: A Human-Centric Big Data and Deep Learning Approach. Landsc. Urban Plan. 2019, 183, 122–132. [Google Scholar] [CrossRef]
- Nazarian, N.; Kleissl, J. CFD Simulation of an Idealized Urban Environment: Thermal Effects of Geometrical Characteristics and Surface Materials. Urban Clim. 2015, 12, 141–159. [Google Scholar] [CrossRef]
- Wang, Y.; Berardi, U.; Akbari, H. Comparing the Effects of Urban Heat Island Mitigation Strategies for Toronto, Canada. Energy Build. 2016, 114, 2–19. [Google Scholar] [CrossRef]
- Zhao, Q.; Sailor, D.J.; Wentz, E.A. Impact of Tree Locations and Arrangements on Outdoor Microclimates and Human Thermal Comfort in an Urban Residential Environment. Urban For. Urban Green. 2018, 32, 81–91. [Google Scholar] [CrossRef] [Green Version]
- Perini, K.; Magliocco, A. Effects of Vegetation, Urban Density, Building Height, and Atmospheric Conditions on Local Temperatures and Thermal Comfort. Urban For. Urban Green. 2014, 13, 495–506. [Google Scholar] [CrossRef]
- Ali-Toudert, F.; Mayer, H. Effects of Asymmetry, Galleries, Overhanging Façades and Vegetation on Thermal Comfort in Urban Street Canyons. Sol. Energy 2007, 81, 742–754. [Google Scholar] [CrossRef]
- Coutts, A.M.; Harris, R.J.; Phan, T.; Livesley, S.J.; Williams, N.S.G.; Tapper, N.J. Thermal Infrared Remote Sensing of Urban Heat: Hotspots, Vegetation, and an Assessment of Techniques for Use in Urban Planning. Remote Sens. Environ. 2016, 186, 637–651. [Google Scholar] [CrossRef]
- Niachou, K.; Livada, I.; Santamouris, M. Experimental Study of Temperature and Airflow Distribution inside an Urban Street Canyon during Hot Summer Weather Conditions. Part II: Airflow Analysis. Build. Environ. 2008, 43, 1393–1403. [Google Scholar] [CrossRef]
- Shashua-Bar, L.; Hoffman, M.E. Vegetation as a Climatic Component in the Design of an Urban Street: An Empirical Model for Predicting the Cooling Effect of Urban Green Areas with Trees. Energy Build. 2000, 31, 221–235. [Google Scholar] [CrossRef]
- Weng, Q.; Lu, D.; Schubring, J. Estimation of Land Surface Temperature-Vegetation Abundance Relationship for Urban Heat Island Studies. Remote Sens. Environ. 2004, 89, 467–483. [Google Scholar] [CrossRef]
- Bruse, M.; Fleer, H. Simulating Surface-Plant-Air Interactions inside Urban Environments with a Three Dimensional Numerical Model. Environ. Model. Softw. 1998, 13, 373–384. [Google Scholar] [CrossRef]
- ENVI-Met Intro:Modelconept [A Holistic Microclimate Model]. Available online: https://envi-met.info/doku.php?id=intro:modelconept (accessed on 1 February 2022).
- Heris, M.P. Do Planning and Design Policies and Procedures Matter in Microclimate Management and Urban Heat Mitigation? Doctoral Dissertation, University of Colorado at Denver, Denver, CO, USA, 2018; p. 231. [Google Scholar]
- Ayyad, Y.N.; Sharples, S. Envi-MET Validation and Sensitivity Analysis Using Field Measurements in a Hot Arid Climate. IOP Conf. Ser. Earth Environ. Sci. 2019, 329, 012040. [Google Scholar] [CrossRef] [Green Version]
- Bande, L.; Afshari, A.; Al Masri, D.; Jha, M.; Norford, L.; Tsoupos, A.; Marpu, P.; Pasha, Y.; Armstrong, P. Validation of UWG and ENVI-Met Models in an Abu Dhabi District, Based on Site Measurements. Sustainability 2019, 11, 4378. [Google Scholar] [CrossRef] [Green Version]
- Lai, D.; Liu, W.; Gan, T.; Liu, K.; Chen, Q. A Review of Mitigating Strategies to Improve the Thermal Environment and Thermal Comfort in Urban Outdoor Spaces. Sci. Total Environ. 2019, 661, 337–353. [Google Scholar] [CrossRef]
- NOAA Local Climatological Data Station Details: Chicago Ohare International Airport, IL USA, WBAN:94846, Climate Data Online (CDO), National Climatic Data Center (NCDC). Available online: https://www.ncdc.noaa.gov/cdo-web/datasets/LCD/stations/WBAN:94846/detail (accessed on 22 February 2022).
- ENVI-Met Manual ENVI-Met 3.1 Manual Contents. Available online: https://envi-met.info/documents/onlinehelpv3/cnt.htm (accessed on 22 February 2022).
- Beven, K. Prophecy, Reality and Uncertainty in Distributed Hydrological Modelling. Adv. Water Resour. 1993, 16, 41–51. [Google Scholar] [CrossRef]
- Tartarini, F. Pythermalcomfort: Package to Calculate Several Thermal Comfort Indices (e.g. PMV, PPD, SET, Adaptive) and Convert Physical Variables. Please Cite Us If You Use This Package: Tartarini, F., Schiavon, S. Pythermalcomfort: A Python Package for Thermal Comfort Research. SoftwareX 2020, 12, 100578. [Google Scholar] [CrossRef]
- Gagge, A.P. A New Physiological Variable Associated with Sensible and Insensible Perspiration. Am. J. Physiol.-Leg. Content 1937, 120, 277–287. [Google Scholar] [CrossRef]
- Fanger, P.O. Thermal comfort: Analysis and applications in environmental engineering; Danish Technical Press: Copenhagen, Denmark, 1970. [Google Scholar]
- Staiger, H.; Bucher, K.; Jendritzky, G. The Apparent Temperature—The Physiologically Correct Estimation of Heat and Cold Stress in the Open Air in Degrees Celsius. Ann. Meteorol. 1997, 33, 100–107. [Google Scholar]
- Pickup, J.; Dear, R. de An Outdoor Thermal Comfort Index (OUT_SET*)—Part I—The Model and Its Assumptions. In Biometeorology and Urban Climatology at the Turn of the Millennium; World Meteorological Organization: Geneva, Switzerland, 2000; pp. 279–283. [Google Scholar]
- Höppe, P. The Physiological Equivalent Temperature—A Universal Index for the Biometeorological Assessment of the Thermal Environment. Int. J. Biometeorol. 1999, 43, 71–75. [Google Scholar] [CrossRef]
- Jendritzky, G.; de Dear, R.; Havenith, G. UTCI—Why Another Thermal Index? Int. J. Biometeorol. 2012, 56, 421–428. [Google Scholar] [CrossRef] [Green Version]
- Lu, J.; Li, Q.; Zeng, L.; Chen, J.; Liu, G.; Li, Y.; Li, W.; Huang, K. A Micro-Climatic Study on Cooling Effect of an Urban Park in a Hot and Humid Climate. Sustain. Cities Soc. 2017, 32, 513–522. [Google Scholar] [CrossRef]
- Kuang, W. Seasonal Variation in Air Temperature and Relative Humidity on Building Areas and in Green Spaces in Beijing, China. Chin. Geogr. Sci. 2020, 30, 75–88. [Google Scholar] [CrossRef] [Green Version]
- Yang, P.; Ren, G.; Hou, W. Temporal-Spatial Patterns of Relative Humidity and the Urban Dryness Island Effect in Beijing City. J. Appl. Meteorol. Climatol. 2017, 56, 2221–2237. [Google Scholar] [CrossRef]
- Tsoka, S. Investigating the Relationship Between Urban Spaces Morphology and Local Microclimate: A Study for Thessaloniki. Procedia Environ. Sci. 2017, 38, 674–681. [Google Scholar] [CrossRef]
- Tsoka, S.; Tsikaloudaki, A.; Theodosiou, T. Analyzing the ENVI-Met Microclimate Model’s Performance and Assessing Cool Materials and Urban Vegetation Applications—A Review. Sustain. Cities Soc. 2018, 43, 55–76. [Google Scholar] [CrossRef]
- Yuan, J.; Emura, K.; Farnham, C. Is Urban Albedo or Urban Green Covering More Effective for Urban Microclimate Improvement? A Simulation for Osaka. Sustain. Cities Soc. 2017, 32, 78–86. [Google Scholar] [CrossRef]
- Li, J.; Zheng, B.; Ouyang, X.; Chen, X.; Bedra, K.B. Does Shrub Benefit the Thermal Comfort at Pedestrian Height in Singapore? Sustain. Cities Soc. 2021, 75, 103333. [Google Scholar] [CrossRef]
- Rui, L.; Buccolieri, R.; Gao, Z.; Gatto, E.; Ding, W. Study of the Effect of Green Quantity and Structure on Thermal Comfort and Air Quality in an Urban-like Residential District by ENVI-Met Modelling. Build. Simul. 2019, 12, 183–194. [Google Scholar] [CrossRef]
- Dimoudi, A.; Nikolopoulou, M. Vegetation in the Urban Environment: Microclimatic Analysis and Benefits. Energy Build. 2003, 35, 69–76. [Google Scholar] [CrossRef] [Green Version]
- Taha, H. Urban Climates and Heat Islands: Albedo, Evapotranspiration, and Anthropogenic Heat. Energy Build. 1997, 25, 99–103. [Google Scholar] [CrossRef] [Green Version]
- Berardi, U.; Jandaghian, Z.; Graham, J. Effects of Greenery Enhancements for the Resilience to Heat Waves: A Comparison of Analysis Performed through Mesoscale (WRF) and Microscale (Envi-Met) Modeling. Sci. Total Environ. 2020, 747, 141300. [Google Scholar] [CrossRef]
- Lobaccaro, G.; Acero, J.A. Comparative Analysis of Green Actions to Improve Outdoor Thermal Comfort inside Typical Urban Street Canyons. Urban Clim. 2015, 14, 251–267. [Google Scholar] [CrossRef]
- Sun, S.; Xu, X.; Lao, Z.; Liu, W.; Li, Z.; Higueras García, E.; He, L.; Zhu, J. Evaluating the Impact of Urban Green Space and Landscape Design Parameters on Thermal Comfort in Hot Summer by Numerical Simulation. Build. Environ. 2017, 123, 277–288. [Google Scholar] [CrossRef]
- Taleghani, M.; Kleerekoper, L.; Tenpierik, M.; van den Dobbelsteen, A. Outdoor Thermal Comfort within Five Different Urban Forms in the Netherlands. Build. Environ. 2015, 83, 65–78. [Google Scholar] [CrossRef]
- Targhi, M.Z.; Van Dessel, S. Potential Contribution of Urban Developments to Outdoor Thermal Comfort Conditions: The Influence of Urban Geometry and Form in Worcester, Massachusetts, USA. Procedia Eng. 2015, 118, 1153–1161. [Google Scholar] [CrossRef] [Green Version]
- Morakinyo, T.E.; Lam, Y.F. Simulation Study on the Impact of Tree-Configuration, Planting Pattern and Wind Condition on Street-Canyon’s Micro-Climate and Thermal Comfort. Build. Environ. 2016, 103, 262–275. [Google Scholar] [CrossRef]
- Skelhorn, C.; Lindley, S.; Levermore, G. The Impact of Vegetation Types on Air and Surface Temperatures in a Temperate City: A Fine Scale Assessment in Manchester, UK. Landsc. Urban Plan. 2014, 121, 129–140. [Google Scholar] [CrossRef]
- Zhang, L.; Zhan, Q.; Lan, Y. Effects of the Tree Distribution and Species on Outdoor Environment Conditions in a Hot Summer and Cold Winter Zone: A Case Study in Wuhan Residential Quarters. Build. Environ. 2018, 130, 27–39. [Google Scholar] [CrossRef]
- Sosa, M.B.; Correa, E.N.; Cantón, M.A. Neighborhood Designs for Low-Density Social Housing Energy Efficiency: Case Study of an Arid City in Argentina. Energy Build. 2018, 168, 137–146. [Google Scholar] [CrossRef]
- Farhadi, H.; Faizi, M.; Sanaieian, H. Mitigating the Urban Heat Island in a Residential Area in Tehran: Investigating the Role of Vegetation, Materials, and Orientation of Buildings. Sustain. Cities Soc. 2019, 46, 101448. [Google Scholar] [CrossRef]
- Sanagar Darbani, E.; Monsefi Parapari, D.; Boland, J.; Sharifi, E. Impacts of Urban Form and Urban Heat Island on the Outdoor Thermal Comfort: A Pilot Study on Mashhad. Int. J. Biometeorol. 2021, 65, 1101–1117. [Google Scholar] [CrossRef]
- Araque, K.; Palacios, P.; Mora, D.; Chen Austin, M. Biomimicry-Based Strategies for Urban Heat Island Mitigation: A Numerical Case Study under Tropical Climate. Biomimetics 2021, 6, 48. [Google Scholar] [CrossRef]
- Yilmaz, S.; Külekçi, E.A.; Mutlu, B.E.; Sezen, I. Analysis of Winter Thermal Comfort Conditions: Street Scenarios Using ENVI-Met Model. Environ. Sci. Pollut. Res. 2021, 28, 63837–63859. [Google Scholar] [CrossRef]
- Liu, L.; Lin, Y.; Wang, D.; Liu, J. Dynamic Spatial-Temporal Evaluations of Urban Heat Islands and Thermal Comfort of a Complex Urban District Using an Urban Canopy Model. J. Asian Archit. Build. Eng. 2016, 15, 627–634. [Google Scholar] [CrossRef] [Green Version]
- Bhati, S.; Mohan, M. WRF-Urban Canopy Model Evaluation for the Assessment of Heat Island and Thermal Comfort over an Urban Airshed in India under Varying Land Use/Land Cover Conditions. Geosci. Lett. 2018, 5, 27. [Google Scholar] [CrossRef] [Green Version]
- Oropeza-Perez, I. Simplified Numerical Model for Analyzing the Effects of the Urban Heat Island upon Low-Rise Buildings by Using a Free-License Thermal Simulation Program. Urban Sci. 2020, 4, 30. [Google Scholar] [CrossRef]
- Nasir, D.S.; Pantua, C.A.J.; Zhou, B.; Vital, B.; Calautit, J.; Hughes, B. Numerical Analysis of an Urban Road Pavement Solar Collector (U-RPSC) for Heat Island Mitigation: Impact on the Urban Environment. Renew. Energy 2021, 164, 618–641. [Google Scholar] [CrossRef]
- Morris, K.I.; Chan, A.; Morris, K.J.K.; Ooi, M.C.G.; Oozeer, M.Y.; Abakr, Y.A.; Nadzir, M.S.M.; Mohammed, I.Y.; Al-Qrimli, H.F. Impact of Urbanization Level on the Interactions of Urban Area, the Urban Climate, and Human Thermal Comfort. Appl. Geogr. 2017, 79, 50–72. [Google Scholar] [CrossRef]
- Gunawardena, K.; Steemers, K. Adaptive Comfort Assessments in Urban Neighbourhoods: Simulations of a Residential Case Study from London. Energy Build. 2019, 202, 109322. [Google Scholar] [CrossRef]
- Nice, K.A.; Coutts, A.M.; Tapper, N.J. Development of the VTUF-3D v1.0 Urban Micro-Climate Model to Support Assessment of Urban Vegetation Influences on Human Thermal Comfort. Urban Clim. 2018, 24, 1052–1076. [Google Scholar] [CrossRef] [Green Version]
- Arghavani, S.; Malakooti, H.; Ali Akbari Bidokhti, A.-A. Numerical Assessment of the Urban Green Space Scenarios on Urban Heat Island and Thermal Comfort Level in Tehran Metropolis. J. Clean. Prod. 2020, 261, 121183. [Google Scholar] [CrossRef]
- Wang, B.; Png, C.E. Solar Irradiance Simulation for Evaluating Thermal Comfort in Urban Environment. Archit. Sci. Rev. 2019, 62, 14–25. [Google Scholar] [CrossRef]
- Kaloustian, N.; Bitar, H.; Diab, Y. Urban Heat Island and Urban Planning in Beirut. Procedia Eng. 2016, 169, 72–79. [Google Scholar] [CrossRef]
Figure 1.
Overview of research methods.

Figure 2.
An example of an isolated street canyon and different inflow directions; perpendicular (A), Oblique (B) and Parallel (C).
Figure 2.
An example of an isolated street canyon and different inflow directions; perpendicular (A), Oblique (B) and Parallel (C).

Figure 3.
Sensitivity of UTCI to different physical and vegetation parameters (at 15:00). (a) shows the UTCI level change in different canyon depths among all scenarios, while (b–e) presents the results for the shallow canyon types. The horizontal lines reflect the minimum, first, second (median), third quartile, and maximum of data points. Circles represent the average of UTCI level change in each category.

Figure 4.
The effect magnitude of physical and vegetation parameters on changing air temperature during simulation hours (From 12:00 to 22:00).
Figure 4.
The effect magnitude of physical and vegetation parameters on changing air temperature during simulation hours (From 12:00 to 22:00).

Figure 5.
Comparison of cooling impact (average UTCI reduction) of parameters in different contexts (At 15:00). (a) the interaction between aspect ratio and green density (b) the interaction between green type and green density (c) the interaction between aspect ratio and canyon orientation.
Figure 5.
Comparison of cooling impact (average UTCI reduction) of parameters in different contexts (At 15:00). (a) the interaction between aspect ratio and green density (b) the interaction between green type and green density (c) the interaction between aspect ratio and canyon orientation.

Figure 6.
The UTCI level range of scenarios during simulation hours in shallow street canyons (indexed as A).
Figure 6.
The UTCI level range of scenarios during simulation hours in shallow street canyons (indexed as A).

Figure 7.
The UTCI level range of scenarios during simulation hours in deep street canyons (indexed as B).
Figure 7.
The UTCI level range of scenarios during simulation hours in deep street canyons (indexed as B).

Figure 8.
The UTCI level range of scenarios during simulation hours in very deep street canyons (indexed as C).
Figure 8.
The UTCI level range of scenarios during simulation hours in very deep street canyons (indexed as C).

Figure 9.
UTCI level change in scenarios with different green types and densities in shallow (A), deep (B), and very deep (C) canyons during simulation hours.
Figure 9.
UTCI level change in scenarios with different green types and densities in shallow (A), deep (B), and very deep (C) canyons during simulation hours.

Figure 10.
Near-surface temperature (°C) distribution of scenarios with different green types and densities in shallow (A), deep (B), and very deep (C) canyons at 15:00.
Figure 10.
Near-surface temperature (°C) distribution of scenarios with different green types and densities in shallow (A), deep (B), and very deep (C) canyons at 15:00.

Table 1.
Input values for each parameter in ENVI-met model.
| Input Parameters | Simulation’s Information | Parameters/Variables | Input Value |
| Start time | 10:00 a.m. | ||
| Duration of simulation | 12 h | ||
| Latitude and longitude | 41.8781° N, 87.6298° W | ||
| Domain size (x, y, z) | 50 × 50 × 40 | ||
| Grid size (x, y, z) | 2 m × 2 m × 2 m | ||
| Meteorological Condition | Minimum air temperature | 27 °C (at 5:00) | |
| Maximum air temperature | 41 °C (at 15:00) | ||
| Minimum relative humidity | 40% (at 15:00) | ||
| Maximum relative humidity | 82% (at 5:00) | ||
| Wind speed at 10 m | 2.5 m/s | ||
| Roughness length | 0.01 | ||
| Simulation Variables | Physical layout | Road material | Asphalt, Concrete |
| Aspect ratio | 1, 1.5, 3 | ||
| Building heights | 20 m, 30 m, 60 m | ||
| Street canyon width | 20 m | ||
| Street canyon length | 80 m | ||
| Street canyon orientation (toward the prevalent wind) | Perpendicular (270°), Parallel (180°), Oblique (225°) | ||
| Vegetation | Type | Deciduous, Evergreen | |
| Density | No vegetation, Sparse, Dense, Very dense | ||
| Position in the canyon | Linear in both sidewalks |
Table 2.
p-values estimate ranges for the SRC estimates of air temperature at each timestep.
| Simulation Hour | p-Values | ||||
|---|---|---|---|---|---|
| Asp_Ratio | Canyon_ Orientation | Surf_ Material | Green_ Type | Green_Density | |
| 12:00 | <0.0001 * | <0.0001 * | <0.0001 * | 0.0029 * | 0.3142 |
| 13:00 | <0.0001 * | <0.0001 * | <0.0001 * | 0.0592 | 0.4276 |
| 14:00 | <0.0001 * | <0.0001 * | <0.0001 * | 0.5693 | 0.2043 |
| 15:00 | <0.0001 * | <0.0001 * | 0.0057 * | 0.2932 | 0.2326 |
| 16:00 | <0.0001 * | <0.0001 * | 0.0091 * | 0.2123 | 0.2443 |
| 17:00 | <0.0001 * | <0.0001 * | 0.0095 * | 0.7036 | 0.2492 |
| 18:00 | <0.0001 * | <0.0001 * | 0.0054 * | 0.0008 * | 0.1709 |
| 19:00 | 0.4389 | 0.0005 * | 0.0204 * | <0.0001 * | 0.1085 |
| 20:00 | <0.0001 * | 0.0247 * | 0.0209 * | <0.0001 * | 0.1014 |
| 21:00 | <0.0001 * | 0.3722 | 0.0133 * | <0.0001 * | 0.1199 |
| 22:00 | <0.0001 * | 0.0002 * | 0.0098 * | <0.0001 * | 0.1846 |
* p-value < 0.05.
Table 3.
Scenario information (all scenarios have similar surface material (asphalt) and similar canyon orientation toward the prevalent wind (perpendicular)).
Table 3.
Scenario information (all scenarios have similar surface material (asphalt) and similar canyon orientation toward the prevalent wind (perpendicular)).
| Scenario Index | Green Type | Green Density |
|---|---|---|
| S0 | No vegetation | No vegetation |
| S1 | Deciduous | Sparse |
| S2 | Deciduous | Dense |
| S3 | Deciduous | Very dense |
| S4 | Evergreen | Sparse |
| S5 | Evergreen | Dense |
| S6 | Evergreen | Very dense |
Publisher’s Note: MDPI stays neutral with regard to jurisdictional claims in published maps and institutional affiliations. |
© 2022 by the authors. Licensee MDPI, Basel, Switzerland. This article is an open access article distributed under the terms and conditions of the Creative Commons Attribution (CC BY) license (https://creativecommons.org/licenses/by/4.0/).
Share and Cite
MDPI and ACS Style
Kianmehr, A.; Lim, T.C. Quantifying Interactive Cooling Effects of Morphological Parameters and Vegetation-Related Landscape Features during an Extreme Heat Event. Climate 2022, 10, 60. https://0-doi-org.brum.beds.ac.uk/10.3390/cli10040060
AMA Style
Kianmehr A, Lim TC. Quantifying Interactive Cooling Effects of Morphological Parameters and Vegetation-Related Landscape Features during an Extreme Heat Event. Climate. 2022; 10(4):60. https://0-doi-org.brum.beds.ac.uk/10.3390/cli10040060
Chicago/Turabian StyleKianmehr, Ayda, and Theodore C. Lim. 2022. "Quantifying Interactive Cooling Effects of Morphological Parameters and Vegetation-Related Landscape Features during an Extreme Heat Event" Climate 10, no. 4: 60. https://0-doi-org.brum.beds.ac.uk/10.3390/cli10040060
Note that from the first issue of 2016, this journal uses article numbers instead of page numbers. See further details here.