Article

Rainfall Distributions in Sri Lanka in Time and Space: An Analysis Based on Daily Rainfall Data

1
Department of Geography, Durham University, Science Laboratories, South Road, Durham DH1 3LE, UK
2
Department of Agricultural Engineering, University of Ruhuna, Matara 81000, Sri Lanka
*
Author to whom correspondence should be addressed.
Submission received: 14 April 2014 / Revised: 19 August 2014 / Accepted: 21 August 2014 / Published: 26 September 2014

Abstract

:
Daily rainfall totals are analyzed for the main agro-climatic zones of Sri Lanka for the period 1976–2006. The emphasis is on daily rainfall rather than on longer-period totals, in particular the number of daily falls exceeding given threshold totals. For one station (Mapalana), where a complete daily series is available from 1950, a longer-term perspective on changes over half a century is provided. The focus here is particularly on rainfall in March and April, given the sensitivity of agricultural decisions to early southwest monsoon rainfall at the beginning of the Yala cultivation season but other seasons are also considered, in particular the northeast monsoon. Rainfall across Sri Lanka over three decades is investigated in relation to the main atmospheric drivers known to affect climate in the region: sea surface temperatures in the Pacific and Indian Oceans, of which the former are shown to be more important. The strong influence of El Niño and La Niña phases on various aspects of the daily rainfall distribution in Sri Lanka is confirmed: positive correlations with Pacific sea-surface temperatures during the north east monsoon and negative correlations at other times. It is emphasized in the discussion that Sri Lanka must be placed in its regional context and it is important to draw on regional-scale research across the Indian subcontinent and the Bay of Bengal.

1. Introduction

As is the case for most countries in South and Southeast Asia, rice cultivation plays a vital role in Sri Lanka [1,2]. Production has increased steadily since independence in 1948, for a variety of reasons: socio-economic, political, cultural and technological [3]. Nevertheless, there remains a real risk of crop failure in dry years. The onset of the wet seasons is of crucial importance therefore and, when the rains are late in arriving, decisions must be taken by farmers about what strategies to adopt. These might include the use of varieties with shorter growing seasons (three months instead of 3.5–4 months) or changes in technology (e.g., mud plowing or dry sowing). Even modest crop failures have major consequences for economy and society.
The island of Sri Lanka is located at the southern tip of the Indian sub-continent, extending from 5°55′ to 9°51′N and from 79°42′ to 81°53′E. Given its tropical location, air temperature varies only slightly during the year, except in the mountains, so that the main climatic variations relate to rainfall. Given Sri Lanka’s location, it is subject to the Indian Ocean (IO) monsoon system, which results in a systematic migration of intense rainfall across the region during the course of a year [4]. Mean annual rainfall varies from less than 1000 mm on the southeast coast to over 4500 mm on the western slopes of the highlands (Figure 1). Seasonal variation in rainfall is determined by the southwest monsoon (SWM: March to August, the agricultural season of Yala) and the northeast monsoon (NEM: September to February, the agricultural season of Maha). In the inter-monsoon seasons, Sri Lanka is influenced by tropical cyclones, depressions and thunderstorms associated with migration of the inter-tropical convergence zone (ITCZ). In the Wet Zone (the south west quadrant of the island), there is a short dry season in January and February with ample rainfall in the rest of the year. In the Dry Zone (the north, east, and southeast of the island), there are marked wet (October to February) and dry seasons [5]. Severe crop failures in the Maha season due to lack of rainfall can affect the whole country whereas, in the Yala season, these are restricted to the Wet Zone [1].
The IO monsoon system is well known to be significantly influenced by the El Niño-Southern Oscillation (ENSO) and ENSO’s influence on Sri Lankan temperature, rainfall and streamflow is well established [6,7,8,9,10,11]. During an El Niño event, when the Eastern Pacific is anomalously warm, there is a weakening of the Walker circulation, with subsidence in the Western Pacific that extends to the central Indian Ocean region in the boreal summer [12]. This leads to a reduction of rainfall over Sri Lanka from January to March and July to August [9]. During the October–December period, the Walker cell in the Indian Ocean moves east, helping to strengthen the NE Monsoon, and increasing rainfall over Sri Lanka [2,6]. For Sri Lanka as a whole, authors in [9] identified the following “seasonal” rainfall anomalies associated with El Niño and La Niña events:
  • April to June: El Niño tends to be wet whilst La Niña tends to be dry;
  • July to August: El Niño tends to be wet whilst La Niña tends to be dry;
  • October to December: El Niño tends to be wet whilst La Niña tends to be dry; The caption to table VI(c) in [9] states the opposite but it is clear from the data in the table and from comments elsewhere in the paper that OND tends to be wet in the El Niño phases and dry in La Niña. This interpretation has been confirmed by the author [13].
  • January to March: both El Niño and La Niña tend to be dry whilst “neutral” years tend to be wet.
Figure 1. Mean annual rainfall distribution of Sri Lanka.
Climate 02 00242 g001
Precipitation in Sri Lanka is directly influenced by SSTs in the IO, as well as by conditions in the Pacific Ocean. Authors in [14] identified biennial oscillation in the Indian Ocean climate. Authors in [15] defined the Indian Ocean Dipole (IOD) in terms of SSTs: the positive phase of the IOD is associated with high SSTs in the western IO and low SSTs in the eastern IO off Sumatra. Authors in [16] showed that Maha rainfall was strongly modulated by the IOD over the period 1869 to 2000. Anomalously high SSTs in the western IO associated with the positive IOD phase induce large-scale convergence in the lower troposphere, which extends as far east as Sri Lanka. The convection arising from this convergence leads to enhanced rainfall over Sri Lanka during the boreal autumn. The result of the evaporation is relatively cool SSTs, which reduces convection the following year.
Most studies of long-term variations of rainfall in Sri Lanka have used monthly totals (e.g., [9]). Analysis is extended here to include analysis of daily rainfall data in order to see how seasonal rainfall totals are reflected in the frequency of daily totals. Use of daily data allows the number of times in a given period that totals exceed a given threshold to be determined. This can include numbers of “rain days” (taken here to be a daily total of at least 0.25 mm) and numbers of “wet days” above a given threshold (e.g., daily total of 25 mm or more). This approach provides information on the frequency as well as the magnitude of rainfall therefore. Thus, the objectives of the study were to:
(a)
analyze daily rainfall data over three decades (1976–2006 ) for locations (Figure 1) representative of the major agro-climatological zones of Sri Lanka;
(b)
compile seasonal totals for a number of indices, in particular those based on daily rainfall totals: total rainfall, total number of rain days and the total number of days exceeding given rainfall total thresholds;
(c)
provide a longer-term perspective on changes over half a century for Mapalana, where a complete daily series was available from 1950. The focus is particularly on rainfall in March and April, given the sensitivity of agricultural decisions to early SWM rainfall at the start of Yala, the minor cropping season in most parts of the country due to relative dryness;
(d)
The predictability of rainfall is investigated in relation to the main drivers known to affect climate in the region: ENSO and IOD.

2. Data and Methods

2.1. Rainfall Data

A complete record of daily rainfall from 1950 was compiled for the Mapalana station, which is maintained by the Faculty of Agriculture, University of Ruhuna. Gaps (48 months) were infilled using data from the nearby stations: Thihagoda (1979–1981; 11/1973, 1–2/1988, 10–12/1988, 1–3/1989. 1/1994, 1/1997) and Dandeniya (11/1997); appropriate regression equations were constructed in both cases and cumulative sums were used to ensure the blended series was homogenous. Rainfall measurements at Mapalana have been conducted accordingly to the protocols established by the Meteorological Department of Sri Lanka and data are subject to the same levels of quality assurance. Other daily rainfall data were obtained from the Meteorological Department of Sri Lanka itself. Months with missing data and the seasons in which they fell were excluded from the analysis. Missing data means that the number of pairwise correlations may differ slightly between seasons and stations; in most cases, n = 31 (1976–2006). Monthly and seasonal totals were compiled for: total rainfall, total number of “rain days” (≥0.25 mm); total number of wet days (≥5 mm; ≥10 mm; ≥25 mm); total number of very wet days (using the T10 index). The T10 index is the daily rainfall total above which the top 10% of total rainfall has occurred; it has been used successfully in the UK to characterize the occurrence of heavy falls of rain [17]. Analysis of heavy falls of rain, as indicated by daily totals, follows the analysis of [18]. However, in Sri Lanka, given a highly skewed distribution of daily rainfall totals, it transpires that the top 10% of the rainfall total comprises a very small number of extremely wet days in any season, so that correlations with climatic indices are relatively meaningless. Little further reference is made to T10 results therefore but the results are included for the sake of completeness.
Following [9], the definition of seasons used here is as follows: January to March (JFM); April to June (AMJ); July to September (JAS); October to December (OND). Note that these divisions differ from those in [19]. Figure 2 (discussed in more detail below) illustrates the seasonal cycle and provides some sense of regional variations across the island.
Daily rainfall data have also been used to provide measures of direct value to the farming community. From the daily rainfall data, weekly values were calculated for the entire period of study and the 75% probability of receiving at least 10 mm rainfall in a week was estimated for all the stations. In addition, an analysis of dry and wet spells was carried out using weekly rainfall data, based on a Markov chain model. Less than 10 mm rainfall in a week was defined as a dry week and more than 10 mm as a wet week. Forward rainfall accumulation from 1 March and 1 September was also calculated. An accumulation of 250 mm rainfall can be used to estimate the beginning of the cropping season i.e., when rice plants can be planted. The date at which there is a 75% chance of accumulating 250 mm rainfall was taken to be the start of the cropping season [20]. These probability calculations were carried out using the program “First” [21].
Figure 2. Average monthly rainfall totals (mm) for a selection of stations included in the study.
Climate 02 00242 g002

2.2. Sea-Surface Temperatures (SSTs) and ENSO Indices

An extended series of SST anomaly data for equatorial regions of the Pacific Ocean based on [22] were used. The regions originally included here were NINO3 (120°W–150°W, 5°S–5°N), NINO4 (150°W–180°W, 5°S–5°N) and the composite region NINO34 (120°W–170°W, 5°S–5°N). SSTs in the NINO3 region tend to emphasize positive SST anomalies associated with El Niño events, whilst in the NINO4 region, negative anomalies associated with La Niña are accentuated. However, given that the NINO indices are highly inter-correlated and the correlation analysis (below) produced very similar results for all three NINO indices, just those for NINO34 are reported here. NINO index values were obtained from [23]: http://iridl.ldeo.columbia.edu/SOURCES/.Indices/.
The Southern Oscillation Index (SOI) can also be used to characterize the strength of an El Niño event. The SOI is defined as the normalized pressure difference between Tahiti and Darwin. Standardized SOI data used here were calculated using the method of [24]. Negative values represent El Niño events, whereas large positive values represent La Niña conditions. Thus, the SOI is inversely correlated with the NINO SST data described above. Using monthly data since 1951 (n = 724), the correlations are highly significant in all cases, but strongest with NINO34 (r = 0.726) and NINO4 (r = 0.693). SOI index values were also obtained from [23].
Intensity of the IOD is represented by the SST gradient between the western equatorial Indian Ocean (50°E–70°E and 10°S–10°N) and the southeastern equatorial Indian Ocean (90°E–110°E and 10°S–0°S). When the IOD index is positive, then the phenomenon is referred to as a positive IOD and vice versa ([15]). IOD index values were obtained from [25]: http://www.jamstec.go.jp/frsgc/research/d1/iod/.

2.3. Statistical Analysis

Pearson correlation coefficients were used to identify significant relationships between seasonal rainfall data and climatic indices (SSTs, SOI, IOD). Correlations were deemed significant when the 95% confidence limit was exceeded. For a sample size of 31 pairs of observations (study period: 1976–2006 inclusive), r must equal or exceed ±0.355 [26]. Results are comparable between different locations, seasons and climatic indices because the same sample size is used in most cases.

3. Results

3.1. Seasonal Variation in Rainfall

Table 1 shows mean monthly rainfall (1976–2006) for the stations included in this study; a selection of results is plotted in Figure 2. Figure 3 shows the probability of receiving at least 10 mm rainfall in each week of the year for a selection of the stations. Taken together, these summarize the amount and reliability of rainfall throughout the year in the different regions of Sri Lanka and provide a context for later analyses. For Mapalana and Sita Eliya, both in the wet zone, the only dry period comes in the early part of the year (Table 1), the first inter-monsoon (FIM) season. Following the SWM, the second inter-monsoon (SIM) season remains quite wet, before the onset of the NEM in mid-September; this is the period of enhanced cyclogenesis in the Bay of Bengal [27] as well as the time when the ITCZ moves south of Sri Lanka. In the wet zone, the wettest months in the NEM are October and November and the likelihood of 10 mm rainfall in a week reaches 90%. At Anuradhapura, on the northern plains, both inter-monsoon periods are quite dry. The SWM only really affects this area in April; the NEM is much more significant, with October, November and December all having more rainfall than April. At Ampara, on the east coast, the SWM is only a little wetter than the inter-monsoon periods, although the dependability of rainfall increases. The main difference from other stations is that the effects of the NEM last longer here, with January and February both having relatively high rainfall totals. Other than at Ratnapura, in the mountains, where it is very wet indeed, Ampara is the wettest station in November and indeed the wettest of all stations in December (Table 1a and Figure 2); it is particularly affected by weather systems in the Bay of Bengal associated with the NEM [16]. Ambalantota is the driest of the stations shown on Figure 3 (Table 1b); rainfall is rather more reliable here during the two monsoon seasons, but at best there is only a 70% chance of 10 mm in a week during the NEM (Figure 3).
Figure 3. The probability of receiving at least 10 mm rainfall in each week of the year for a selection of stations included in the study.
Climate 02 00242 g003
Table 1. (a) Mean monthly and (b) mean seasonal and mean annual rainfall (1976–2006) for the stations included in this study. Totals are in millimeters.
(a)
(a)
JanFebMarchAprilMayJuneJulyAugSeptOctNovDec
Mapalana879897164243189131155217272302158
Ratnapura131138202350499472331274397478434217
Sita Eliya1517072144167176157141164265280201
Badulla1837888174115316475127240276249
Matale135616918716313112198128288286189
Anuradhapura7649631487818312668238262168
Ampara25313466725928444196185309385
Hambegamuwa69671372159314312857217266114
Ambalantota47374772705835507713715899
Kirama119101140186173164119123160275281217
A Pelessa58555810410468424988152228104
(b)
(b)
JFMAMJJASONDAnnual
Mapalana2825965037322113
Ratnapura4711335100311283931
Sita Eliya2934874627461993
Badulla3503202657651701
Matale2654863477881867
Anuradhapura1882441256791230
Ampara4531621808801699
Hambegamuwa2733201155951343
Ambalantota131200161394886
Kirama3615234027732058
A Pelessa1712761784891113
Table 2 shows mean numbers of days each month at Mapalana with rainfall equaling or exceeding the threshold totals included in the study. The median daily rainfall, excluding days with totals below 0.25 mm, is 7.6 mm, whilst the mean rainfall per rain day is 13.6 mm. The mean number of T10 days per decade and the mean rainfall intensity per rain day are also shown. Numbers of rain days (≥0.25 mm) remain high from May to November. April and December are transitional months, with rainfall in April being particularly significant at the end of the dry season and the start of the Yala cultivation, as will be discussed further below. As already noted, numbers of T10 days are too low for any meaningful analysis to be undertaken. Heavy falls of rain are better indicated by number of days with 25 mm or more; there is at least one such day on average in every month of the year, with three or four in the wettest months. In relation to crop needs, the numbers of days with more than 5 or 10 mm may be the more relevant thresholds. There are on average 3 days with at least 10 mm in March and five in April; below-average rainfall in these months will delay the onset of rice cultivation and, if it is very dry, may force farmers to limit the crop area for rice or choose other crops instead.
Table 2. Mean number of days per month at Mapalana, 1976–2006, with rainfall equaling or exceeding the given threshold total. Note the number of T10 days is expressed per decade; other values are per annum. Additionally shown is the mean rainfall total per rain day (mm/day), a “rain day” having a total of at least 0.25 mm (row 3 in table).
JanFebMarchAprilMayJuneJulyAugSeptOctNovDec
Total (mm)879897164243189131155217272302158
Days > 0.25mm767111616141416171711
Days > 5mm444698771011117
Days > 10mm333565446885
Days > 25mm111232122342
T10 days *10 110232022331
Mean rf/rain day12.417.113.415.315.011.69.610.813.215.717.913.8

3.2. Changes at Mapalana Since 1950

Since 1950, there has been a tendency for annual rainfall totals to decrease at Mapalana (Figure 4), but a linear trend is not significant (r = −0.237, n = 57). In detail, it appears that the 1980s was a drier decade (mean: 1983 mm) compared to other periods (overall mean: 2252 mm). The data for JFM mirror the trend shown in Figure 4: rainfall totals in JFM fell from over 500 mm in 1950 to under 300 mm in the early 1980s, since when there has been an increase to reach nearly 400 mm by 2006. Much the same pattern is seen for rainfall totals in March and April (M+A). JAS shows the reverse trend with seasonal totals peaking in the 1980s. AMJ shows a simple downward trend, from over 700 mm in 1950 to under 600 mm by 2006, but again the trend is not significant (r = −0.220). There is no apparent trend for OND. Figure 4 also shows the dominant feature of biennial oscillation in the Asian monsoon, a two-year cycle in which a wetter year is followed by a drier one [4,14,28]. This reversal is more apparent earlier in the record before 1980 and this may explain why there are fewer correlations here with the IOD index than expected.
Figure 4. Annual rainfall totals at Mapalana (1950–2006).
Climate 02 00242 g004
As expected, these patterns are reflected in the number of days with rainfall above a given threshold. Figure 5 shows period total and number of days with rainfall equaling or exceeding 5 mm for M+A. Although there has not been any increase in the number of days equaling or exceeding 5 mm since the 1980s, the correlation between the two data sets is nevertheless very high (r = 0.882, p << 0.001). Similar patterns are evident for the number of days, equaling or exceeding 10 and 25 mm and for the number of rain days. Figure 5 shows that in some years total M+A rainfall can be dangerously low: 1983 and 1992 were strong El Niño years, but 1989 was a time of weak La Niña conditions. Also shown in Figure 5 is the number of days needed each year to accumulate 250 mm from 1 March. This is a crucial period for agriculture when soils wet up after the dry season and lack of rain in this period constrains area of cultivation, choice of variety (possibly necessitating a move to quicker-maturing varieties) and cropping technology in the Yala cultivation season. As can be seen, the plot suggests an increase of almost 20 days between 1950 and 1990, since when there has been no discernable change. The correlation between M+A total rainfall and the number of days to accumulate 250 mm is high (r = −0.843, n = 57, p < 0.001), so the M+A total can be used as a surrogate. It is highly desirable, of course, to understand the conditions under which very little rain falls in March and April. The two years with fewest rain days in March and April, 1983 (2) and 1992 (4), are both El Niño periods. However, of the years with the next fewest rain days, 1998 (9) is also in an El Niño period but 1989 (9) is in a La Niña phase. This accords with the findings of [29] who noted for India that, whilst failure of the monsoon is always associated with an El Niño event, not every El Niño results in a severe drought. Note that there is only a very weak positive correlation (r = 0.21, n = 51, p > 0.1) between the number of days to accumulate 250 mm rainfall at Mapalana and the onset of the Indian monsoon as defined by [30].
Figure 5. (a) Rainfall totals for March and April at Mapalana since 1950; (b) Number of days equaling or exceeding 5 mm; (c) Days needed to accumulate 250 mm from 1 March.
Climate 02 00242 g005
Authors in [9] note that, for Sri Lanka as a whole, El Niño led to drier conditions in January to March for the period 1976–2006. This is evident in Figure 6, which shows the number of rain days at Mapalana in relation to the NINO34 index. Authors in [9] add that rainfall declines in La Niña phases as well, but this is not consistently seen at Mapalana. Taking the four years when the NINO34 index is below −1: for 1976 and 1989, there is indeed low rainfall with very few rain days. However, for 1999 and 2000, the number of rain days is very high, suggesting that there may be a different pattern of atmospheric circulation in this region during prolonged La Niña phases. Drier than usual conditions in the early part of the year during El Niño events is due to subsidence setting in over the Sri Lankan region. This may happen in some La Niña phases too, but not all, so at Mapalana at least, the drying tendency noted by [9] for both extreme phases (see Section 1) does not apply. Thus, the strength of the correlation shown on Figure 6 increases markedly if the two years with single-season La Niñas (1976, 1989) are removed, from R2 = 0.1796 (p = 0.017, n = 31) to R2 = 0.357 (p = 0.0006, n = 29).
Figure 6. Number of days with ≥5 mm rainfall total at Mapalana, January–March, 1976–2006, in relation to the NINO34 index.
Climate 02 00242 g006
Table 3. Summary of significant correlations between rainfall stations and ocean-atmosphere drivers: (a) total number of significant correlations by season, plus M+A; (b) correlations with different climatic indices; (c) correlations with different rainfall indices, seasonal total plus number of days above a given threshold.
(a)
(a)
ONDJFMAMJJAStotalM+Atotal
Mapalana36009413
Ratnapura810615722
Sita Eliya15100833437
Badulla1233119322
Matale2501017017
Anuradhapura7621126228
Ampara882018624
Hambegamuwa0000000
Ambalantota0110213
Kirama0000011
A Pelessa780520626
total by season624884115934193
(b)
(b)
NINO34SOIIODTotal
Mapalana94013
Ratnapura810422
Sita Eliya1416737
Badulla99422
Matale69217
Anuradhapura1110728
Ampara1311024
Hambegamuwa0000
Ambalantota0033
Kirama0011
A Pelessa129526
Total by ENSO index827833193
(c)
(c)
Total>=0.25>+5>=10>=25T10total
Mapalana23341013
Ratnapura58422122
Sita Eliya810865037
Badulla45652022
Matale36412117
Anuradhapura47754128
Ampara44555124
Hambegamuwa0000000
Ambalantota0100113
Kirama0000101
A Pelessa55345426
total by rainfall index35494032289193

3.3. ENSO-Rainfall Relationships, 1976–2006

Table 3 summarizes the significant correlations between rainfall data (6 indices), ocean-atmosphere indices (3: NINO34, SOI, IOD), and the 11 stations included here. For each station, there are 18 correlations per season (6 rainfall indices × 3 climate indices) so that, including M+A results, the total number of correlations was 990, of which 193 (19.5%) were significant at the 5% confidence level. Note that the percentage of significant correlations increases to 27% if the three southeast stations are omitted. It is clear that the number of correlations varies greatly by season, by climatic index and by rainfall index, so the relatively low number of significant correlations comes as no surprise. Rather, it is the clusters of strong correlation that are important in terms of helping to understand seasonal patterns of daily rainfall across Sri Lanka and their varying dependence on ocean-atmosphere conditions in both the Pacific and Indian Oceans.
Table 3a summarizes by season. OND (62) and JFM (48), the seasons of the NE monsoon, have the highest numbers of significant correlations; JAS (41) also has many significant correlations but AMJ (8) very few. The relatively large number in M+A (34) suggests that SSTs are most important during the early part of the SWM. Very few significant correlations were found for the three stations in the southeast: Hambegamuwa, Ambalantota, and Kirama. Angunukolapelessa (A Pelessa), despite having low rainfall totals, is close enough to the wet zone to have much higher numbers of significant correlations. On the other hand, Kirama, much wetter than A Pelessa, has far fewer significant correlations. The highest number of significant correlations is at Sita Eliya in the mountains; as with most other stations, the highest seasonal totals at Sita Eliya are in OND (15), JFM (10) and JAS (8). Anuradhapura in the north central plains has the second highest total, with most in OND (7), JFM (6) and JAS (11). Surprisingly, Ratnapura, despite being easily the wettest station included, does not have the largest number of significant correlations. It seems that local conditions—orographic rainfall in the highlands and the influence of cyclonic depressions and convectional storms on the southeast coastal plain—serve to confound simple correlations between large-scale climatic drivers and site rainfall.
Table 3b summarizes correlations by climatic driver. IOD produces far fewer significant correlations than the SST indices NINO34 and SOI, which have very similar numbers of significant correlations. The three stations with the most significant correlations with IOD are widely separated: Anuradhapura, Sita Eliya and A Pelessa. Given the observations of [15] that Maha rainfall is strongly modulated by the IOD, it is to be expected that most of the significant IOD correlations are in OND (17) with eight in JAS but only one in both JFM and MAM. Not surprisingly, given its eastern location in the Pacific, NINO3 produced fewer significant relationships (70) than NINO34 (82) or NINO4 (80), but even so, the strong links between SST conditions in the eastern Pacific and rainfall in Sri Lanka are still remarkable. NINO3 is most influential at Mapalana; NINO34 and NINO4 are more important at Anuradhapura in the north central plains and at Ampara on the east coast, suggesting a stronger link via the NEM; this is underlined by the fact that Ampara has only two significant correlations in AMJ and none at all for JAS. In contrast to IOD, significant correlations with NINO34 are more evenly spread through the year: OND (27), JFM (29) and JAS (11); there is only one for MAM but ten for M+A. Thus, NINO34 seems to influence both monsoon seasons whereas IOD is more influential only in the NEM. Slightly different to NINO34, SOI is a stronger influence on JAS (22) compared to OND (19) and JFM (15).
Table 3c summarizes significant correlations by rainfall index. The largest number of significant correlations is for number of rain days (≥0.25 mm) followed by the number of days with 5 mm rainfall or more. Total rainfall only ranks third, suggesting that regularity of rainfall is even better connected to large-scale atmospheric circulation, whereas total rainfall can be more influenced by local conditions and events. Even so, there are 35 significant correlations with total rainfall (out of 193). The T10 index is much less frequently correlated than the other rainfall indices and only at A Pelessa is there a large number of significant correlations involving T10, seeming to confirm that this index is not generally useful in tropical climates where a few very large daily falls happen each year.
To elaborate comments made above where NINO34 and IOD correlations were compared, Table 4 provides by season (including M+A) individual correlations between SSTs in the NINO34 Pacific region and rainfall indices for all 11 stations included here. Significant correlations are shown in bold. For OND, number of rain days (≥0.25 mm) has the most significant correlations with NINO34; there are fewer significant correlations with the other rainfall indices, only one with the T10 index. Notably strong correlations occur for a number of rainfall indices at Ratnapura, Sita Eliya, and Badulla in the highlands, and for number of rain days in particular. All these correlations indicate a positive link between the NINO34 index and OND rainfall. This confirms that the El Niño phase is wetter in the NEM in Sri Lanka [16,31]. The influence of ENSO during the NEM appears amplified by the IOD: For example at Sita Eliya, both NINO34 (r = 0.66) and IOD (r = 0.57) are highly correlated with OND total rainfall. Since the two indices are themselves strongly correlated (r = 0.71) in this season, it is not possible to disaggregate their separate influence (cf. Zubair et al. [16]).
A similar pattern of significant correlations is seen for JFM except that the sign has now reversed, showing the drying tendency for this season in the El Niño phase (Figure 6); unlike the findings of Zubair et al. [9], La Niñas tend to be wetter in our results. There is only one significant (positive) correlation for AMJ: the number of rain days at Anuradhapura. The greater number of significant correlations for M+A suggests that the months of March and April are more closely linked to JFM whereas May is better linked to JAS. Like JFM, all the significant M+A correlations are negative, emphasizing the tendency for low rainfall in the El Niño phase (high rainfall in La Niña). There are relatively few significant correlations during JAS, mainly for stations to the north of the mountains and all are negative, except at A Pelessa.
As expected from the above results, there was a varying pattern of inter-correlations between stations from the different agro-climatological regions. Given the very large number of possible correlations, we just looked at total, number of rain days and number of days with ≥5 mm for OND and JFM, the seasons with the highest number of positive correlations (Table 3c). This yielded a possible total of 66 inter-station correlations. Six stations had a high degree of correlation: Mapalana (34), Ratnapura (34), Sita Eliya (37), Badulla (35), Anuradhapura (36) and A Pelessa (36). Ampara (26) and Matale (18) were moderately connected to other stations, but Hambegamuwa (6), Ambalantota (2) and Kirama (1) were poorly connected. It is not clear why the last group has low numbers of inter-station correlations, given the large number for A Pelessa; it may relate to local conditions in the southeast, particularly in the drier seasons, or perhaps there are problems with data quality that we have not detected. Ampara, given its eastern location is relatively poorly connected, as might be expected. The result for Matale is less easily explained given the higher numbers for Anuradhapura.
Table 4. Correlations between the SST index for the NINO34 Pacific region and rainfall indices at the 11 stations by season, including M+A. Correlations in bold are significant at the 5% confidence level. Note that, because of some missing rainfall data, the critical value of r may differ between pairs of variables. In most cases n = 31 for which the critical value at p = 0.05 is ±0.349. (a) OND; (b) JFM; (c) AMJ; (d) JAS; (e) M+A.
(a)
(a)
ONDtotOND0.25OND5OND10OND25OND T10
Mapalana0.3730.5060.4610.3280.2740.241
Ratnapura0.4840.6240.5340.4120.3570.112
Sita Eliya0.6510.6590.7050.6660.6200.064
Badulla0.4360.6840.6270.4490.2550.204
Matale0.1770.3610.2880.2180.062-0.077
Anuradhapura0.3070.5370.4540.4540.424-0.071
Ampara0.3450.3680.5410.5200.392-0.012
Hambegamuwa-0.033-0.032-0.057-0.001-0.051-0.003
Ambalantota0.0280.016-0.197-0.213-0.0740.214
Kirama0.0760.0510.1240.1740.068-0.151
A Pelessa0.4230.4060.3180.3330.4130.396
(b)
(b)
JFMtotJFM0.25JFM5JFM10JFM25JFM T10
Mapalana-0.369-0.349-0.424-0.446-0.367-0.022
Ratnapura-0.311-0.402-0.291-0.245-0.3050.020
Sita Eliya-0.500-0.412-0.453-0.503-0.510-0.330
Badulla-0.352-0.347-0.386-0.436-0.378-0.174
Matale-0.421-0.644-0.554-0.365-0.249-0.320
Anuradhapura-0.358-0.406-0.424-0.457-0.332-0.151
Ampara-0.428-0.375-0.433-0.402-0.448-0.382
Hambegamuwa-0.0440.009-0.017-0.017-0.1050.048
Ambalantota-0.019-0.021-0.022-0.020-0.0180.064
Kirama-0.070-0.086-0.113-0.1210.060-0.014
A Pelessa-0.485-0.543-0.523-0.453-0.337-0.175
(c)
(c)
AMJtotAMJ0.25AMJ5AMJ 10AMJ 25AMJ T10
Mapalana-0.187-0.111-0.137-0.138-0.084-0.067
Ratnapura-0.107-0.238-0.103-0.1780.090-0.096
Sita Eliya-0.111-0.054-0.019-0.214-0.1080.034
Badulla0.2860.0460.1770.2650.3470.270
Matele0.107-0.0190.1540.156-0.0400.200
Anuradhapura0.2450.4010.2330.277-0.057-0.031
Ampara0.0770.1050.078-0.0160.1770.000
Hambegamuwa0.099-0.0730.0070.0700.0510.056
Ambalantota-0.004-0.120-0.169-0.090-0.0010.107
Kirama0.3470.1490.1540.2280.3200.342
A Pelessa0.2140.0580.2070.1910.2470.013
(d)
(d)
JAStotJAS0.25JAS5JAS 10JAS 25JAS T10
Mapalana-0.087-0.160-0.239-0.239-0.1230.203
Ratnapura-0.262-0.319-0.262-0.316-0.4160.121
Sita Eliya-0.394-0.411-0.393-0.250-0.204-0.066
Badulla-0.179-0.337-0.168-0.069-0.0580.111
Matele-0.456-0.431-0.253-0.267-0.393-0.365
Anuradhapura-0.494-0.314-0.386-0.354-0.308-0.157
Ampara-0.188-0.170-0.125-0.104-0.0830.000
Hambegamuwa-0.161-0.087-0.094-0.113-0.143-0.130
Ambalantota-0.074-0.071-0.180-0.1990.082-0.159
Kirama-0.230-0.235-0.257-0.307-0.1790.109
A Pelessa0.3230.029-0.0280.1850.4830.483
(e)
(e)
N34M+A totalM+A 0.25M+A 5M+A 10M+A 25M+A T10
Mapalana-0.303-0.357-0.308-0.297-0.3890.018
Ratnapura-0.425-0.501-0.366-0.320-0.305-0.303
Sita Eliya-0.303-0.366-0.318-0.318-0.2260.024
Badulla-0.249-0.427-0.388-0.305-0.056-0.101
Matale-0.095-0.337-0.119-0.076-0.0390.071
Anuradhapura-0.0100.0530.1310.070-0.076-0.224
Ampara-0.441-0.279-0.338-0.409-0.379-0.019
Hambegamuwa0.017-0.0120.0290.1050.015-0.136
Ambalantota-0.1120.072-0.137-0.211-0.1410.136
Kirama-0.065-0.077-0.173-0.0700.068-0.044
A Pelessa-0.323-0.540-0.333-0.423-0.189-0.104

4. Discussion

4.1. Correlations with Climatic Drivers

Links between ENSO and Sri Lankan rainfall are now well established, including the detail of inter-seasonal variation (e.g., [9]). Analyses presented here add to that knowledge through information on daily rainfall totals, allowing the frequency as well as the amount of rainfall to be considered. This is significant because both amount and reliability of rainfall influence farmers’ decisions on cropping strategies (crop type, variety, cultivation method) and cropping intensities (what area of land to cultivate). This is particularly the case at the start of the Yala season [11].
Results in Table 3c show that number of rain days and the number of days with at least 5 mm rainfall are better correlated with ENSO indices than total seasonal rainfall. It is of course trite to observe that total seasonal rainfall is an accumulation of individual daily totals; the important point is that small totals, those significant to farmers, are well correlated with climatic drivers. There are very poor correlations with very large daily totals and in any case such events are problematic anyway, causing flooding and in extreme cases requiring replanting of crops after the flood-waters have subsided. Rainfall in March and April is crucial in the Wet Zone at the start of the rain-fed Yala cultivation season. Results in Table 3a and Table 4e show how various rainfall indices are correlated with climatic indices, whilst results in 
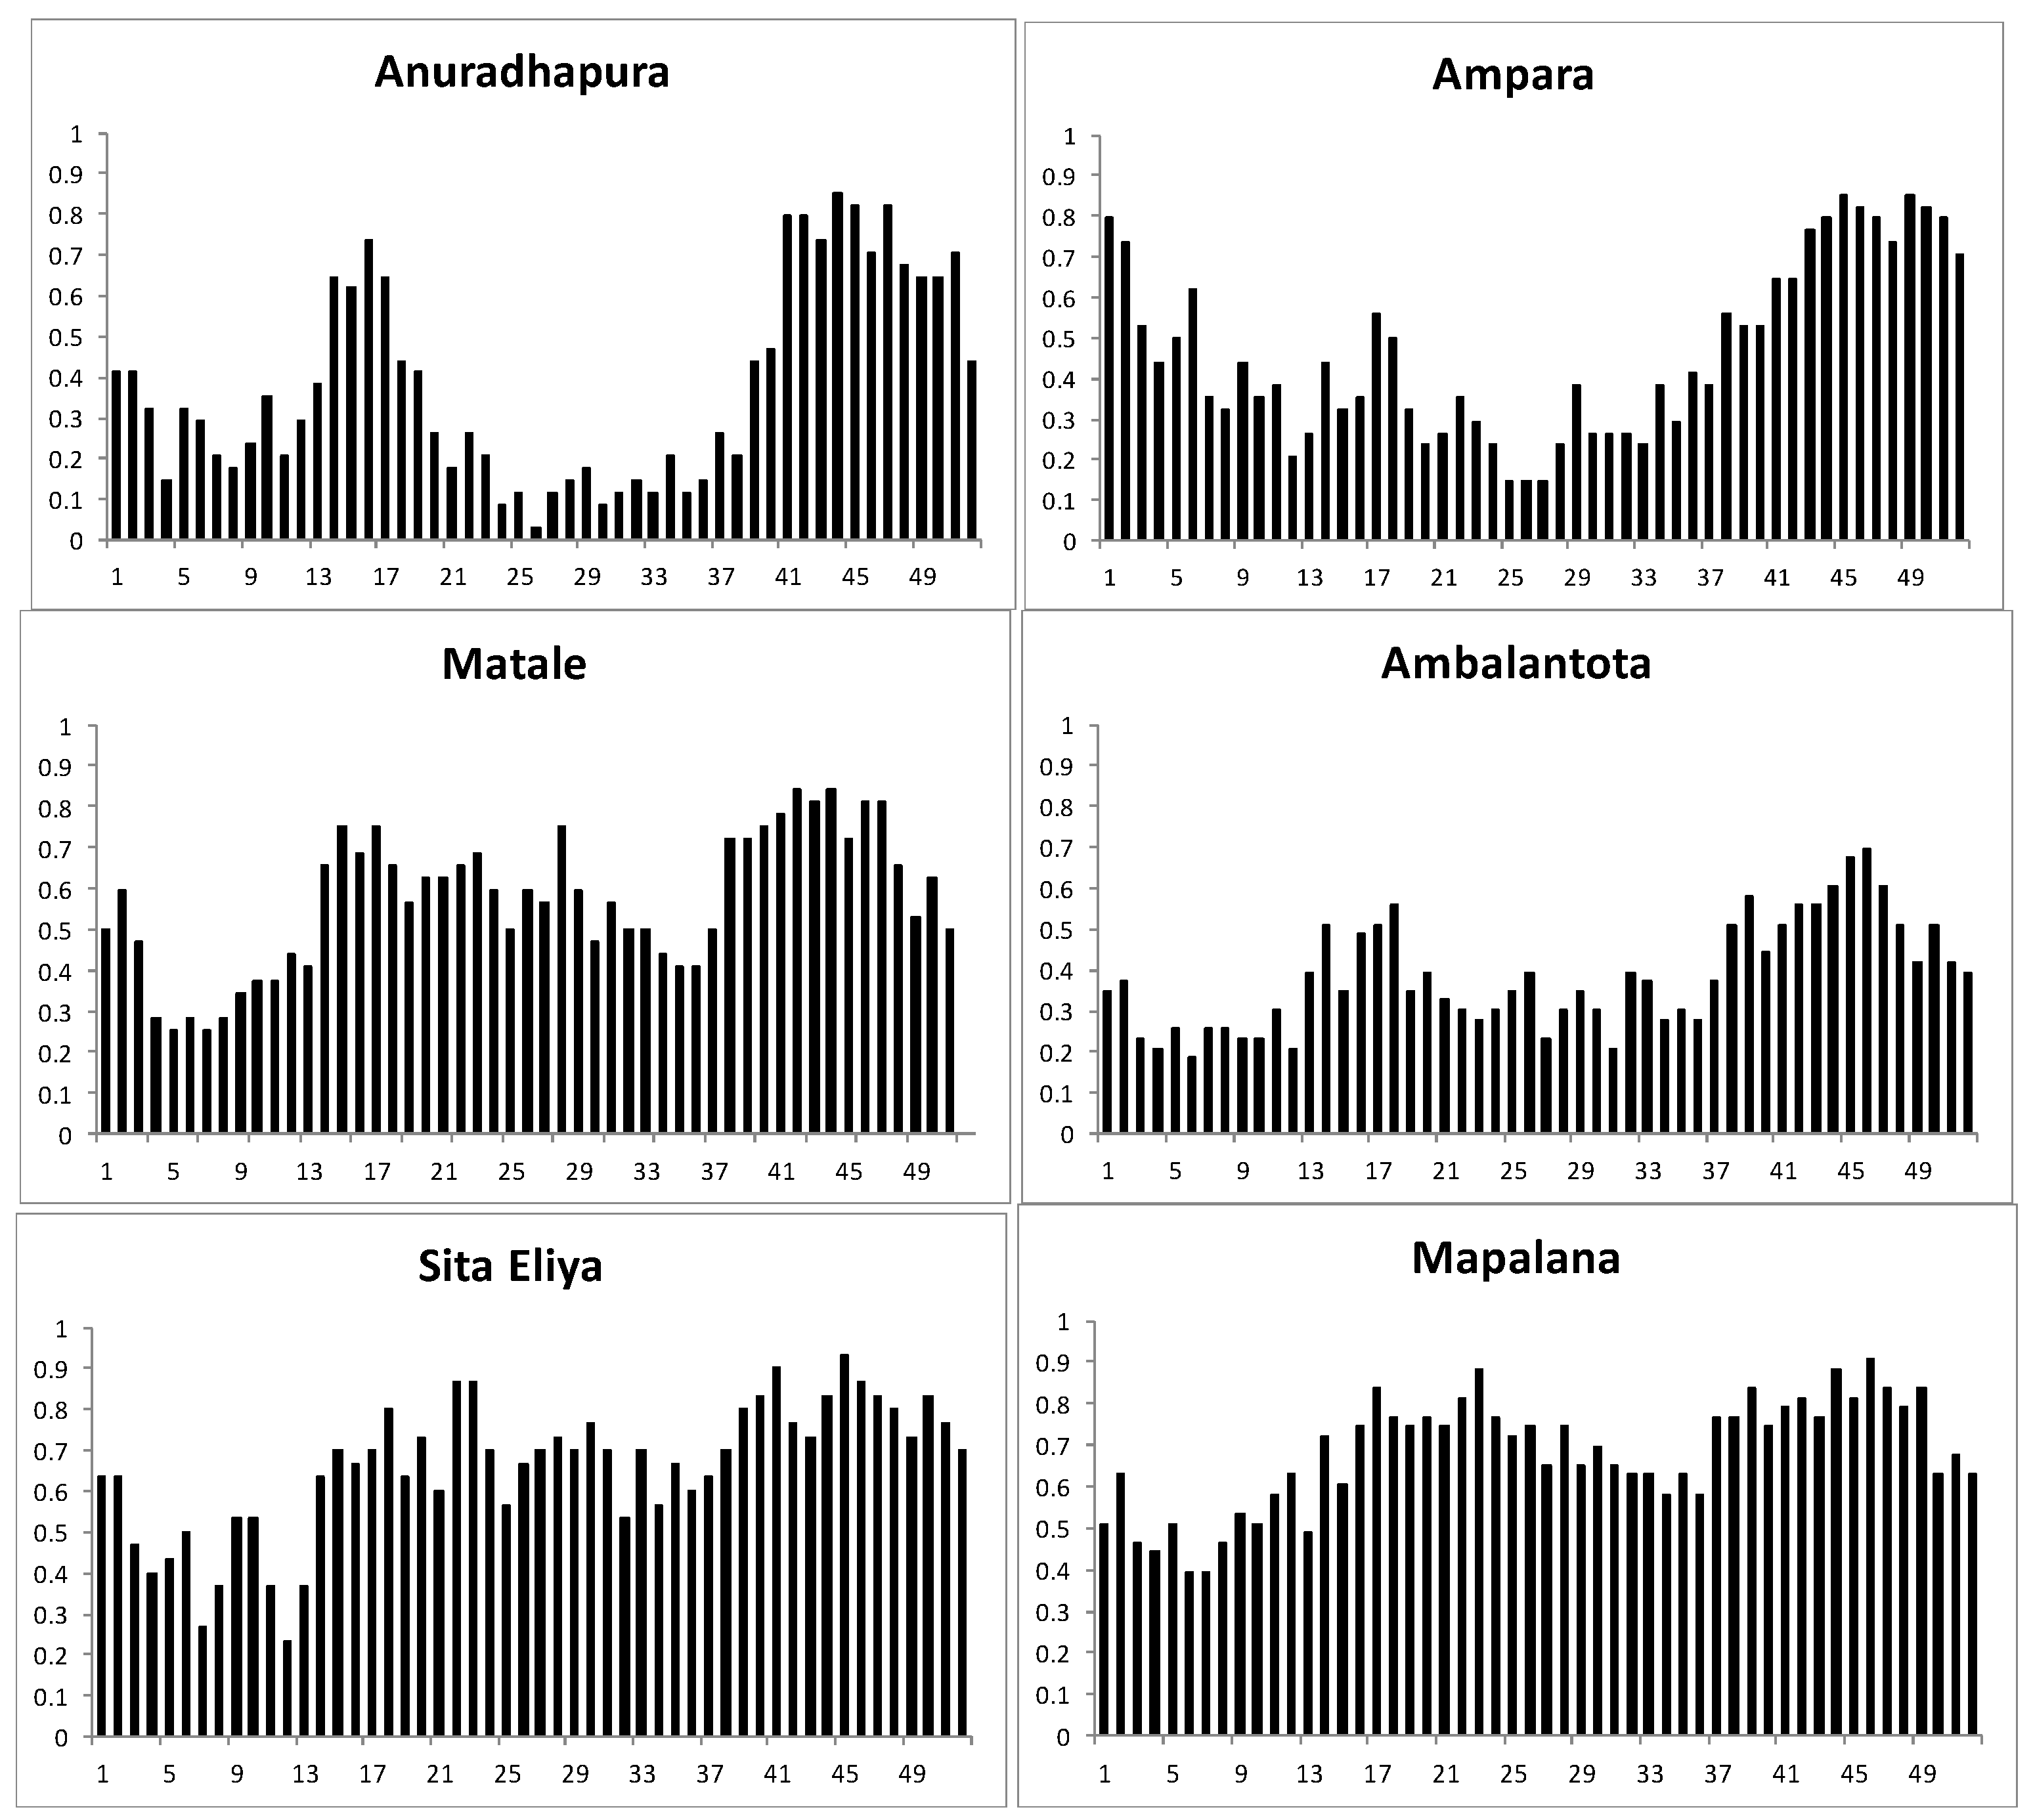
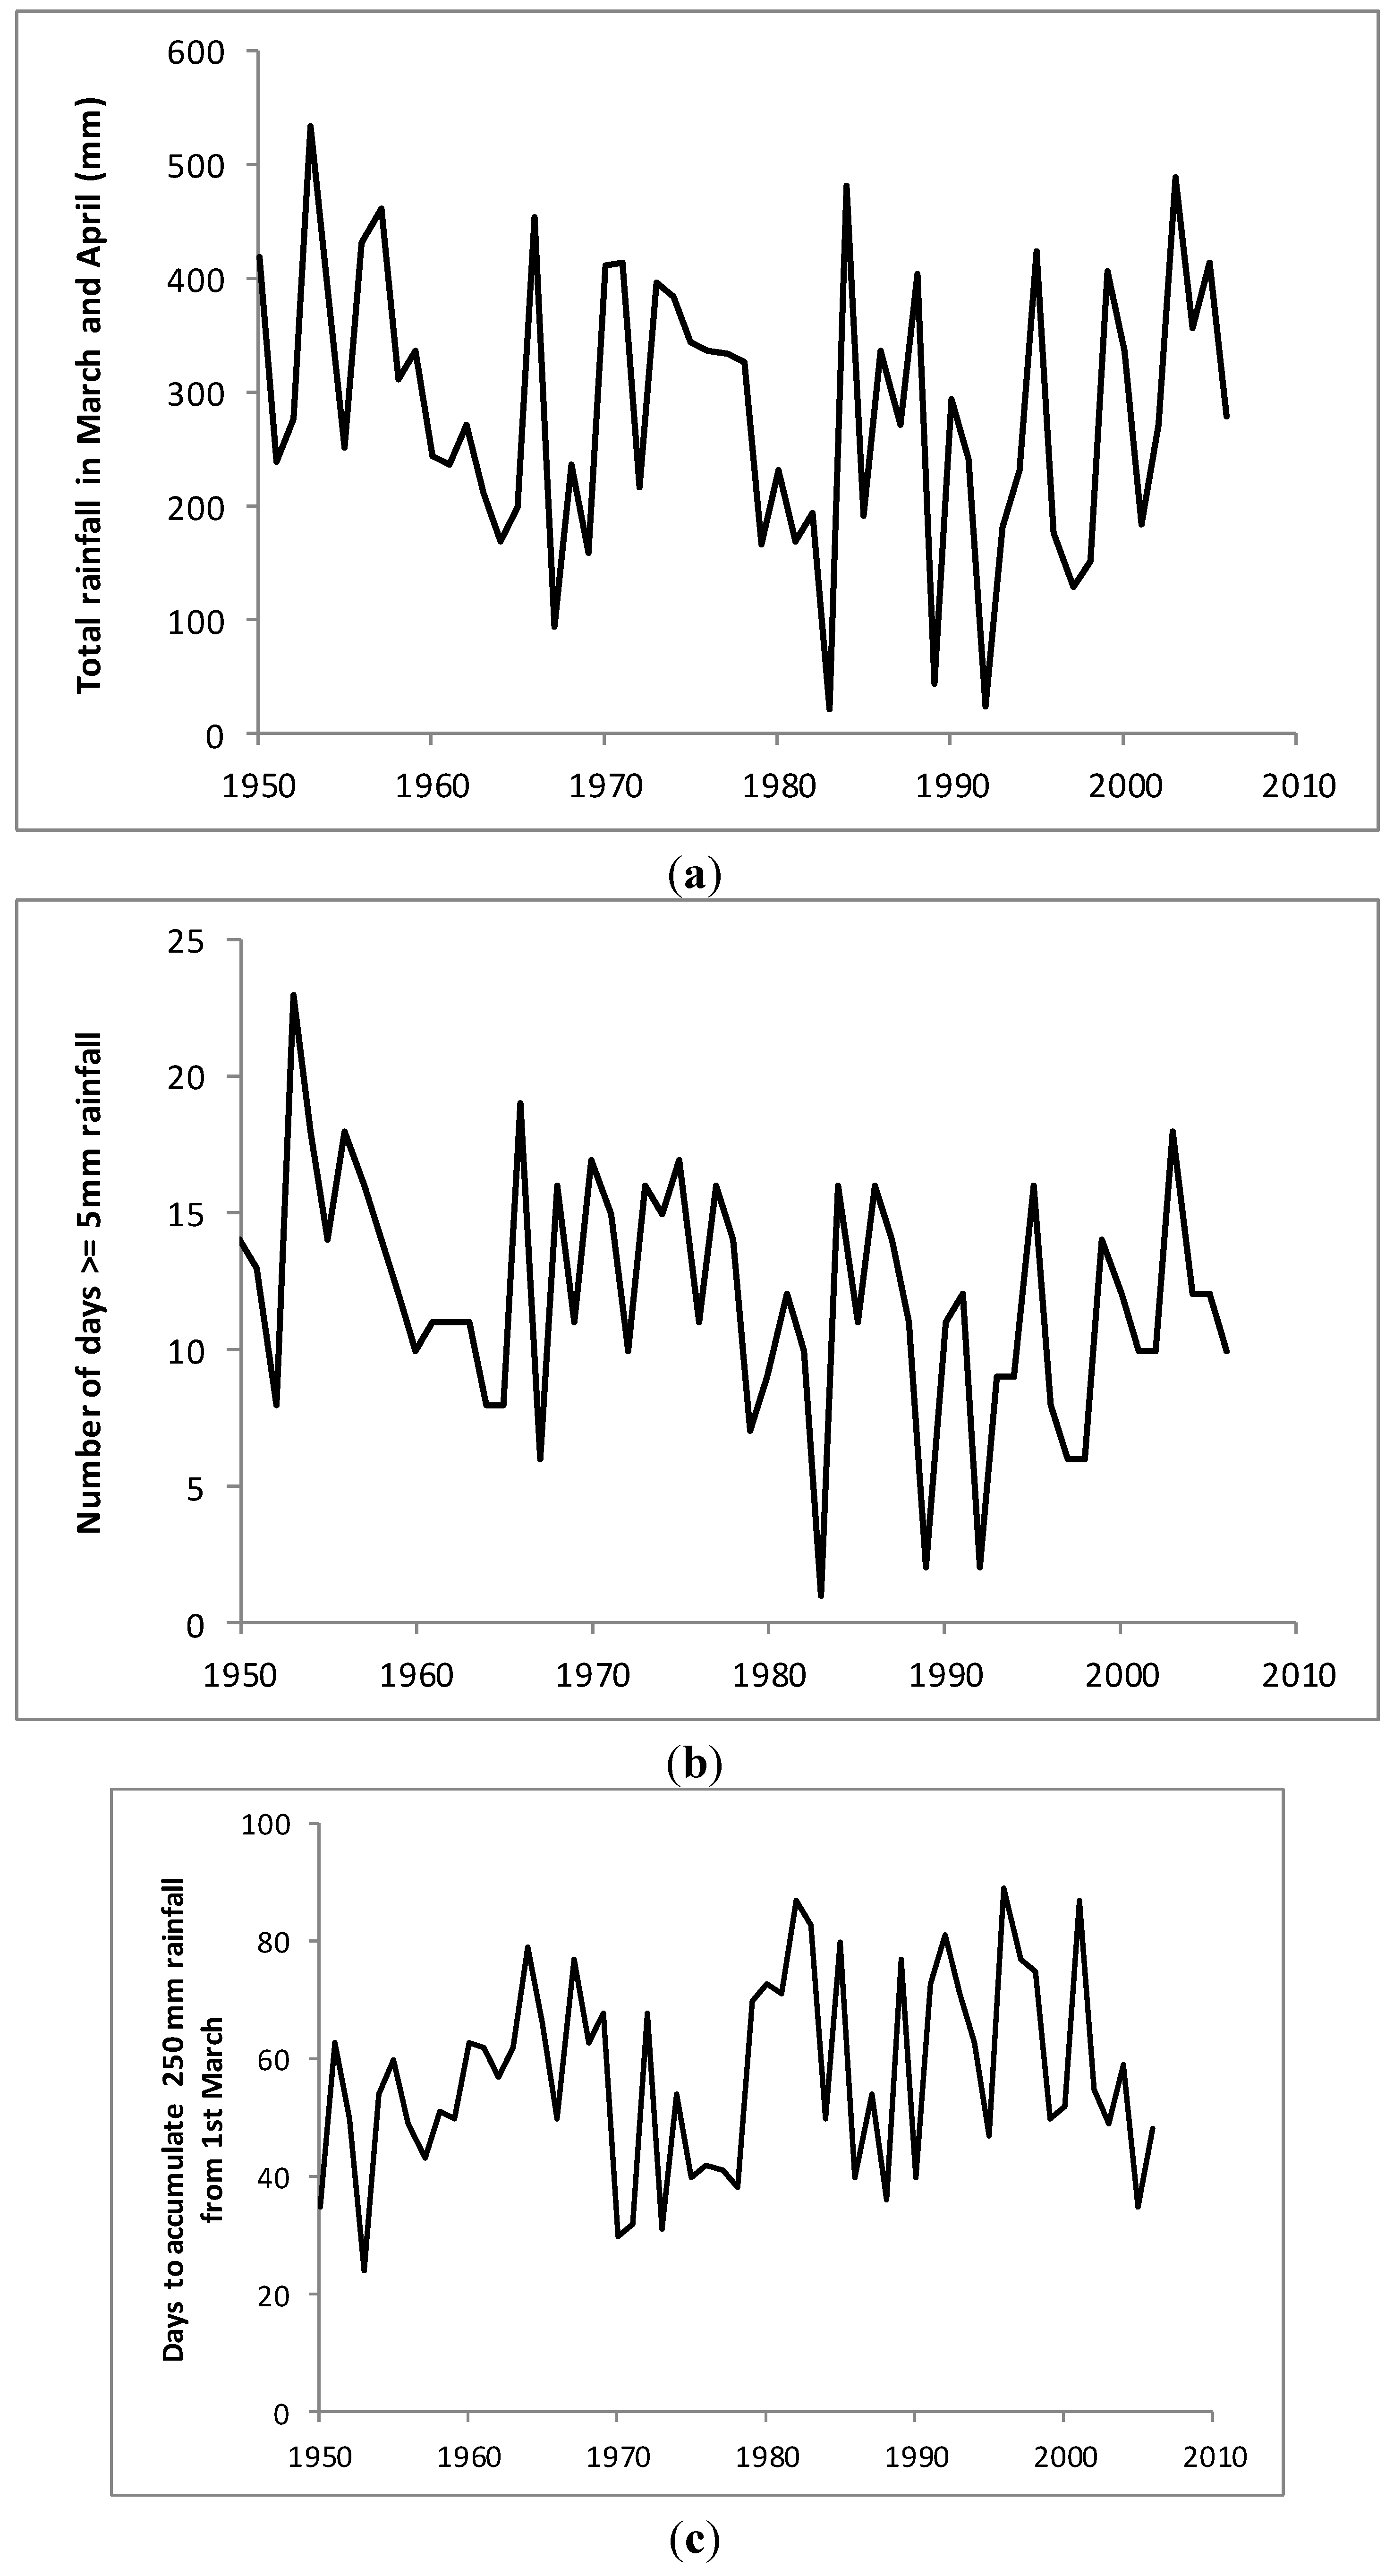
Figure 4 show that there has been a tendency for rainfall totals to decline over time.
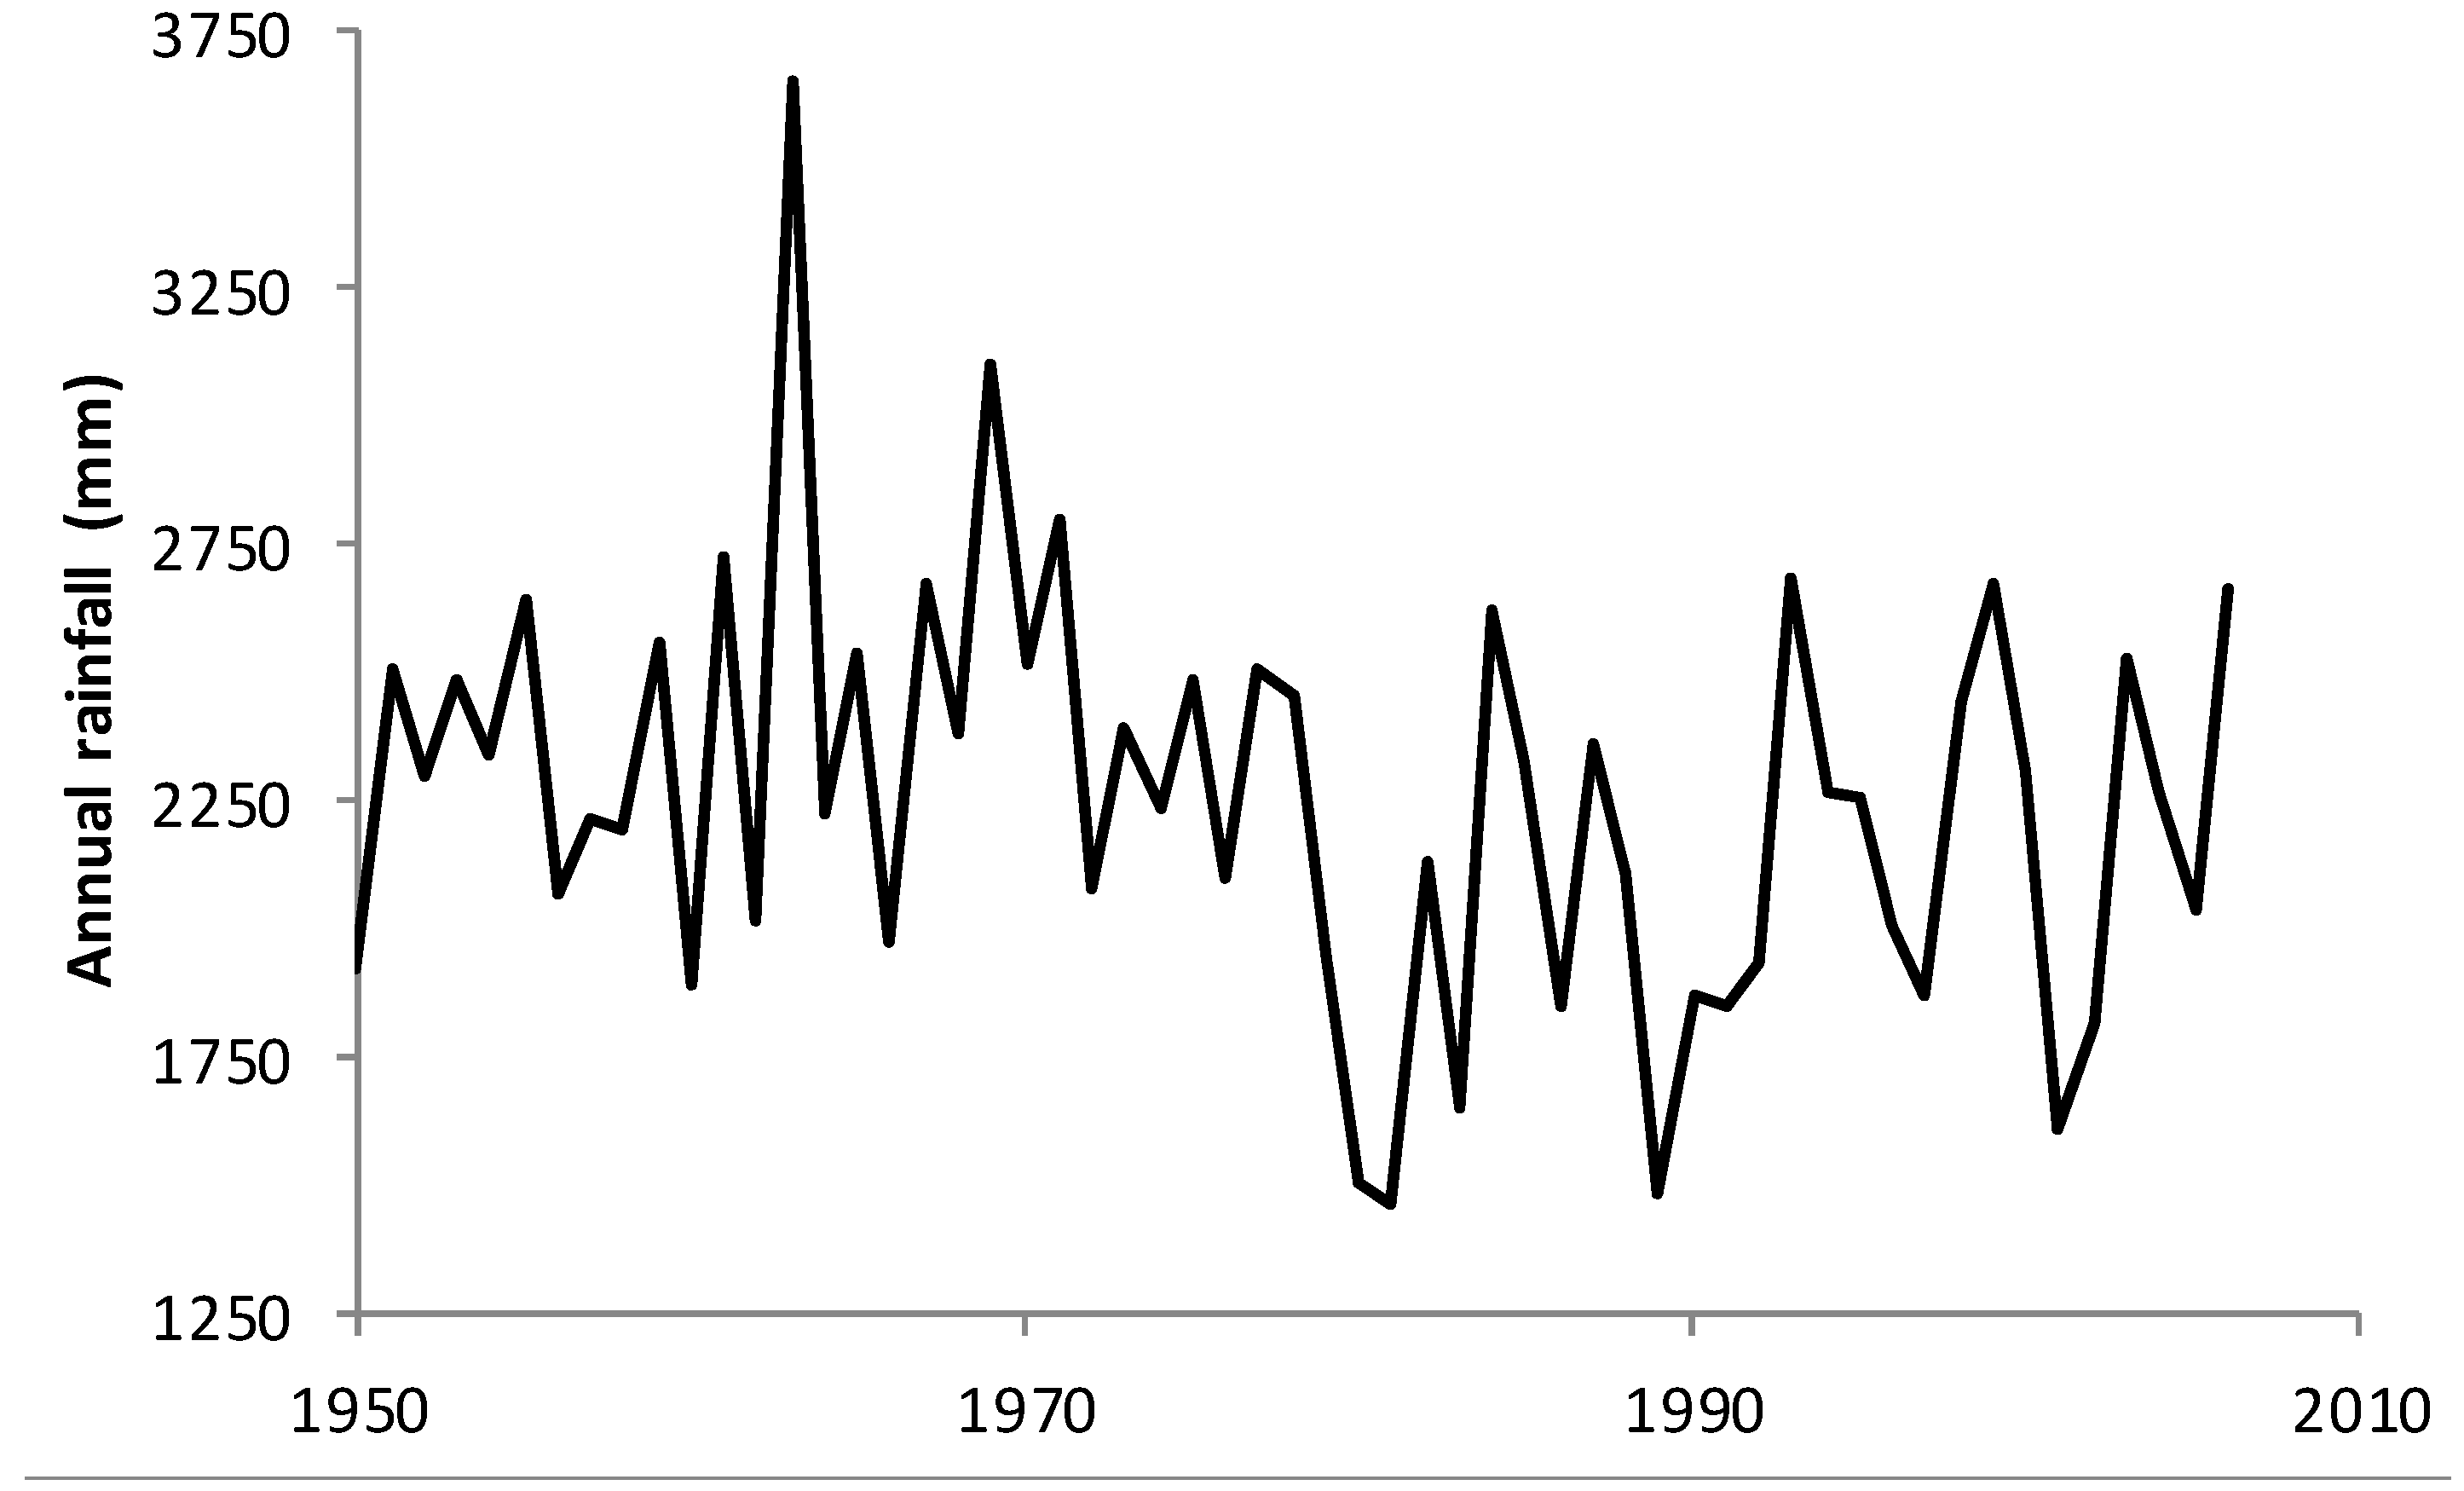
Figure 5 shows that occasionally the M+A rainfall total can be very low indeed; such years tend to coincide with strong El Niño conditions, but not exclusively so and further work is needed to understand variations in atmospheric circulation in M+A that can lead to drought at the start of the Yala cultivation season. For India, authors in [29] noted that, whilst severe droughts are always associated with El Niño events, not every El Niño produces a severe drought. They showed that El Niño events with the warmest SST anomalies in the central equatorial Pacific were more effective in focusing drought-producing subsidence over India than events with the warmest SSTs in the eastern equatorial Pacific. Figure 5 also shows that there has been significant variation in M+A rainfall at the decadal time scale; droughts were more likely in the drier 1980s and early 1990s. Clearly more needs to be understood about the onset of the SWM, over Sri Lanka and more generally its progression across the Indian subcontinent [4,32].
Authors in [16] used a Maha rainfall index (a blend of different station records from 1869 to 2000) to compare with IOD and NINO3. Their results showed the significant role of IOD in modulating 
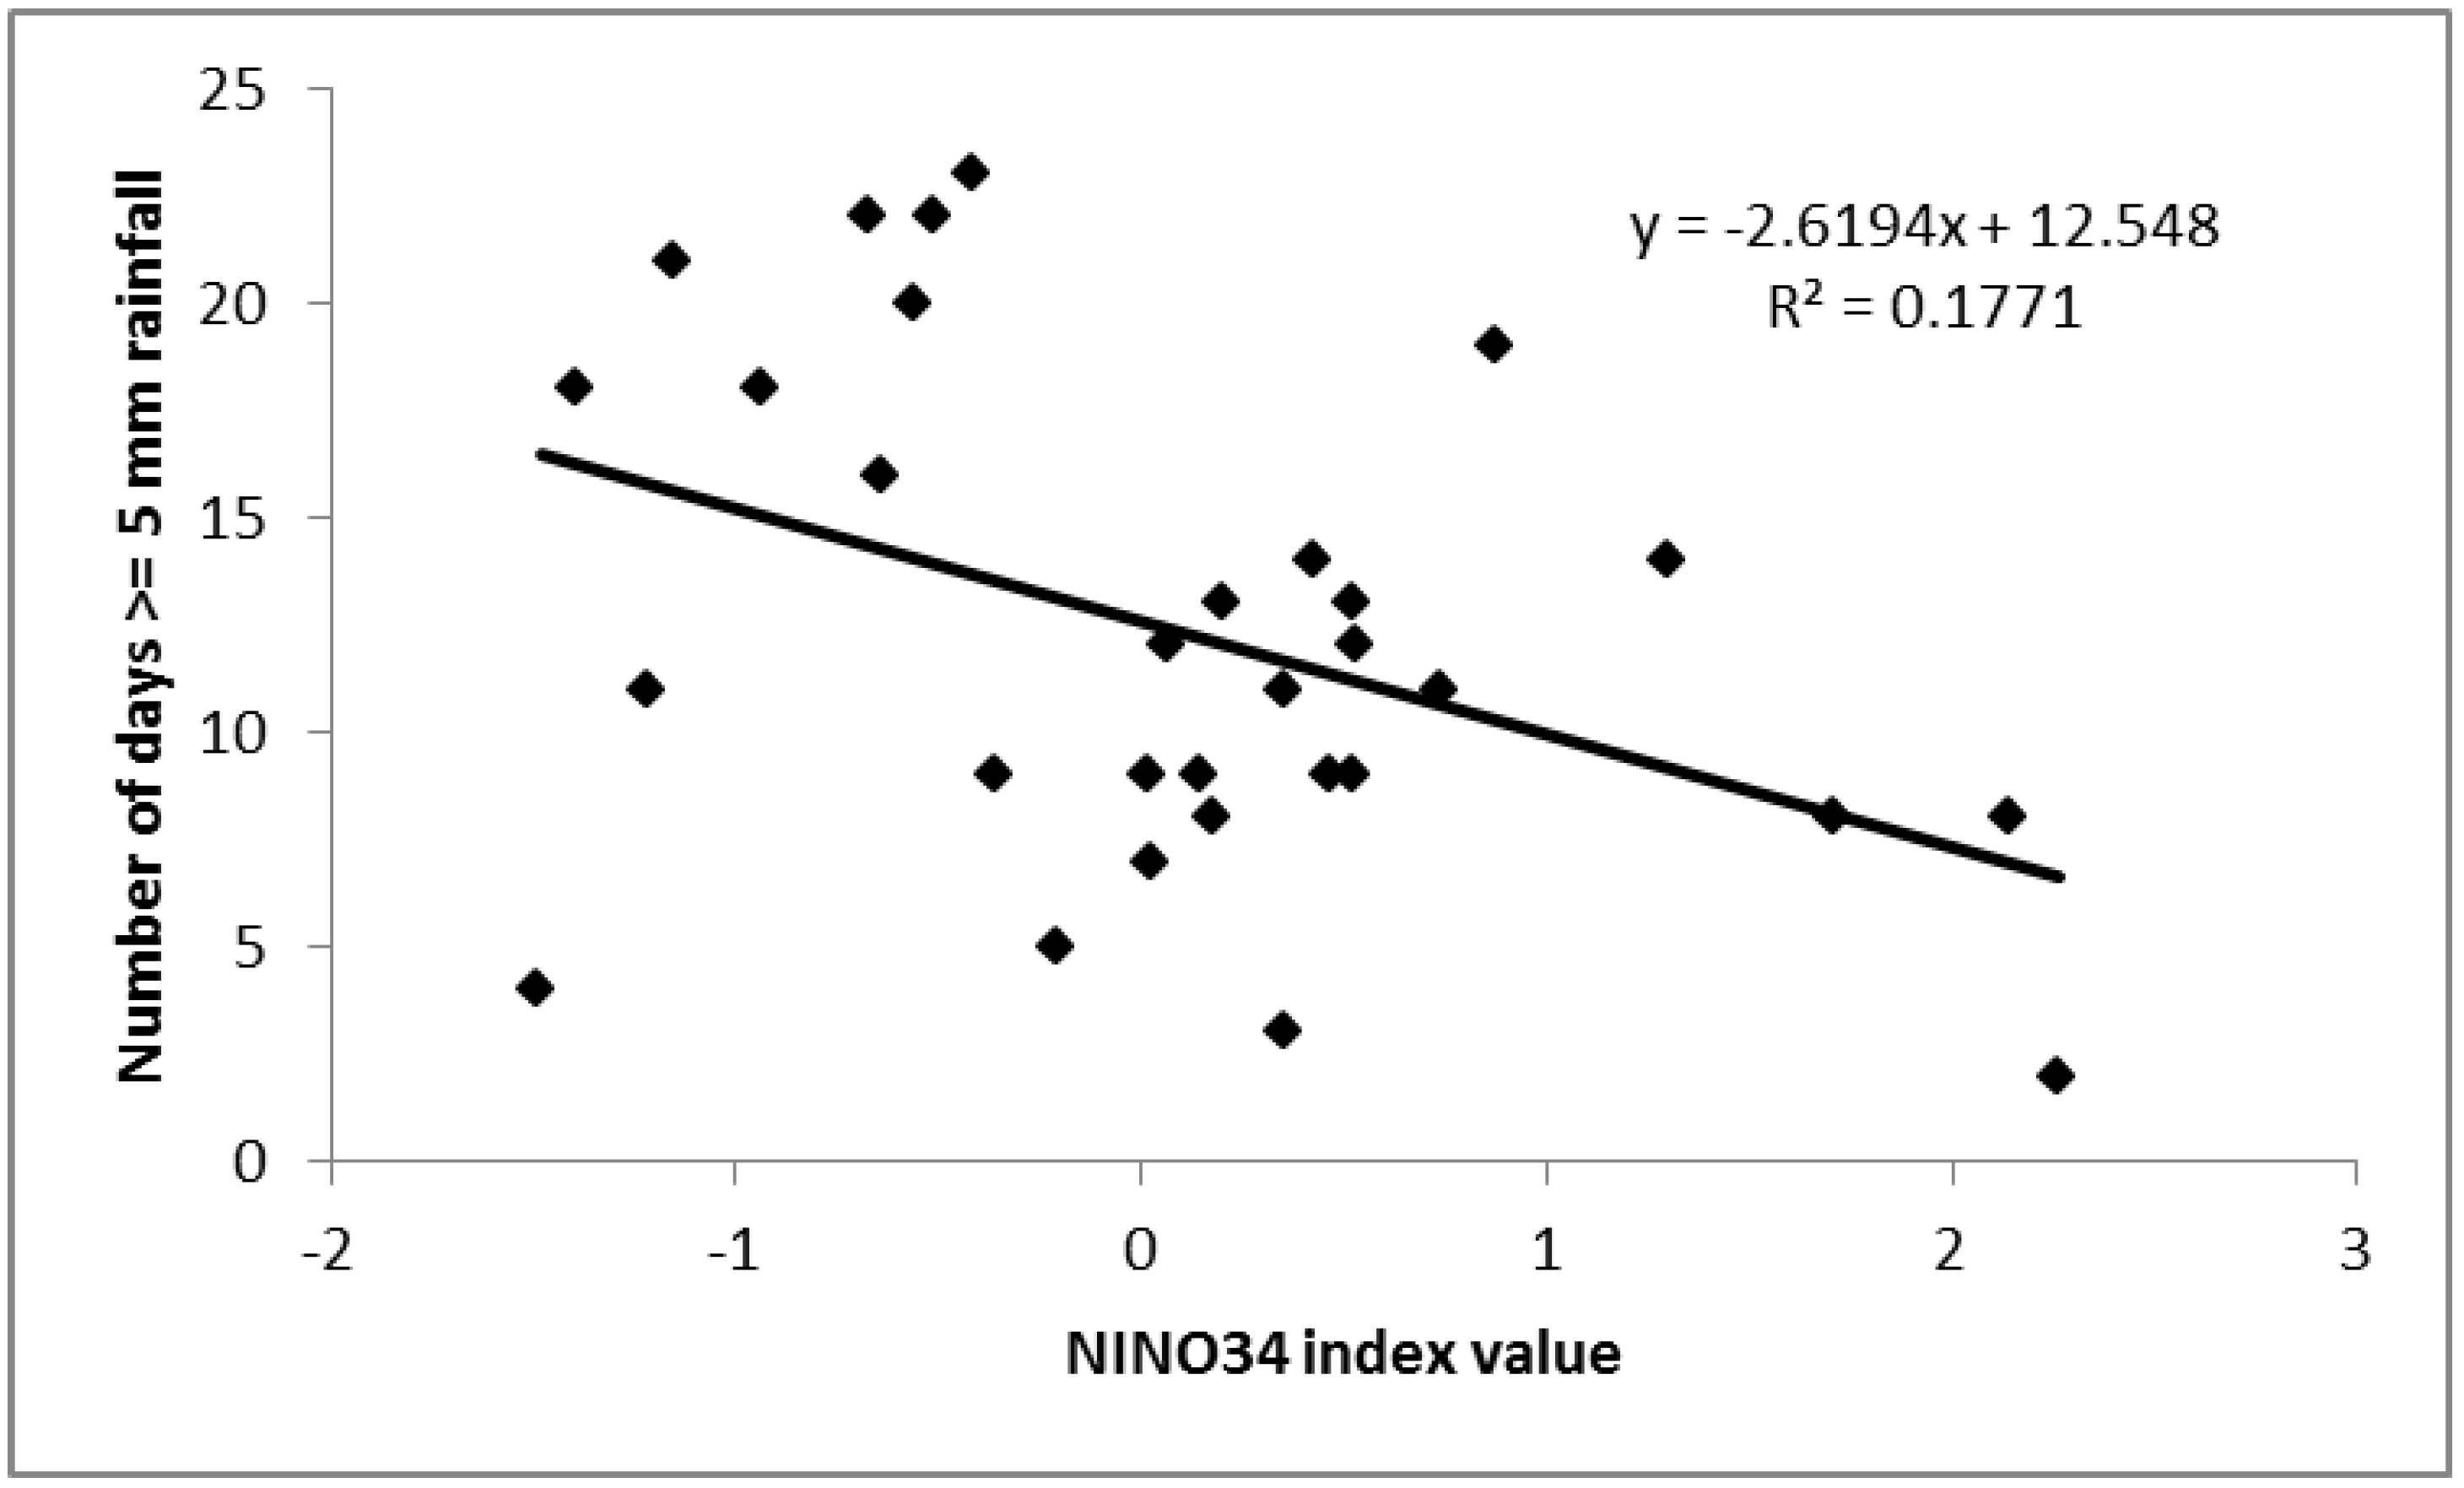
Maha rainfall after removing the NINO3 contribution using partial correlation analysis. For our shorter records from individual stations (from 1976), all the OND correlations are stronger with NINO34 than with IOD. As noted previously, the biennial oscillation associated with the IOD is less apparent in recent years at Mapalana (Figure 4) whilst NINO34 is significantly correlated with numbers of days with ≥5 mm rainfall total in JFM (Figure 6). Our results seem to complement those of [33] who found modest intensification of the NEM-ENSO relationship since 1980 (in contrast to a weakening of the Indian SWM) which is consistent with the warming of surface temperatures over the Tropical Indian Ocean in recent decades. This is deserving of further attention, to assess the relative importance of climatic drivers on the various seasons of Sri Lanka rainfall under current, warm SST conditions.

4.2. Physical Mechanisms of ENSO Teleconnections

Results show that there are strong teleconnections for Sri Lankan rainfall with SSTs in the Pacific Ocean and, given the relative lack of significant correlations with IOD, these are apparently more important than SSTs in the Indian Ocean. Modulation of Sri Lanka’s climate during El Niño events is related to changes in the Walker circulation, resulting in heightened convection over Sri Lanka in OND and enhanced subsidence during the rest of the year [34]. During an El Niño event, the convection associated with the rising limb of the Walker circulation, normally located in the Western Pacific, shifts eastwards; there are anomalously warm waters in the Central and Eastern Pacific. Consequently, to the west of the rising limb, there is an anomalous subsidence at low atmospheric levels extending from the Western Pacific to South Asia. This leads to reduction of rainfall over Sri Lanka from January to September. However, in OND the influence of ENSO reverses with anomalous convection extending from Eastern Africa across to Sri Lanka [9].
We have not investigated links with SSTs in the Bay of Bengal but judging by results in [27], there is an opposite response during El Niño years in the north and south of the Bay, due no doubt to the location of the ITCZ [8]. Authors in [27] note that there is a higher frequency of monsoonal depressions over the northern and adjoining central Bay of Bengal during July and August of El Niño years; this implies higher rainfall in those regions. Authors in [
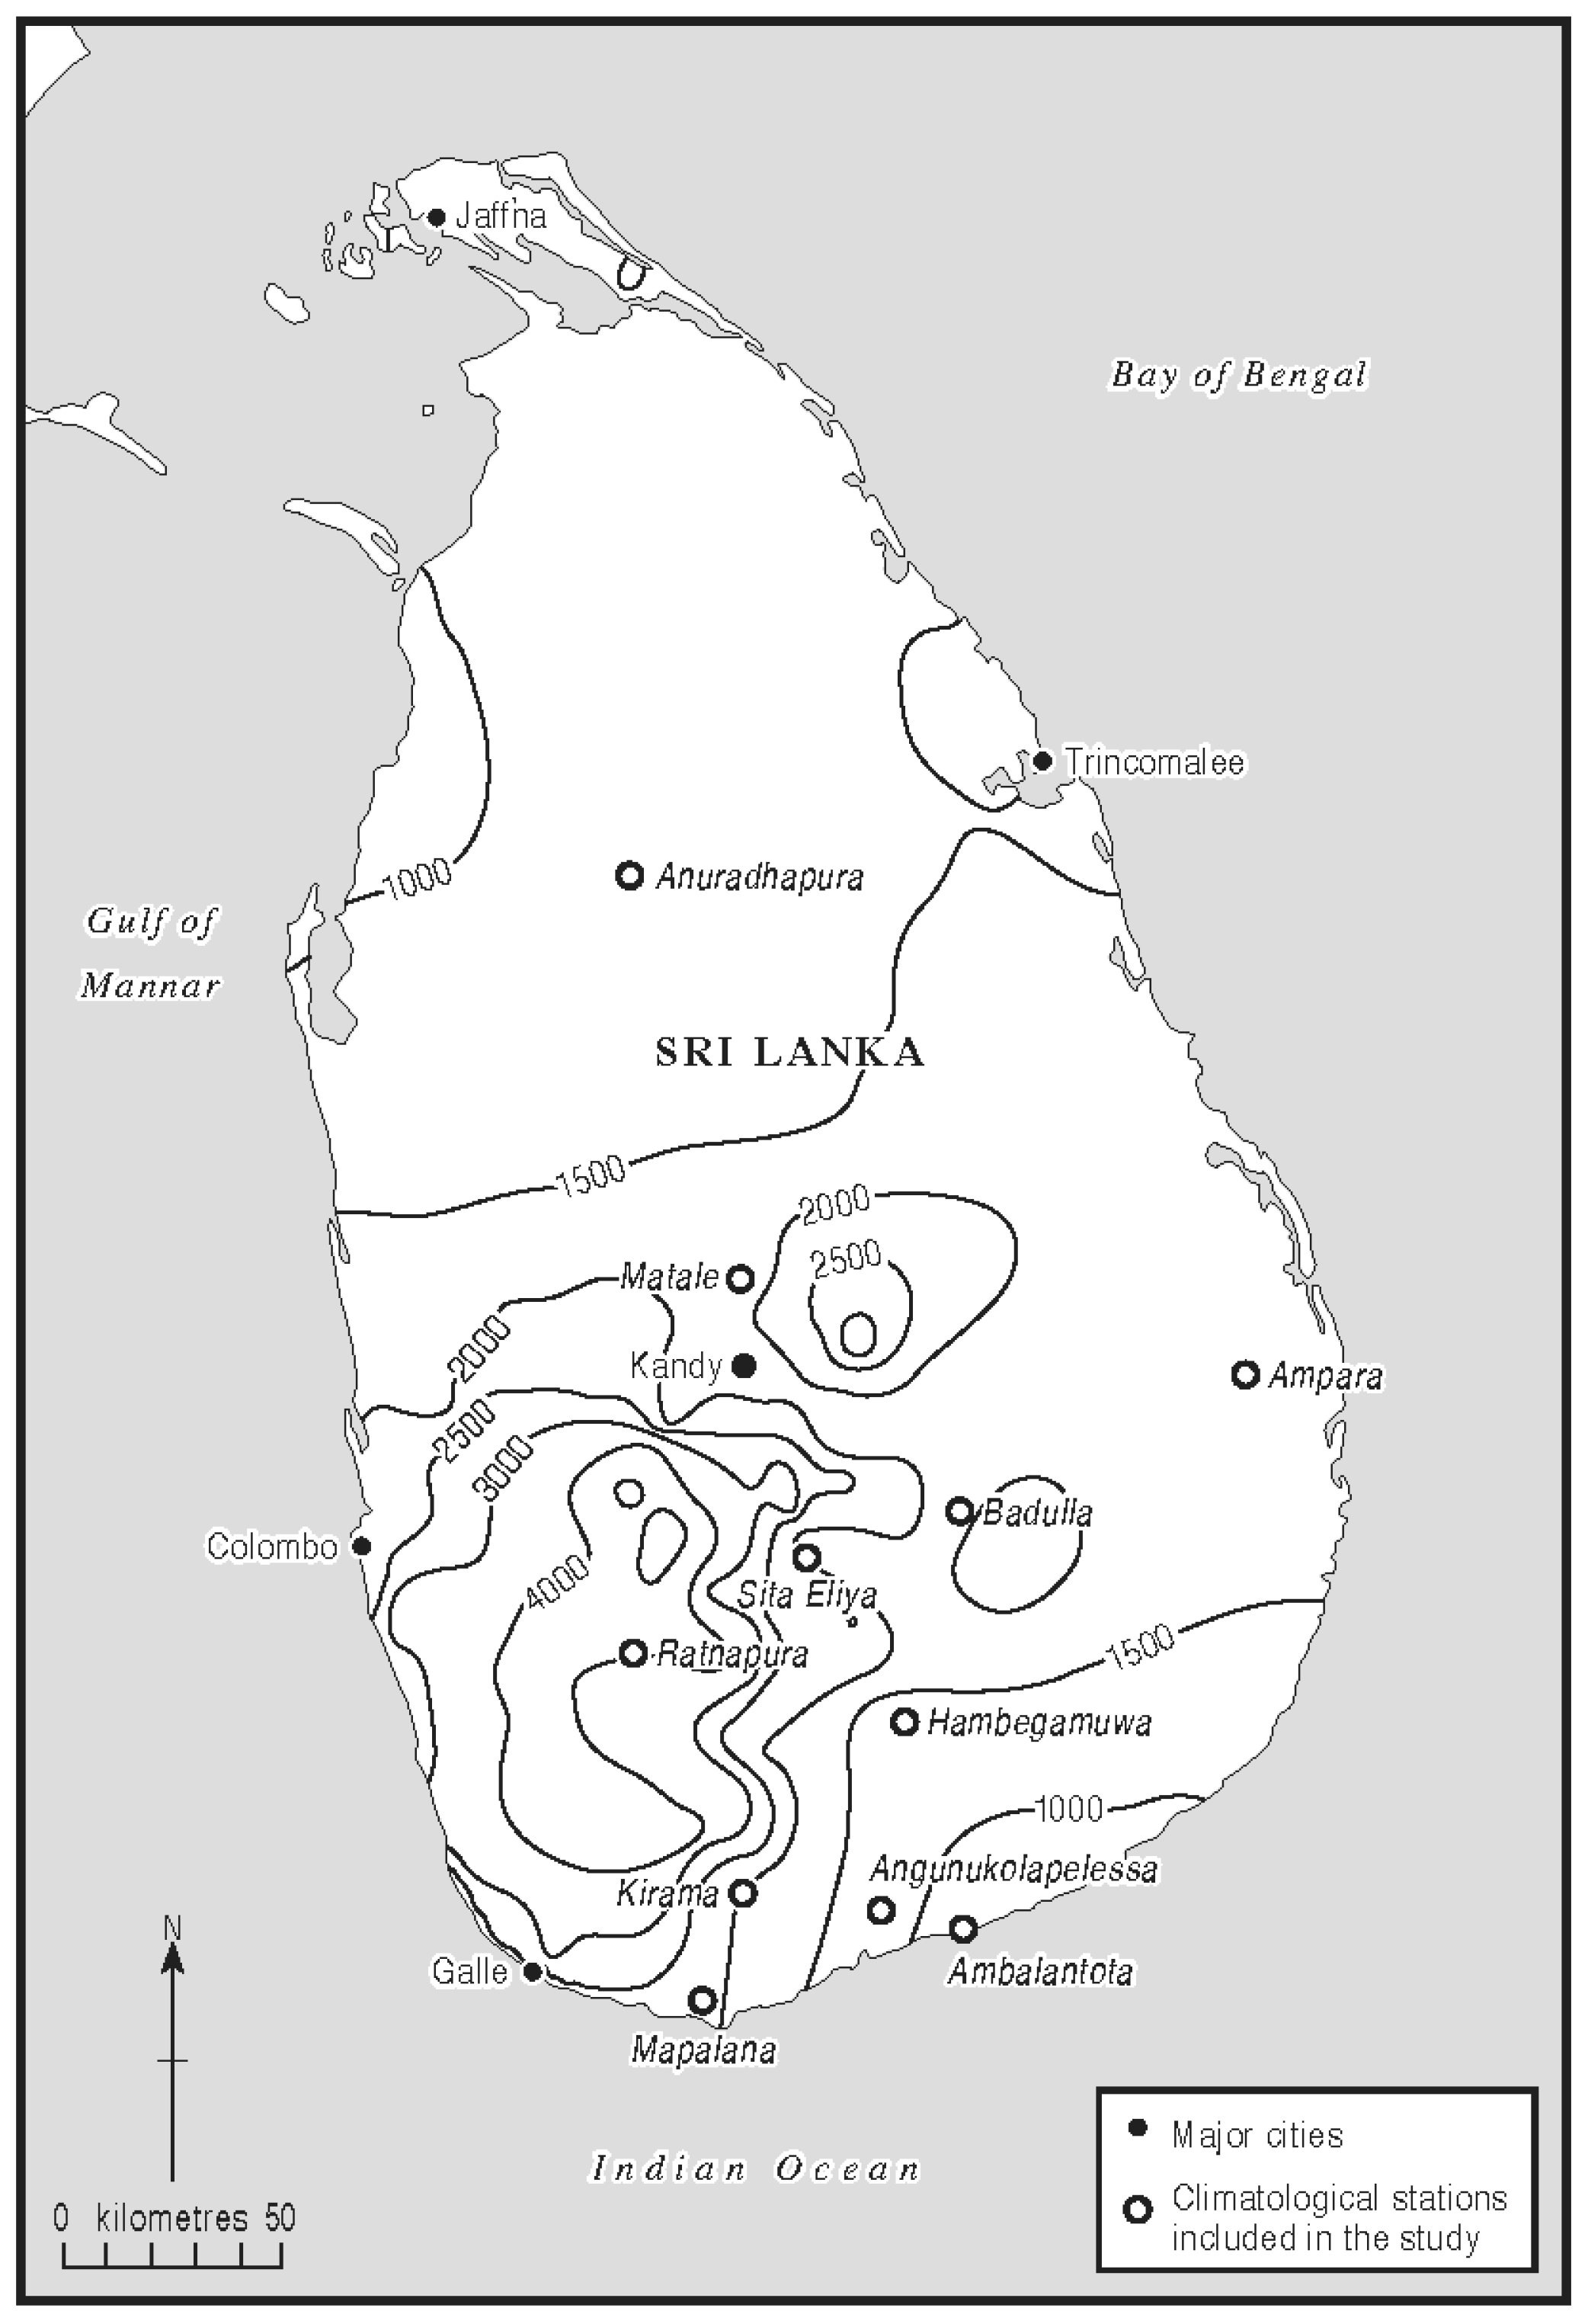
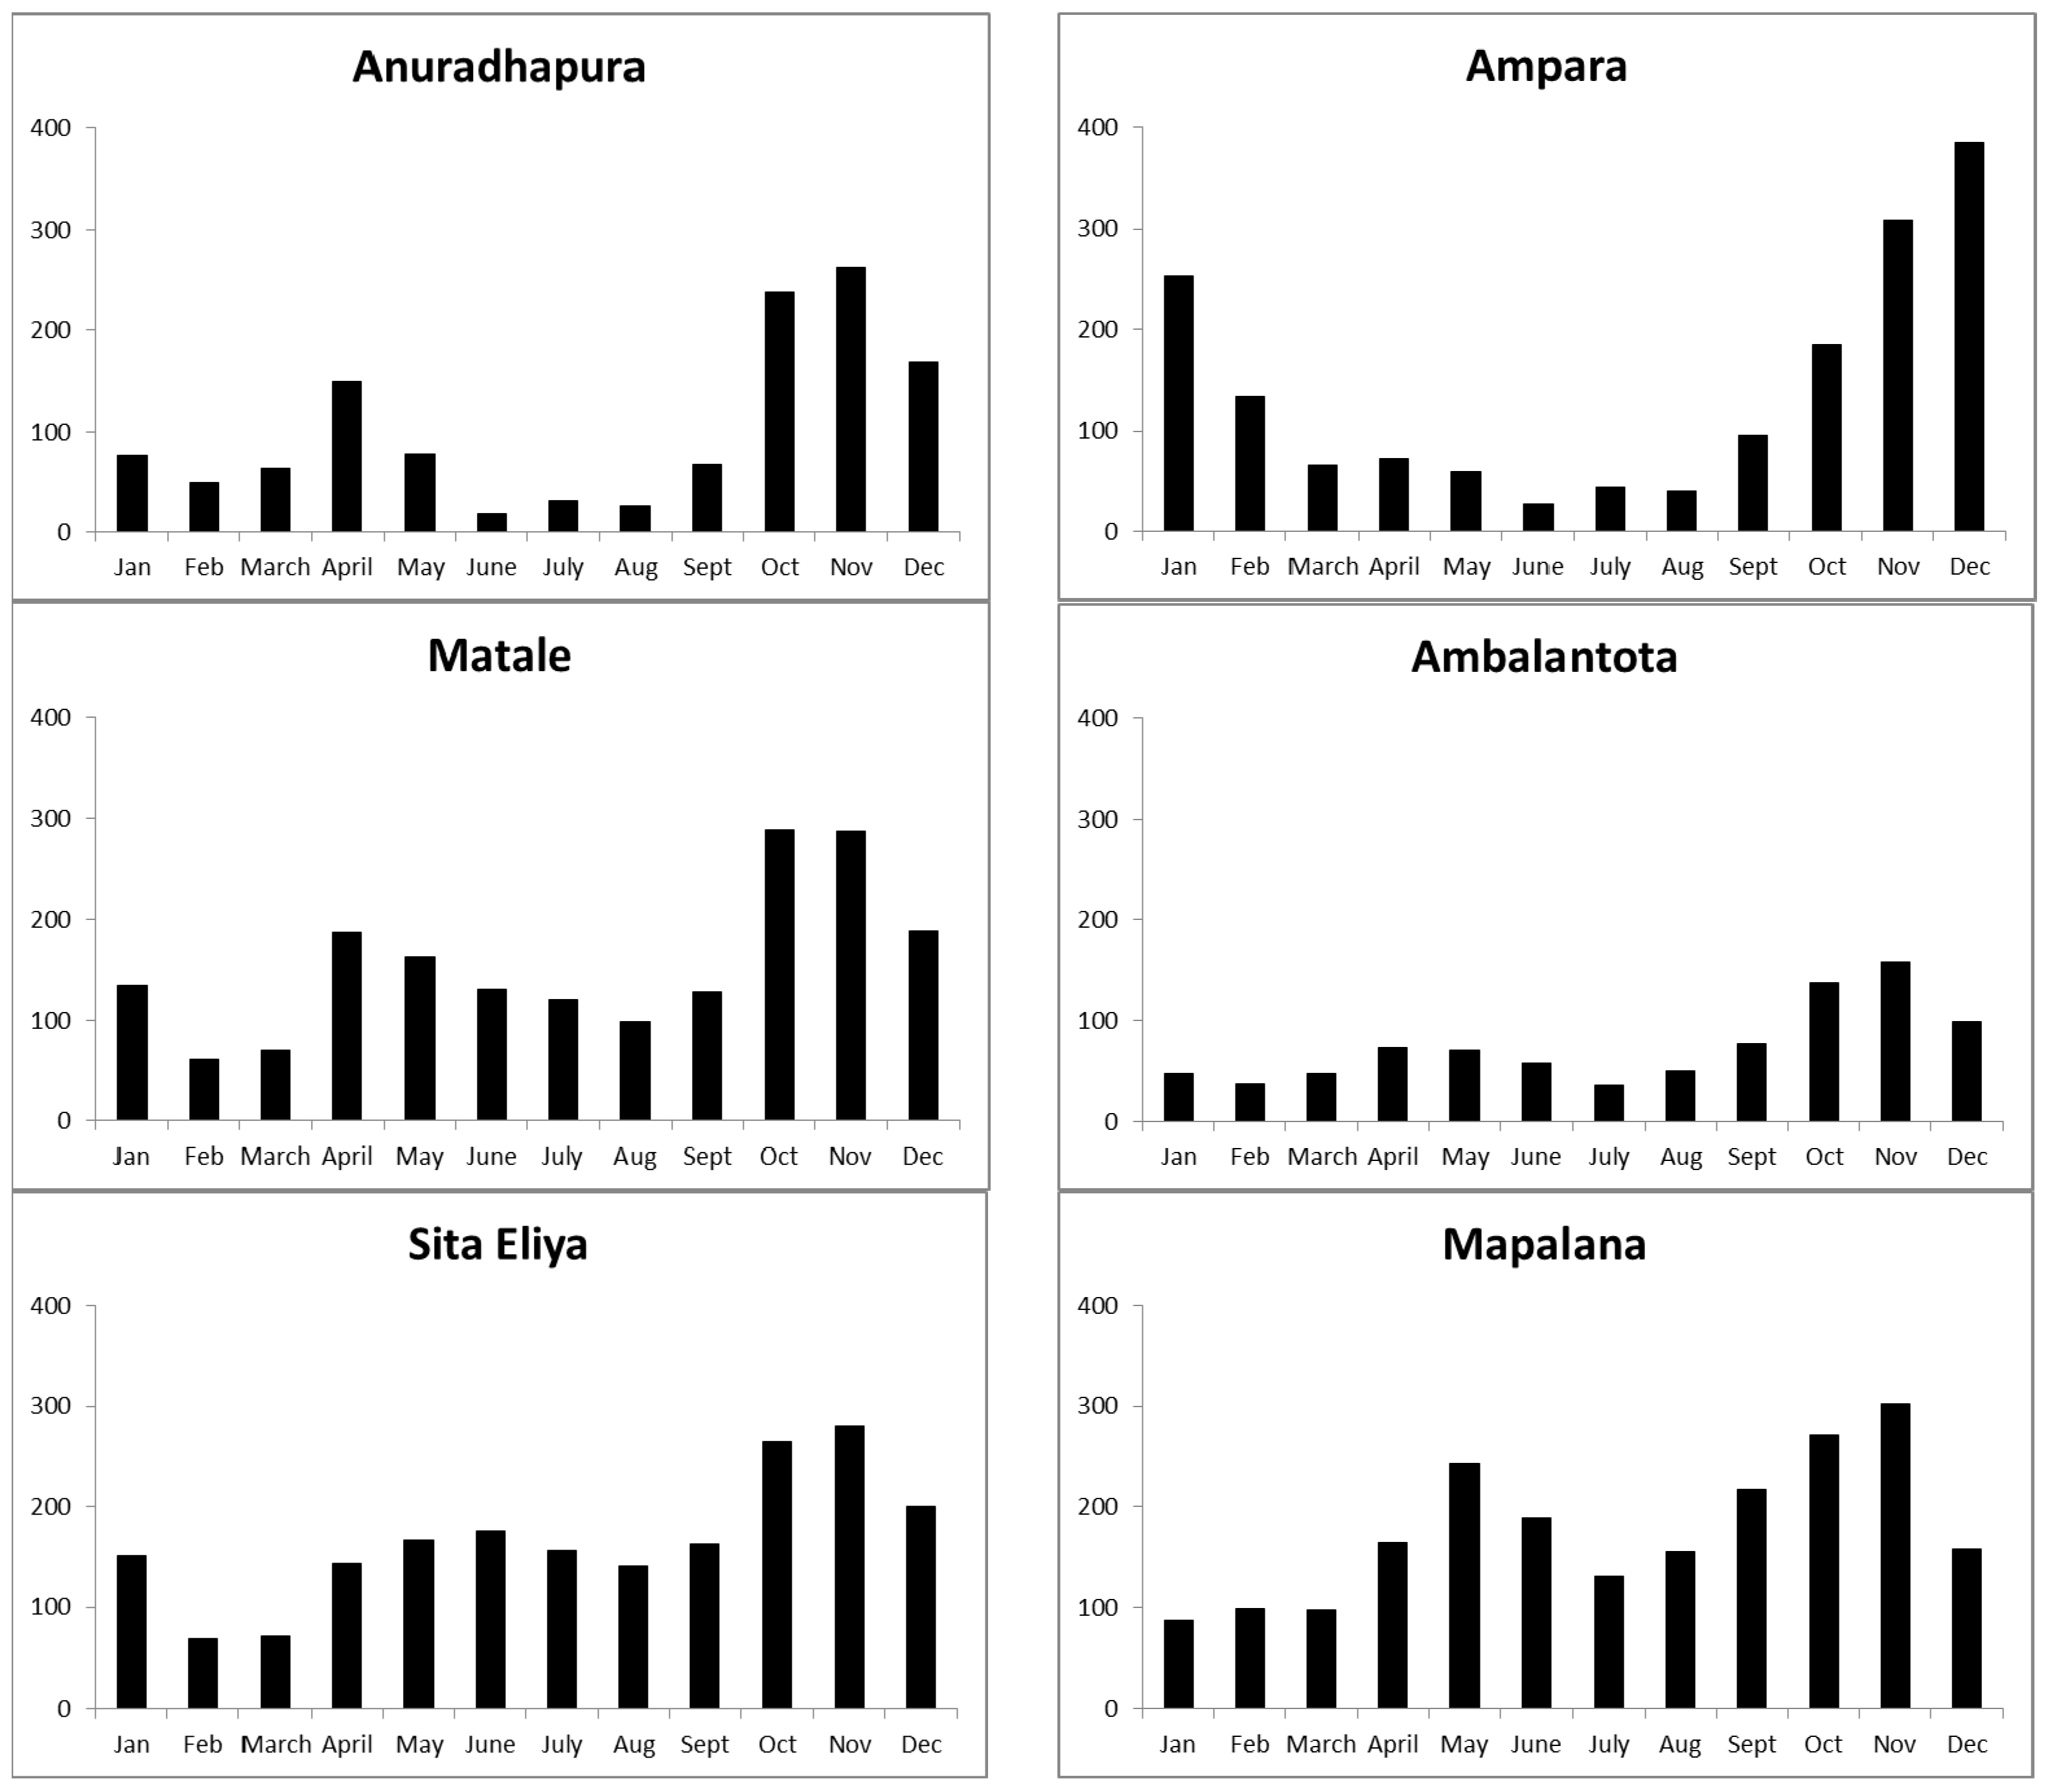
35] found a significant positive correlation for Bay of Bengal SSTs and All-Bangladesh Monsoon Rainfall for the month of June but not in other summer months. Results for JAS from Sri Lanka, further south, show negative correlations with NINO34, meaning lower rainfall in the El Niño phase. For Sri Lanka, positive correlations with Pacific SSTs occur only in OND when the ITCZ has moved south and the NEM strongly influences all stations except those in the dry southeastern corner of the island. The importance of NEM precipitation is emphasized in Figure 3, especially for more northern locations like Anuradhapura and Ampara.
Other than OND, significant correlations are almost all negative (JAS, JFM, M+A) or not found at all (AMJ). The inter-seasonal switch in wind direction is thus a crucial element in the link between global-scale tropical circulation and local conditions in Sri Lanka, with the NEM, by definition, the result of a NE circulation pattern, with westerly and south-westerly circulation at other times [36]. Thus, El Niño tends to reduce rainfall in JFM, M+A (but not AMJ) and JAS; by contrast, El Niño tends to increase rainfall in OND. However, as noted above in relation to Figure 6, the reverse situation is not entirely consistent, with mostly more rainfall in JFM in La Niña phases but not in during the prolonged La Niña of 1999/2000. The monsoon circulation is fundamentally dependent on surface conditions over both land and ocean and, since sea-surface temperatures in the Indian Ocean are largely controlled by surface winds, the anomalous subsidence during El Niño phases will delay the onset of the SWM because of the relative dryness of the low-level air [4]. Figure 5c shows that, in terms of rainfall accumulation at Mapalana, the onset of the SWM has tended to become later, by roughly 10 days, since 1950 (but note the trend is not statistically significant); the mean is 57 days from 1 March (i.e., 26 April) but often this is now delayed until early May. In the worst years, sufficient rainfall may not accumulate until late May and adjustments in cropping are needed. Normally the SWM arrives in Sri Lanka about a week earlier than in southern India but the “onset” date does depend on the method used; our rainfall accumulation index gives an earlier date than either climatological [32] or hydrological [30] indices but has been chosen specifically with rice cultivation in mind. Gradual delay in the onset of the SWM and a weaker biennial oscillation in rainfall totals (Figure 4) may indicate the influence of higher SSTs in the eastern Indian Ocean but further work is needed to explore this issue and to link to what happens in relation to the ENSO. Authors in [14] show how coupling between atmospheric convection and Indian Ocean SSTs creates the biennial monsoonal oscillation, modulated by lower-frequency ENSO influence from the Pacific. SSTs are the key memory effect in driving biennial variations in cloud formation and thus precipitation.
Building on the work of [29] and others, further work is needed to improve rainfall forecasts for the onset of the Yala cultivation season, in particular to anticipate the late arrival of rains in March and April in the wet zone (Figure 5). Given the strength of some teleconnections and the fact that ENSO is predictable one or two seasons in advance, seasonal rainfall totals in Sri Lanka (and more widely over the Indian subcontinent) should be predictable with some degree of confidence. This cannot assist with forecasting of daily rainfall, of course, but should at least provide some idea of likely timing and amount of rainfall to be expected in the next wet season. We have not attempted, here, to analyze the synoptic situations associated with individual rainfall events. However, we can see that such an analysis could be very valuable in relating large-scale climatological situation to meso-scale precipitation generation. Authors in [27], working in the Bay of Bengal, showed how such an analysis might proceed.
It seems particularly important to understand ocean-atmosphere conditions at the regional scale associated with both modulation of the NEM by ENSO and the IOD and under which the arrival of SWM rain in March and April is significantly delayed. A good deal of research has been conducted at the scale of the Indian subcontinent, some of it reviewed here, and it is vital to place Sri Lanka in its regional context. For example, in relation to the NEM, authors in [10] found similar results in Tamil Nadu, Southeast India, to those presented here in terms of ENSO controls on rainfall totals. With regard to the SWM, the findings of [32] show that being able to place Sri Lanka in its wider regional context could be very worthwhile since this could aid forecasting of the onset of the monsoonal circulation and associated precipitation further north in the Indian subcontinent and hopefully enable monsoon failures to be better anticipated. Finally, it is worthwhile noting that rainfall is important for water resources other than irrigation—drinking water and HEP generation, in particular—so more studies which relate ENSO to river regimes are needed too, for both Sri Lanka (cf. [11]) and across South and Southeast Asia more generally [30].

5. Conclusions

(1)
Rainfall indices tend to be much better correlated with climatic drivers during the two monsoon season than in the inter-monsoon periods, particularly at the stations with higher seasonal totals.
(2)
Indices derived from the Pacific Ocean (NINO34SOI) are better correlated with rainfall indices than the Indian Ocean Dipole index.
(3)
Correlations are most numerous for days with 5 mm or more rainfall, compared to total seasonal rainfall, number of rain days or number of days with very large totals.
(4)
There have been significant inter-decadal variations for rainfall at Mapalana, with notable reductions in total rainfall and the number of days with ≥5 mm totals in March and April between 1950 and 1980. Infrequently, very little rainfall has accumulated by the end of April.
These findings are of particular relevance to the farming community in Sri Lanka: reliability of rainfall continues to be of great importance to a large fraction of the population and a lack of rainfall at the start of either monsoon season can threaten crop yields and force farmers to change their cropping practices. This might be thought to be especially important in the dry regions of Sri Lanka, but it is no less crucial in the wet zone where failure of the SWM can have severe effects. It remains important to assess the risk of drought for both cultivation seasons and to understand how risk varies spatially in relation to the different ENSO phases.

Author Contributions

K. D. N. Weerasinghe obtained the data and suggested the research topic; both authors contributed to the data analysis; T. P. Burt produced the first draft of the paper which was then edited by K. D. N. Weerasinghe; both authors have responded to referees’ comments.

Conflicts of Interest

The authors declare no conflict of interest.

References

  1. Suppiah, R. Four types of relationships between rainfall and paddy production in Sri Lanka. GeoJournal 1985, 10, 109–118. [Google Scholar]
  2. Zubair, L. El Niño-Southern Oscillation influences on rice production in Sri Lanka. Int. J. Climatol. 2002, 22, 249–260. [Google Scholar]
  3. Farmer, B.H. Green Revolution? Technology and Change in Rice-Growing Areas of Tamil Nadu and Sri Lanka; Farmer, B.H., Ed.; MacMillan: London, UK, 1977. [Google Scholar]
  4. Clift, P.D.; Plumb, R.A. The Asian Monsoon: Causes, History and Effects; Cambridge University Press: Cambridge, UK, 2008. [Google Scholar]
  5. Yoshino, M.M.; Suppiah, R. Rainfall and paddy production in Sri Lanka. J. Agric. Met. 1984, 40, 9–20. [Google Scholar] [CrossRef]
  6. Rasmussen, E.M.; Carpenter, T.H. The relationship between eastern equatorial Pacific sea surface temperature and rainfall over India and Sri Lanka. Mon. Weather Rev. 1982, 110, 354–384. [Google Scholar] [CrossRef]
  7. Ropelewski, C.F.; Halpert, M.S. Global and regional scale precipitation patterns associated with the El Niño/Southern Oscillation (ENSO). Mon. Weather Rev. 1987, 115, 1606–1626. [Google Scholar] [CrossRef]
  8. Suppiah, R. Spatial and temporal variations in the relationships between the Southern Oscillation phenomenon and the rainfall of Sri Lanka. Int. J. Climatol. 1996, 16, 1391–1407. [Google Scholar] [CrossRef]
  9. Zubair, L.; Siriwardhana, M.; Chandimala, J.; Yahiya, Z. Predictability of Sri Lankan rainfall based on ENSO. Int. J. Climatol. 2008, 28, 91–101. [Google Scholar]
  10. Geethalakshmi, V.; Yatagai, A.; Palanisamy, K.; Umetsu, C. Impact of ENSO and the Indian Ocean Dipole on the north-east monsoon rainfall of Tamil Nadu State in India. Hydrol. Proc. 2009, 23, 633–647. [Google Scholar] [CrossRef]
  11. Chandimala, J.; Zubair, L. Predictability of stream flow and rainfall based on ENSO for water resources management in Sri Lanka. J. Hydrol. 2007, 335, 303–312. [Google Scholar] [CrossRef]
  12. Kumar, P.P.; Rajagopalan, B.; Cane, M.A. On the weakening relationship between the Indian Monsoon and ENSO. Science 1999, 284, 2156–2159. [Google Scholar] [CrossRef]
  13. Zubair, L.; Columbia University, New York, NY, USA. Personal communication, 2010.
  14. Meehl, G.A. The south Asian monsoon and the tropospheric biennial oscillation. J. Clim. 1997, 10, 1921–1943. [Google Scholar] [CrossRef]
  15. Saji, N.H.; Goswami, B.N.; Vinayachandran, P.N.; Yamagata, T. A dipole mode in the tropical Indian Ocean. Nature 1999, 401, 360–363. [Google Scholar]
  16. Zubair, L.; Suryachandra, A.R.; Yamagata, T. Modulation of Sri Lankan Maha rainfall by the Indian Ocean Dipole. Geophys. Res. Lett. 2003. [Google Scholar] [CrossRef]
  17. Burt, T.P.; Ferranti, E.J.S. Changing patterns of heavy rainfall in upland areas: a case study from northern England. Int. J. Climatol. 2012, 32, 518–532. [Google Scholar] [CrossRef]
  18. Osborn, T.J.; Hulme, M.; Jones, P.D.; Basnett, T.A. Observed trends in the daily intensity of United Kingdom precipitation. Int. J. Climatol. 2000, 20, 347–364. [Google Scholar] [CrossRef]
  19. Suppiah, R. Extremes of the Southern Oscillation phenomenon and Sri Lankan rainfall. Int. J. Climatol. 1997, 17, 87–101. [Google Scholar] [CrossRef]
  20. Morris, R.A.; Zandrasta, H.G. Land and climate in relation to cropping patterns: rain-fed lowland rice. In Selected Papers from the 1978 Conference; International Rice Research Institute: Los Baños, Philippines, 1979; pp. 255–274. [Google Scholar]
  21. Weerasinghe, K.D.N.; Sabatier, J.L.; Luc, G. Manual for First, A Computer Program for Agro-Climatological Data Analysis; IRAT/CIRAD: Montpellier, France, 1998. [Google Scholar]
  22. Kaplan, A.; Cane, M.A.; Kushnir, Y.; Clemet, A.C.; Blumenthal, M.B.; Rajagoplana, B. Analyses of global sea surface temperature 1856–1991. J. Geophys. Res. 1998, 103, 18567–18589. [Google Scholar] [CrossRef]
  23. IRI/LDEO Climate Data Library. International Research Institute for Climate and Society; Columbia University: New York, NY, USA.
  24. Ropelewski, C.F.; Jones, P.D. An extension of the Tahiti-Darwin Southern Oscillation Index. Mon. Weather Rev. 1987, 115, 2161–2165. [Google Scholar] [CrossRef]
  25. Japan Agency for Marine-Earth Science and Technology (JAMSTEC). Available online: http://www.jamstec.go.jp/frsgc/research/d1/iod/ (accessed on 30 August 2014).
  26. Arkin, H.A.; Colton, R.R. Tables for Statisticians, 2nd ed.; Barnes and Noble: New York, NY, USA, 1963. [Google Scholar]
  27. Singh, O.P.; Khan, T.M.A.; Rahman, M.S. Probable reasons for enhanced cyclogenesis in the Bay of Bengal during July–August of ENSO years. Glob. Planet. Chang. 2001, 29, 135–147. [Google Scholar] [CrossRef]
  28. Meehl, G.A. Coupled ocean-atmosphere-land processes and South Asian monsoon variability. Science 1994, 265, 263–267. [Google Scholar] [CrossRef]
  29. Kumar, K.K.; Rajagopalan, B.; Hoerling, M.; Bates, G.; Cane, M. Unraveling the mystery of Indian Monsoon Failure during El Niño. Science 2006, 314, 115–119. [Google Scholar] [CrossRef]
  30. Fasullo, J.; Webster, P.J. A hydrological definition of the Indian summer monsoon onset and withdrawal. J. Clim. 2003, 16, 3200–3211. [Google Scholar] [CrossRef]
  31. Suppiah, R. Relationships between Indian Ocean sea surface temperature and the rainfall of Sri Lanka. J. Meteorol. Soc. Jpn. 1988, 66, 103–112. [Google Scholar]
  32. Webster, P.J.; Magana, V.O.; Palmer, T.N. Monsoons: Processes, predictability, and the prospects for prediction, in the TOGA decade. J. Geophys. Res. 1998, 103, 14451–14510. [Google Scholar] [CrossRef]
  33. Zubair, L.; Ropelewski, C.F. The strengthening relationship between ENSO and Northeast Monsoon rainfall over Sri Lanka and Southern India. J. Clim. 2006, 19, 1567–1575. [Google Scholar] [CrossRef]
  34. Rasmussen, E.M.; Chelliah, M.; Ropelewski, C.F. The observed climate of the 20th century. In Modeling the Earth’s Climate and Its Variability; Holland, W.R., Joussaume, S., David, F., Eds.; North-Holland: Amsterdam, The Netherlands, 1999. [Google Scholar]
  35. Salahuddin, A.; Isaac, R.H.; Curtis, S.; Matsumoto, J. Teleconnections between the sea surface temperature in the Bay of Bengal and monsoon rainfall in Bangladesh. Glob. Planet. Chang. 2006, 53, 188–197. [Google Scholar] [CrossRef]
  36. Kripilani, R.H.; Kumar, P. Northeast monsoon rainfall variability over south peninsula India vis-à-vis the Indian Ocean dipole mode. Int. J. Climatol. 2004, 24, 1267–1282. [Google Scholar] [CrossRef]

